
Abstract
The primary care (PC) physician workforce has consistently been projected as requiring additional numbers to meet the needs of the U.S. The Health Resources and Service Administration (HRSA) has reported the PC nurse practitioner (NP) workforce to be 90,000 NPs more than required to meet the PC needs of the U.S. With both clinician types contributing to the PC workforce in the country, it is difficult to understand such an oversupply of NPs with continued deficit in PC physicians. The purpose of this study was to investigate results and methods used for HRSAs current PC workforce projections and compare those with the same used for Bureau of Labor Statistics (BLS) and American Association of Medical Colleges (AAMC) projections. Methods included a review of technical documents, dashboards, and published reports. Interviews with subject matter experts were also completed. Projections were found to differ significantly, as did data and assumptions. Two of the three projections modeled physicians as the sole provider of PC. An integrated model gives the most comprehensive and accurate picture of PC workforce needs. The utilization of NPs as PC providers has been demonstrated to be safe and effective, with the potential to alleviate predicted shortages, improve patient care outcomes, reduce cost, and address PC inequities. Implications include improving workforce data, creating projections that mirror clinical integration in PC, adjusting workforce preparation funding, incentivizing interprofessional collaboration in research, addressing barriers to practice among non-physician providers, and leveraging growth in the NP workforce.
Keywords
Background
By 2035, Health Resources and Service Administration (HRSA) projects the U.S. will have a deficit of over 35,000 physicians in primary care (PC) (Health Resources and Services Administration [HRSA], 2022). The Department of Health and Human Services (HHS) launched an initiative in 2021 to strengthen primary health care (McDevitt, 2022). This initiative closely follows the National Academies of Science, Engineering, and Medicine (NASEM, 2021) report on implementing high-quality PC. The goals of this initiative are to develop new models of PC centered on the whole person, with integrated care by interprofessional teams, and with community participation (NASEM, 2021). There is substantial evidence that PC nurse practitioners (NPs) practice patient-centered care, improve the performance of provider teams, and expand patient access through community-based practices (Kippenbrock et al., 2019; Ku et al., 2015; Xue et al., 2018).
PC NP numbers are increasing, while PC physician numbers are stagnant or dwindling. The overall number of PC NPs increased by 99,000 (109%) between 2010 and 2017, while PC physician numbers increased by only 80,000 (9%) during the same time frame (Auerbach et al., 2020). Patients with NPs as their primary provider roughly doubled during this time, demonstrating a shift from physician-led PC (Xue et al., 2017, 2020). During the rapid increase in NPs from 2010 to 2017, less than 1% of NPs were unemployed and salaries rose over 5% (Auerbach et al., 2020), suggesting that the rapid increase did not create an oversupply of NPs. Evaluation across multiple settings (i.e., primary, rural, inpatient, and emergent care) and patient types have shown similar or better patient satisfaction, cost-effectiveness, and clinical outcomes for NPs as compared to physicians (Aiken et al., 2021; American Association of Nurse Practitioners, 2021; Barnes et al., 2018; Cimiotti et al., 2019; Geller & Swan, 2021; Morgan et al., 2019). Traditionally, workforce projections for PC focus on PC physicians rather than expanding to include all PC providers. All current evidence on PC workforce is based on physician-only workforce projections (HRSA, 2022; IHS Markit, 2021).
The lack of a central, standardized and integrated process means that PC workforce projection and planning occur in an uncoordinated and sometimes conflicting manner via numerous federal, state, and private entities. This also leads to the omission of providers, such as NPs and physician assistants, who significantly contribute to the PC in the U.S. Three organizations that project the PC workforce are the Bureau of Labor Statistics (BLS), The American Association of Medical Colleges (AAMC), and the HRSA. All three entities report different conclusions. The most concerning is HRSA, with a projected deficit of over 35,000 PC physicians in the U.S. by 2035 while also anticipating 96,890 more NPs than needed for PC (HRSA, 2022). The purpose of this study was to investigate results and methods used for HRSA's current PC workforce projections and compare those with the same used for BLS and AAMC projections. Implications for health policy, nursing, and PC are also discussed.
Methods
Technical documents from the HRSA, BLS, and AAMC were reviewed and compared, as well as all published reports and available dashboards on projections from all three agencies. Subject matter experts and economists from the involved organizations were interviewed to validate investigator interpretations. Examination of workforce projection literature including evaluation criteria from the Organisation for Economic Co-operation and Development (OECD) (Ono et al., 2013), the World Health Organization (World Health Organization, 2010), and the Health Workforce Technical Assistance Center (HWTAC) (Wing et al., n.d.) and was accomplished to inform appraisal of the three projections. A rapid evidence assessment of NP workforce literature was also performed.
Findings
Workforce projections are developed to provide stakeholders with data-based projections to inform decision-making. Healthcare demand figures are constructed first, then the current supply of providers is determined, and finally, these two are used to project the overall need for healthcare providers. Scenarios based on current data and trends are typically used to model the workforce data. Demand scenarios might consider the effect of increased insurance coverage, better geographic distribution of providers, or increasing use of retail clinics, in addition to accounting for the influence of demographics. Supply scenarios generally consider changes in the supply of healthcare providers due to increases in school enrollments or graduations and early or delayed retirements (Wing et al., n.d.). For purposes of clarity, we will use the term “need” used by the BLS to refer to the discrepancy between supply and demand. In contrast to the BLS, AAMC uses the term “shortage,” and HRSA reports the inverse of shortage as “adequacy.” Workforce projections from BLS (U.S. Bureau of Labor Statistics, 2021), AAMC (IHS Markit, 2021), and HRSA (HRSA, 2022) were compared for underlying assumptions, data used, and scenarios modeled (Table 1).
Comparison of Three Workforce Projection Models.
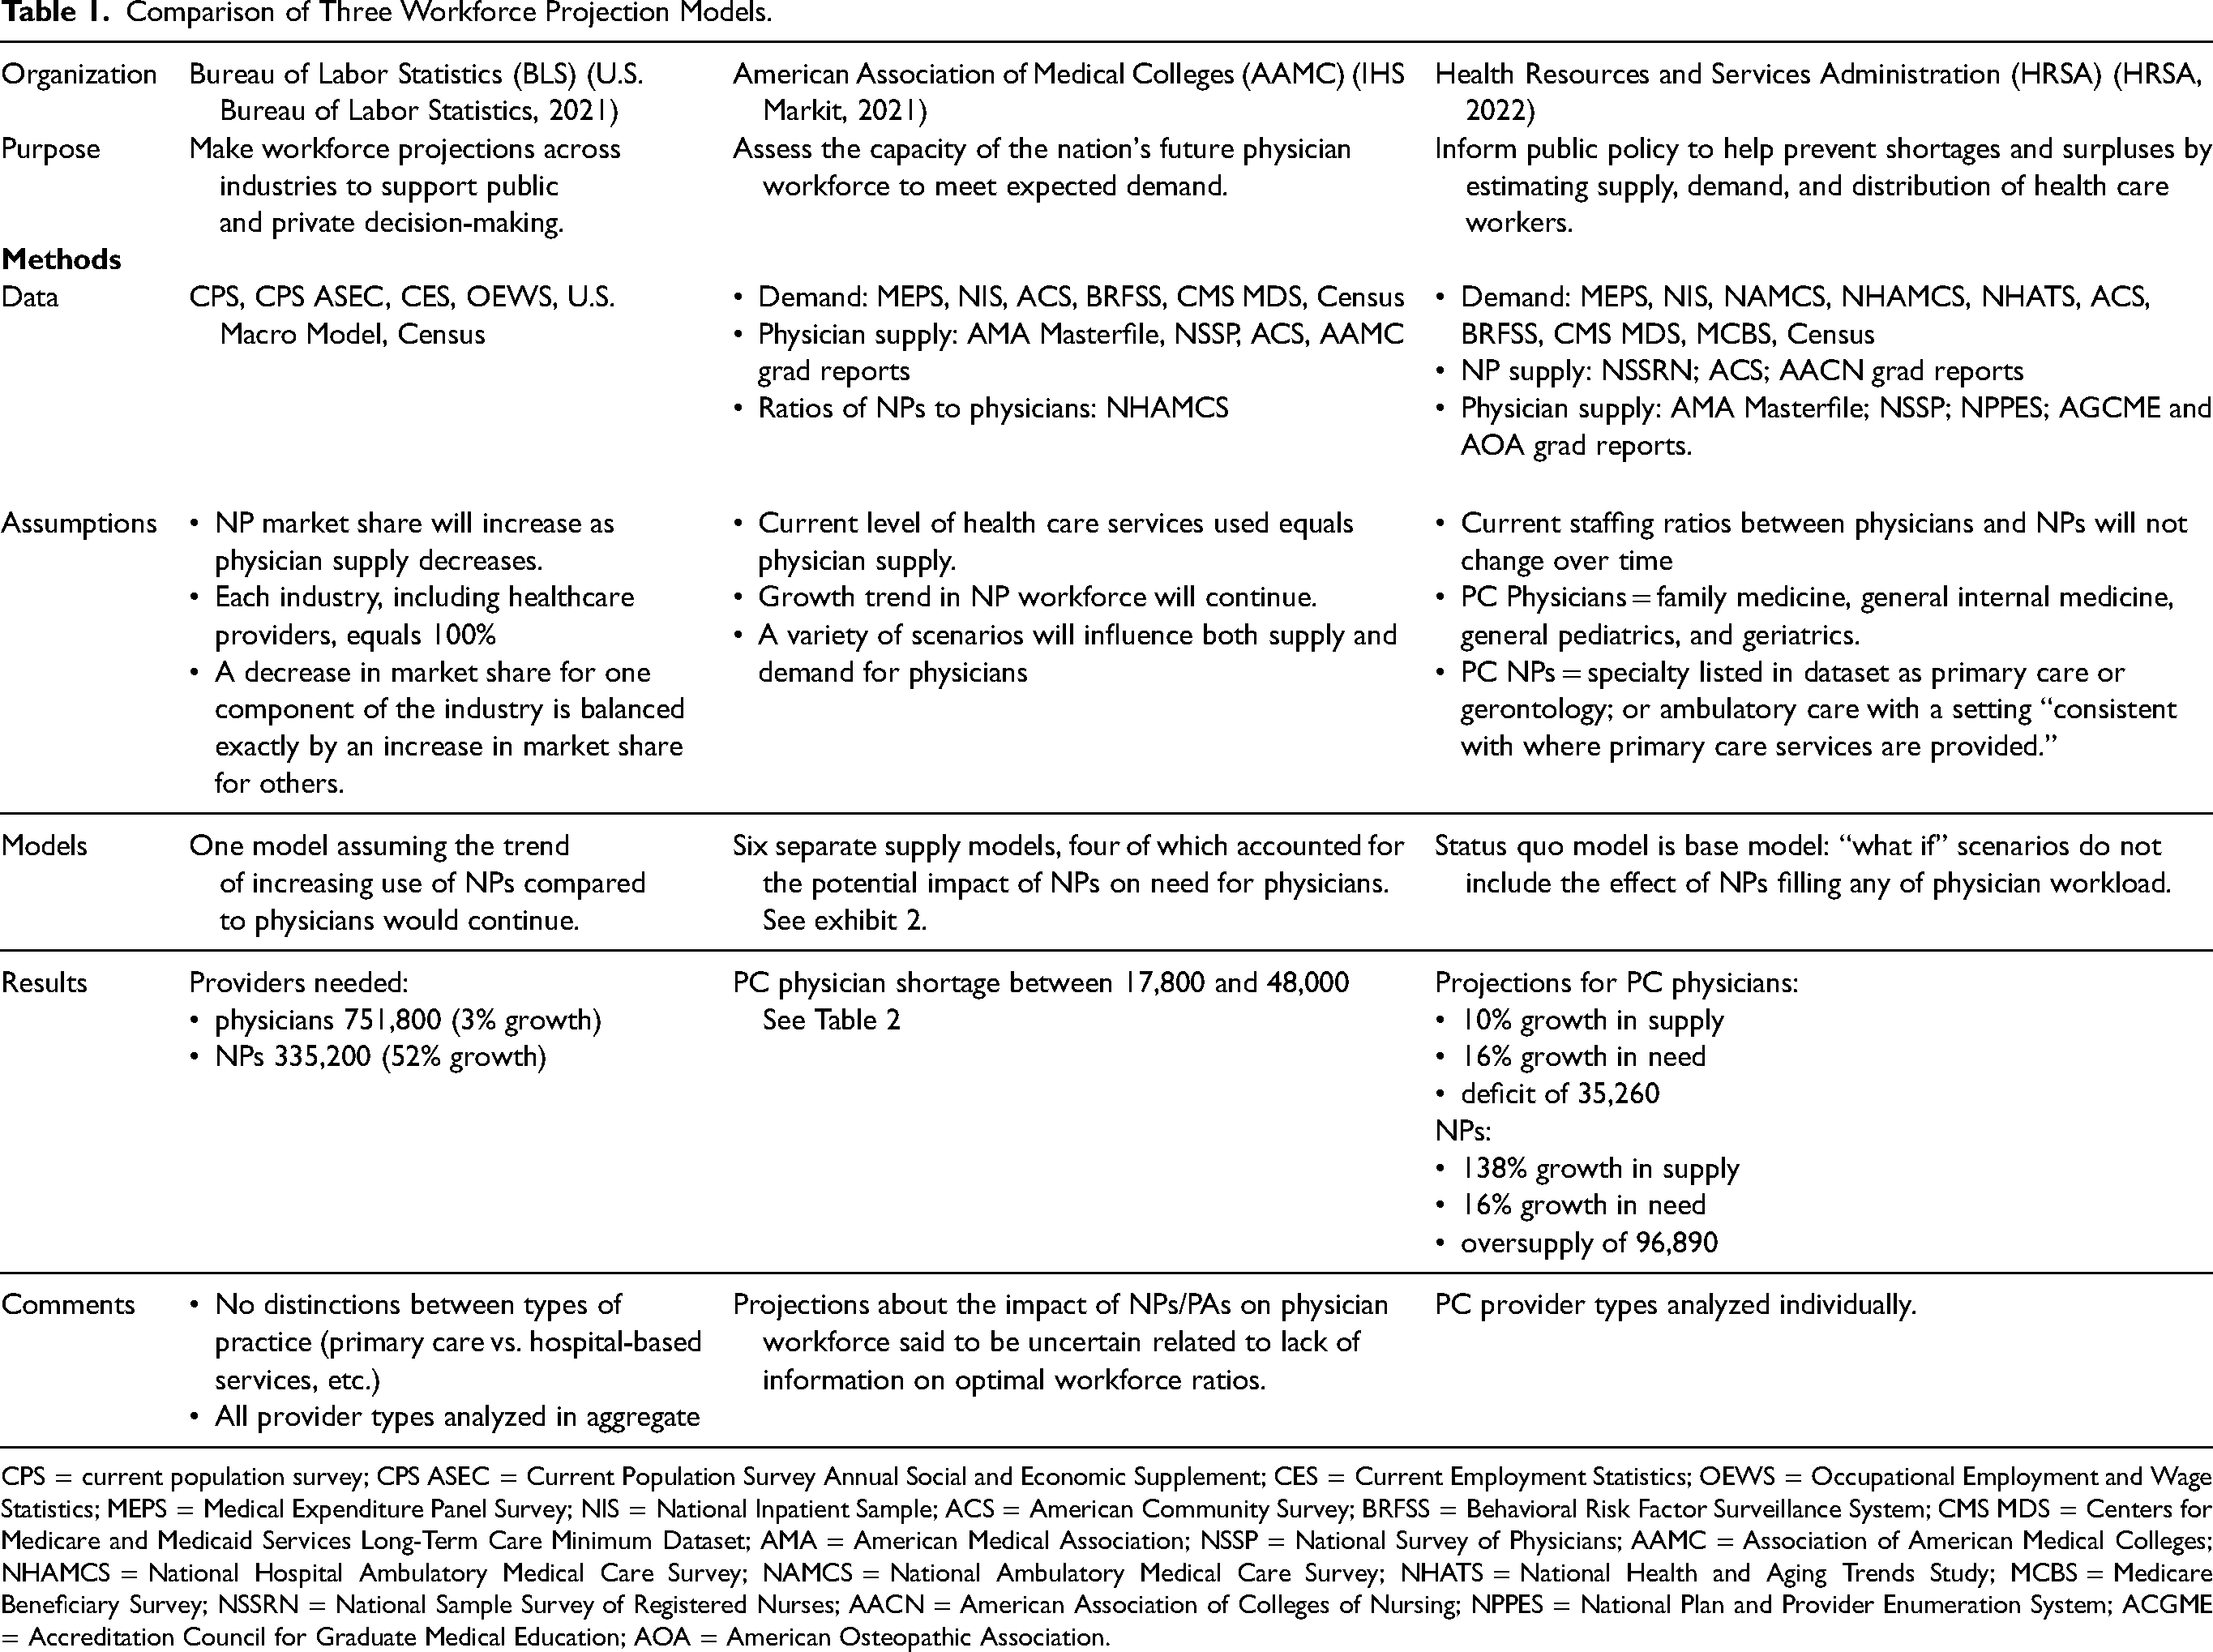
CPS = current population survey; CPS ASEC = Current Population Survey Annual Social and Economic Supplement; CES = Current Employment Statistics; OEWS = Occupational Employment and Wage Statistics; MEPS = Medical Expenditure Panel Survey; NIS = National Inpatient Sample; ACS = American Community Survey; BRFSS = Behavioral Risk Factor Surveillance System; CMS MDS = Centers for Medicare and Medicaid Services Long-Term Care Minimum Dataset; AMA = American Medical Association; NSSP = National Survey of Physicians; AAMC = Association of American Medical Colleges; NHAMCS = National Hospital Ambulatory Medical Care Survey; NAMCS = National Ambulatory Medical Care Survey; NHATS = National Health and Aging Trends Study; MCBS = Medicare Beneficiary Survey; NSSRN = National Sample Survey of Registered Nurses; AACN = American Association of Colleges of Nursing; NPPES = National Plan and Provider Enumeration System; ACGME = Accreditation Council for Graduate Medical Education; AOA = American Osteopathic Association.
Assumptions
While HRSA, AAMC, and BLS all strive to help citizens, employers, and policymakers make data-driven decisions, each organization has different priorities. BLS is interested in providing an adequate supply of workers across the economy (U.S. Bureau of Labor Statistics, 2021), AAMC is concerned with matching the supply of physicians with the need for physicians (IHS Markit, 2021), and HRSA's goal is to ensure access to PC (Health Resources and Services Administration, 2022). These differences influence their approach to data collection and analysis.
All three groups estimated demand for healthcare services based on current demand for healthcare services plus projected population demographics and the likely impact on healthcare utilization. Healthcare demand projections were minimally different between organizations, with the aging of baby boomers as the foremost predictor of increasing healthcare demand for the coming 10–15 years. However, major differences were found in provider need and supply projections.
BLS did not model worker supply; instead, they assumed that if there was a need, people would enter the field so that, over time, the need and supply of workers would equalize (U.S. Bureau of Labor Statistics, 2021). AAMC used a variety of supply and need scenarios to report a range of probable physician shortages (IHS Markit, 2021), while HRSA used projected demand for healthcare services and projected supply of physicians to report “adequacy” calculations; see Table 1 for model comparisons.
Provider need calculations were significantly influenced by assumptions about what type of provider would carry out the services. BLS looked at the data for the past 8 years and assumed that the trend of increasing NP utilization would continue over the next 10 years (U.S. Bureau of Labor Statistics, 2021). This led BLS to project a 52% net increase in the need for NPs by 2034 and a 3% net increase in the need for physicians (U.S. Bureau of Labor Statistics, 2021). AAMC (IHS Markit, 2021) chose a more nuanced approach than the other two agencies, by providing multiple scenarios for physician supply, including scenarios with varying levels of NP and physician assistant (PA) utilization (Table 2). The PC physician shortage was markedly less in the three scenarios that assumed an increase in PC NP and PA utilization. HRSA projections assumed the mix of provider types delivering PC services would not change between 2020 and 2035 (status quo modeling) (HRSA, 2021, 2022). In other words, HRSA's projections assumed that the predicted increase in NP supply would not affect the need for physicians.
Scenarios of Projected Primary Care Physician Need per NP/PA by AAMC (IHS Markit, 2021).
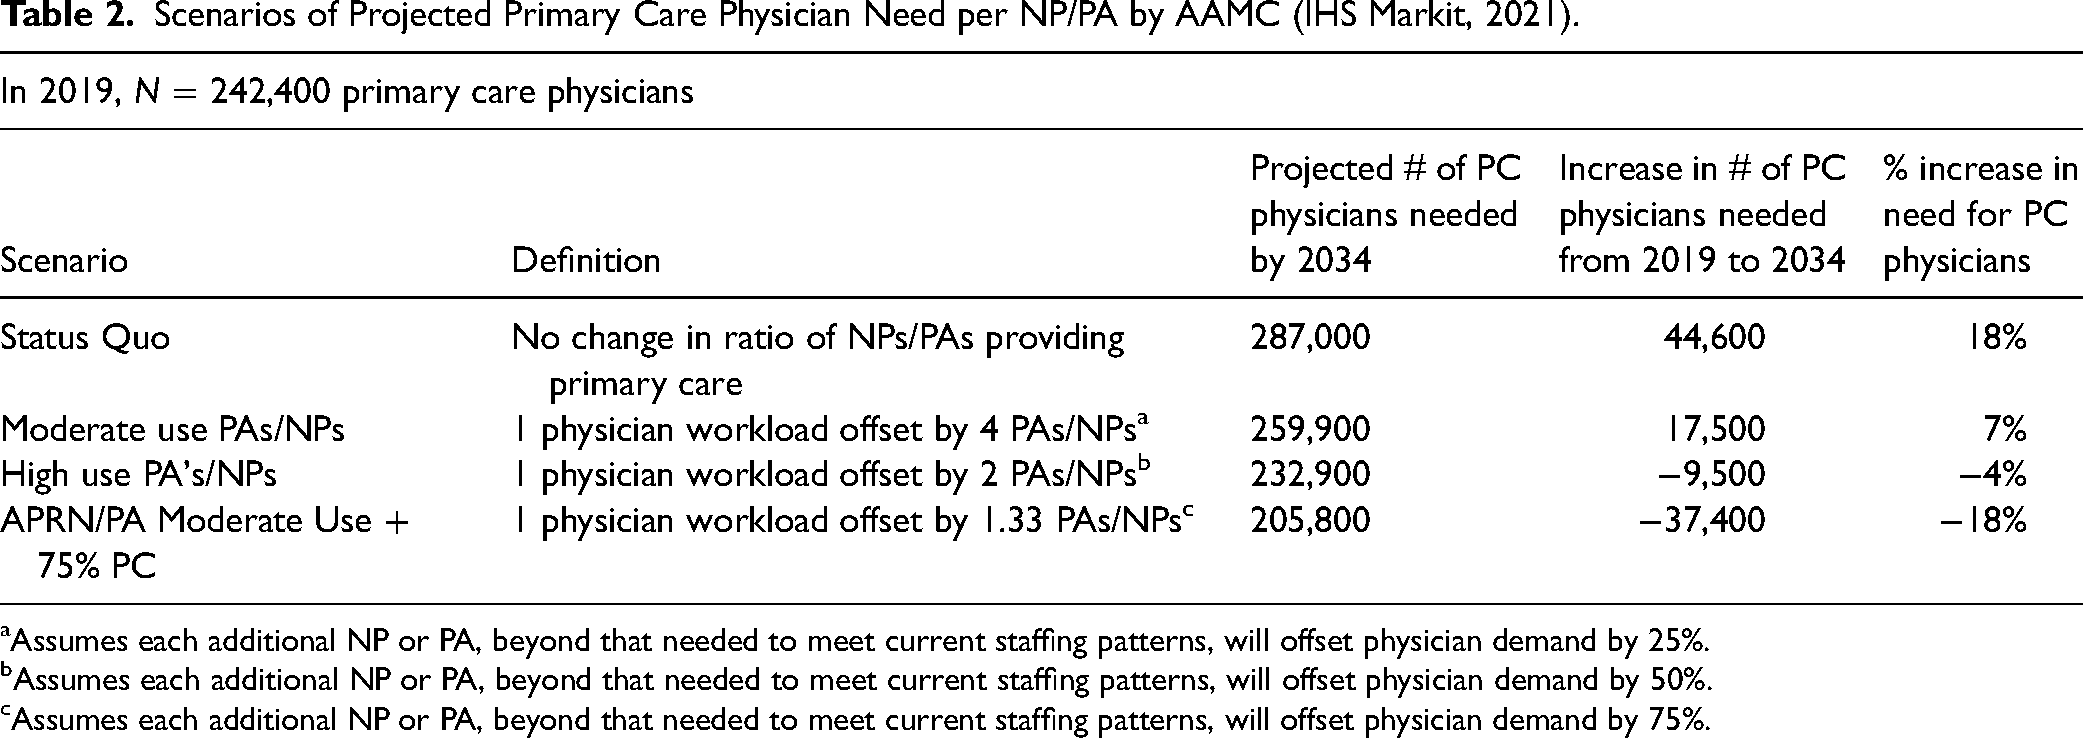
Assumes each additional NP or PA, beyond that needed to meet current staffing patterns, will offset physician demand by 25%.
Assumes each additional NP or PA, beyond that needed to meet current staffing patterns, will offset physician demand by 50%.
Assumes each additional NP or PA, beyond that needed to meet current staffing patterns, will offset physician demand by 75%.
Data
Assumptions account for the largest differences in outcomes; however, the variety of datasets used by the three organizations in this inquiry also influenced results. BLS relied on employer data in the form of regular longitudinal surveys of healthcare employers to determine the number of physicians and NPs currently employed and anticipated to be employed (U.S. Bureau of Labor Statistics, 2021). BLS reports each provider type as having a market share in an occupational field. The market share for each field adds up to 100%; therefore, a projected increase in utilization of NPs necessarily decreases the projected need for physicians and vice versa (U.S. Bureau of Labor Statistics, 2021).
AAMC and HRSA estimated the need for each type of healthcare provider based on the number of encounters performed by each type of provider (HRSA, 2022; IHS Markit, 2021). This data was gathered from multiple sources such as the Medical Expenditure Panel Survey (MEPS) (Agency for Healthcare Research and Quality, 2019), the National Ambulatory Medical Care Survey (National Center for Health Statistics & Centers for Disease Control and Prevention, n.d.), and the Centers for Medicare and Medicaid Services Long-term Care Minimum Dataset (CMS MDS) (Research Data Assistance Center, n.d.) among others. These data sources often list the physician as the provider for an encounter, even when an NP saw the patient; how often this occurs is unknown. In general, this would overestimate the number of services provided by physicians compared to NPs. Determining the type of provider for a given healthcare encounter is hampered by limitations in data availability.
Model Scenarios
BLS did not provide multiple scenarios. They assumed that the observed trend of increasing use of NPs would continue and factored that into their projection. Because of the market share modeling, while there was an increase in the projected need for all three provider types, the increase in need for NPs was accompanied by a smaller increase in the need for physicians (U.S. Bureau of Labor Statistics, 2021).
HRSA provided nine “what if” scenarios related to healthcare demand. They also reported six “what if” supply scenarios related to graduation and retirement projections. However, the supply of and need for each provider type was calculated in a silo, ignoring trends and projections of different provider types. HRSA compared supply and demand to provide an “adequacy” figure, maintaining that PC NPs will be at 205% adequacy, where PC physicians, on average, will be at 89% adequacy, suggesting a massive oversupply of PC NPs and a significant shortage of PC physicians (Health Resources and Services Administration, 2022). These projections assumed the percentage of patient encounters provided by physicians and NPs in the healthcare provider workforce would not change between 2020 and 2035 (Health Resources and Services Administration, 2022).
By contrast, AAMC included four scenarios where NPs are incorporated into the projected need for PC physicians. In AAMCs “moderate use” scenario, where each PC NP over the number needed to maintain the current supply would decrease the need for a PC physician by 25%, supply and need for PC physicians is almost balanced (see Table 2 and Figure 1) (IHS Markit, 2021). In their “high use” scenario, AAMC assumed that “each NP over the number needed to maintain the current supply” would decrease the need for a PC physician by 50% (IHS Markit, 2021). In other words, the productivity of a PC NP was modeled as approximately half that of a PC physician. The “high use” scenario projected the need for PC physicians to grow by less than 1% (compared to 19% in the status quo model), with the supply of PC physicians slightly exceeding demand due to the small projected increase in the number of PC physicians. The AAMC projections do not provide figures on need for NPs, but it could be assumed that as NP effort offsets physician effort, NP need would increase proportionally. Although the scenarios for moderate and high NP and PA use yielded a minimal to no physician shortage, AAMC's executive summary did not include these scenarios, instead reporting a projected PC physician shortage of between 17,800 and 48,000 by 2034.
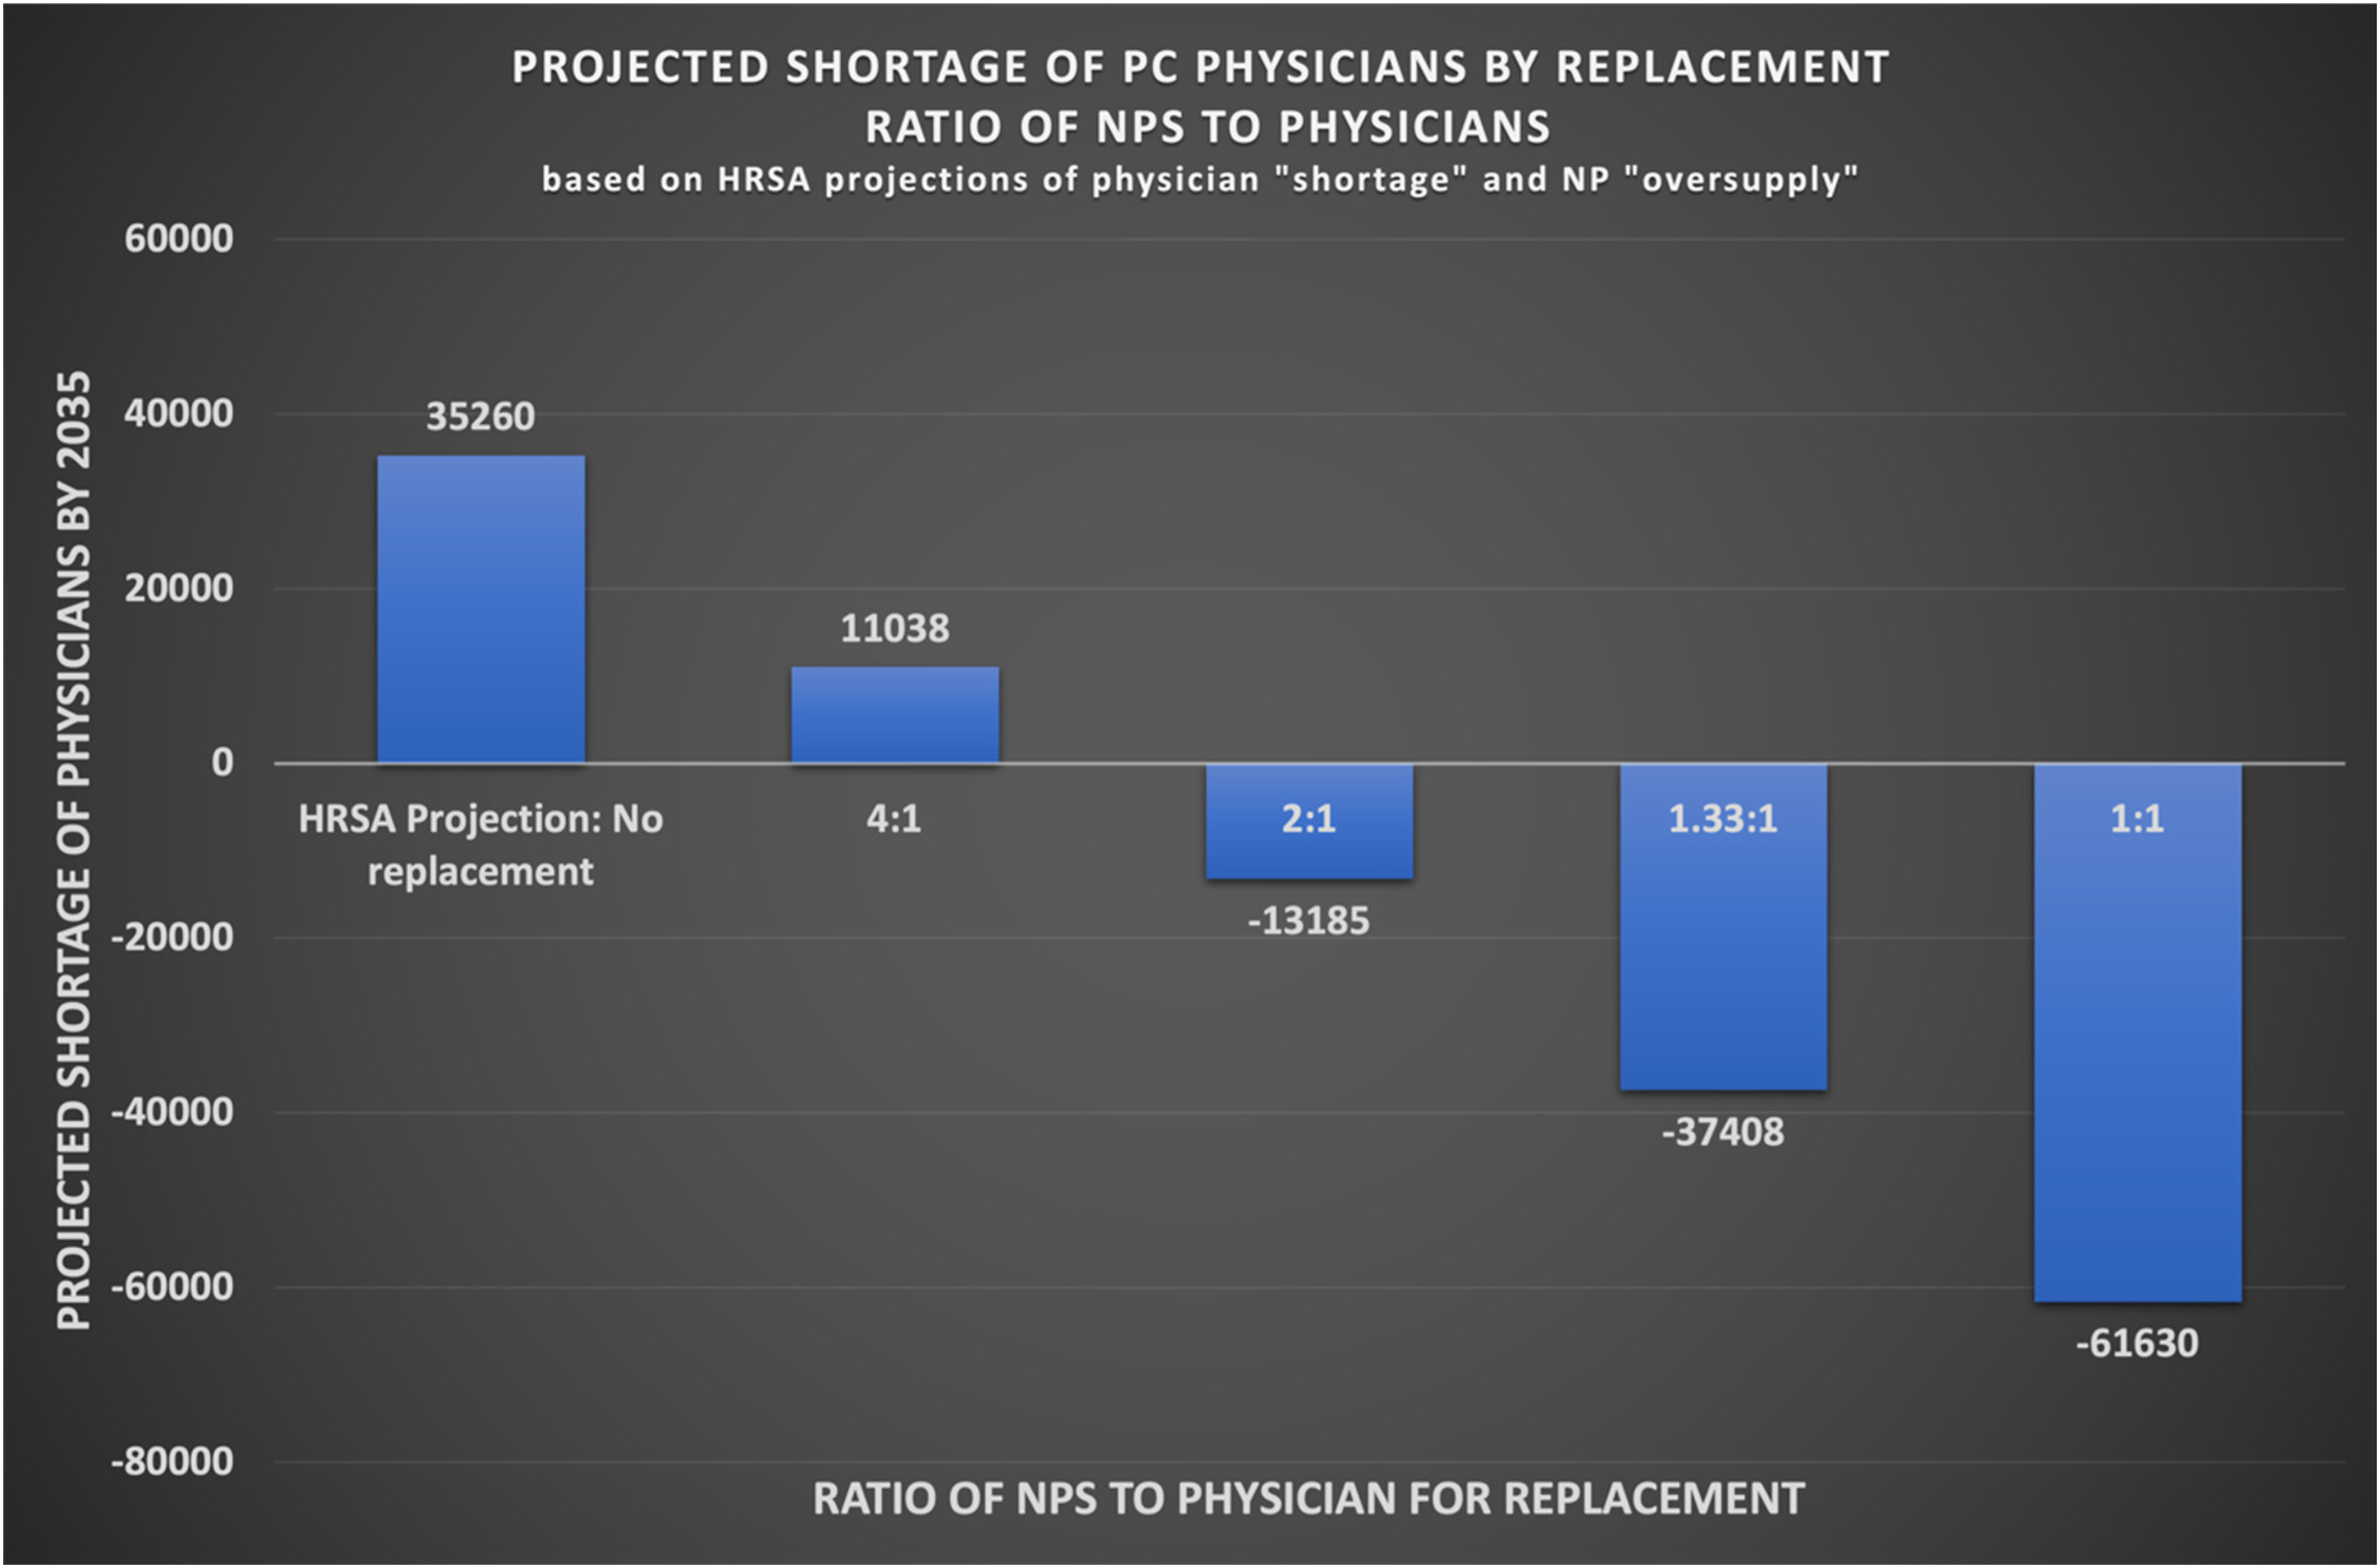
Graph depicts model scenarios used in AAMC (IHS Markit, 2021) projections in which the additional NPs over the predicted number needed are used to offset the physician shortage. These models were described as an NP replacing a physician in the following ratios: 4 NPs to 1 physician (25%), 2 NPs to 1 physician (50%), 1.33 NP to 1 physician (75%). A 1:1 ratio or 100% replacement is also included for comparison. Numbers used in the above graph are HRSA (Health Resources and Services Administration, 2021) projections.
As an independent example, the investigators used current HRSA published numbers and AAMC's NP scenarios to create another model. The desire was to visualize the effect of an integration of NPs and PC physicians. As depicted in Figure 1, without integrating the PC workforce, a shortage of 35,260 PC physicians is evident. Combining the PC physician numbers with PC NP provides a completely different outcome. The workload of a PC physician and how this relates to that of a PC NP is yet to be determined (White et al., 2021). However, even using the modest AAMC scenario that equates the workload of one PC physician with that of two PC NPs, an “oversupply” of 13,185 PC physicians is illustrated.
Discussion
Significant differences were found in reports of PC provider supply and demand between the three organizations (HRSA, BLS, AAMC). Data, assumptions, and definitions all play a part in these discrepancies. The need for PC providers was influenced by assumptions of what type of provider would carry out the services. BLS assumed the trend of increasing NPs would continue; therefore, more services would be carried out by NPs. AAMC provided multiple scenarios based on the supply of providers, including scenarios with increased NP provision of services. HRSA assumed the mix of providers would not change by 2035, thus increasing NP supply without affecting the need for physicians.
As demonstrated with the investigator-created scenario, an integrated PC workforce projection could provide the most comprehensive and accurate picture of PC needs. NPs have proven to provide safe, high quality and cost effective care with high rates of patient satisfaction (Aiken et al., 2021; American Association of Nurse Practitioners, 2021; Barnes et al., 2018; Cimiotti et al., 2019; Geller & Swan, 2021; Morgan et al., 2019). The difficulties in creating an integrated PC projection model lie in the unknowns regarding workloads of each provider type, which lends back to current issues with data.
Data collection and sources influence the ability to accurately project healthcare utilization by provider type. NPs are not well represented in many data sources due to current billing practices such as “incident to” billing, lack of differentiation between RN and APRN in some state licensure data, and absence of a central “Masterfile” such as the AMA for general demographic and distribution purposes. Also, the lack of a standardized definition of PC, for research purposes, leads to the use of setting and certification type rather than services provided.
Implications
An integrative PC workforce projection would provide a more accurate representation of providers performing the duties of PC. It is important that projections mirror the workload and integration seen in clinical PC. While the current initiatives by HHS to strengthen PC are a step forward, the impetus upon which this initiative is built has an innate flaw. The ACA, in 2010, sanctioned the National Healthcare Workforce Commission, which has yet to be funded by Congress (McDonough, 2021). Funding the NHWC or a similar commission is imperative to obtain accurate, integrated workforce projections. To strengthen PC, an accurate assessment of the total workforce is necessary.
A large contributing issue with accurate workforce assessment is data. Data and data collection need to be representative of all provider types. For this to occur, all providers need to bill under their unique NPI numbers so each provider, can have their workload attributed appropriately. In addition, a standardized method of determining PC practices is necessary, as setting of the practice and certification type of the provider are inadequate. The lack of a standardized, integrative definition of PC continues to support the traditional physician-led medical model as opposed to newer models driven by the consumer or the whole-person, integrated, interprofessional, community-based models proposed by the HHS.
Additional research on provider workload is also necessary. Current scenarios used for research, economics, and policy are speculation regarding the amount of workload equivalence that exists between NPs and physicians. Using improved analyses of PC work, such as provision of services typical of PC (O’Reilly-Jacob et al., 2023), may provide a more accurate definition of the work and, therefore, also be attributed to appropriate provider types.
Finally, a movement toward interprofessional PC is necessary on many levels. Reshaping PC training to include interprofessional members in community-based settings as well as modification of the current Graduate Medical Education (GME) funding model to include “all members of the interprofessional primary care team” (McDevitt, 2022, p. 378) is a goal of the Initiative to Strengthen Primary Health Care. In addition, the report recommends a DHHS Secretary's Council on Primary Care and an Office of Primary Care Research at the NIH (McDevitt, 2022). These entities, too, need to be interprofessional. If implemented, these recommendations could have a significant impact by promoting a centralized, integrated approach to PC, workforce research, projection, and planning while continuing to dismantle barriers to practice for NPs.
Conclusion
Workforce projections are a valuable tool in healthcare workforce planning and policy. It is essential that projections include a broad perspective in the assumptions, analysis, and presentation of findings. HRSAs projections specifically are formed in siloes, use status quo assumptions about the future PC workforce, and consequently overestimate both the physician shortage and the NP “oversupply.” Projections of a continued deficit of PC physicians by 2035 and an NP oversupply are not two independent problems; they are a problem, a solution, and an opportunity. Both access and quality in PC could be significantly improved by an “oversupply” of NPs on the front lines.
Footnotes
Acknowledgements
The lead author would like to acknowledge funding support via seed grant from the College of Nursing & Professional Disciplines at the University of North Dakota.
Declaration of Conflicting Interests
The authors declared no potential conflicts of interest with respect to the research, authorship, and/or publication of this article.
Funding
The authors disclosed receipt of the following financial support for the research, authorship, and/or publication of this article: This work was supported by the University of North Dakota College of Nursing & Professional Disciplines.