
Abstract
Introduction:
Health care systems are increasingly pressured by workforce shortages and increasing chronic conditions. Hypertensive disorders of pregnancy (HDP) require frequent monitoring. Telemonitoring of blood pressure (BP) offers a promising alternative for components of hospital care, potentially improving outcomes and reducing costs. Following cost-saving results from the SAFE@home pilot, this study conducts a cost-effectiveness analysis (CEA) of SAFE@home versus care as usual (CAU) at scale.
Methods:
A CEA was conducted within the SAFE@home II multicenter before–after study. Women with high risk of or established HDP received remote BP monitoring as part of hybrid care. The controls received CAU. Antenatal costs were calculated in euros. Cost-effectiveness was measured as the absolute risk reduction (ARR) in adverse outcome and the incremental cost-effectiveness ratio (ICER) as the cost per adverse outcome prevented.
Results:
Mean antenatal costs per patient were €6,756 (standard deviation [SD] €5,144) in the SAFE@home group and €7,142 (SD €5,149) in the CAU group, corresponding with a cost reduction of €368 (5.4%) using telemonitoring. The ARR was 4.3% and resulted in a negative ICER. Health care consumption per adverse outcome revealed cost savings during pregnancy of €765 per participant with an adverse outcome. Fewer HDP-related admissions (12.0% vs. 15.5%, p = 0.039) in the SAFE@home group compared with CAU supported cost-effectiveness.
Conclusion:
This CEA demonstrated that at scale, SAFE@home modestly reduces costs. With lower costs per adverse outcome resulting in a negative ICER, SAFE@home dominates CAU. Future research should explore how telemonitoring can optimize use of resources. In conclusion, addressing adoption barriers is essential to sustainably integrate telemonitoring.
Introduction
Health care systems worldwide are under growing pressure due to workforce shortages, inefficient staff and budget use, an aging population, and the rising prevalence of chronic conditions. These challenges, coupled with an increasing demand for medical care, strain the accessibility, affordability, and sustainability of care delivery.1–3 In order to improve efficiency and optimize resources in health care, integration of digital health care is increasingly common. 4 Besides safety and effectiveness of digital transformation, understanding cost-effectiveness is critical for successful implementation. 5 By demonstrating cost-effectiveness, new technologies can be strategically budgeted and integrated, ensuring alignment with long-term health care policy objectives.6,7
Hypertensive disorders of pregnancy (HDP) are conditions where digital solutions could provide substantial benefits. Affecting at least 10% of pregnancies, HDP is a leading cause of maternal complications, such as severe hypertension and preeclampsia, and neonatal adverse outcomes, such as (iatrogenic) preterm birth and fetal growth restriction.8–10 Managing HDP typically demands frequent outpatient visits, which can increase to multiple weekly appointments as blood pressure (BP) levels and symptoms worsen. Additionally, HDP leads to increased rates of hospital admissions, straining already limited resources.11,12
In this context, telemonitoring emerges as a promising alternative. By enabling remote monitoring of BP and related symptoms, it facilitates timely interventions and improved management for women at higher risk of or with established HDP. The SAFE@home I pilot study assessed feasibility and costs of telemonitoring of BP and symptoms in pregnant women at risk of or with established HDP. 13 That study showed a 20% cost reduction in antenatal costs with SAFE@home compared with care as usual (CAU).14,15 Additionally, quantitative analyses of user experiences from patients in the SAFE@home II study revealed a positive reception of telemonitoring, further supporting its potential at scale. 16
Building on these findings, the SAFE@home II study implemented the intervention at scale across multiple centers, enabling more robust clinical and economic impact evaluation. While analyses of the SAFE@home I pilot study suggested promising cost reductions, it remains unclear whether these savings are sustained in a large-scale setting. Cost insights are essential for widespread adoption into routine obstetric care. Therefore, we performed a cost-effectiveness analysis (CEA) comparing antenatal costs and outcomes of SAFE@home telemonitoring with standard care in women at high risk of or diagnosed with HDP.
Methods
STUDY DESIGN
For this CEA, we used data from the SAFE@home II study, a multicenter nonrandomized noninferiority before–after study with a retrospective control group conducted in 11 Dutch hospitals from November 2020 until December 2023, with approval of the local Medical Ethical Review Committee (METC 20-422). To assess the safety and clinical impact of a digital home monitoring platform (SAFE@home) as a partial replacement for CAU, women with a singleton pregnancy who had a risk of or established HDP, that is, chronic hypertension, history of preeclampsia, maternal cardiac disease, maternal kidney disease, or pregnancy-induced hypertension before 34 weeks were included. Eligible women were ≥18 years old, had access to a smartphone or tablet with internet connection, and sufficient knowledge in Dutch or English. A body mass index (BMI) >35 kg/m2 or an arm circumference <22 cm or >42 cm (due to technical requirements of the BP cuff) were exclusion criteria. Each participating center implemented the SAFE@home for a period of 18 months. During this implementation phase, the prospective (after) cohort was formed. Women were enrolled between 12 and 34 weeks of gestation until delivery and received home monitoring of BP and symptoms, combined with a reduced number of scheduled antenatal visits. The CAU (before) cohort was a retrospective cohort, with the same inclusion and exclusion criteria, treated according to obstetric care “as usual” within the participating center. To assess the cost-effectiveness of SAFE@home, the abovementioned before and after cohorts were compared. The SAFE@home intervention involved daily BP self-monitoring and symptom assessments. Alerts were sent to the hospitals’ platform interface and reviewed by health care professionals. CAU followed local outpatient protocols, with BP monitoring and symptom checks limited to clinic visits.
CLINICAL OUTCOMES
The composite clinical primary outcome included perinatal mortality, 5-min Apgar score <7, pH of umbilical artery <7.05, neonatal intensive care unit admission, and maternal morbidity. Secondary outcomes were prematurity and small for gestational age (SGA). The composite adverse outcome occurred less often in the SAFE@home group (n = 104, 17.2%) as compared with the CAU group (n = 130, 21.5%; adjusted odds ratio [aOR] = 0.65, 95% confidence interval [CI]: 0.46–0.92). In the SAFE@home cohort, there were less cases of SGA neonates (n = 85, 12.0%; aOR = 0.69, 95% CI: 0.48–0.99) compared with CAU (n = 110, 18.2%). The rate of medically indicated preterm birth <34 weeks was lower in SAFE@home patients (3.6%) compared with the CAU patients (5.6%; aOR = 0.49, 95% CI: 0.26–0.91).
DATA COLLECTION
Health care consumption and cost units
The health care consumption of all 11 participating hospitals was analyzed. The following categories for consumption were defined: outpatient visits, admission(s) for HDP (times of admission and duration in days), ultrasound examinations (biometry and Doppler scan(s)), and laboratory assessments (blood and urine). Economic evaluation reporting was guided by the CHEERS checklist. 17 To calculate mean and median costs, we used both direct antenatal health care costs and limited indirect societal costs. For this analysis, the time horizon was set from the first antenatal consultation until delivery, as this was the telemonitoring intervention period. To compare health care costs, all procedure data were extracted from electronic health records.
Costs were assigned to all procedure data in line with Dutch national tariffs and The Netherlands Health Care Institutes’ costing manual.18,19 To convert the costs to 2,024 euros, the consumer price indices of Centraal Bureau voor de Statistiek (CBS) of The Netherlands (i.e., Central Agency for Statistics) was used. 20 To assess societal costs, travel costs were calculated on the assumption of an average distance of 7.1 km from home to hospital, based on the guideline for economic evaluations of the Dutch Health Care Institute. 19 Travel costs were calculated for outpatient visits and admissions. To calculate productivity loss costs, data from The Netherlands Health Care Institute guidelines were used and were based on CBS data. 21 See Textbox S1 of the Supplementary Appendix.
STATISTICAL ANALYSIS
Descriptive statistics were performed for all health care consumption categories and societal costs, resulting in both means with standard deviation (SD) and medians with interquartile range (IQR). To compare cost data, frequencies of predefined categories were multiplied by unit costs and summarized as means (SD) and medians (IQR) for the SAFE@home and CAU cohorts. To assess total costs, means were used, and mean differences (MD) for each category were calculated. For patients with an adverse outcome, additional descriptive analyses were conducted to calculate mean costs for each health care consumption category, including HDP admissions, biometry or Doppler ultrasounds, blood tests, and urinary tests, in the total cohort and in both groups. To determine statistical significance, the Mann–Whitney U test was used. Counts and percentages of categorical variables were compared using the chi-square or Fisher’s exact test. Level of significance was set at 5% (α = 0.05). Statistical analyses were conducted with SPSS version 29 (IBM Corp., New York, USA) and R Studio version 4.2.3.
For the CEA, we compared the difference in mean antenatal costs per patient between the SAFE@home cohort (CostsS@H) and the CAU cohort (CostsCAU), as well as the difference in effectiveness outcomes. Effectiveness was measured using clinically significant outcomes, as reported in section “Clinical Outcomes.”
The absolute risk reduction (ARR) was used to quantify the effect difference and was calculated as:

The cost per reduced adverse outcome was calculated in euros. To assess cost-effectiveness, we computed the incremental cost-effectiveness ratio (ICER), which represents the additional cost required to prevent one adverse outcome. The ICER was defined as:

Results
In this study, a total of 1,212 patients were included. Baseline characteristics and clinical outcomes of the SAFE@home cohort are depicted in Tables 1 and 2, respectively.
Baseline Characteristics
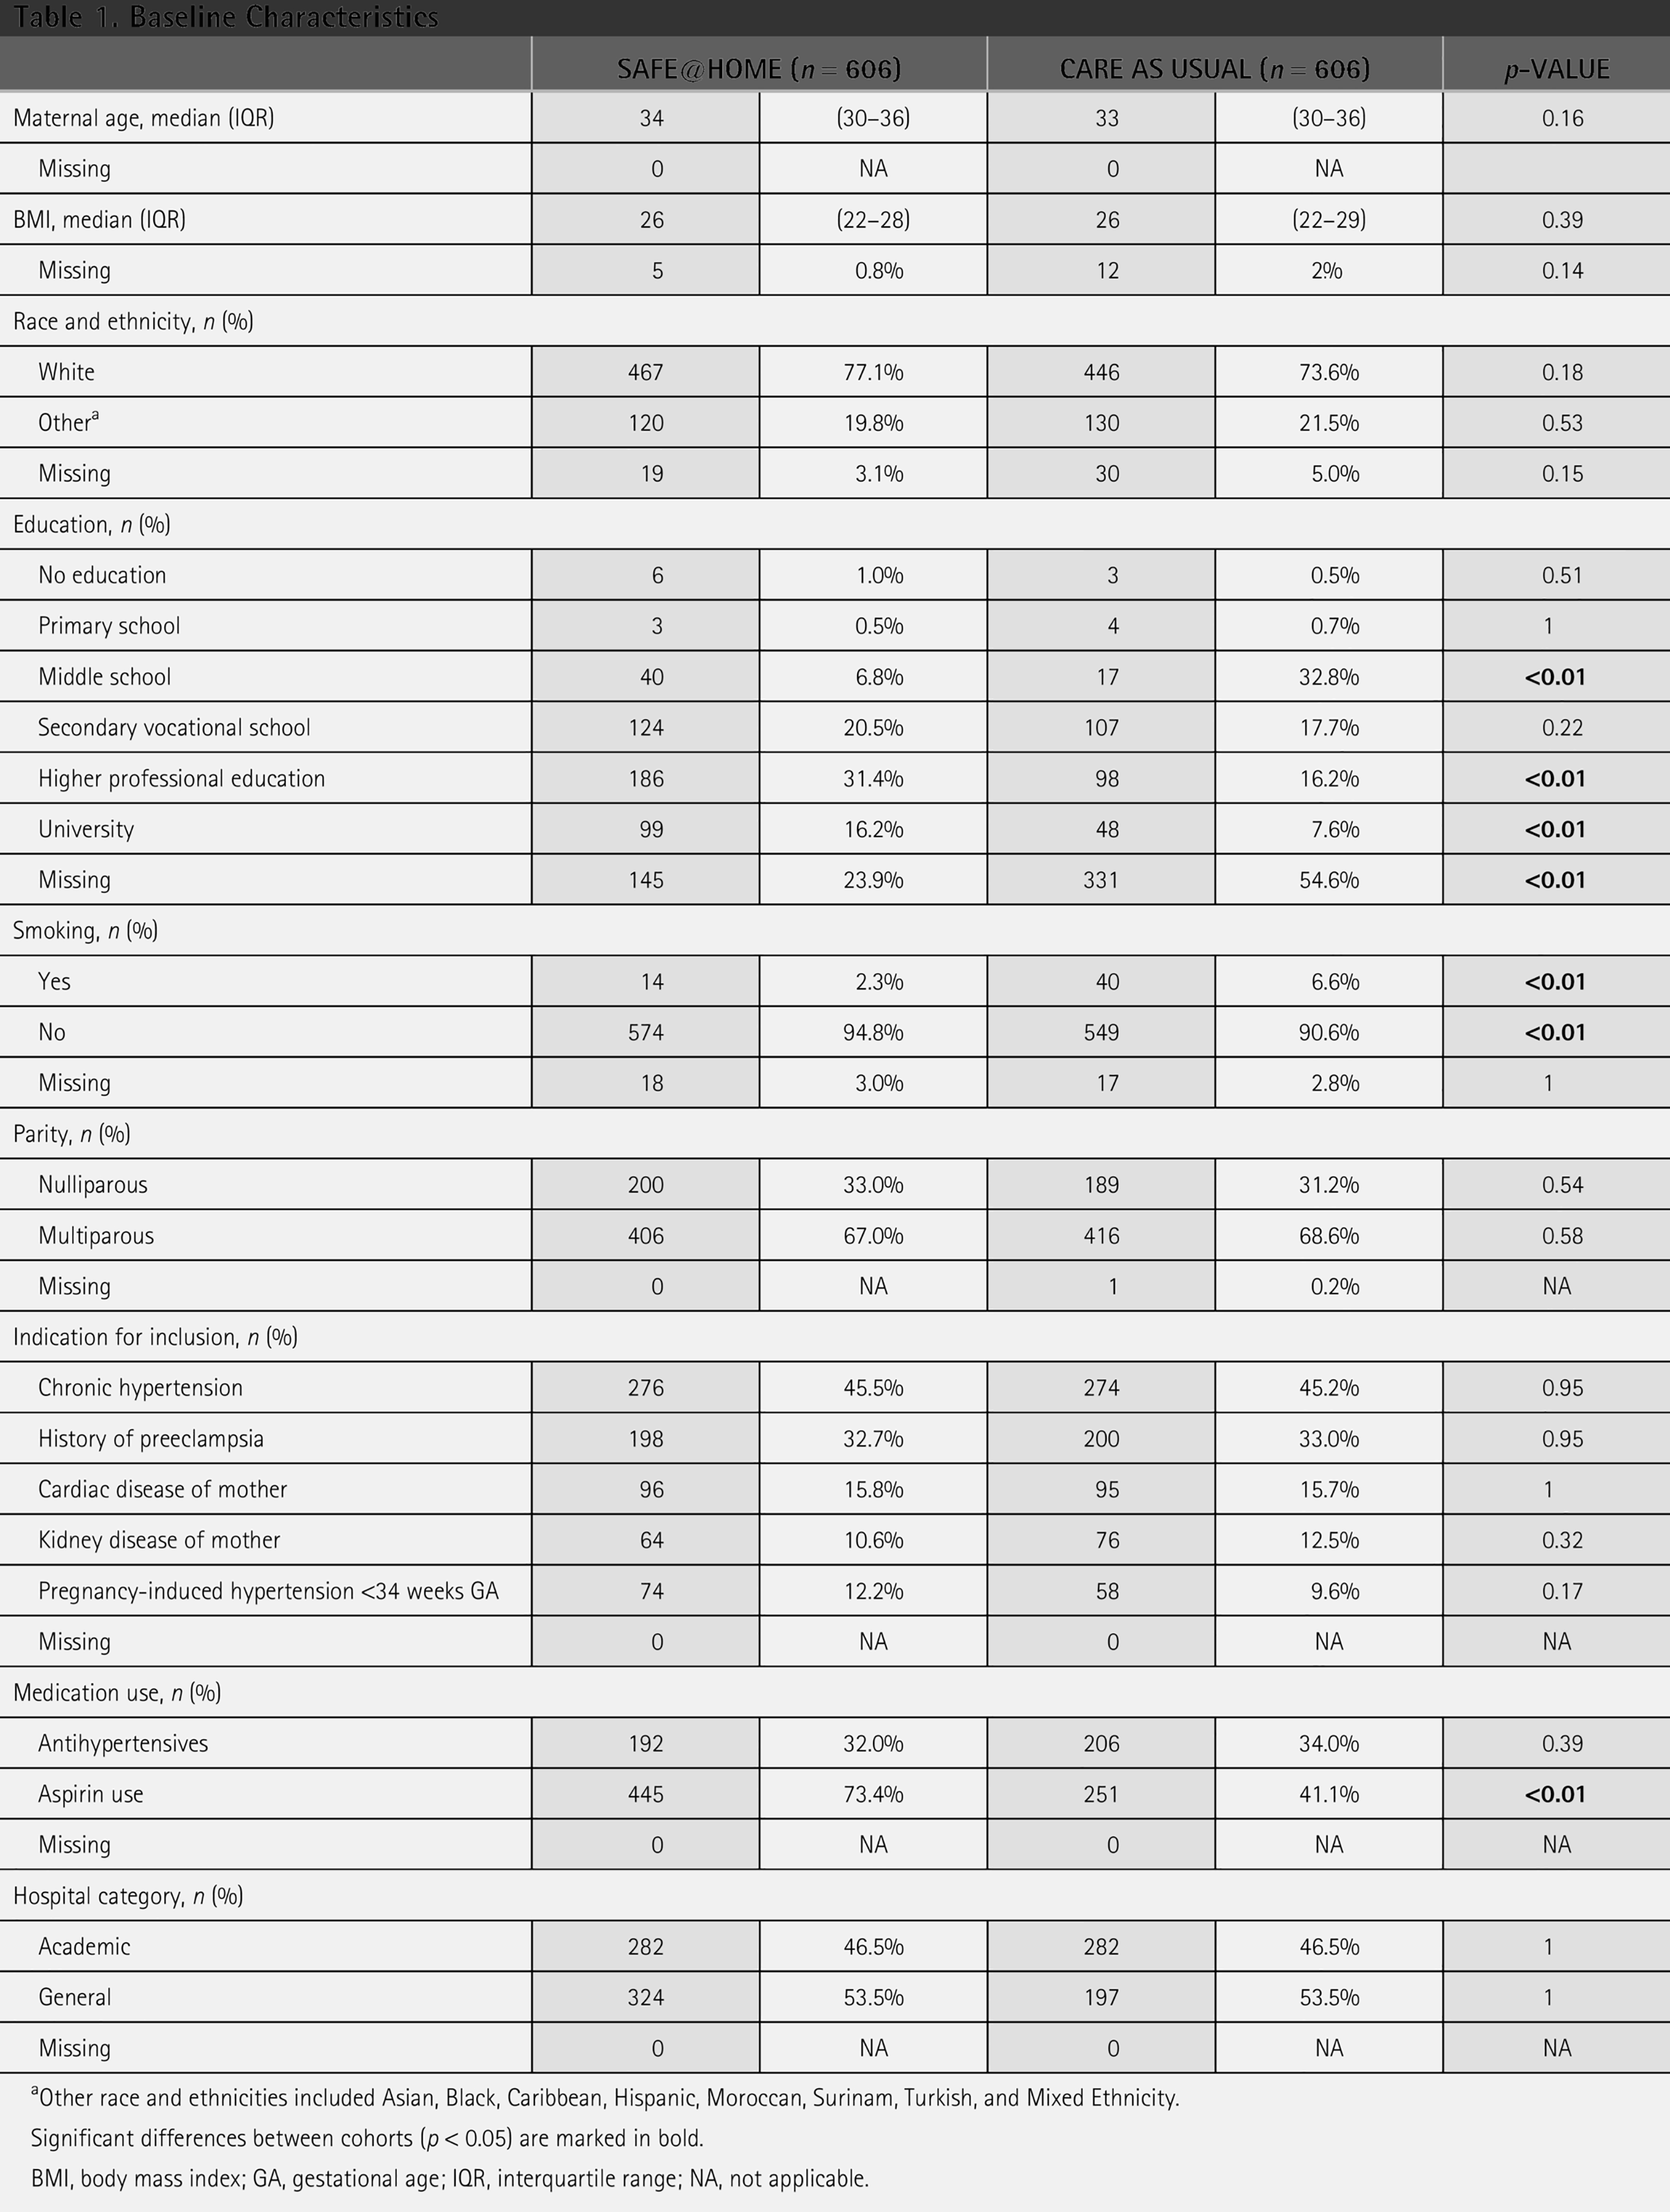
Other race and ethnicities included Asian, Black, Caribbean, Hispanic, Moroccan, Surinam, Turkish, and Mixed Ethnicity.
Significant differences between cohorts (p < 0.05) are marked in bold.
BMI, body mass index; GA, gestational age; IQR, interquartile range; NA, not applicable.
Clinical Outcomes
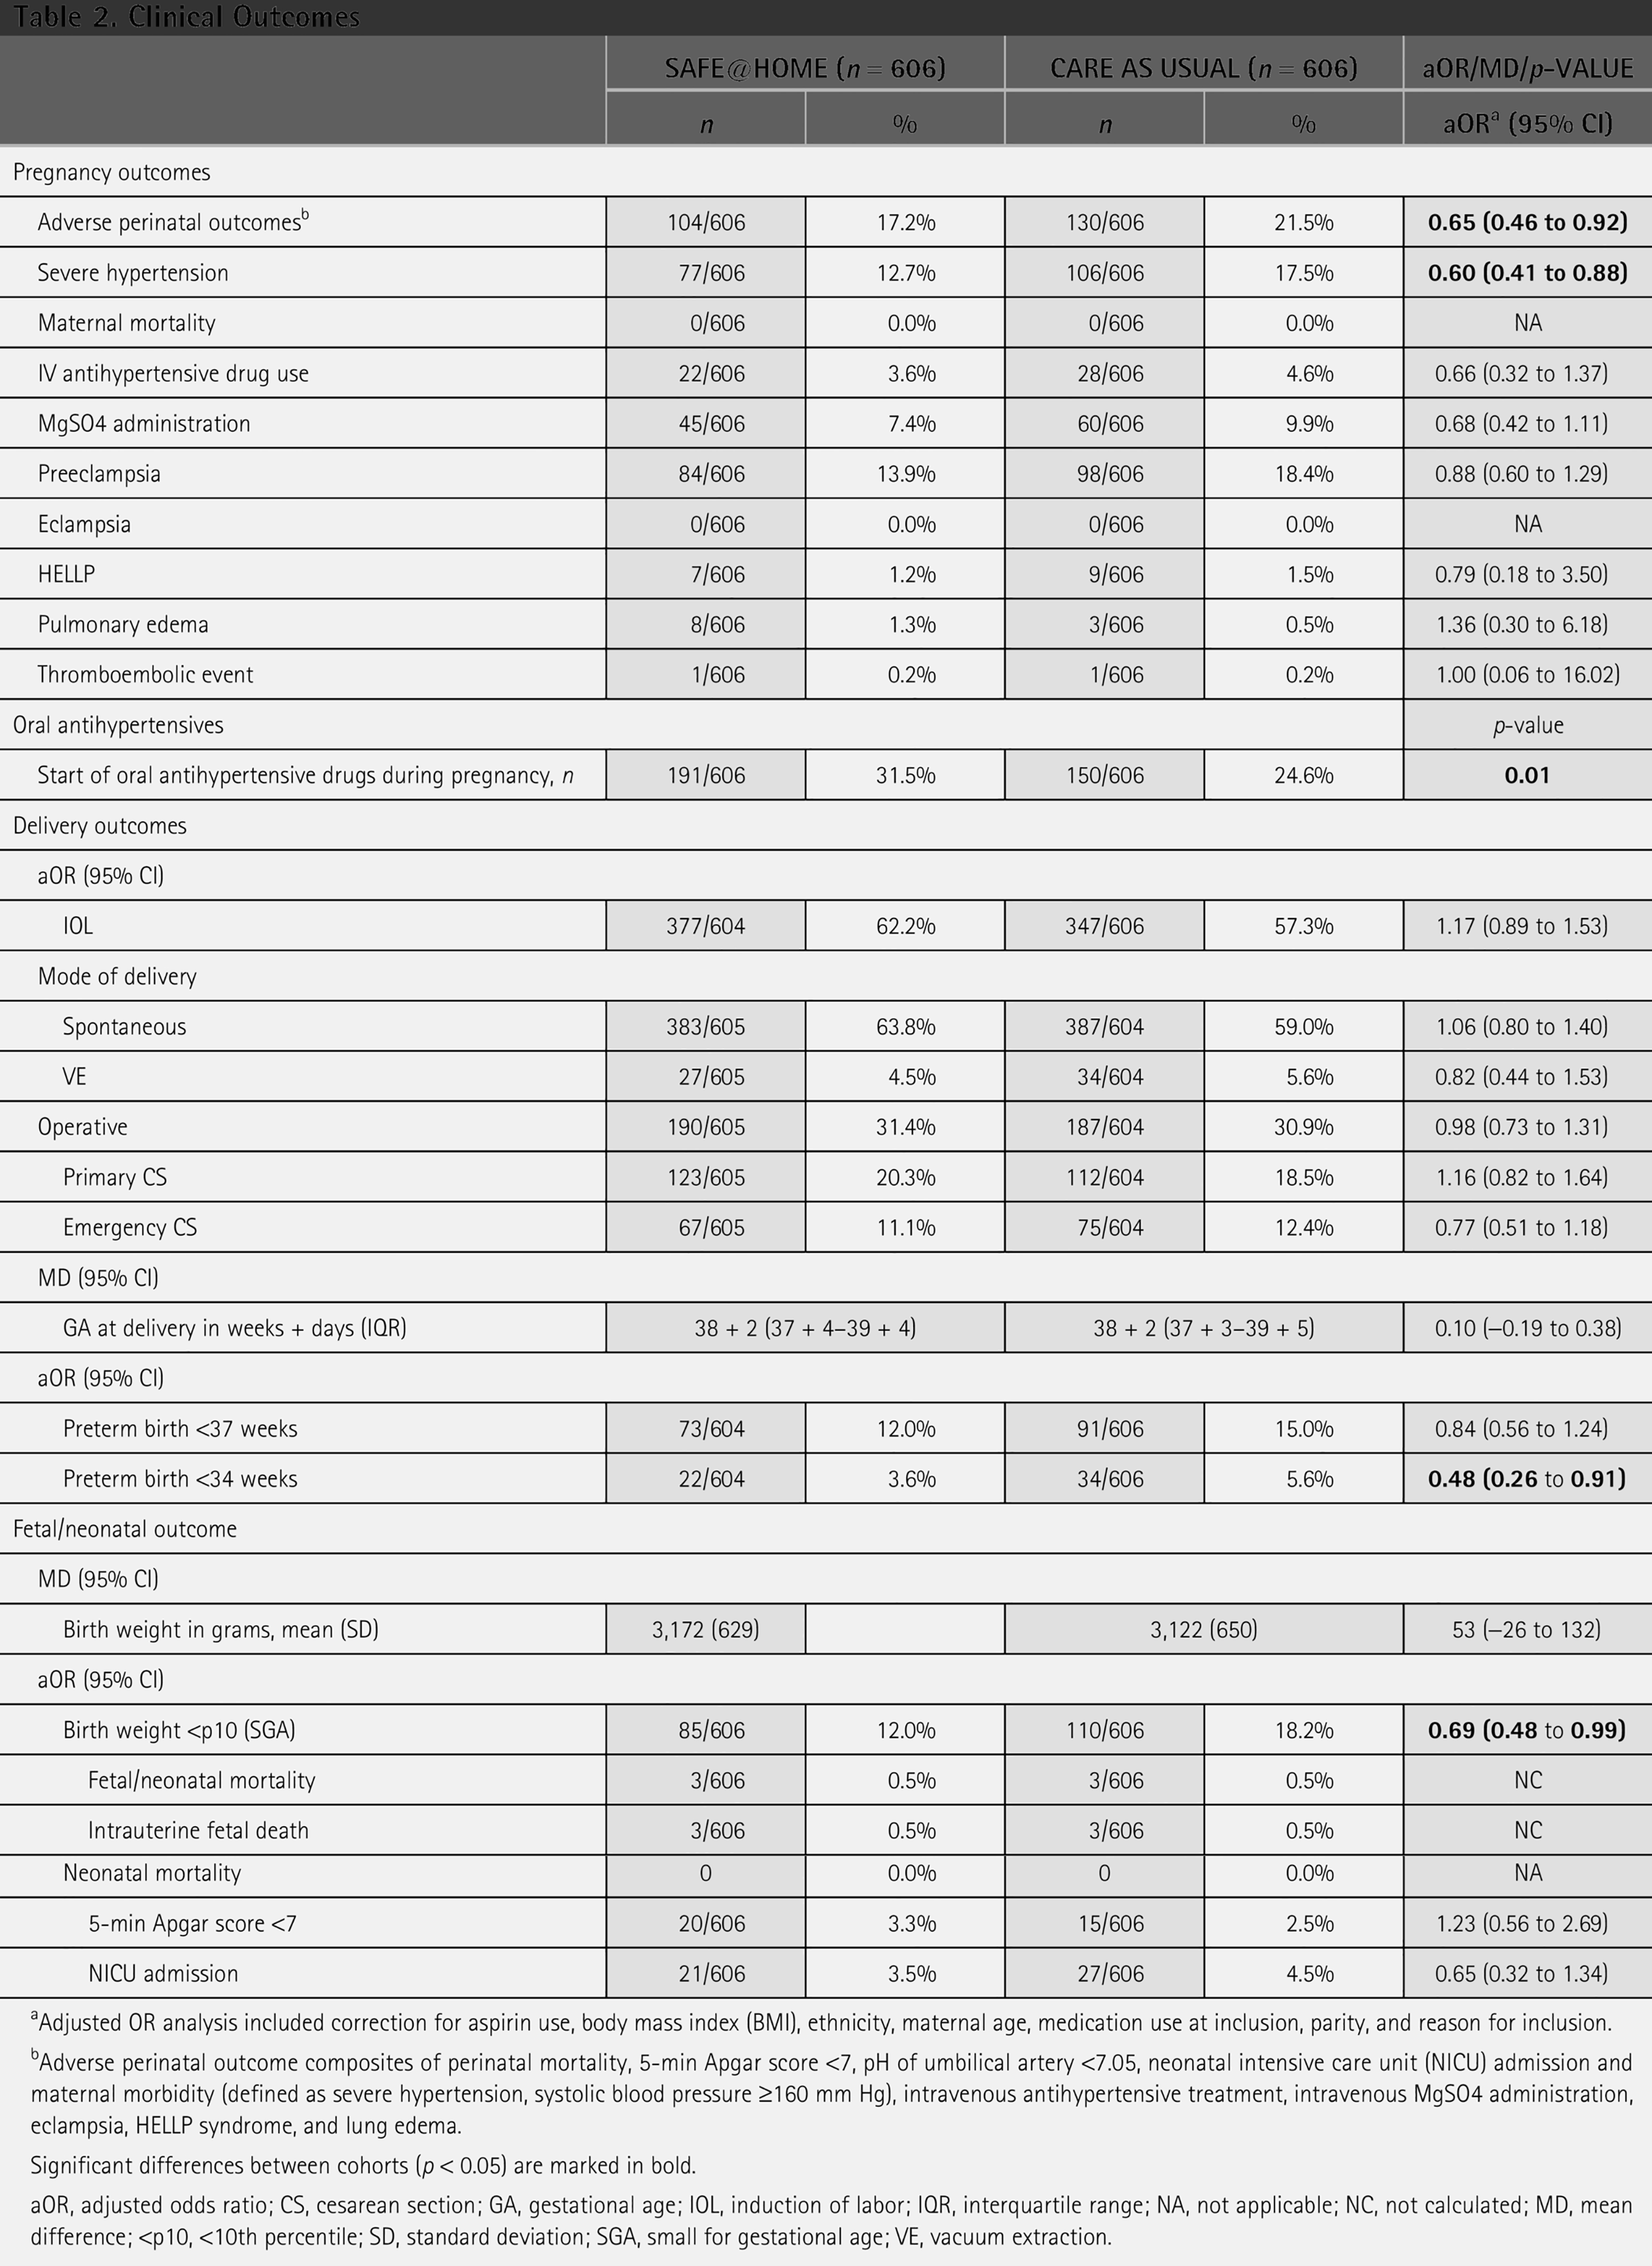
Adjusted OR analysis included correction for aspirin use, body mass index (BMI), ethnicity, maternal age, medication use at inclusion, parity, and reason for inclusion.
Adverse perinatal outcome composites of perinatal mortality, 5-min Apgar score <7, pH of umbilical artery <7.05, neonatal intensive care unit (NICU) admission and maternal morbidity (defined as severe hypertension, systolic blood pressure ≥160 mm Hg), intravenous antihypertensive treatment, intravenous MgSO4 administration, eclampsia, HELLP syndrome, and lung edema.
Significant differences between cohorts (p < 0.05) are marked in bold.
aOR, adjusted odds ratio; CS, cesarean section; GA, gestational age; IOL, induction of labor; IQR, interquartile range; NA, not applicable; NC, not calculated; MD, mean difference; <p10, <10th percentile; SD, standard deviation; SGA, small for gestational age; VE, vacuum extraction.
HEALTH CARE CONSUMPTION AND COST-EFFECTIVENESS
The mean (SD) and median (IQR) number of health care consumption are included for all patients, see Table 3. There was a significantly lower number of HDP-related admissions in the SAFE@home cohort (n = 73, 12.0%) compared with the CAU cohort (n = 94, 15.5%) (p = 0.039). The number of women who had multiple admissions was lower in the SAFE@home group (n = 6, 1.0%) compared with the usual group (n = 23, 3.8%), and the mean length in days of these admissions was shorter (7.17 vs. 10.70). The mean number of biometry or Doppler ultrasounds was lower in the SAFE@home group (1.61 [SD 2.19]) than in the CAU group (2.02 [SD 2.58]) (p = 0.009). No significant difference was found in the mean number of outpatient visits between SAFE@home and CAU, with 13.4 and 13.5 visits, respectively (p = 0.769). At the center level, eight sites showed fewer outpatient visits in the SAFE@home group compared with the CAU group, of which two sites had a significant difference (Site 1: 12.90 vs. 14.19, p = 0.01; Site 7: 12.60 vs. 13.76, p = 0.02). At the three remaining sites, a nonsignificant opposite effect was observed, with more visits in the SAFE@home group compared with the CAU group (Supplementary Appendix Fig. SA1). Mean total antenatal costs per patient are shown in Table 4. Costs SAFE@home were €6,756 (€5,144) per patient, and Costs CAU were €7,142 (€5,149) per patient, corresponding with a mean cost reduction of €386 or 5.4% per patient in total antenatal costs. All MDs of health care consumption costs were negative (i.e., in favor of SAFE@home).
Mean with Standard Deviation and Median with Interquartile Range per Health care Consumption Category
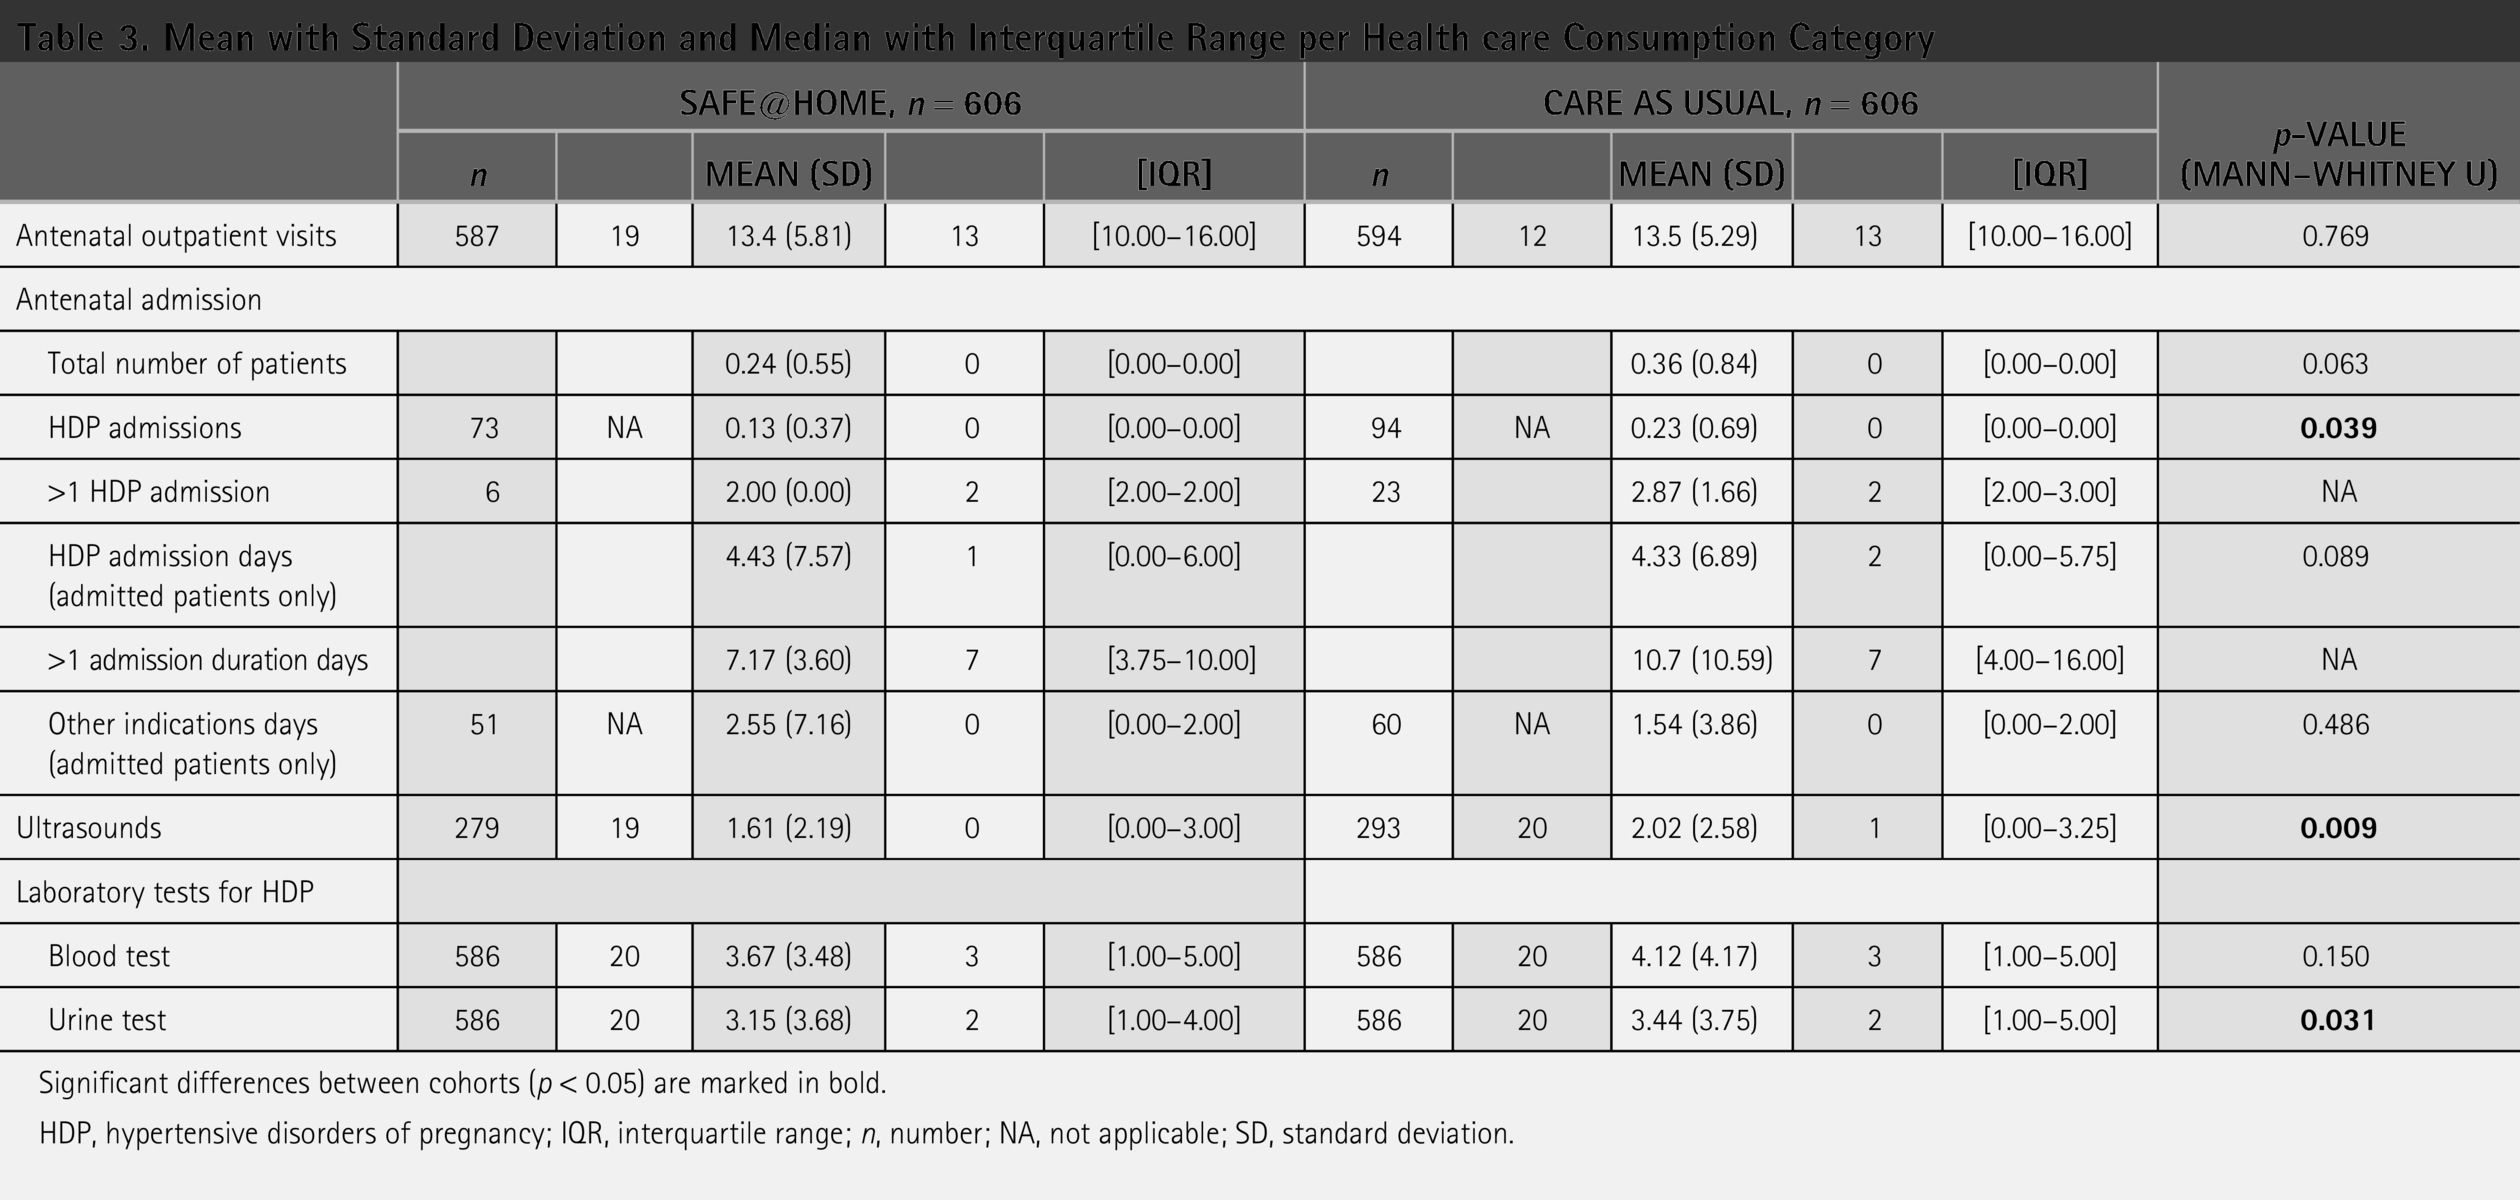
Significant differences between cohorts (p < 0.05) are marked in bold.
HDP, hypertensive disorders of pregnancy; IQR, interquartile range; n, number; NA, not applicable; SD, standard deviation.
Health care Consumption Costs per Cohort, Mean (Standard Deviation), Median (Interquartile Range), and Mean Difference
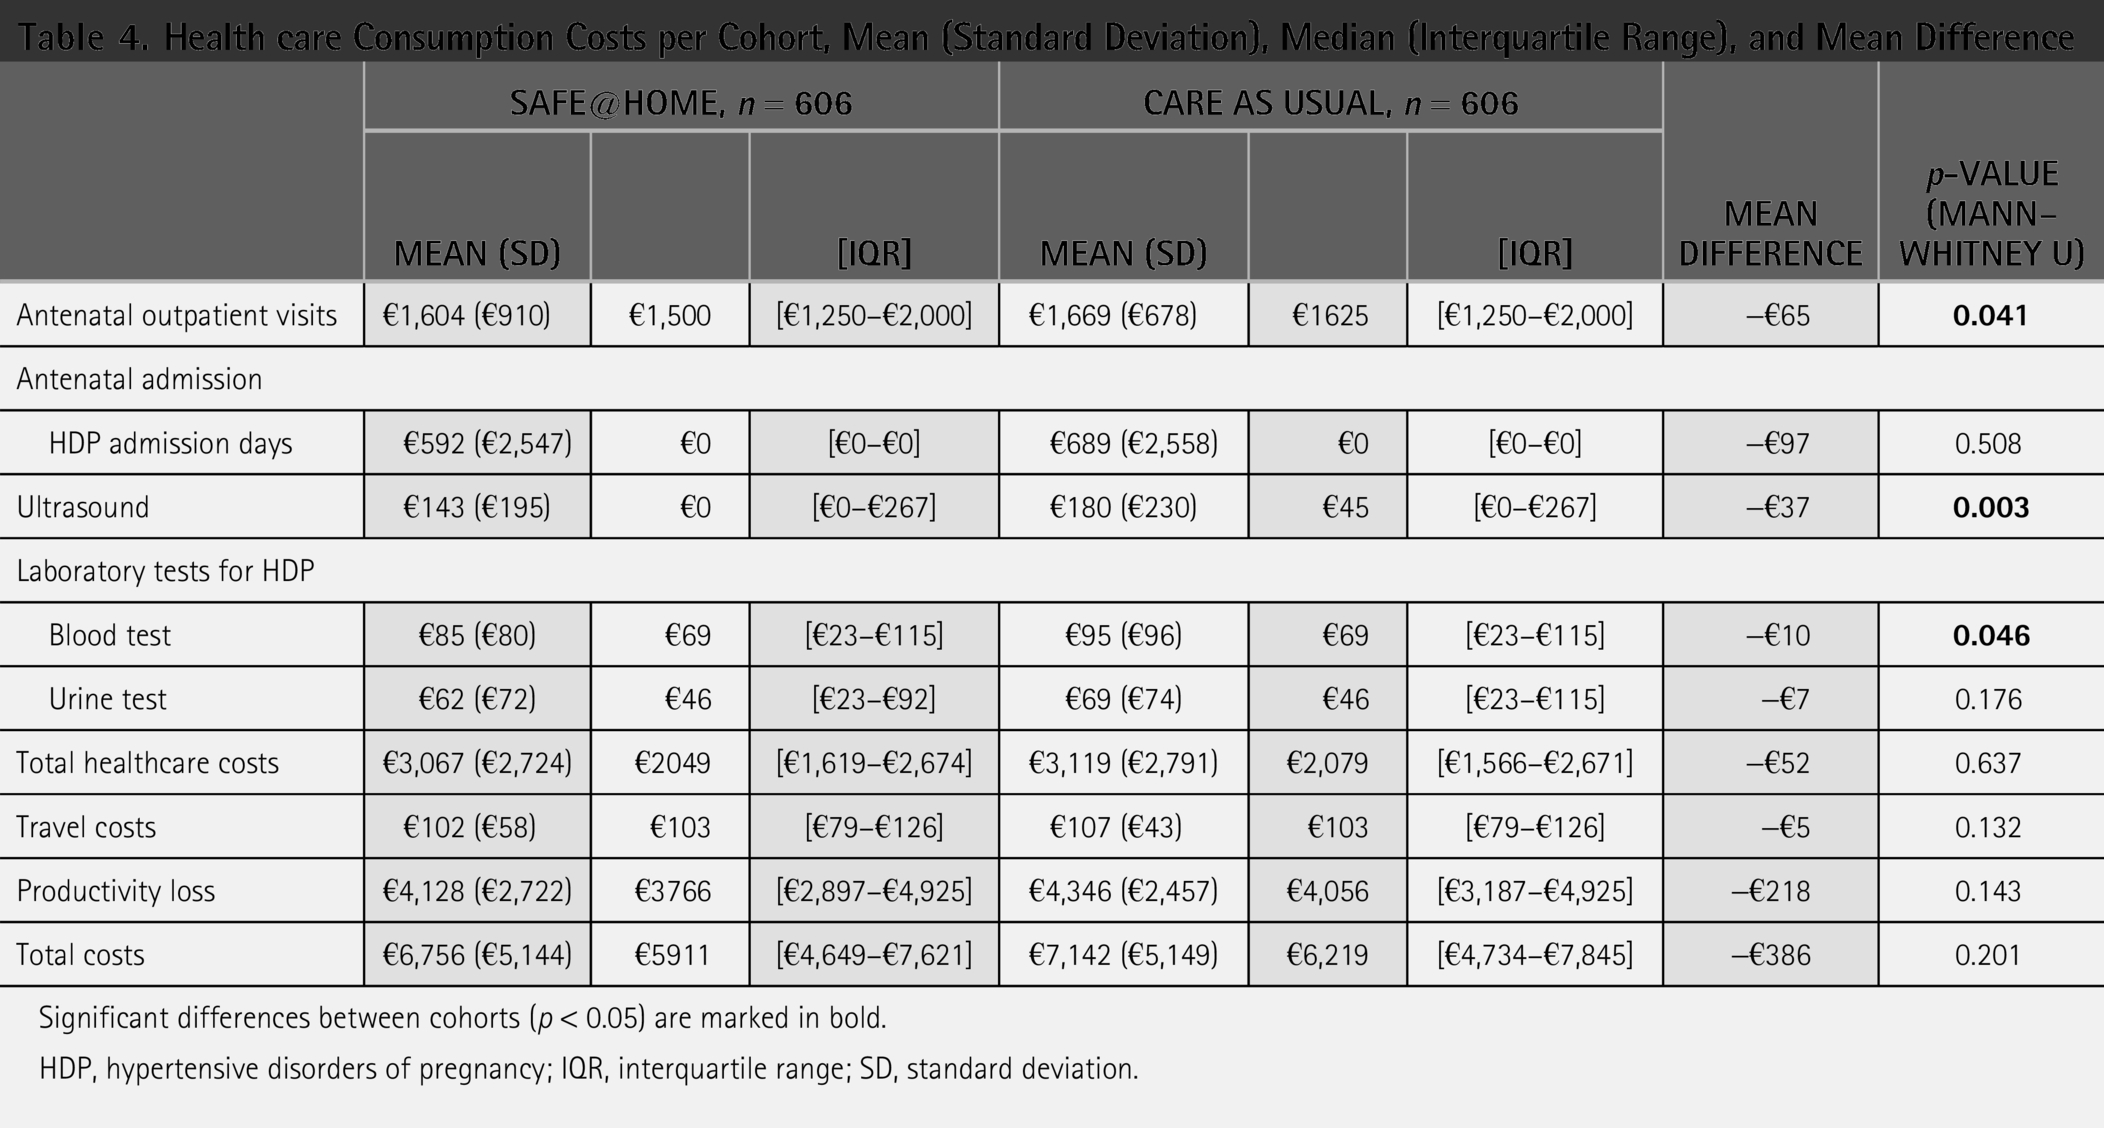
Significant differences between cohorts (p < 0.05) are marked in bold.
HDP, hypertensive disorders of pregnancy; IQR, interquartile range; SD, standard deviation.
With n = 104 (17.2%) adverse outcomes in SAFE@home, compared with n = 130 (21.5%) in the CAU group, the ARR was 4.3%, that is., 0.043. As such, the ICER formula results in a negative ICER, as SAFE@home is cost saving and has better outcomes with lower adverse outcomes compared with CAU; thus, in health economics terms, SAFE@home dominates CAU.
Further analysis of health care consumption per adverse outcome revealed cost saving during pregnancy of €765 per participant with an adverse outcome, with mean SAFE@home costs of €9,701 compared with mean CAU costs of €10,466 per patient. For patients with adverse outcomes, the mean cost of HDP admissions was €2,219 in the SAFE@home group compared with €2,381 in the CAU group (MD €163). Costs for biometry or Doppler ultrasounds were €159 versus €209 (MD €50), costs for blood test were €140 versus €165, and costs for urinary tests were €87 versus €99 (MD €12), in the SAFE@home group and the CAU group, respectively. The overall costs per adverse outcomes were €4,191 with SAFE@home compared with €4,603 with CAU (MD €412), corresponding to a 9.0% cost reduction.
Discussion
MAIN FINDINGS
This CEA comparing antenatal costs of telemonitoring using SAFE@home with CAU in pregnancies with high risk of or with established HDP demonstrated a modest cost reduction in the overall analyses as well as in the analysis per adverse outcome. In addition to these economic savings, the SAFE@home cohort demonstrated a notable reduction in HDP-related admissions, characterized by fewer overall admissions, shorter duration, and a decrease in repeated admissions compared with the CAU group. Further reductions were observed in the number of ultrasounds and overall healthcare consumption costs, underlining the potential of telemonitoring to optimize resource utilization. As such, the use of SAFE@home leads to an improvement in clinical outcomes while reducing costs compared with CAU.
INTERPRETATION
Unlike the findings of the SAFE@home pilot study by our research group, 15 which demonstrated nearly 20% antenatal cost reduction primarily due to a decrease in outpatient visits, our study observed only a 5% decrease in mean antenatal costs with no significant difference in the number of antenatal outpatient visits. This suggests that telemonitoring did not consistently substitute for outpatient visits as planned in the SAFE@home care path. At the center level, the majority of eight centers observed fewer outpatient visits in the SAFE@home group, with two centers showing significant reductions. Notably, in the center with the most experience using SAFE@home, telemonitoring was associated with significantly fewer visits, suggesting that health care professional familiarity may be key to achieving efficiency. However, three sites showed an opposite trend with slightly more visits in the telemonitoring group. These findings imply that scaling up telemonitoring requires not only technological implementation but also behavioral and procedural integration among healthcare professionals. Especially in centers that are new to telemonitoring, the novelty of the program may lead professionals to refer patients more frequently for in-person consultations when uncertain about reported symptoms or measurements during home monitoring. This underscores the need for training, protocol adherence, and experience-building to enable telemonitoring to effectively reduce hospital visits.
Importantly, telemonitoring was associated with better clinical outcomes. While the exact mechanisms remain uncertain, several plausible explanations are supported in literature. Daily BP self-monitoring may increase patient awareness and engagement, leading to improved adherence and earlier detection of complications. 16 Real-time data sharing allows professionals to intervene sooner, potentially preventing escalation of HDP. Moreover, enhanced patient–professional communication and self-management education have been shown to improve BP control in HDP. 22 These mechanisms may contribute to the observed reduction in adverse outcomes.
Consistently with the findings of the SAFE@home pilot study, Lanssens et al. (2018) highlight the potential of telemonitoring to reduce health care costs and minimize hospital visits in women with gestational hypertension.15,23 The discrepancy between earlier studies and our multicenter findings may be attributed to scaling effects, as protocol fidelity becomes more challenging due to variations in local procedures and a larger number of professionals involved.
In line with our modest cost saving observed, 20 a 2020 systematic review of 17 economic evaluations in telehealth concluded that, although telehealth provides significant patient benefits and increases productivity, it does not routinely lower healthcare costs for the system. 24 This suggests that, despite the theoretical monetary advantages of telemonitoring, the actual cost savings for healthcare systems may be more limited than expected.
However, cost-effectiveness extends beyond direct antenatal costs alone. While our findings indicate only a modest cost reduction, telemonitoring may still offer efficiency gains through reduced personnel effort and improved resource allocation. The shift from in-hospital to remote monitoring potentially alleviates workforce pressure, which is particularly relevant given current staffing shortages. Furthermore, our cost calculations did not account for structural funding challenges, as telemonitoring services are not yet fully integrated into existing reimbursement models. Despite the lack of funding specific to this care, our findings support telemonitoring systems as a feasible and scalable approach for high-risk pregnancies, achieving modest cost savings while improving clinical outcomes.
STRENGTHS AND LIMITATIONS
A strength of this study is its use of cost-effectiveness metrics, combining clinical outcomes with economic data to offer a comprehensive evaluation of telemonitoring’s impact. The analysis of health care consumption was detailed, including reductions in admissions, length of hospital stays, and diagnostic procedures, such as ultrasounds. This approach provides valuable insight into the cost drivers of antenatal care in a high-risk population.
However, several limitations must be acknowledged. Variability in the adoption of digital health technology across centers may have affected the overall impact observed in this implementation study. Unfortunately, we were unable to explore these differences in detail due to the low number of cases per center. Additionally, the calculation of cost-effectiveness relied on combined data and MDs, which may not fully capture specific cost drivers within different health care consumption categories. The use of observational data and predefined cost categories may also have introduced bias, particularly in the presence of variations in care or documentation practices between centers. Moreover, baseline differences between groups may have contributed to the observed differences in outcomes. Nonetheless, this approach was necessary given the pragmatic real-world nature of the study and the structure of the available data. Cost data were collected retrospectively from routine care records, which limited the ability to capture all individual components uniformly. Furthermore, the costs of telemonitoring equipment and platform usage were not included in the current analysis. These costs were excluded due to substantial variations across hospitals, reflecting differences in contractual arrangements. As a result, the use of predefined categories and combined cost measures was the most feasible and reliable option to ensure comparability and completeness of the data across centers. Moreover, the use of MDs in costs aligns with standard practices in economic evaluations, 17 especially in studies where randomization is not feasible and sample sizes are limited.
FUTURE RESEARCH
The initial implementation costs of telemonitoring platforms, including expenditures for design, setup, and training, can pose short-term budgetary challenges for health care organizations. Traditional cost-accounting methods in health care such as standardized cost prices often fail to provide detailed insights into the exact time and resources allocated per patient or process step, leading to inaccuracies in cost calculations and allocations. Future research should therefore focus on the broader economic perspective, particularly its potential to improve the allocation of scarce health care resources. For instance, by reducing the need for inpatient admissions, telemonitoring may facilitate the reallocation of hospital capacity, which is especially relevant in settings with workforce shortages and capacity constraints. Further investigation is needed into how telemonitoring affects workforce efficiency, time use, and patient-related expenses. Additionally, research should investigate reimbursement models and long-term healthcare utilization, as the lack of standardized funding mechanisms remains a key challenge for sustainable telemonitoring adoption. A more granular approach, such as time-driven activity-based costing (TDABC), could help identify inefficiencies and optimize resource allocation.5,25 TDABC can also support the development of sustainable cost strategies, especially as telemonitoring integrates into routine care. 26
Conclusions
This CEA showed that the use of a digital platform in a scale-up setting resulted in a modest overall antenatal cost reduction. However, patients receiving telemonitoring had a lower rate of adverse outcomes; fewer HDP-related admissions and lower antenatal costs per adverse outcome were observed. As such, SAFE@home is cost saving and associated with better outcomes compared with CAU; thus, with a negative ICER, SAFE@home dominates CAU. The level of adoption across centers is a key determinant of cost-effectiveness outcomes and may significantly influence both costs and clinical impact. Future research should assess the potential of telemonitoring to improve the allocation of scarce resources. Its effects on workforce efficiency, time use, and patient-related expenses require further examination. In conclusion, overcoming adoption barriers and expanding the evidence base are imperative to establish telemonitoring as a transformative, cost-effective tool in the future.
Authors’ Contributions
S.L.M.: Conceptualization, data curation, formal analysis, investigation, methodology, project administration, visualization, writing—original draft, and writing—review and editing. C.v.L.: Methodology, formal analysis, visualization, and writing—review and editing. I.K. and E.S.: Methodology, visualization, and writing—review and editing. E.I.A., J.D., L.v.E., A.F., R.d.H., S.J.G., S.K., F.v.d.M., L.S., and M.S.: Resources and writing—review and editing. T.A.L.: Funding acquisition, supervision, and writing—review and editing. K.A.: Writing—review and editing. M.D.: Conceptualization, supervision, validation, writing—original draft, and writing—review and editing. M.N.B.: Conceptualization, funding acquisition, supervision, validation, writing—original draft, and writing—review and editing.
Footnotes
Acknowledgments
The authors are grateful to all the women who participated in the SAFE@home II study and to the obstetric healthcare professionals for their time in responding to the questionnaires and for their valuable insights. They also appreciate the support of the healthcare professionals at University Medical Center Utrecht, Bravis Hospital, Jeroen Bosch Hospital, Maasstad Hospital, Erasmus Medical Center, St. Antonius Hospital, University Medical Center Groningen, Elisabeth-Tweesteden Hospital/Fam, St. Franciscus Gasthuis Hospital, Reinier de Graaf Hospital, and Maastricht University Medical Center for facilitating patient recruitment and data collection.
Funding Information
This research was partially funded by grants from Health Holland Top Sector Life Sciences & Health (Public Private Partnership Allowance) and The Prevention Early Diagnostics and E-health Foundation (Stichting Preventie Vroegdiagnostiek en E-health [PVE]). Health Holland and Stichting PVE had no involvement in the study design, data collection, data analysis and interpretation, report writing, or the decision to submit the article for publication.
Ethics Statement
This study was approved by the local Medical Research Ethics Committee of the UMC Utrecht, approval reference METC 20-422, on August 11, 2020.
Disclosure Statement
The authors have no conflicts of interest to declare.
Supplemental Material
References
Supplementary Material
Please find the following supplemental material available below.
For Open Access articles published under a Creative Commons License, all supplemental material carries the same license as the article it is associated with.
For non-Open Access articles published, all supplemental material carries a non-exclusive license, and permission requests for re-use of supplemental material or any part of supplemental material shall be sent directly to the copyright owner as specified in the copyright notice associated with the article.