






Abstract
We describe the physical processes that affect the formation, trapping, and outgassing of O2 at Europa and Ganymede. Following Voyager measurements of their ambient magnetospheric plasmas, laboratory data indicated that the observed ions, which were mostly ejected from volcanic Io, would in turn impact and sputter their surfaces. This would decompose the ice and produce thin oxygen atmospheres. More than a decade later, Europa’s O2 atmosphere was inferred from observations of the O aurora, and “condensed” O2 bands were observed in Ganymede’s icy surface at 5773 and 6275 Å. More than another decade later, their atmospheres were shown to have a dusk/dawn enhancement, confirmed by recent Juno data. Although the incident plasma produces these observables, processes that occur within the topmost surface are still not well understood. Here, we note that the incident plasma particles produce a nonequilibrium defect density locally in the surface ice grains. Defect diffusion within these grains leads to the formation of voids and molecular products, some of which are volatile. Although some volatiles are released into the satellite atmospheres, others are trapped at defect sites or trapped in voids, which create gas bubbles whose lifetimes (in steady state) are limited by the plasma-induced destruction rate. Here, we discuss how trapping competes with the annealing of the radiation damage. We describe the differences observed at Europa and Ganymede and roughly determine the observed trend with latitude of O2 bands observed on Ganymede’s trailing hemisphere. This understanding is used to discuss the relative importance of “condensed” O2 and O2 adsorbed on regolith grains as atmospheric sources, accounting for dusk/dawn enhancements and temporal variability reported in “condensed” O2 band depths. Since plasma-induced damage and thermal annealing timescales drive oxidant variability on icy moons (likely also Callisto, Dione, and Rhea), they can help determine volatile downwelling, a potentially metabolic source for their oceans, and upwelling of other trapped oxidants (e.g., CO2), suggestive of ongoing geologic activity.
Introduction
Energetic ions and electrons in the Jovian magnetosphere (Lanzerotti et al. 1978; 1983) impact the icy surfaces on Europa and Ganymede (e.g., Cooper et al., 2001; Nordheim et al., 2018) and cause the sputter ejection of molecules from their surfaces (e.g., Davis et al., 2021; Johnson, 1990; Teolis et al., 2017). The concomitant radiolysis is manifested by the production of thin atmospheres that contain H2 and O2 (Johnson et al. 1982), products of the decomposition of ice in their surface grains (e.g., Reimann et al., 1984) as inferred from spacecraft and remote sensing observations (e.g., de Kleer et al., 2023; Hall et al., 1995; Roth et al., 2016). Equally interesting are the absorption bands seen in reflectance, also indicative of radiolytic decomposition of ice: “condensed” O2 (Calvin et al., 1996; Spencer et al., 1995; Trumbo et al., 2021) seen also at Callisto (Spencer and Calvin, 2002), H2O2 (e.g., Trumbo et al., 2019,2023; Wu et al., 2024), O3 (Noll et al., 1996; Ramachandran et al., 2024), and oxidized contaminants (Carlson et al., 2017) all trapped in the surface ice grains. The “condensed” O2 bands have been suggested to result from dimer absorption in solid O2 (e.g., He et al., 2021; Michalsky et al., 1999), although some data suggest that the band shapes might be better fitted if the ice also contains CO2 (Migliorini et al., 2022). These bands are also present in gas phase O2, either by collision-induced absorption (CIA) by pairs of O2 or from van der Waals bound (O2)2 dimers. CIA requires densities far higher than what exists in the Galilean satellite atmospheres, and bound dimers in the gas phase are challenging to isolate in laboratory experiments. Since the satellite atmospheres are tenuous and the surface temperatures are such that O2 is volatile down to the depth of the thermal wave, the “condensed” O2 bands were suggested to be due to O2 trapped in radiation-produced voids (Calvin et al., 1996; Johnson and Jesser, 1997, hereafter JJ). Indeed, since O3 is not readily produced during the irradiation of ice, its presence in Ganymede’s surface is consistent with its production by excitation of “condensed” O2 trapped in the large, near-surface, ice grains (Johnson and Quickenden, 1997, hereafter JQ). These observed bands are also consistent with the preferential loss of H2 from the irradiated icy surfaces as suggested by ambient plasma measurements (e.g., Cooper et al., 2001; Szalay et al., 2024) and modeling (e.g., Carberry Mogan et al., 2022). Below, we refer to energetic particles generically as a plasma; we acknowledge that the term generally refers to bulk electrons and ions in the satellite tori.
Since individual O2 molecules trapped at defect sites or in vacancies and voids are difficult to detect, the “condensed” O2 bands, which are associated with the excitation of pairs of O2 molecules, have proven to be useful. However, these bands, associated with multiple O2 inclusions and often referred to as dimer excitations, do not account for all the O2. Therefore, in addition to O2 being driven into the satellite atmospheres and O2 trapped in ice grains, we suggest that O2 is transiently adsorbed and desorbed on grain surfaces and exists as a gas that permeates their porous regolith (Johnson et al., 2003). That is, the spatial and temporal variations in the ambient atmospheres have been suggested to be due to thermal release of individual O2 trapped at defects (e.g., Johnson et al., 2019; Teolis and Waite, 2016). Interestingly, the “condensed” O2 band depths exhibit significant temporal variability with times short compared with the satellite orbital periods (e.g., Spencer et al., 2019; Trumbo et al., 2021). This aspect confirms that radiation processing is active; it produces both gas-phase and trapped species in competition with their destruction and thermal annealing of the radiation damage.
Motivated by such observations, and by the modeling of the dusk/dawn atmospheric enhancements (Oza et al., 2018,2019), confirmed by recent magnetic field observations by Juno (Addison et al., 2024), below we discuss the physics of O2 trapping in and its ejection into the very thin atmospheres on Europa and Ganymede, and we address the observed temporal and spatial variations. We first review aspects of the now extensive laboratory data and then describe our understanding of “condensed” O2 formation as well as its relevance to the satellite observations. Useful satellite data are given in Table 1, and the activation energies of the relevant physical processes are provided in Table 2.
Relevant Satellite Data for Europa and Ganymede’s Sunlit Trailing and Leading Hemispheres
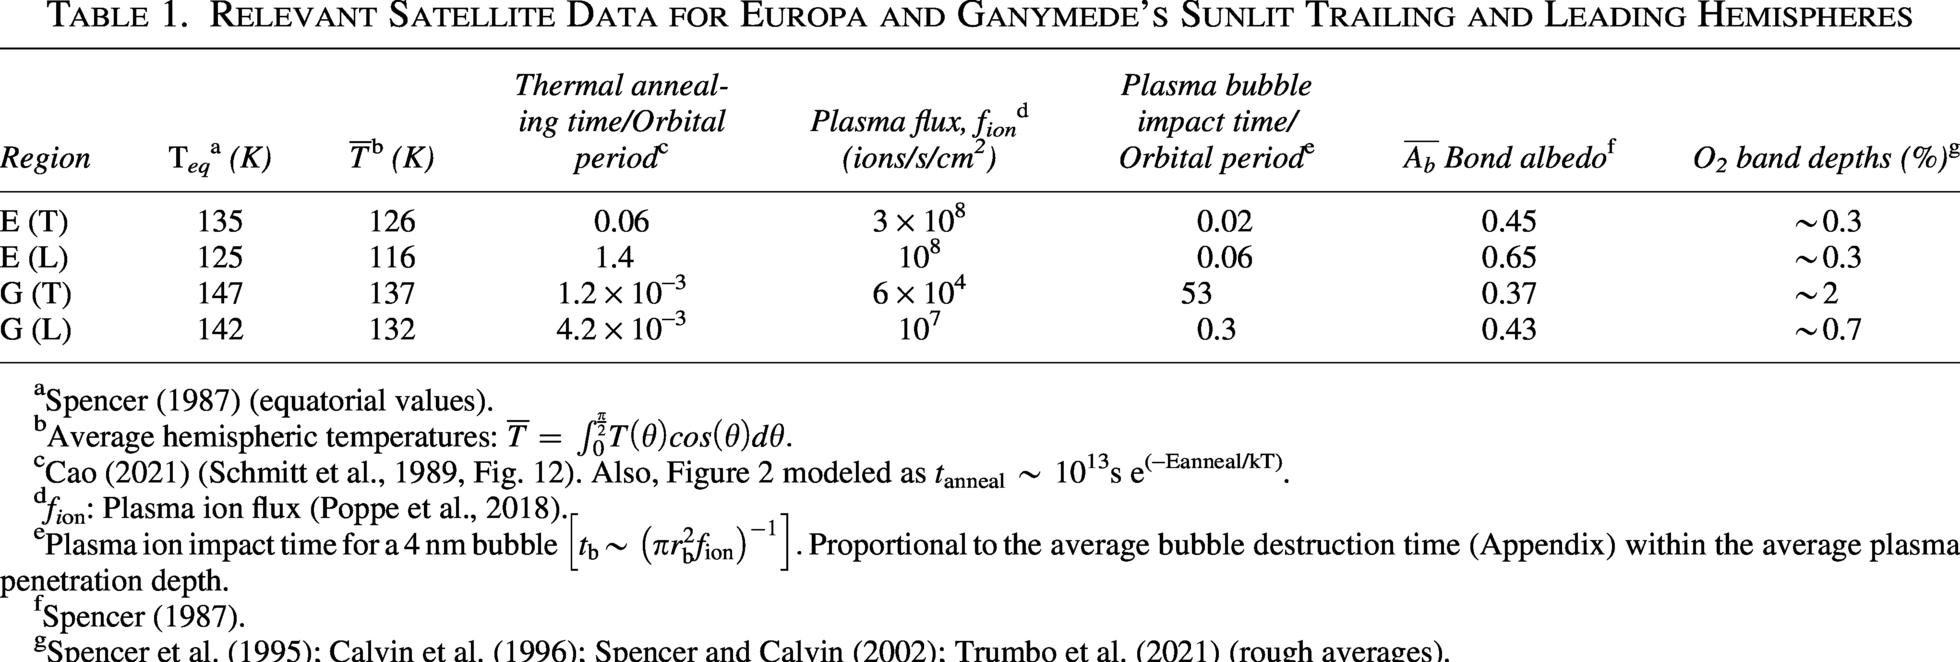
Relevant Satellite Data for Europa and Ganymede’s Sunlit Trailing and Leading Hemispheres
Spencer (1987) (equatorial values).
Average hemispheric temperatures:
Cao (2021) (Schmitt et al., 1989, Fig. 12). Also, Figure 2 modeled as tanneal ∼ 1013s e(−Eanneal/kT).
fion: Plasma ion flux (Poppe et al., 2018).
Spencer (1987).
Activation Energies Discussed: exp(−Ea/kT)
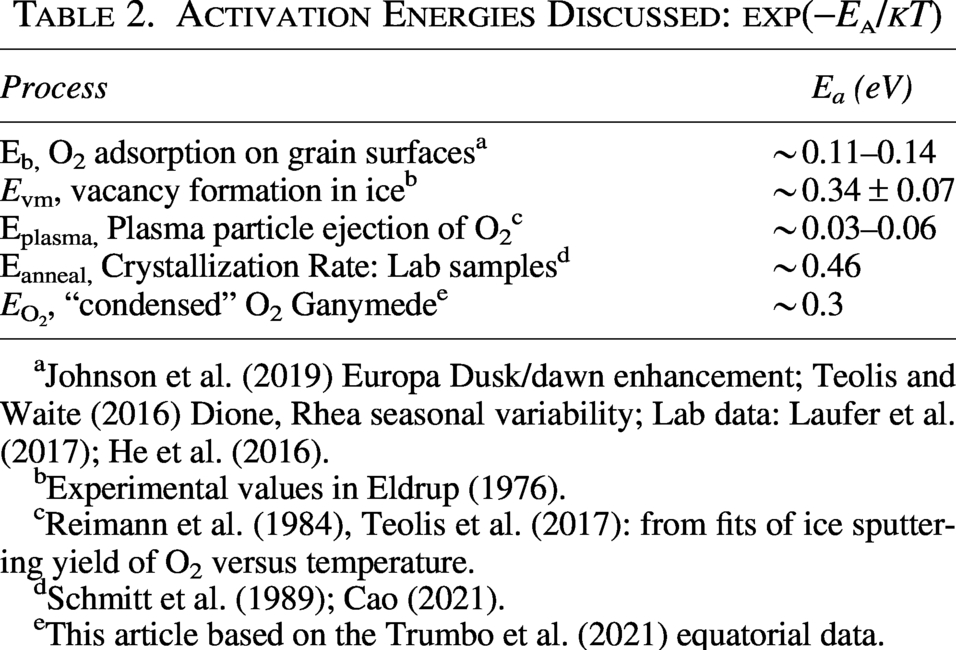
Johnson et al. (2019) Europa Dusk/dawn enhancement; Teolis and Waite (2016) Dione, Rhea seasonal variability; Lab data: Laufer et al. (2017); He et al. (2016).
Experimental values in Eldrup (1976).
Reimann et al. (1984), Teolis et al. (2017): from fits of ice sputtering yield of O2 versus temperature.
This article based on the Trumbo et al. (2021) equatorial data.
Whereas crystalline ice has an equilibrium density of defects determined by the temperature (e.g., de Koning, 2020), incident energetic ions and electrons produce an over-density of displacements and interstitials that form a “track” of vacancies and radicals along their paths through ice. The region around the “track” is transiently heated by the excess energy deposited, which leads to diffusion of these defects and reactions. After that, transient heat dissipates, and defect diffusion continues, determined by the background temperature. As the solid anneals, the vacancies and interstitials can recombine (annihilate) or be incorporated into various sinks. The diffusing radicals that react with vacancies contribute to annealing (i.e., recrystallization), or they can react to form new chemical species. The diffusing vacancies can also accumulate and produce voids (e.g., Okada et al., 2020). Voids produced by electron irradiation are readily seen in electron microscope studies of ice up to the peak temperatures on Ganymede, with their production and growth affected by impurities (Heide and Zeitler, 1985). During annealing, small voids can be absorbed by larger voids, which reduces the net surface to volume ratio, a process often referred to as Oswald ripening. This process also produces segregated precipitates in solids (e.g., Gusak et al., 2006). Void disappearance with increasing temperature is seen in studies of small grain, microporous ice, presumably due to mobility in the presence of extensive grain surfaces. Diffusion and reactions are, of course, enhanced along the pathway formed by penetrating radiation (Bénit and Brown, 1990) as well as along surfaces: for example, the atmosphere interface, grain boundaries, and internal surfaces in voids. Such processes have been extensively discussed, particularly for room temperature solids exposed to energetic particle radiations (e.g., Jiang et al., 2022; Wiedersich, 1972), and the early studies of the radiolysis of ice are summarized in JQ.
The diffusion of H atoms, produced by proton implantation or by molecular dissociation, has been shown to form H2 in several materials (e.g., Behrisch and Eckstein, 2007), including ice (Christianson and Garrod, 2021). Depending on the temperature, the resulting H2 can also diffuse efficiently (e.g., Patterson and Saltzman, 2021), often along grain boundaries, and can desorb at an external surface. However, when H2 is formed in or enters a void, it can become more stably trapped and form a gas bubble. This is well studied and leads to the swelling of highly irradiated, room temperature solids (e.g., Vook et al., 1975) as well as to the formation of H2 bubbles in ultraviolet irradiated low temperature ice (Tachibana et al., 2017). Therefore, data on fast proton and alpha particle production of H2 and He gas bubbles in reactor walls were used early on (e.g., JJ) to help understand the “condensed” O2 observations at Ganymede. That is, like H, radiolytically produced O can diffuse along surfaces or defect pathways and react at defect sites to produce transiently trapped O2. Or, if the reaction occurs on a surface in a void, it can lead to more stably trapped O2, which we will refer to at times as a bubble. The presence of oxygen bubbles in Antarctic and Arctic ices, formed by co-deposition, is well established (e.g., Miller, 1969) and even confirmed in thin samples (e.g., Bahr et al., 2001). However, interior O2 bubbles have not been directly identified in radiation-processed ice. Such formation and trapping of O2 was suggested early on by its release on warming relatively thick irradiated samples (e.g., JQ). Also, a luminescence feature in photolyzed ice was used to suggest that O2 can form at an interior surface from diffusing O atoms (Matich et al., 1993). But convincing laboratory studies are still needed. Although attempts have been made to explain the formation of O2 in irradiated ice using gas-phase reaction rates (e.g., Li et al., 2022), the relevant processes in solids differ significantly. That is, even at the highest temperatures on Ganymede (∼160 K), O2 is not soluble in crystalline ice, so that defect sites and surfaces play a critical role, for example, appendix of Johnson et al. (2003). Therefore, below we focus on processes that occur in solids.
Because of the relatively efficient diffusion of H in ice at satellite temperatures, its subsequent desorption from irradiated samples enhances the production of oxidants (Brown et al., 1982). This has been confirmed by many subsequent experiments, as summarized by Teolis et al. (2017), and rediscovered regularly (e.g., Abellan et al., 2023). Of course, in the presence of carbon, sulfur, and so on, other oxidized species are produced due to the preferential loss of H2, as seen in reflectance spectra (e.g., Carlson et al., 2017). Laboratory studies indicate that the production and ejection of O2 exhibits a dose dependence consistent with the dissociation, on average, of two water molecules per O2 ejected (e.g., Reimann et al., 1984) or with the formation and the excitation of a precursor (Sieger et al. 1998; Orlando and Sieger, 2003). In addition, the O2 yield is small and independent of T below ∼60–80 K (e.g., Davis et al., 2021; Teolis et al., 2017), roughly consistent with defect mobility becoming efficient above ∼0.3–0.5 times the melting temperature (e.g., JJ). With increasing temperature, the ejection of O2 from irradiated laboratory ice samples increases, indicative of an activated process, but with an unexplained activation energy (e.g., Reimann et al., 1984). Here, we suggest that the extracted activation energy is determined by the surface tension of ice (see Appendix A1).
Primary products are formed in irradiated ice other than those discussed above. As extensively observed, the OH produced can react with impurities or react to produce H2O2 (e.g., Mifsud et al., 2022), a species seen in irradiated ice samples as well as in the reflectance spectra of Europa and Ganymede (e.g., Trumbo et al., 2021). Although not volatile, when formed in voids, H2O2 inclusions can also build up. Therefore, Cooper et al. (2003) suggested that H2O2 molecules trapped in voids might react with increasing temperature or be excited by radiation and contribute to the production of O2 bubbles, a suggestion not yet confirmed. Although O2 formation and ejection increase with increasing ice temperature (e.g., Reimann et al., 1984), above ∼150–160 K rapid recrystallization occurs, and the O2 yield drops. In contrast, H2O2 appears to be a stable product at lower temperatures (e.g., Teolis et al., 2017). Indeed, at Ganymede, peroxide is preferentially concentrated in the cold polar regions (e.g., Bockelée-Morvan et al., 2024), while the “condensed” O2 bands are seen to be dominant at the warmer lower latitudes. At Europa, however, peroxide is also seen in some low latitude regions, possibly collocated with other trace species such as CO2 (Trumbo et al., 2019; Wu et al., 2024). Therefore, the solid-state chemistry that occurs in ice (Johnson et al., 2003) still requires considerable work. Ice irradiation experiments at ∼10 keV suggest peroxide-rich regions on Europa (e.g., Tara and Powys regions) are radiolytically enhanced by the presence of CO2 (Mamo et al., 2025), also likely affected by the available oxidant trapping described here. After we describe below how irradiation-induced O2 can be formed and trapped in voids, using data in Tables 1 and 2, we consider its contribution to the icy satellite atmospheres.
O2 Bubble Formation: Satellite Versus Laboratory Surfaces
Although laboratory studies show that the radiation-induced decomposition of ice leads to the formation of O2 and H2, the absence of direct detection of the “condensed” O2 bands in irradiated samples remains a problem. The samples typically studied differ significantly in porosity and grain size from those on satellite (e.g., Cassidy and Johnson, 2005) and comet surfaces (Oza and Johnson, 2024). The vapor-deposited laboratory samples tend to be small grain, microporous and thin, in order to reduce charging by the incident particles. On the contrary, the reflectance data for the icy Galilean satellites suggest their surfaces are composed of large, primarily crystalline, grains of ∼100 µm to 1 mm (e.g., King and Fletcher, 2022; Ligier et al., 2019; Stephan et al., 2020). These surfaces are presumed to be fairy castle structures with a very high pore space between such grains. Because of their high porosity, the satellite regoliths are permeated with atmospheric volatiles, and the area accessible to incident radiation is much larger than the satellites’ geometric surface.
Surface temperatures and “condensed” O2 band depths are extracted from the reflectance at visible wavelengths. However, these spectra depend on grain size, porosity, contaminant concentration, and radiation damage; thus, the reflectance data, although critical, are not simple to interpret. For instance, since crystalline ice is transparent in the visible, surfaces observed in reflectance can appear dark or bright in the visible for a number of reasons: dark due to, for example, significant concentrations of absorbing contaminants or highly transparent with few absorption and scattering sites; bright due to, for example, small grains or large grains with a high density of defects that act as scattering sites. Surfaces that are bright in the visible can also be produced by radiation damage (e.g., Famá et al., 2010; Johnson, 1985) or by returning H2O ejected by sublimation, sputtering, or venting (e.g., Li et al., 2020), producing a fine-grain frost (Trumbo et al., 2023; Villanueva et al., 2023). Although modeling indicates that O2 can be formed and trapped, even at very low temperatures in small grains in irradiated ices in the interstellar medium (Jin and Garrod, 2020), the satellite surfaces differ considerably. Therefore, in the following, we assume the observed “condensed” O2 is primarily formed and trapped in voids produced by irradiation of relatively large ice grains. We imagine a hierarchy of sizes: average grain size ≫ visible wavelength ≫ average bubble radius. We also presume that plasma particles that produce the “condensed” O2 are primarily those with penetration depths comparable to the depths sampled by the reflected photons.
In addition to the physical differences discussed, radiation dose rates in laboratory studies are many orders of magnitude larger than those experienced by grains in the icy regoliths. Whereas thermally driven recrystallization rates in laboratory studies of irradiated low-temperature ice samples are typically not relevant, that is not the case for all regions of the icy Galilean satellite surfaces. Because the fate of radiation damage is determined by a variety of diffusion processes, here we use the thermal annealing rate as a crude proxy for the processes that occur following radiation damage of ice (Table 3). Although crystallization studies of amorphous or vapor-deposited ice exhibit significant scatter (e.g., Baragiola, 2003; Cao, 2021), we use the result in Schmitt et al. (1989) as a guide, which is roughly consistent with an activation energy Eanneal∼0.46 eV. These data suggest a large range of annealing rates across the satellite surfaces, varying from minutes at the peak temperature on Ganymede’s trailing hemisphere to on the order of the orbital period at Europa and at high latitudes on Ganymede, as indicated in Table 1. Therefore, the lack of direct laboratory detection of the “condensed” O2 bands in irradiated ice samples we suggest is due to the disparity between annealing and radiation damage rates, as well as the grain size issue discussed above. Although critically important, the application of the available laboratory data to the icy satellite observations is not straightforward.
Early studies of the release of H2 and O2 on warming of thick samples exposed to penetrating radiation are suggestive (JQ). New studies, possibly using electron microscopy (e.g., Abellan et al., 2023), on relatively thick annealed samples are needed. This is critical as the absence of direct laboratory observations of radiolytically induced “condensed” O2 bands has led to the suggestion that O2 cold traps exist in the topmost ice layer of the icy Galilean satellites (e.g., Vidal et al., 1997; Baragiola and Bahr 1998). However, even for porous icy regoliths, the thermal skin depths are several centimeters, which implies that low temperatures sufficient to form O2 are unlikely. This is especially the case at low latitudes on Ganymede’s sunlit trailing hemisphere where “condensed” O2 band depths are strongest at the equator ∼147 K.
Since incident plasma particles transiently supersaturate the local defect density, the growth of voids that results in bubbles of trapped volatiles is governed by the flux of vacancies versus the recrystallization rate (e.g., JJ; Jiang et al., 2022) as discussed above. However, incident radiation that penetrates a gas-filled void (bubble) can also cause dissolution of the bubble and dispersion of the trapped species. That is, bubble damage, which is typically ignored, competes with aggregation and growth. Under steady irradiation, a quasi-equilibrium is established: higher dose rates produce a high density of smaller, on average, bubbles that have higher interior surface energies (e.g., Gittus, 1978; Tachibana et al., 2017). Therefore, in the presence of annealing, the average bubble dimension varies inversely, but slowly, with the radiation damage rate. Noting that the defect production rate is roughly proportional to the energy deposition rate, dE/dt, JJ referred to an estimate of the average radius, rb, of gas “bubbles” produced under steady energetic particle implantation as

Here, x is a small exponent, x ∼ 1/4 in Gittus (1978), and D(T) accounts for the relevant diffusion processes. In our discussions below, the temperature dependence of the recrystallization rate of ice is used as a proxy for these processes. In addition, a rough estimate for the average void radius under steady irradiation, accounting for growth by vacancy diffusion and void destruction, is derived in Appendix A2. It has a similar form to that in Eq. 1 but with x ∼ ½, verifying the inverse dependence on the irradiation rate. These expressions suggest that a low flux of highly penetrating plasma particles, with a lower energy deposition per unit path length, penetrating a higher temperature ice can lead, on average, to larger bubbles.
Whereas Europa’s surface experiences a more intense and diverse plasma flux, at low latitudes, Ganymede’s field tends to deflect the heavy thermal ions that cause surficial damage and brightening. In the presence of higher average surface temperatures and lower fluxes of primarily penetrating particles, larger band depths on Ganymede should not be surprising. These “low latitude” observations, discussed below, appear to include the open-closed field line boundary region (Fig. 1 in Trumbo et al., 2021) in which the Juno-JADE instrument detected a flux of 30–100 keV electrons (Ebert et al., 2022). From Galileo encounters in the Jovian plasma sheet, simulations also suggest Ganymede’s mini-magnetosphere shields electrons below 40 MeV at the equator (Liuzzo et al., 2020), which, based on Eq. 1, enhances bubble formation. In addition to producing the observed O aurora, these electrons, 4.5 keV to 100 MeV, primarily deposit their energy in the surface ice (Waite et al., 2024) to depths (∼10–100 µm) roughly consistent with the grains being modified by lightly ionizing radiation.
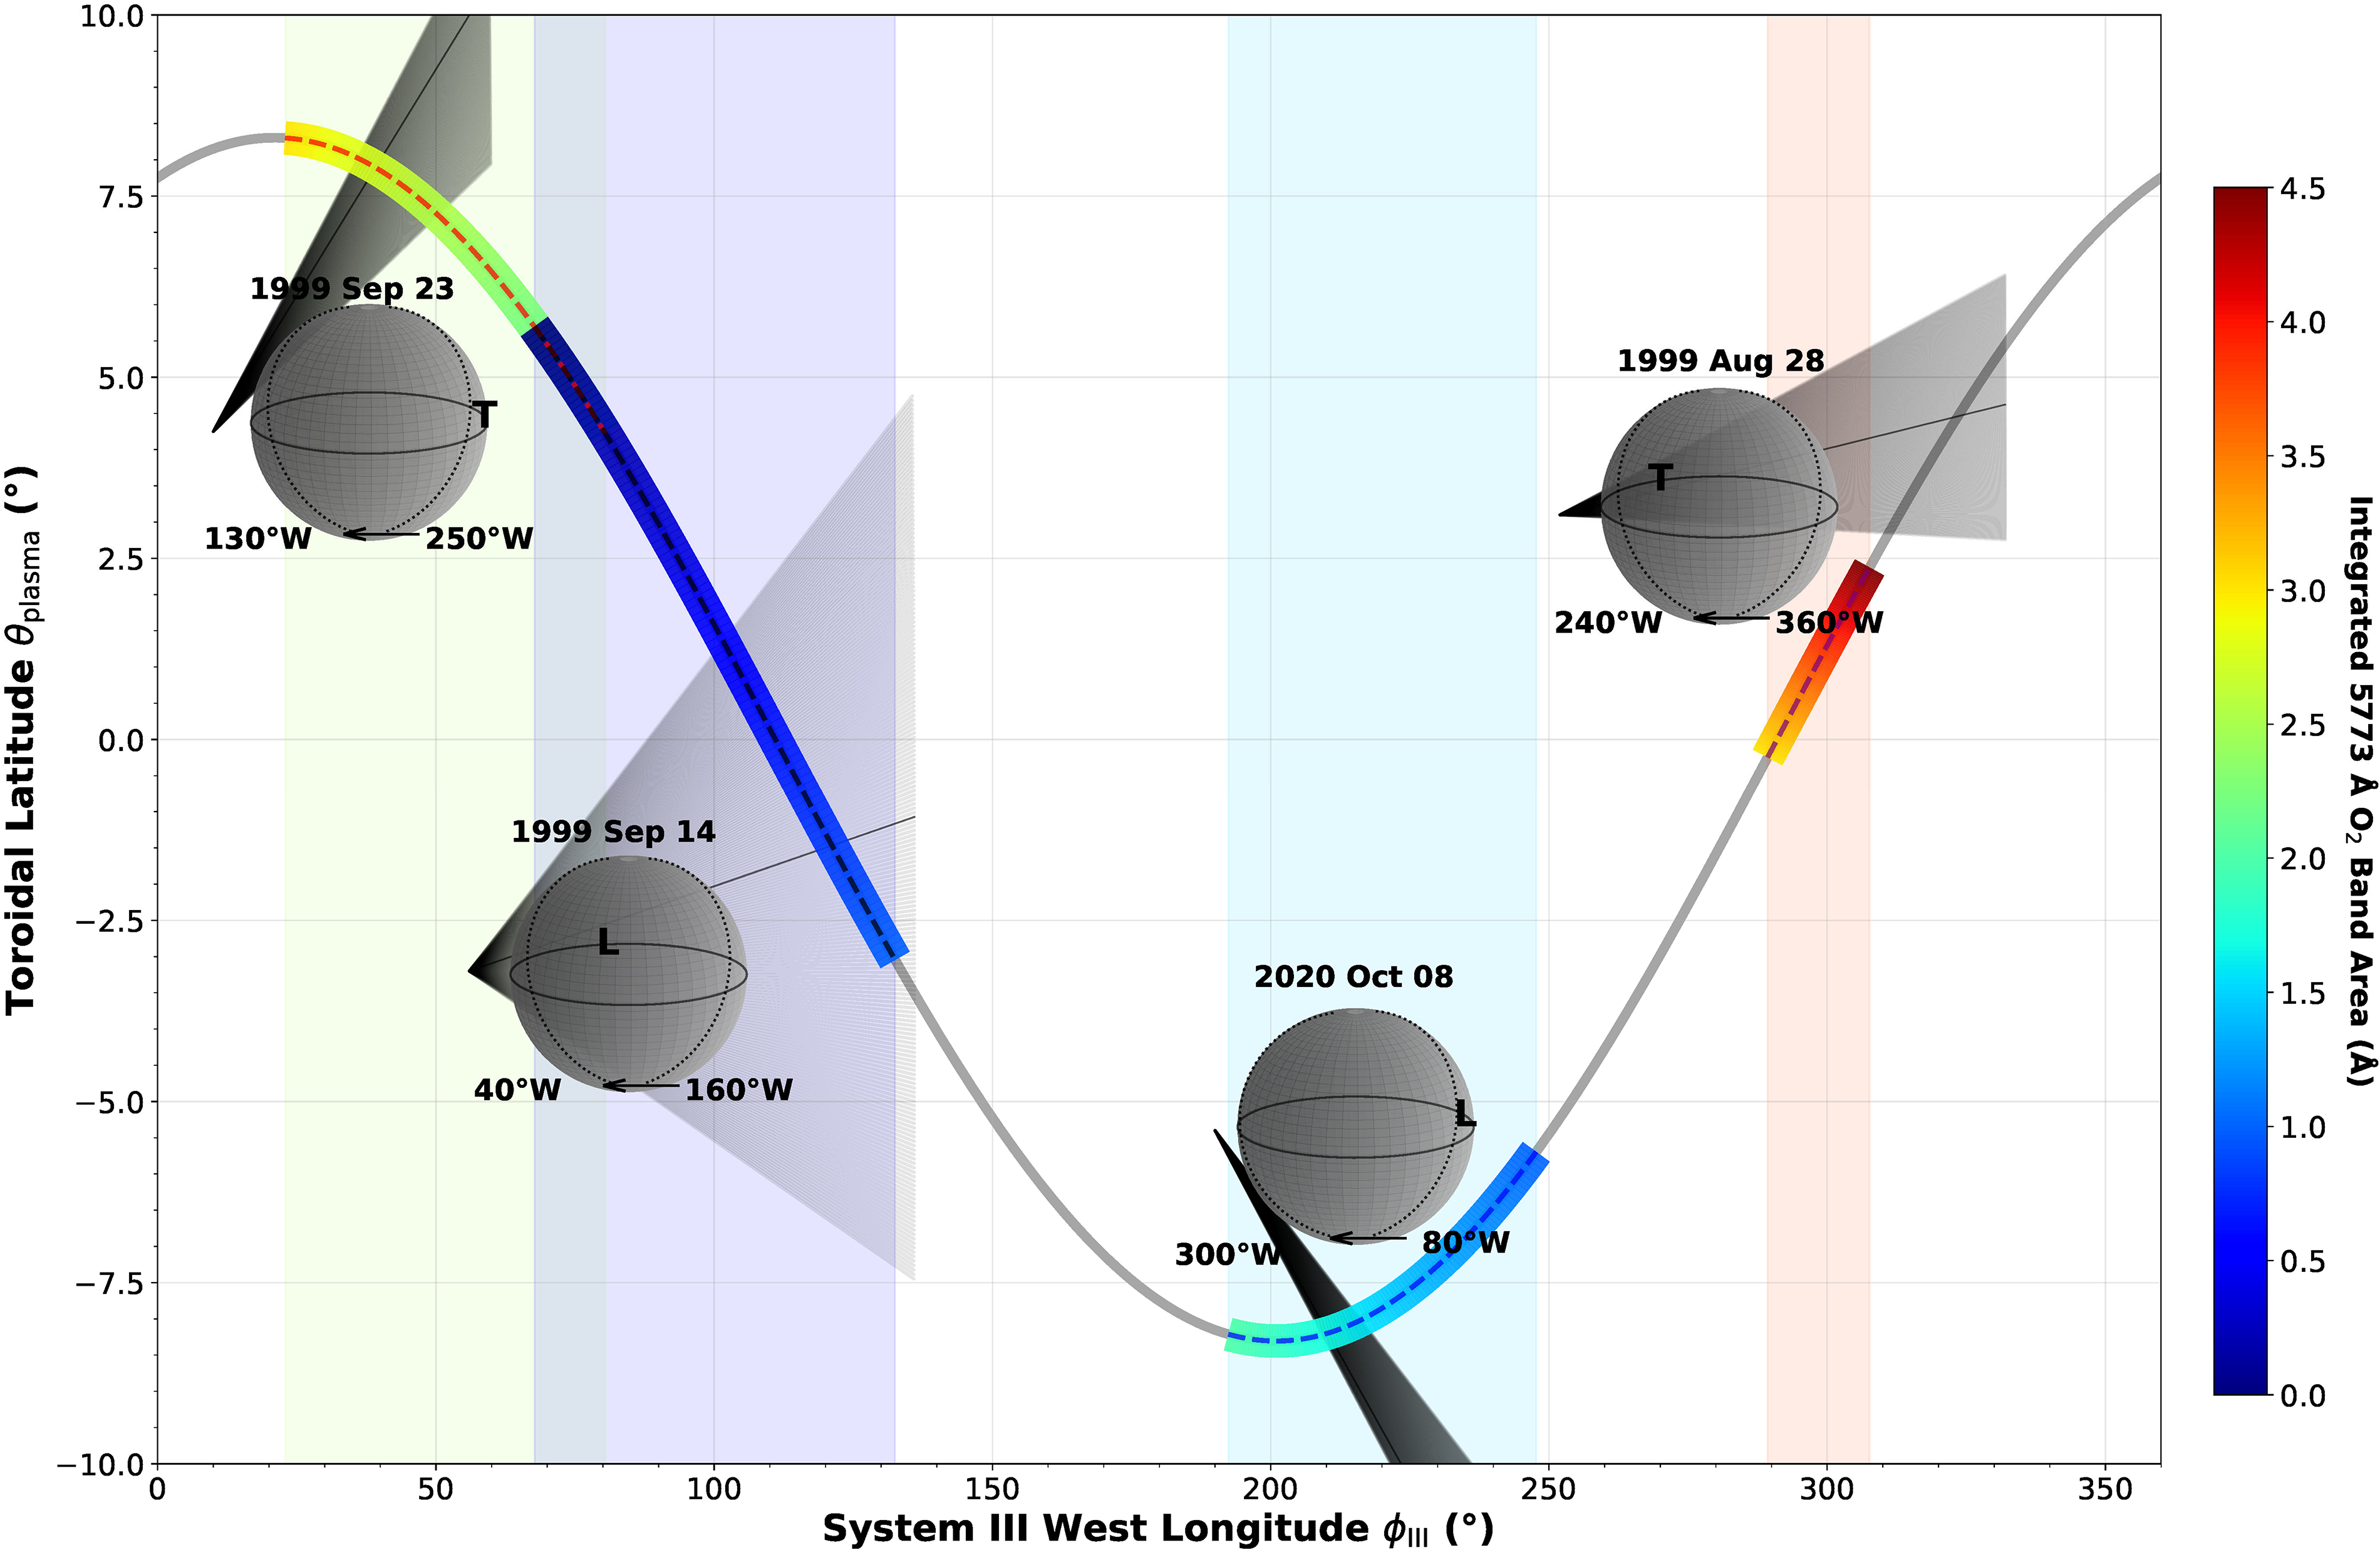
Jovian plasma sheet latitudes
Calvin et al. (1996) compared the visible bands observed on Ganymede’s trailing hemisphere to those of “condensed” O2. Based on the band shape and the local temperature, they suggested the best fits were either solid-γ or liquid O2, and they estimated absorbance maxima from the data in (Landau et al., 1962): αD ∼1.15 or 4.8/cm, respectively). Estimating the photon path length from reflectance data, they obtained ∼0.1–1% concentration of O2 to H2O. Subsequently, Hand et al. (2006) used the depth, δI, of the “condensed” O2 band and the intensity, I, of the visible reflectance to estimate the fraction of O2 in Europa’s surface ice grains. Assuming wavelengths small compared with the grain radius, rg, but large compared with internal scattering sites, they wrote

The term in square brackets is an estimate of the average path length of the reflected visible photons determined by the average grain radius, rg, and by internal scattering centers indicated by a “reflectance” parameter r0. Although they referred to a clathrate, they used an estimate for αD ∼ 1.6/cm based on solid-γ O2 at 0.577 µm with r0 ∼0.97, obtaining fO2 ∼1.2–4.7% in Europa’s surface ice (Hand et al., 2006; Hesse et al., 2022). If correct, then “condensed” O2 is clearly the dominant reservoir of O2 in the near-surface region (e.g., Johnson et al., 2003). But (αD fO22) in Eq. 2 suggests that individual O2 molecules are randomly distributed within the grains, leading to an overestimate of condensed O2 fraction. Therefore, fO22 should be replaced by fγO2, the fraction of the pathlength in solid-γ O2 which would give fγO2 < ∼0.2% at Europa. However, the applied parameters have significant uncertainties, and the brighter surface at Europa has a sampling depth in the visible that differs from that at low latitudes on Ganymede. Assuming similar grain sizes and absorption coefficients, the ratio of their observed average band depths (∼6.7) times the ratio of their albedos (0.67) suggests, very roughly, a “condensed” O2 fraction on Ganymede’s trailing hemisphere in the region sampled by the reflected photons is ∼4.5 times higher than the fraction in the region sampled by the reflected photons at Europa.
Since the pathlength through the regolith grains in the visible is critical, more detailed modeling is needed using new absorption coefficients (Calvin, 2025). This is especially so since the related infrared bands (e.g., Bockelée-Morvan et al., 2024) have not been detected as discussed in Calvin et al. (1996). Recently, Tinner et al. (2024) used steady-state sputtering measurements to estimate a broad range of possible O2 concentrations in irradiated samples for a range of grain sizes, but they did not obtain dimer concentrations.
Focusing on the available observations, we note that voids are potential sinks for trapping diffusing radicals, which can lead to the formation of more stably trapped O2, as discussed above. Void growth, controlled by vacancy migration, is an activated process depending on the background temperature (e.g., Eldrup, 1976). In their summary of “condensed” O2 observations at Ganymede, Trumbo et al. (2021; Fig. 3A) noted a very rough correlation of a drop in the “condensed” O2 band area (∼factor of 3) at low latitudes with an increase in the albedo (∼0.39→0.47). This trend is consistent with the darker trailing hemisphere having larger band areas on average than the brighter leading hemisphere (Calvin et al., 1996), as well as at the brighter high latitudes. These observations suggest that the regolith temperature plays a critical role in affecting “condensed” O2 band formation as discussed above. That is, at low latitudes on Ganymede, where the annealing rate is rapid compared with its rotation rate (Table 1), the variation of the albedo is consistent with a small average temperature drop, ΔT(ϕ), over the observing region centered on longitude ϕ from that centered on regions near ϕ ∼ 270°. If the local temperatures are roughly in radiative equilibrium, then at longitude ϕ, dT(ϕ)/T(270°) ∼ (1/4) dA/[1 − A(270°)] in which A is the visible albedo. Using the values above, the change in albedo from near 270° to near 360° west longitude is consistent with a fractional temperature change of ∼5 K, ΔT(360°)/T(270°) ∼ 0.037, close to the average temperature change suggested by observations (Table 1). Assuming the “condensed” O2 bands are determined in part by thermal processing with an activation energy EO2, and initially ignoring differences in the plasma flux and photon sampling depth, we approximate an averaged e ratio of the observed band areas as

Using the temperature ratio above suggests an effective activation energy EO2 ∼ 0.3 eV. This is a value close to the experimental value for activation energy of vacancy migration (Evm ∼ 0.34 ± 0.07 eV; Eldrup, 1976), which determines the growth rate of voids in which, we suggest, “condensed” O2 is formed and trapped.
Of course, the particle flux, background temperature, and photo-sampling depth all factor into the “condensed” O2 formation process. Therefore, it might not be surprising that in a different Ganymede observing period, a similar fractional drop in band area was observed in going from near 270° to 180° west longitude, but the band areas were somewhat smaller (Trumbo et al., 2021; Fig. 3B). Since the temperature excursion is close to that estimated above, we suggest that drop in band area is due to a difference in the plasma flux. That is, although the background temperature can affect the net “steady state” density of the gas-containing voids, the bubble formation and destruction rates depend on the radiation damage rate compared with the annealing rate (Appendix A2). Plasma variability at Ganymede is primarily due to the tilt of Jupiter’s dipole and Io’s activity. Ignoring the latter, Figure 1 shows the plasma torus latitudes at Ganymede during the observing periods summarized in Trumbo et al. (2021). Although a simple correlation with magnetic latitude was not observed for Europa’s brighter surface with weaker band depths (Spencer et al., 2019), Ganymede’s optical aurorae roughly follow the expected fall off in electron density with latitude during eclipse
Finally, it has been shown that the gas pressure in a bubble, pb, can affect its stability (e.g., JJ). Under steady irradiation, pb can build in a bubble of radius rb until it exceeds the interior surface tension, γs. For much higher pressures, the gas molecules would tend to become soluble, so that

Using γs ∼80 mJ/m2 and pb ∼nO2kT, with an average temperature on Ganymede’s trailing hemisphere (∼147 K), the maximum column of O2 confined per bubble is ∼(rb nO2) < ∼1016 O2/cm2. If we assume that nO2 approaches the liquid density, then rb < ∼0.04 µm. Of course, as is well documented in Earth’s atmosphere (McKellar et al., 1972), the “dimer” absorption also occurs during low-temperature collisions of O2 molecules. Such collisions would be frequent for any density of O2 trapped in voids. Therefore, molecular-level modeling of the formation and trapping of O2 is needed.
Radiolytically produced O2 molecules ejected from the surfaces of Europa and Ganymede primarily return (e.g., Oza et al., 2019) and rattle around in their highly porous regoliths as discussed earlier. At any time, some of these return into the atmosphere thermalized, while others are transiently trapped at defect sites on the grain surfaces (Johnson et al., 2019). Therefore, these irradiated regoliths are permeated with transiently adsorbed O2, as well as other volatile products. This is in addition to the O2 formed and trapped in voids described above. In this way, the sources of O2 to the atmosphere consist of newly produced and ejected O2, ambient O2 in thermal equilibrium with the local regolith, and the plasma-induced release of O2 from near-surface bubbles.
Globally, the radiolytic production of new O2 from ice must be in equilibrium with its destruction in the atmosphere and regolith and, to a much smaller extent, to downward geologic transport (e.g., Chyba, 2000; Johnson et al., 2003). The net destruction must also be in rough equilibrium with the loss to space of its companion decomposition product, H2 (e.g., Szalay et al., 2024). Due to the accumulation of O2 in the regolith, thermal desorption dominates direct plasma-induced production of atmospheric O2 (Johnson et al., 2019; Oza et al., 2018). As the satellite surface temperatures vary spatially and the plasma irradiation is nonuniform, the atmospheric column densities of thermalized O2 are asymmetrical (Oza et al., 2019).
Thermal desorption of O2 into these atmospheres is suggested by the modeling of observations. A binding energy to grain surfaces, Eb ∼ 0.11 eV, was estimated from the seasonal variability of O2 detected by the Cassini Ion and Neutral Mass Spectrometer (INMS) instrument as emanating from Dione and Rhea (Teolis and Waite, 2016). A very similar value, Eb ∼ 0.14 eV, was estimated (Johnson et al., 2019) to account for the size of the dusk/dawn enhancement in the O2 column density at Europa (Oza et al., 2018; Roth et al., 2016). These extracted values are remarkably consistent with the laboratory studies (He et al., 2016; Laufer et al., 2017) and represent adsorption of O2 at surface defect sites, presumably dangling H bonds. The thermal desorption rate can be roughly approximated by using the following equation:

Ice that has a significant density of voids can become fluid like (Tachibana et al., 2017), so that, under stress or temperature gradients, O2 bubbles can migrate to grain boundaries, as seen in Antarctic ice cores (Miller, 1969). Therefore, at an external surface, trapped gas can be released, aided by sputtering and thermal erosion (Dadic et al., 2010,2019). Since these processes are slow in large grains, it has been suggested that satellite surface ice with relatively stable inclusions of oxidized products could be delivered geologically to their underground oceans (e.g., Pappalardo et al., 1998), possibly supporting biology (Chyba, 2000; Hesse et al., 2022; Johnson et al., 2003).
Although bubble migration to an external surface can contribute to the local atmosphere, destruction by incident plasma primarily determines the steady-state density in ice grains (JJ). That destruction is occurring within the photon sampling depth is indicated by the temporal variability observed in the dimer band depths (Spencer et al., 2019; Trumbo et al., 2021). That is, a flux, Φ, of energetic plasma particles can penetrate bubbles of radius rb, in a time, tb ∼(π rb Φ)−1. This can destroy the trapped O2, cause reactions, as suggested by the presence of O3, and drive products into the ice matrix. Since Φ is roughly proportional to dE/dt in Eq. 1, the flux of plasma particles can destroy bubbles, as well as contribute to their formation (JJ; Appendix A2). Using rb <∼4 nm and a flux of highly penetrating plasma onto Europa of ∼108/(cm2s) (Cooper et al., 2001), the destruction time is short compared with its orbital period (tb < ∼0.1 torbit). Since the plasma flux is variable (Bagenal et al., 2015), at a minimum due to the tilt of Jupiter’s dipole (e.g., Milby et al., 2024), and the lifetime of bubbles within the photon sampling depth is short compared with the orbital period, the apparent higher variability in the “condensed” O2 absorption band depth at Europa as compared with that at Ganymede we suggest is due to the higher radiation rate and lower annealing rate. Indeed, the thermal annealing timescales in Ganymede’s equatorial region, following Eq. 5 for νb = 1013s, Ea = 0.46 eV (Schmitt et al., 2009; Cao et al., 2021) results in a bulk crystallization timescale of only ∼10–40 min or 1–4 × 10⁻³ of an orbital period (Table 2, Fig. 2), far shorter than Europa’s annealing timescales. While recent 3.1 µm JWST observations of Europa’s Tara Regio and Powys Regio (Cartwright et al., 2025) imply recent surface modification of <15 days, our estimates suggest Europa’s leading hemisphere equator crystallizes as fast as ∼5 days (1.4 europan orbits). Although far slower than Europa and Ganymede’s trailing hemispheres, the leading hemisphere equator is far faster than northern latitudes at ∼100 K approaching ∼1 Myr timescales, consistent with amorphous ice features in the infrared (Cartwright et al., 2025). The thermal region depicted in Figure 2 toward long, approximately decadal timescales is consistent with ∼5 K surface temperature changes due to Jupiter’s eccentric ∼11.86 year orbit driving seasonal annealing observed on Europa by JWST (Mergny et al., 2025) and Ganymede.
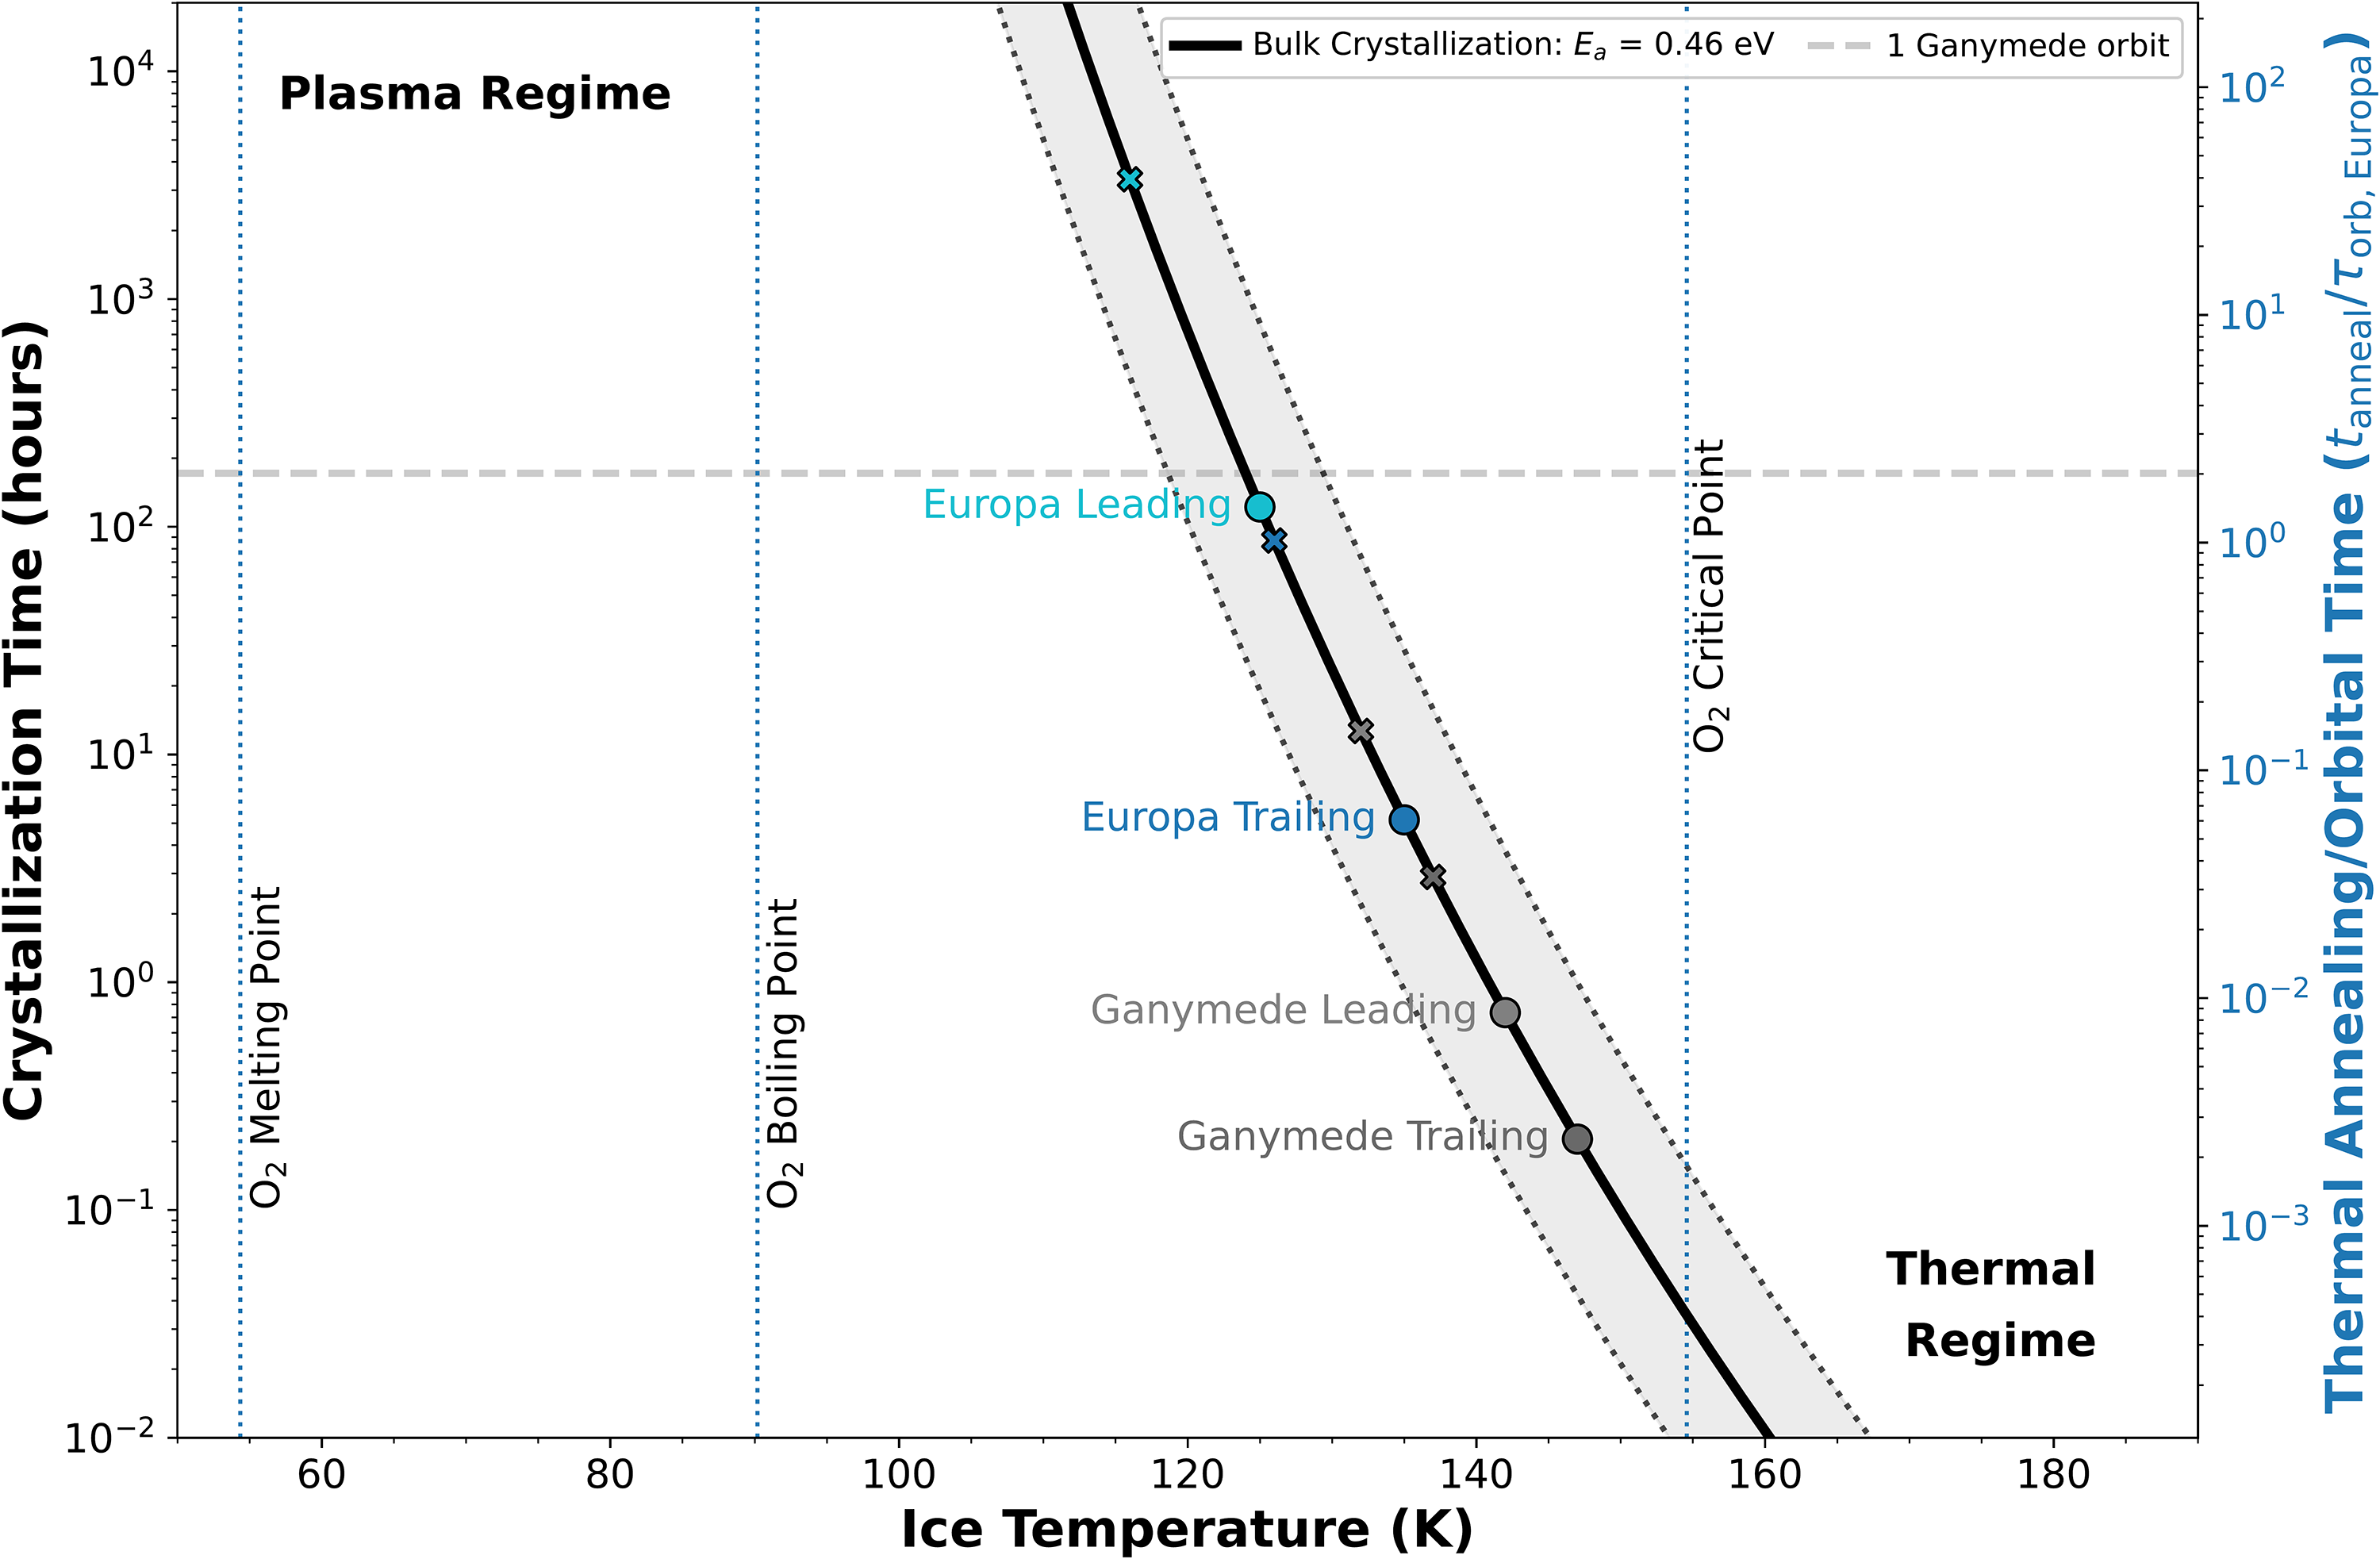
Thermal annealing timescale estimated in units of hours (left) and Europa orbital time (right: vertical axis) following tanneal ∼ 1013s e(− E / kT ) for bulk ice crystallization at Ea = 0.46 eV (Schmitt et al., 1989). The gray region bounds the approximate uncertainty in water ice annealing from experiments (Cao, 2021) roughly ±0.2 eV (dotted lines). Horizontal lines highlight approximate plasma destruction times for each moon. Europa and Ganymede’s equatorial sunlit leading and trailing hemisphere temperatures are indicated for each moon, corresponding to data in Table 2. Two approximate regimes are highlighted: (1) plasma regime (top left), similar to Europa’s northern latitudes where amorphous ice is observed, and (2) thermal regime (lower right), where the annealing time is >1000× orbital and plasma timescales similar to Ganymede’s trailing hemisphere. O2 melting, boiling, and critical points are indicated.
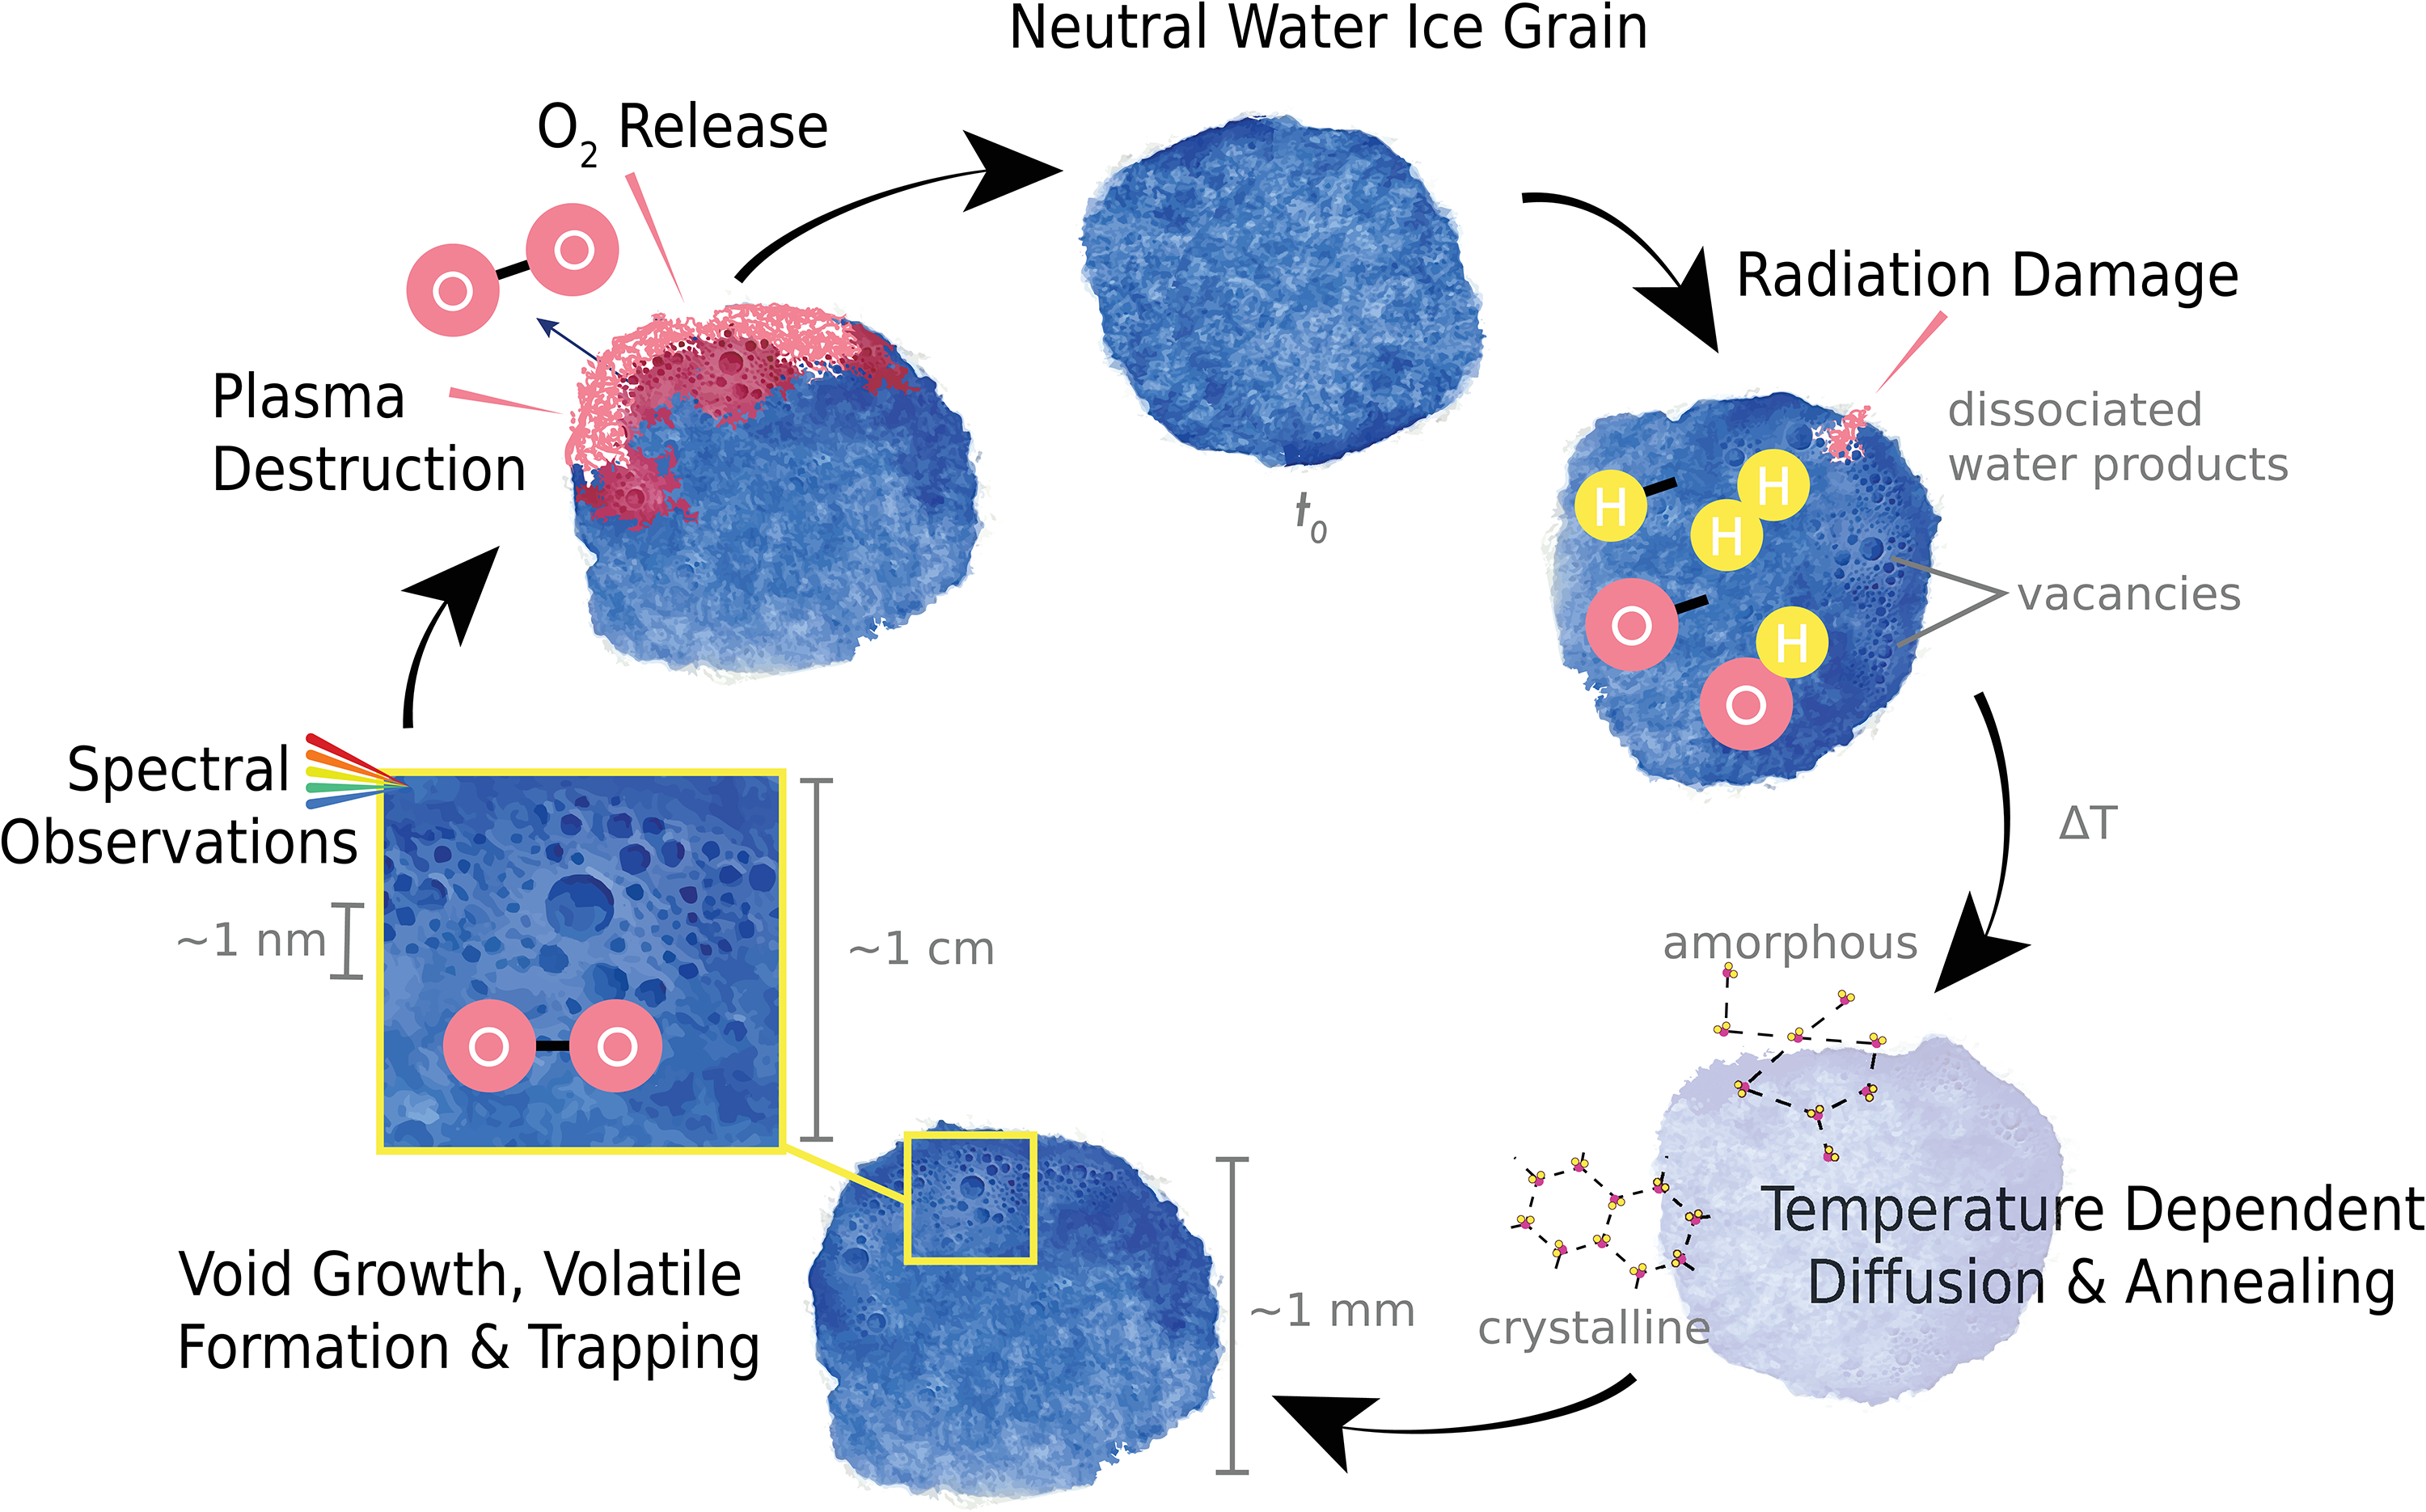
Radiolytic processes in surface ice grains in time. Diurnal temperature variations on Europa (85–130 K) and Ganymede (70–150 K) and variable energetic particles (∼keV → MeV) lead to observed O2 bubble formation (radiation damage vs. annealing) observed via the 5773 Å O2 dimer absorption bands. Watercolor painting: Emily Costello (Hawaii Institute of Geophysics and Planetology). Note: bubbles painted in the figure are natural nitrogen/oxygen bubbles in watercolor paint.
We briefly reviewed aspects of the physics associated with the radiolytically produced O2 observed in the icy regoliths on Europa and Ganymede, and the sources of oxygen into their thin atmospheres. In this, we were guided by the modeling of radiation-produced voids and bubbles in refractory solids, as well as laboratory data on the radiolysis of ice. Although the latter has been critical to our understanding of spacecraft and telescopic observations, we point out that care must be taken in directly applying these data. That is, as discussed above, the satellite surface ice tends to be highly porous with relatively large grains that experience annealing and relatively low radiation rates, whereas the laboratory samples are typically thin, small-grain, microporous samples that experience relatively high irradiation rates in which annealing due to the background temperature is often irrelevant. Therefore, direct observation of the radiation-induced dimer bands in laboratory ice samples has been problematic, which has led to considerable speculation. This is unfortunate, as some estimates of the radiolytically produced O2 reservoirs at the icy satellites suggest that the “condensed” O2 is the dominant reservoir of O2 (Johnson et al., 2003). This is the case although bands other than those in the visible have not been identified (Calvin, 2025; Calvin et al., 1996), which suggests more detailed modeling of the reflectance spectra is needed.
Observations suggest to us that O2 is trapped in the satellite surfaces in two forms: O2 bubbles (“condensed” O2) and transiently adsorbed O2 on grain surfaces, as indicated by modeling of the dusk/dawn asymmetry (Johnson et al., 2019). Here, we also suggest that the observed variability of the “condensed” O2 bands is due to the destruction of bubbles within the photon sampling depth by the penetrating plasma particles. Therefore, the higher plasma fluxes and lower temperatures on Europa appear consistent with more rapid recycling of smaller bubbles (e.g., Appendix A2), which also contribute to light scattering in the visible. This is opposite to the case at low latitudes on Ganymede, which experiences a low flux of primarily penetrating ions and electrons, so that the energy deposition rate per unit path length in the ice is much lower than at Europa, while thermal annealing is more rapid. This is generalized and depicted in Figure 3, starting clockwise from a neutral ice grain (Costello and Oza, 2026).
Although bubble destruction and migration to grain surfaces can contribute to the atmospheric source rate, the timescales suggested by the variability in the dimer band depth (Spencer et al., 2019) are much longer than the times for the thermal desorption of the returning atmospheric O2. That is, the modeling (Oza et al., 2019) of the observed dusk/dawn enhancement of the O2-driven aurora at Europa (Roth et al., 2016), which is roughly consistent with plasma observations (Addison et al., 2022), indicates that the dominant supply of atmospheric O2 is thermal desorption. These observations have led to the extraction of adsorption energies on ice grains in their regoliths of ∼0.11–0.14 eV (Johnson et al., 2019; Teolis and Waite, 2016), values that we pointed out are roughly consistent with laboratory data (He et al., 2016; Laufer et al., 2017). Finally, we suggested that the previously unexplained plasma-induced O2 “activation energy”, seen extensively in laboratory studies (e.g., Orlando and Sieger, 2003; Reimann et al., 1984; Teolis et al., 2017) is determined by the surface tension of ice. This is consistent with trapping of O2 seen at the surface in laboratory samples (Teolis et al., 2009) and the role of interior surfaces in the formation of trapped volatiles. Such aspects must be confirmed by detailed molecular-level modeling in preparation for the observations expected from the Europa Clipper and JUICE missions. Of particular interest is the Moon and Jupiter Imaging Spectrometer on JUICE, which may be able to probe oxidant features in shadow (Poulet et al., 2024). Future space observatories such as Habitable World Observatory might consider a spectrometer capable of studying the molecular oxygen feature described here with a large-aperture telescope. Thus, far space observatories such as James Webb Space Telescope (JWST) are limited to more complex oxidants on putative ocean worlds: Ariel at the Uranian system (Cartwright et al., 2024a), Europa (Trumbo et al., 2023; Villanueva et al., 2023), Ganymede (Bockelée-Morvan et al., 2024), and Callisto (Cartwright et al., 2024b) probed in situ by Galileo/Near Infrared Mapping Spectrometer (NIMS) at Europa (Hansen and McCord, 2008) and Cassini/Visible and Infrared Mapping Spectrometer (VIMS) at Enceladus (Brown et al., 2006; Combe et al., 2019), as well as SO2 and SiO2 at exoplanetary systems (Inglis et al., 2024; Oza et al., 2026). Understanding the processes discussed above can also help interpret JWST observations, suggestive of an active source at Europa (Kadoya et al., 2025) and beyond.
Summary
Following the early experiments of Brown’s and Lanzerotti’s group (e.g., Reimann et al., 1984), it became clear that the Jovian magnetospheric plasma ejected H2 and O2 from the surfaces of the icy Galilean satellites. However, the subsequent observations of the so-called “condensed” O2 bands seen in reflectance spectra at Europa, Ganymede, and Callisto (e.g., Spencer and Calvin, 2002) remain an enigma. This is the case because the differences in depths and variability of the bands seen on Europa and Ganymede are not simply explained using the available laboratory data.
Expanding on earlier work (e.g., Johnson and Jesser, 1997), we have used our understanding of the radiation-induced processes that form, trap, and desorb O2 at Europa and Ganymede. That is, incident plasma particles not only lead to the production of voids in which volatiles can be formed and trapped but can also lead to their destruction and to the production of scattering centers that affect the reflected photon sampling depths. Here, we describe how these processes are affected by thermal annealing rates in competition with the rate of plasma-induced damage production. Although we can understand the differences in the “condensed” O2 observations on these neighboring icy bodies, a quantitative description of their formation in the ice grains is needed beyond the simple model in Appendix A2 and qualitative depiction in Figure 3 (Costello and Oza, 2026). This will require modeling of the molecular physics, as well as experiments involving spectroscopy on thicker ice samples exposed to low rates of penetrating electrons or light ions. A quantitative description is needed, as other volatile products are also observed to be trapped in near-surface ice grains. More importantly, such an understanding could help validate the suggestion that the multiple O2 formed and trapped in the surficial ice might be a potential source of oxygen delivered geologically to their subsurface oceans, providing a metabolic source for potential biological activity underneath the ice as well as the suggestion of ongoing activity at Europa (Kadoya et al., 2025).
Footnotes
Acknowledgments
The authors thank Shane Carberry-Mogan, Sydney A. Willis, and the two referees for helpful comments. A.V.O. also thanks Rosaly M.C. Lopes for discussions on the importance of oxidants in habitable ocean worlds. A.V.O. expresses gratitude for the original artwork by artist and planetary scientist Emily Costello. This work was partly supported by the NASA Astrobiology Institute (NAI) project “Habitability of Hydrocarbon Worlds: Titan and Beyond” (principal investigator: Rosaly M.C. Lopes).
Author Disclosure Statement
No competing financial interests exist.
Funding Information
No funding was received for this article.
Abbreviations Used
Appendix
In Appendix A1, we propose the process that determines the “unexplained” activation energy seen in studies of ejection of O2 from irradiated ice, and in Appendix A2, we describe the dependence of the steady state void size on the rate of irradiation of ice grains.
Associate Editor: Sherry L. Cady