
Abstract
We present a new unified dataset of common-space ideal points, committee assignments, and financial interests for all state legislators in 1999. We describe the compilation of the dataset and offer a few possible applications.
Introduction and Literature
Most research in legislative studies follows one of two approaches. The first approach exploits cross-sectional variation in electoral or legislative institutions to study the effect of these institutions on electoral or legislative outcomes. A common limitation of this approach is that the effort to include a wide cross-section of states limits the detail on particular states or legislative processes that can be brought to bear. A second approach exploits variation across legislators within a single chamber or a few chambers. While this approach exploits additional detail available to the researcher, there is often little or no variation in electoral or legislative institutions within a single chamber, and concerns about generalizability loom large. Recent work collecting roll-call data from multiple parliaments and state legislatures makes possible a third approach, which exploits variation in electoral and legislative institutions to study patterns in the internal organization of legislatures, the responsiveness of legislators to their constituents, the effect of campaign finance laws of elections, and so on by examining a cross-section of states.
Progress in employing this third approach to state legislative research has often been hampered by a lack of organized, systematic data. This is not to say that state legislative researchers do not collect data. To the contrary, the subfield could almost be defined by the frequency with which its researchers gather original data. The problem, rather, lies in the disconnected nature of the data collected (though the State Politics & Policy Quarterly (SPPQ) Data Resource has changed this dynamic in recent years). Gerald Wright’s (2004) “Representation in America’s Legislatures” project, which made available roll-call data from the 99 state legislative chambers for the 1999-2000 legislative terms, was an important advance (Clark et al. 2009). This dataset has been used to examine legislator-constituent congruence (Wright and Winburn 2002) and the influence of party and other factors on roll-call voting (Wright and Osborn 2002). Still, a limitation of this data is that preference estimates computed from the data cannot readily be pooled because the ideal points estimated based on each legislative chamber are not estimated on a comparable scale—A legislator with a score of −0.900 in Idaho is not necessarily more liberal than a legislator with a score of −0.500 in Vermont.
In this project, we seek to make available a common framework for state legislative scholars interested in employing the “third approach” (such as ourselves). Our goal here is to provide researchers with common-space ideal-point estimates for all the state legislators in Wright’s dataset, and to link these estimates to additional useful data on the state legislators. The 1999-2000 biennium saw several independent data collection efforts come together. Battista (2009) gathered committee assignment information to complement ideal-point estimates derived from Wright’s data. The Center for Public Integrity collected and coded a comprehensive set of state legislators’ financial interests from conflict-of-interest filings. Furthermore, in 1998 Project Vote Smart’s National Political Awareness Test (NPAT) had not yet undergone the drop in response rates that later occurred. Finally, the 1999-2000 biennium sits between two large-scale surveys of state legislators with a comprehensive institutional focus (Carey et al. 2008; Carey, Niemi, and Powell 2000).
Shor (2009a), Shor and McCarty (2011), and Shor, McCarty, and Berry (2010) have assembled larger datasets of common-space ideal points generated using alternative methods. When their individual level data are fully released, their datasets will provide estimated ideal points for all state legislators running from the 1990s through the late 2000s. Our work here complements this work and related work on locating respondents in the mass public (Shor 2009b) over a time span of a decade or more. Their data, when fully released, will allow for wide-ranging comparison of the ideological positions of different legislators across space and time. The data we present here offers an opportunity to conduct especially intensive research on the 1999-2000 sessions. As well, because we estimate ideal points for a single biennium and use a new, more efficient estimation algorithm instead of NOMINATE or IDEAL, we can estimate those ideal points using a different and potentially more powerful method than Shor, McCarty and Berry—the “big matrix” approach rather than the “linear mapping” approach. Estimating common-space ideal points directly from the full set of votes and bridging NPAT responses allows us to easily provide standard errors for our estimates, uses all of the available data for each ideal point, and treats all actors symmetrically.
Common-Space Idea-Point Estimates
Estimating state legislators’ preferences has faced a consistent and serious problem—binding together chambers. Given Wright’s dataset, constructing ideological estimates for legislators using NOMINATE (Poole and Rosenthal 1991; 1997), item-response models, factor analysis, or any other data-reduction method has become the work of a lazy afternoon so long as the researcher wants to learn about 1999-2000. For other legislative sessions since the mid 1990s, even collecting the roll-call data can be highly automated. However, the resulting ideological estimates can only be compared within chambers, not between them. They cannot be used to show that a legislator in one chamber is more liberal or conservative or otherwise ideologically dissimilar from a legislator in another, because the sets of roll-call votes used to construct the ideal-point estimates contain no votes or legislators in common.
Bridging Observations
What is needed to create “common space” ideal-point estimates that can be compared across chambers, or across time, is some sort of “glue.” One approach uses bridge legislators, who served in multiple chambers, to connect different chambers. In studies of Congress, bridge legislators who served in multiple Congresses, and who served in both House and Senate, connect the chambers and connect across years in the DW-NOMINATE algorithm (Poole and Rosenthal 1997). We can compare the roll-call-vote-based ideal points of Tom DeLay in the House and Barack Obama in the Senate because we can compare the roll-call votes of each to Jon Kyl, who served with DeLay in the House and Obama in the Senate. Shor, McCarty, and Berry (2010) used this approach to bridge the state legislatures by linking them through legislators who served in both their state legislature and the U.S. Congress.
An alternative approach relies on votes for which we observe the responses of legislators in multiple chambers. For example, votes on conference reports can be used to bridge the U.S. House and Senate (Poole 2005; Treier 2009). Here, we follow Shor’s (2009a) suggestion and bridge state legislatures using responses to Project Vote Smart’s NPAT. We use legislators’ responses to the 1998 NPAT. 1 The 1998 NPAT asked many questions common to all or nearly all chambers, including questions about abortion, crime and law enforcement, the environment, health care, gun control, social issues, affirmative action, education, electoral reform, welfare, and taxation and spending priorities. The responses can be coded as votes and compared across chambers, resulting in a subset of legislators who not only took the normal roll-call votes of their chamber but also took an additional set of “roll-call votes” in common with legislators from other states and with other candidates for legislative office. The NPAT allows us to compare the preferences of a legislator from San Diego to those of a legislator from Bangor even if neither responded to the NPAT, because we can compare their voting patterns to those of their colleagues who did respond to the NPAT. 2
Bridging Technique: Big Matrices and Linear Maps
Poole (2005) proposed two techniques for connecting legislative chambers with bridge votes. The first approach, which we will call the “mapping” approach, relies on estimating ideal points from multiple chambers, one at a time. These estimates are made comparable by creating a map that places the individual chamber estimates on the same scale. This approach is employed by Poole (1998), Shor, McCarty, and Berry (2010), and Shor (2009b). The second approach, which we will call the “big matrix” approach, pools the votes from every chamber into a single (large) roll-call voting matrix and applies conventional techniques. This approach is employed by Poole and Rosenthal (1991), Voeten (2005), and Treier (2006).
The main advantage of the big-matrix approach over the mapping approach is statistical efficiency—The ideal points of bridge voters are estimated using all the available data instead of only a portion of it. Moreover, it is difficult to compute standard errors for linear-mapped ideal points. We do not intend any of this as criticism of the work of Shor, McCarty, and Berry; their linear-mapped ideal-point estimates should be reliable, valid indicators of legislative preferences (Shor, McCarty, and Berry 2008). We claim only that we are able to generate scores that should be more efficient and that our estimates allow for particularly intense observation of our biennium.
The disadvantage of the big-matrix approach (or at least previous implementations of it) is computational efficiency. Applying standard algorithms such as W-NOMINATE (Poole and Roshenthal 1991) or IDEAL (Clinton, Jackman, and Rivers 2004) is not feasible for a roll-call voting matrix as large as we observe in our application. We ran test estimations on subsets of our dataset. Using W-NOMINATE in R, computing two-dimensional ideal points and standard errors for just the NPAT responses took approximately 45 hr. A W-NOMINATE estimation of NPAT responses and votes for only 10 chambers without standard errors took just over 36 hr to run. Each additional state adds to computing time in a multiplicative rather than additive fashion. Our best estimate is that computing ideal points with standard errors for our full dataset would require approximately 3 years of continuous computing time on a 3-GHz-class workstation. Because computational efficiency was a primary concern, we developed a more efficient approach to estimating ideal points using the big-matrix approach.
Our approach (detailed in the codebook) relies on the following observation. The bridging problem creates a very large voting matrix (9,885 voters by 43,262 votes, or about 428 million data points). There are, however, many abstentions because legislators in the Massachusetts House do not vote on proposals in the Montana Senate, and so on. Through a technique that is able to recognize that the voting matrix has many such missing entries, we can obtain efficient estimates using the big-matrix approach without having to sacrifice much computational efficiency. We therefore develop a penalized maximum-likelihood item-response estimator (Peress and Spirling 2010) that exploits the sparse structure of the roll-call voting matrix. The technique is applicable to ideal-point estimation problems with a sparse voting matrix, and can thus be applied to almost any bridging problem. The ideal-point estimation model itself is a standard item-response model similar to that within Clinton, Jackman, and Rivers’ (2004) IDEAL algorithm or Poole’s (2001) quadratic-normal algorithm. Where we innovate beyond standard processes is that the portion of our algorithm that optimizes the likelihood function is designed so that it need not waste time iterating over the vast expanses of the data matrix where votes are impossible. More details on the estimator are available in the codebook.
The NPAT
Project Vote Smart (PVS), a nonprofit organization dedicated to providing voters with more information about the views and actions of political candidates, began asking candidates to respond to their NPAT in 1992 and had begun to survey all state legislators by 1996. Their goal was to provide a resource to voters, with the idea that voters could directly check their legislators’ positions on many issues as well as the positions of other candidates for that office. The NPAT is not an academic survey, and respondents gave their replies knowing that PVS’s intent was to make their responses public, often appearing on the same page with key votes. As with roll-call votes, NPAT responses are public statements concerning the policy preferences of members of the legislature. Therefore, both should reflect members’ electorally induced preferences: the preferences they wish to be seen to have.
Because we use the Wright roll-call data, which are for 1999-2000, we rely primarily on the 1998 NPAT. In chambers with very few respondents, we supplemented the 1998 NPAT responses with responses from other years. From its inception, the NPAT received low response rates from candidates and especially from sitting office-holders. In our dataset, 25.5% of legislators responded to the NPAT, with response rates by chamber ranging from 7.5% in the Florida Senate to 70% of the Oregon House. The standard deviation of chamber response rates was 11.7 percentage points. In general, upper chambers had lower response rates. A full table of response rates for each party in each chamber appears in the codebook. We should note that our overall response rate is substantially lower than the response rates of Carey, Niemi, and Powell’s (1995) survey or Carey et al.’s (2002) survey. Since 1998, Project Vote Smart has indicated that response rates have dropped dramatically, leading it to launch alternative strategies aimed at educating citizens about candidate positions (Project Vote Smart 2010).
Even with a small number of responses on bridge votes, pooled estimation appears to substantially improve the accuracy with which cross-state comparisons can be made. Simulations we have run suggest that pooled estimation can improve the validity of roll-call vote estimates for cross-chamber comparison rather dramatically, even when the number of legislators in each chamber who vote on the bridge votes is relatively small (e.g., 10%). 3 Nevertheless, data users should keep in mind that no matter the technique used to bridge across chambers, estimated ideal-point scores will be more accurately linked together into a common ideological space when there is more glue binding them, and some chambers have little glue indeed. Small numbers of NPAT respondents is a primary reason why our final common-space scores are unidimensional; two-dimensional ideal points would have imposed too severe inferential demands on too few bridge votes in some states. While we are confident that the ideal-point estimates are reliable and valid, users particularly wary of these concerns may wish to conduct their analysis only using lower chambers, where response rates are generally substantially better, or may wish to restrict their analysis to some subset of chambers with higher response rates.
The Data: Ideal-Point Estimates
General Features
We present two sets of ideal points. First, we present unidimensional scores in a common ideological space for all actors in our data, based on both NPAT responses and roll-call votes. Although the estimation technique is different, these scores are intended to serve functions broadly analogous to DW-NOMINATE scores in the congressional literature, and represent the best inference that the available data can provide about the apparent preferences that immediately precede legislators’ vote choices. Second, we present two-dimensional ideal points for all NPAT-respondent candidates, winning and losing, generated using only the NPAT data used to bridge across chambers. 4 Since these estimates are based on survey responses prior to legislative action, they should be free from any chamber-specific agenda-control effects (Ansolabehere, Snyder, and Stewart 2001; Jackson and Kingdon 1992; Snyder 1992; Snyder and Groseclose 2000) and represent something close to electorally induced preferences—the preferences that the candidates wish to be seen to have, as distinct from whatever beliefs they secretly hold. Users could use these NPAT-only scores to generate linear-mapped ideal-point estimates (Shor 2009a) if they so desired.
For both sets of ideal points, the data for each state represents a snapshot of the chamber composition at a particular moment. While legislators die, resign, and are replaced, our dataset contains the chamber as it stood at the moment that the 1999-2000 session committee assignments were recorded. Exactly when this took place varies from chamber to chamber.
NPAT Questions As Bridge Votes
In the NPAT, Project Vote Smart includes a rich set of questions encompassing the range of issues that representatives are likely to confront once in office to provide potential constituents with detailed information about the preferences of the candidates. These questions give us a common core of response options that appeared in nearly all states to use for scaling. The NPAT’s questions came in two varieties. In some, respondents were presented with a series of positions and asked to indicate which they agreed with, but with no option for actively rejecting a position. These are coded as single votes, with “nay” and nonresponse unavoidably pooled. Other questions ask whether the respondent agrees, disagrees, or is uncertain about some proposition, or ask the respondent to select one of six ordinal levels of spending or taxation. For these, we coded each response as a series of votes to extract the full information from each response. Each question creates N-1 coded votes for N categories. 5 This results in a total of 190 votes, based on 106 questions, to bridge between chambers.
The wording of some of the questions varies from chamber to chamber. Some of these instances merely alter the name of the state. In other instances, the form of the question varies in a more serious way. For example, one of the positions in the crime and law enforcement section is, depending on the state, “Implement the death penalty,” or “Support the death penalty,” or “Expand the use of the death penalty for additional circumstances related to murder.” These wording differences are in reference to existing state policy—States without the death penalty ask about implementing it, and states with the death penalty ask about expanding it. Questions where the wording varies are indicated in the codebook. 6
We include and scale NPAT responses from all candidates who responded to the NPAT, including those who lost their election, died or left the chamber, or otherwise do not appear in the chamber voting data we use. Losing candidates may have appeared on the ballot or may have been write-in candidates. As will be seen later, we can use the positions of minor-party candidates to help understand the issue content of both recovered dimensions in the NPAT-only ideal points. Another reason to include the losing candidates is that they too are placed in our unidimensional common space, allowing researchers to compare the positions of winners and losers. Users should not assume that a major-party candidate facing the winner was the actual nominee of that party in the general election.
Unidimensional Ideal Points, All Actors, Common Space Using NPATs and Votes
The unidimensional common-space ideal points constitute the primary ideal points we offer. We present scores for all members of all state legislatures, as well as all other NPAT respondents. We limit ourselves to one-dimensional ideal-point estimates because mapping low-NPAT-response chambers into a two-dimensional common space proved too demanding given the limited number of bridging observations.
Figure 1 displays boxplots of each state’s estimated ideal points, with the states ordered by the median Democratic ideal point. Overall, the figure shows results similar to Shor’s (2009b) results over a broader time frame and are generally sensible. California’s legislators are clearly the most polarized, with a wide gap between the parties. Democrats in New York are well to the left of Democrats in Texas, but Republicans in both states have very similar interquartile ranges.
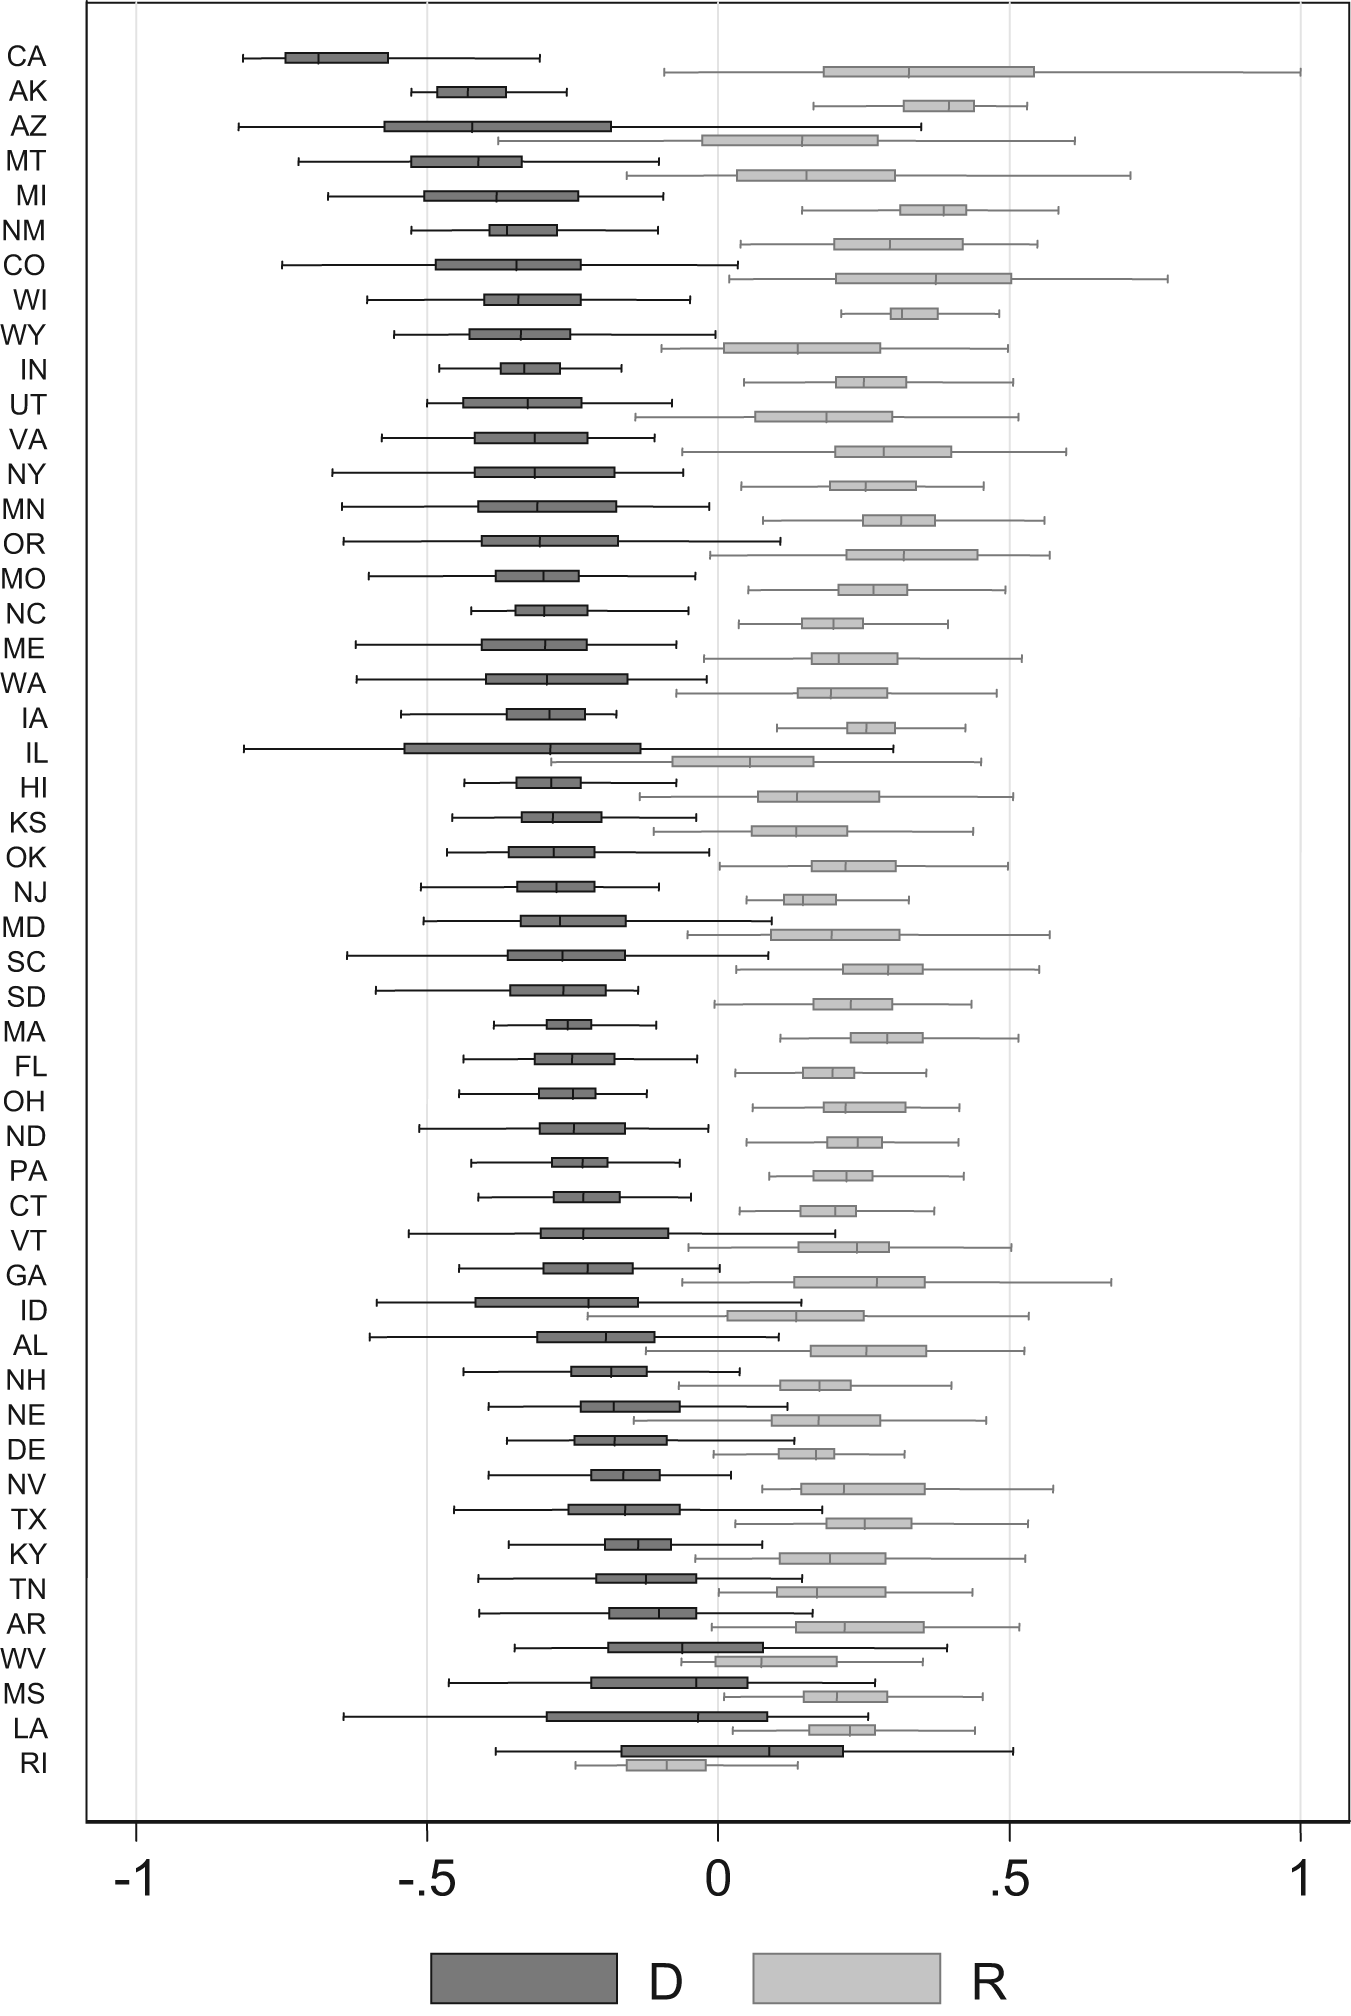
Estimated common-space ideal points by state
One apparently odd result is that the median Rhode Island Republican is placed marginally to the left of the median Democrat, and in general the two parties are hard to distinguish. No preference estimation method can return more information than is contained in the underlying data used to compute ideal points; if there are few NPAT respondents and the positions taken by those respondents are somewhat unexpected, the ideal points computed from those data might also be surprising. dIn the Rhode Island House, only two of the 13 Republican legislators responded to the NPAT, and their NPAT responses tended to be liberal (in favor of same-sex marriage, favoring a variety of taxing or spending increases, and so on). For both Democrats and Republicans in the Rhode Island House, NPAT response is not correlated with ideological estimates computed only from roll-call votes, so this is not a response-bias issue. The problem is not with the quality of our “glue,” merely the quantity. Since examination of the underlying NPAT responses convinced us that this apparent aberration is a function of surprising NPAT preferences and a small sample rather than a flaw in the estimation algorithm, we report the ideal-point estimates as computed. It is, however, possible that if there were more NPAT respondents that the estimated ideal points would change such that the median Republican would be shifted marginally to the right of the median Democrat. The codebook contains a caution to users about this issue, and other cautions where relevant.
Two-Dimensional Ideal Points, NPAT Only, All Responding Candidates
Ideal-point estimates created using only NPAT responses have unique properties and drawbacks. The drawbacks are most obvious: If a legislator did not complete the NPAT, there are no responses to scale. However, using only NPAT responses purges the estimated ideal points of agenda effects, party pressure, and many other forces that impinge on roll-call votes, leaving us with something close to the electorally induced preferences of each respondent. Because these are computed as if they were a single very large chamber, the number of respondents per chamber no longer poses an inferential constraint, and we present two-dimensional scores. Whether users should use the one-dimensional scores for all actors or the two-dimensional scores for only NPAT respondents will depend on the particular notion of “preferences” most relevant to their theory and on the user’s tolerance for a substantially lower sample size.
Figure 2 displays the estimated ideal points in two dimensions for Democratic, Republican, and Libertarian candidates. For clarity, the figure shows ideal points only for a random 10% of Democrats and Republicans, but all Libertarians. Democrats are displayed in black with round markers, Republicans in medium grey with round markers, and Libertarians in black with “plus” markers. 7 Multidimensional estimated ideal points have an arbitrary rotation and scale and require normalization. We normalized by setting the average Democratic ideal point to (−1, 0), the average Republican ideal point to (1,0), and the average Libertarian ideal point to (1,1). Thus, the horizontal dimension is by construction a policy dimension that separates Republicans from Democrats, and the vertical dimension is one that separates Republicans from Libertarians. Note that unlike most variants of NOMINATE, our two-dimensional scores are not bounded by a unit hypersphere.
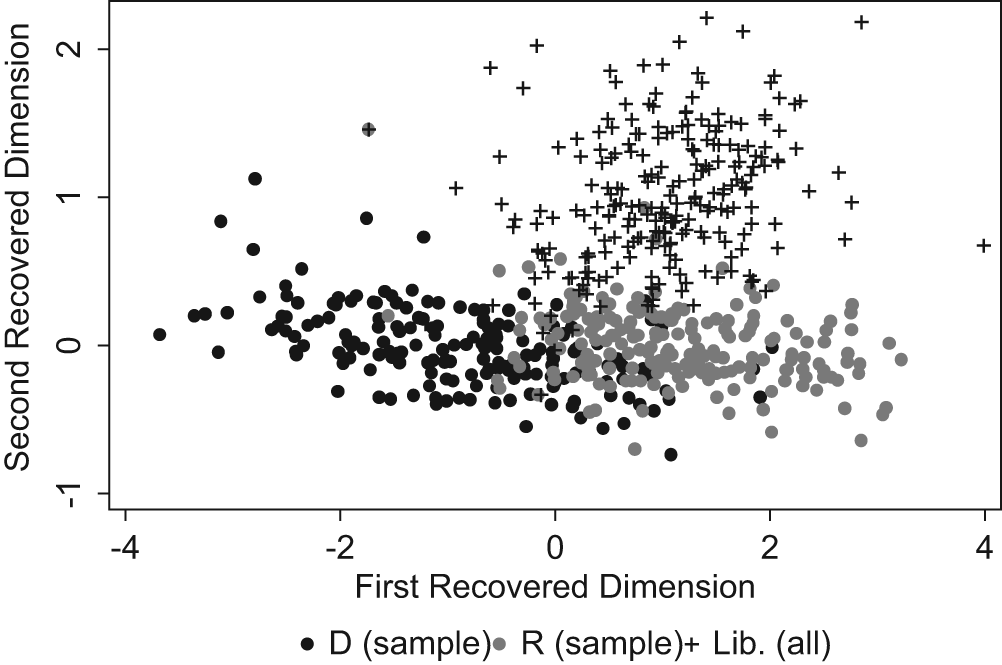
Estimated ideal points (NPAT only)
The figure indicates that there is little overlap between the Democrat and Republican parties on the first dimension, but also indicates that there is little overlap between the Libertarian and major parties on the second dimension. We also note that the dispersion of the major-party candidates on the second dimension is small relative to the distance between the Libertarian and major parties.
The Data: Committee Assignments and Financial Interests
As we described earlier, common-space ideal-point estimates for the 1999-2000 legislative sessions are especially useful because, in this particular time period, additional data is available. Our goal in this project was to provide legislative scholars (ourselves included) with such data. We make available data on committee assignments and financial interests of legislators for the same time period. Combined, these data sources will provide legislative scholars a starting point for employing the “third approach” to legislative studies.
Committee Assignments
The committee assignment data are an original collection. Originally collected to be used in conjunction with Wright’s (2004) roll-call vote data, the committee assignments depart from the 1999-2000 biennium in those few instances when Wright’s data do. The committee assignment data are the same as those used by Battista (2009). The committee assignment data codes full committees only, not subcommittee assignments. Furthermore, we provide only membership and do not code chairs or other leaders. 8 For each chamber, the committee assignments represent a snapshot at some particular moment, and at other times within the same session the committee assignments might have differed. As noted, this snapshot moment also conditions the other data. Users should not assume that any particular bill was considered by the committee as listed in our data.
The committee assignments were collected following a priority scheme. If committee assignments were not available using the highest priority method, we moved down the ladder of methods. The highest priority method was any online, 9 electronic list of committee assignments generated by the legislature. These reflect an unknown point in the legislative session depending on when the list was published. When such a list was unavailable, we turned to electronic copies of the legislative journals and scanned through the opening several days of the session to find the point at which the slate of committee assignments was ratified by the chamber. Obviously, this reflects assignments early in the session and does not incorporate any changes to the assignments over the course of the session. When no electronic journal was available, or when the discussion of the relevant vote did not specify the assignments, we contacted the legislature electronically or by telephone to obtain whatever form of information they could make available.
Financial Interests
The financial interest data reported here were originally collected by the Center for Public Integrity, a nonprofit organization dedicated to producing original, responsible investigative journalism on issues of public concern (Center for Public Integrity 2006). It is important to note that these are not campaign finance or donation information, though such data are available from the National Institute on Money in State Politics. Rather, the underlying data are conflict-of-interest filings required by law. The conflict-of-interest filings indicate the extra-legislative sources of income for the legislator, and in some instances his or her spouse and any children. These data, or precursor datasets, have been used by Maddox (2004) and Battista (2008). Conflict-of-interest filing requirements vary by state. The Center created an index of openness or stringency-of-reporting, with higher values denoting states that require more disclosure, at least theoretically penalize false statements or nondisclosure, and so on. The stringency scores range from one in Idaho, Michigan, Utah, and Vermont to 98 in Washington. The Center interprets these much like academic grades, with 60 being “passing” (Center for Public Integrity 1999). The dataset includes these openness scores.
The data include income from employment, retirement, farm or business activity, officer or directorships, personal business interests, memberships, sales or commissions, property rental, and income from government agencies. These are essentially all of the income categories that might indicate that the legislator has some conflict of interest or special interest in the relevant industry. The primary categories of income that we do not include are investments and client income. We exclude investments because the underlying data generally do not indicate how large a given financial interest is, so we cannot distinguish between a legislator who holds a small number of shares in some corporation as a negligible part of a diverse portfolio and a legislator who is deeply invested in that corporation’s future. Likewise, many legislators who have connections to law firms also have client income from all industries that the law firm had clients from, so these also seemed not to indicate a substantive connection to an industry.
The Center sorted the filings into several industries or sectors. Interests are not exclusive, for several reasons. First, legislators themselves can have connections to more than one industry, as a farmer who also operates an additional small business would. Second, the data include the financial interests of spouses and dependents. We include all relevant filings because 13.2% of the filings themselves do not specify exactly who in the legislator’s family has a given financial interest. In nine states, at least 25% of reported interests lack this information in the original filing statements. Note that the sector “government,” as reported here, should be approached cautiously. In some instances, legislators with a financial connection to government sit on county commissions or school boards, are retired from a state agency, or otherwise have employment or other income from governmental entities beyond the legislature. In other instances, however, legislators list their legislative service as a connection to government, and in others the connection is merely receiving Social Security payments.
The financial interest data as reported here are binary: Either a legislator has a direct or indirect interest, or he or she does not. It would obviously be preferable to know that a particular legislator’s family earned $23,000 or 47% of their income from farming. Unfortunately, this information is essentially unavailable, reflecting limitations in the underlying financial-disclosure filings. Even with the Center’s herculean data collection efforts, 83.8% of the 25,128 legislator-interests in the database have no scale whatsoever, and a further 6.2% provide a scale with a category width of $50,000 or more. In 25 states, no scale information at all is available. Only 7.2% of legislator-interests provide scale information with a category width under $10,000. In short, the underlying information cannot be gathered without comprehensive access to the legislators’ financial records instead of the conflict-of-interest filings.
An Application
The value of any dataset lies in its applications. In this section, we illustrate one application of our data. For brevity’s sake this is a very simple application intended only to illustrate some of the possibilities of the dataset, and should not be interpreted as our theoretical statement of how these processes actually operate, or as our empirical findings with respect to them.
Committee Distinctiveness
Estimated preference data and financial connection data can be combined with committee assignment data to provide information about the distinctiveness of legislative committees (Gilligan and Krehbiel 1990; Weingast and Marshall 1988). As an example, we compare members of the primary committee dealing with agriculture policy in five lower chambers to their parent chambers. These committees were chosen as illustrations, and we make no claim that they are representative of lower chambers generally. We compare financial connections to agriculture as well as common-space estimated ideal points. Table 1 displays the relevant results. This table also illustrates the difficulty of dealing with committee assignments across chambers—In Connecticut, there is no committee with “Agriculture” in its title, and those functions are dealt with by the Environment Committee.
Agriculture Committee Distinctiveness in Five Lower Chambers
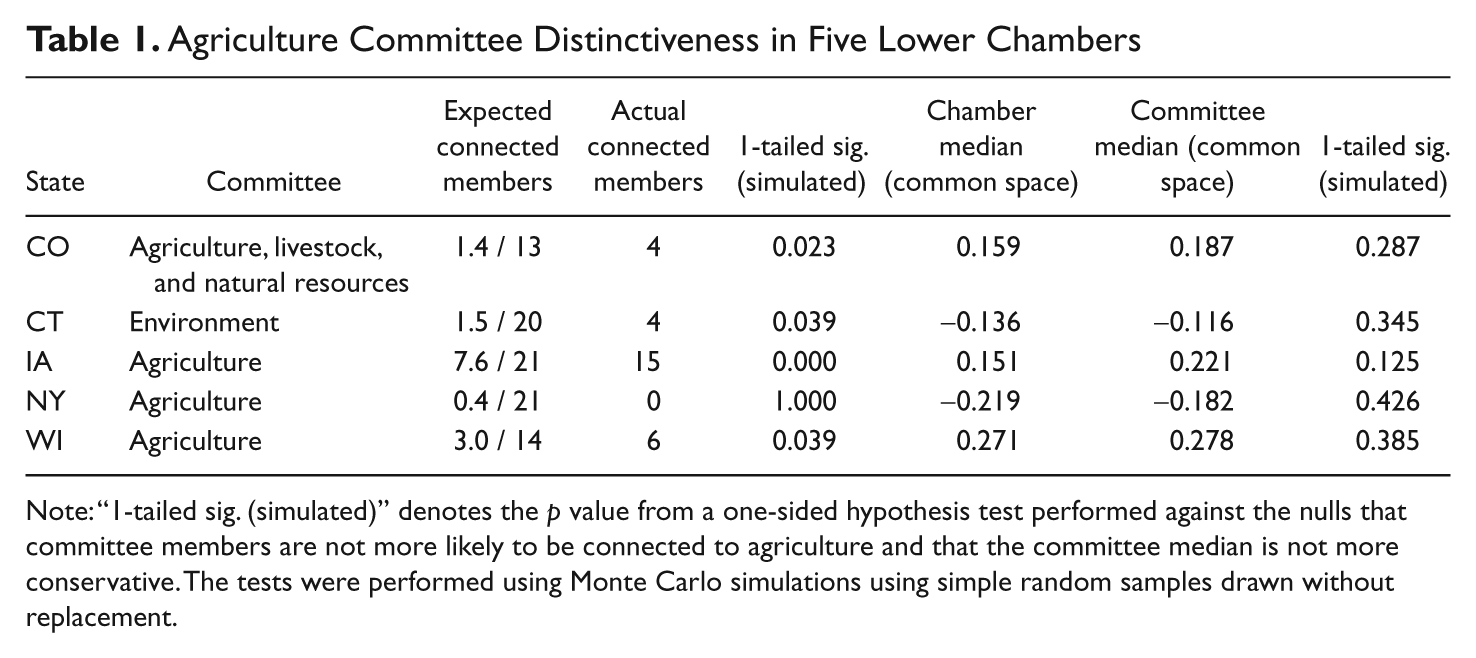
Note: “1-tailed sig. (simulated)” denotes the p value from a one-sided hypothesis test performed against the nulls that committee members are not more likely to be connected to agriculture and that the committee median is not more conservative. The tests were performed using Monte Carlo simulations using simple random samples drawn without replacement.
To compare financial connections to agriculture, we performed Monte Carlo simulations. For each of the five chambers, we simulated 10,000 committees of the actual committee size and noted how many legislators had a connection to agriculture. The reported significance figure is simply the proportion of simulated committees that had at least as many connected legislators as did the actual committee. In four of the five chambers, agriculture committees clearly have more connected legislators than we would expect from a null process of random appointment. The New York Assembly shows about as many as we would expect from random appointment, but only three legislators in the New York Assembly had a connection to agriculture, which makes comparison difficult.
To look for preference distinctiveness, we again performed Monte Carlo simulations. For each chamber, we simulated 10,000 committees of the appropriate size and noted whether it was to the right of the actual committee median. The resulting significance figure is the proportion of simulated committees whose median was at least as far to the right as the actual committee median. While all five committee medians are to the right of their chamber median, in no case are these differences inconsistent with a null process of random appointment. Thus, committee members’ unrepresentative interests did not carry over into broader ideological unrepresentativeness.
Other Possible Applications
There are other relatively obvious possibilities for these data. For example, our data contain common-space and NPAT-only estimated ideal points for all state legislators, and for all other candidates who responded to the NPAT. This means that in more than 600 instances, our data record preference estimates for the eventual legislator as well as a major-party competitor.10 This could be combined with election data (Carsey et al. 2008) and other related information to directly assess how the issue positions taken by candidates influence election outcomes. Another possibility would be to use chamber- or state-level summary statistics of our preference estimates as intermediate-level measures of state institutional liberalness/conservativeness in studies explaining particular levels of a specific policy (Soss et al. 2001) or general levels of policy liberalness (Erikson, Wright, and McIver 1993). Scholars might also investigate the relationship between conflicts of interest and preferences/policies or the distribution of conflicts of interest across states.
Conclusion
In sum, we offer these data to the state legislative community and hope that the community finds them useful. The preference common-space scores we generate allow ready comparisons of the preferences of members of different state legislatures, facilitating cross-chamber comparative analyses. This data can be combined in a range of ways with the committee assignment and conflict-of-interest data. We believe that the data can support many different research projects and that ready accessibility will facilitate studies of state legislative politics.
Footnotes
Acknowledgements
We thank Project Vote Smart and the Center for Public Integrity for generously providing source data.
Authors’ Note
Portions of this research were performed using cluster supercomputer resources of the University at Buffalo’s Center for Computational Research.
Declaration of Conflicting Interests
The authors declared no potential conflicts of interest with respect to the research, authorship, and/or publication of this article.
Funding
The authors declared the following financial support for the research, authorship, and/or publication of this article: Portions of the data were collected with support from the Old Dominion University Research Foundation.
Notes
Bios
References
Supplementary Material
Please find the following supplemental material available below.
For Open Access articles published under a Creative Commons License, all supplemental material carries the same license as the article it is associated with.
For non-Open Access articles published, all supplemental material carries a non-exclusive license, and permission requests for re-use of supplemental material or any part of supplemental material shall be sent directly to the copyright owner as specified in the copyright notice associated with the article.