
Abstract
Internet surveys of the general population have been growing in use over the last few years because they are less expensive, faster, and greener than most other survey modes. However, they have been used less frequently to survey elites, and little is known about the representativeness of their results. This article helps fill that void by using an experiment where half of a sample of state legislators are given an Internet survey and half a mail survey, and then the response rate, representativeness of respondents, and similarity of responses are compared. The results indicate that mail and Internet surveys generate fairly representative samples, albeit with few biases, and similar responses; however, mail surveys generate a significantly higher response rate than Internet surveys. The implications of these findings are discussed.
Surveying political elites has been and is likely to continue to be a critical method to garner information about political institutions and behavior. Surveys of party and interest groups activists, candidates, bureaucrats, and elected officials have increased our understanding of elite commitment to civil liberties and rights, how elites shape mass opinion, rational choice models, political participation, roles of interest groups and parties, representation, legislative behavior, and foreign policy (Brady 2000). Of particular interest are surveys of state legislators. Because state legislators come from a wide array of institutional and electoral systems and have diverse demographic traits, they offer an opportunity to explore effects of phenomena not found at the national level in the United States. Research on state legislators has advanced our understanding of the roles of sexual orientation, gender, and race in political phenomena (see, for example, Barrett 1995; Hedge, Button, and Spears 1996; Herrick 2010; Thomas 1992; Thomas and Welch 1991); how institutional features affect aspects of policy making (see, for example, Carey et al. 2006; Francis 1985); and factors affecting how legislators make decisions (Hedlund and Freeman 1981; Mooney 1991a; 1991b) and represent their constituents (see, for example, Ellickson and Whistler 2001; Erikson, Luttbeg, and Holloway 1975; Freeman and Richardson 1996; Maestas 2003; Uslaner and Weber 1979). However, the most common method of surveying, mail surveys, is expensive, slow, and has declining response rates. A potential alternative is Internet surveys. In this article, we conduct an experiment where legislators are given either a mail or an Internet version of a survey, and the response rate, representativeness of the respondents, and responses to key questions are compared.
Mail surveys have been the standard mode for collecting data. Maestas, Neeley, and Richardson (2003, 92) found that between 1975 and 2000, 60 data sets based on surveys of state legislators have been used in major political science journals. 1 In all, 34 were mail surveys, 3 were telephone surveys, and the balance were in-person interviews. Between 2000 and 2010, we found, in our updated replication of the Maestas et al.’s work, 25 publications that used surveys of state legislators. Three surveys were used in more than one publication for a total of 22 surveys, of which 19 were mail surveys. 2
Mail surveys are appealing to political scientists because the expense in time and money is lower compared with telephone surveys. However, they still suffer from several problems. To have acceptable response rates requires multiple mailings that take time and money. In addition, it is likely that response rates are in decline due to term limits, and increased demands placed on state legislators (Maestas, Neeley, and Richardson 2003, 93). Of the 19 mail surveys we identified, only 4 had response rates more than 50% and 2 of these were conducted in the 1990s. The average response rate was 43%; however, for the surveys done after 1999, the average drops to 39%. Although mail surveys are less costly than telephone surveys, researchers often try to reduce costs of surveys by skimping on the number of legislators and states sampled thus reducing some of the value of examining state legislators. According to Maestas, Neeley, and Richardson (2003, 92–3) between 1975 and 2000, 47% of the mail surveys sampled legislators from four or fewer states. The mean number of states sampled was 17. This statistic was skewed because of a handful of surveys using all 50 states. In addition, only 5 out of 60 surveys included a sample of more than 2,000 legislators (there are about 7,300 state legislators). Of the 19 mail surveys since 2000, only 3 included legislators from all 50 states, 4 sampled legislators from at least 40 states, and 8 surveys had fewer than 10 states in the sample. In all, 7 of the surveys had more than 2,000 respondents, and 4 had fewer than 200 respondents.
The advent of Internet surveys may enhance our ability to effectively survey state legislators and other political elites. Orr (2005) identified several potential advantages of Internet surveys: efficiency, timeliness, global, cost savings, accessibility, limit data entry errors, real-time access, conserves resources, interactive elements, multimedia features, question controls, limited burden design simplicity, population reach, and information quality. Two of the largest advantages are time and money savings. One study estimated the postage for a mail survey of 189 people was just under $400 compared with about $125 for the Internet survey (Shannon and Bradshaw 2002). One study found the average response time in a 1998 mail survey was 18 days compared with 4 days for an Internet survey (Bachmann, Elfrink, and Vazzana 2000). Internet surveys may also be particularly attractive to researchers of state legislators because of the relative ease with which email addresses can be obtained. Although for the general population obtaining an appropriate sampling frame is often difficult, a complete sampling frame of state legislators is typically available on state legislative web pages.
One potential liability of Internet surveys is a low response rate. Social exchange theory, the idea that people are motivated to act based on exchanging rewards, has been used to predict responses rates (Dillman 2007; Hoonakker and Carayon 2009). If a respondent’s perceived benefits exceed costs, then the likelihood of participation is increased. As such, Internet surveys may have some advantages over mail surveys because there are no envelopes to open, no pencils to find, and no need to remember to put it back in the mail. In contrast, web surveys may be more enjoyable as they can be more visually attractive and interactive. However, Internet surveys also have some traits that may decrease response rates. First, the emailed contact may be more easily lost or ignored than the mail contact (Hoonakker and Carayon 2009, 363–4). This may be a particularly significant problem for state legislators who receive more email from constituents than phone calls, mail, and faxes combined (Alperin and Schultz 2003). Second, for legislators who are unfamiliar with computers and the Internet, there may be added costs of learning the technology, although this problem is likely in decline as computers have become a staple of life in the twenty-first century. What is likely to be a greater concern is the assurance of confidentiality of responses as researchers can tie responses to the respondent (Couper 2000; Hoonakker and Carayon 2009, 363; Shannon and Bradshaw 2002). In this age of gotcha politics, legislators are particularly fearful of information being taken out of context and used by political enemies. In fact, more than one legislator in our study who refused to participate articulated such concerns.
Research comparing response rates of mail and Internet surveys generally find lower response rates from Internet surveys (Cook, Heath, and Thompson 2000; Hoonakker and Carayon 2009, 352–9; Sue and Ritter 2007, chapter 1). This is not only true of the general population but also for elites such as college professors (Schuldt and Totten 1994; Shannon and Bradshaw 2002), college administrators (Bachmann, Elfrink, and Vazzana 2000), and national party convention delegates (Layman et al. 2010, 330, footnote 6). However, some Internet-based studies of political elites, such as party chairs, lobbyists, and bureaucrats (Daley 2008; Weissert and Halperin 2007), have had high response rates in the 45% to 70% range. These studies, however, included telephone reminders or follow-up mail surveys, which minimize the cost savings of Internet studies.
Low response rates may be a problem but what is equally important is the representativeness of the respondents. In fact, there is some discussion in the social sciences as to the relative importance of response rates compared with representativeness (Cook, Heath, and Thompson 2000; Krosnick 1999, 537–41). If the sample, no matter how large, is not representative of the population, then the results are suspect. Some of the concerns about representativeness with Internet surveys of the general population, such as availability and use of computers, access to the Internet, and sampling frames, are simply not issues for political elites such as state legislators. State legislators are assigned legislative email accounts, and these addresses are made public. Other concerns, such as age and gender affecting response rates (Hoonakker and Carayon 2009; Kaplowitz, Hadlock, and Levine 2004, 97; McCabe et al. 2006; but see Ballard and Prine 2002), may exist for state legislator but are likely minimized. The reason for these differences is that men and younger people were, at least historically, more likely to know how to use computers and the Internet. Research finds that Internet use among state legislators does not vary much by key demographic characteristics (gender, race, tenure, party, and education) or district traits (Richardson, Daugherty, and Freeman 2001). One caveat here is that male legislators are more likely to use the Internet (Cooper 2002). Also supporting the idea that Internet surveys may not depress representativeness for elite samples is Layman et al.’s (2010, 330) 2004 Convention Delegate Studies (CDS), which had a poor response rate (21%–22%) but the “basic demographic and political variables” were similar to the previous surveys of delegates indicating that the representativeness of a small sample may be quite good.
Even if the respondents are representative of the population, Internet surveys may still be problematic if respondents offer less reliable or less valid responses to these surveys. One problem may be that respondents are more likely to rush through an Internet survey resulting in satisficing or primacy effects; however, this appears more prevalent for less educated respondents so with elites, who tend to be well educated, this problem should be minimal (Malhotra 2008). Savage and Waldman (2008, 368) also found some evidence of lower quality responses with Internet surveys because “online respondents suffer fatigue or boredom, reducing consistency in choice, which causes data quality to deteriorate.” Part of this problem has to do with the number of repeated choice questions that also affect responses to mail and Internet surveys with similar question patterns (Ballard and Prine 2002; Cole 2005; Hoonakker and Carayon 2009). Some studies, too, have found some advantages to Internet surveys, such as respondents offering more information particularly with open-ended questions (Hoonakker and Carayon 2009; Sue and Ritter 2007, chapter 1).
Method
To examine whether Internet and mail surveys yield different response rates and representativeness levels, a study was conducted of all state legislators in 26 states (Alabama, Arizona, Arkansas, California, Colorado, Florida, Georgia, Idaho, Kansas, Kentucky, Louisiana, Michigan, Missouri, Mississippi, Montana, North Dakota, Ohio, Oklahoma, Oregon, South Carolina, South Dakota, Tennessee, Texas, Utah, Virginia, and Wisconsin). These states were selected because each had a referenda or initiative vote on same-sex marriages sometime between 2004 and 2008. This condition is important for another project. Although this may limit the generalizability of the research, the degree to which this is a problem would depend on whether legislators from these states are somehow more or less likely to respond to mail or Internet surveys. This is in some ways addressed with this project. As the states do vary dramatically in things like professionalism and region (except northeast), if we find variation in response rates by these traits and survey type, it will suggest that the findings may be less generalizable. Moreover, although it would have been ideal to examine all state legislators, the norm for research on state legislators is to use a smaller sample of states.
A list of legislators by each state and by chamber was used to randomly assign legislators to the mail survey group or the Internet survey group. The first name on the list was randomly assigned to receive a mail survey, and the second was assigned an Internet survey. To check for selection bias, we compared the characteristics of those selected for the Internet survey with those selected for the mail survey. The only significant difference was age. The mean age for mail survey invitations was 54.9, and the mean age for Internet survey invitees was 53.9.
The question wording was identical with each survey type. The primary difference involved the ease of skip patterns. 3 On the Internet survey, the skip patterns automatically moved the respondent to the next appropriate question without viewing the intervening questions. Most notably, legislators who took the Internet survey were asked whether they had personal staff, and then those saying “yes” were given the questions concerning staff and others were not, whereas, those with the mail survey had to follow directions and not answer these questions. The survey had 29 questions, although many of these had multiple parts. 4 The mail survey was six pages long.
Both mail and Internet surveys went out after the November 2008 elections. Mail and email invitations were personalized as these have significant effects on response rates (Dillman 2007; Heerwegh 2005; Heerwegh and Loosveldt 2006). We felt that legislators would be more inclined to take the time to complete a survey after the election rather than during the campaign. A modified tailored research design was used in both cases. A preliminary letter was sent to all recipients of the mail surveys and a preliminary email was sent to all online surveys. The letter/email provided an explanation of the study, and contact information for the principal investigator and the Institutional Review Board (IRB). Legislatures were sent surveys or emailed the survey link on November 10, 2008. Mail surveys were sent to 1,834 legislators and an email invitation to complete the survey was sent to 1,649 legislators. 5 Follow-up reminders were sent to both groups encouraging legislators to complete the survey. 6 The survey was closed on February 9, 2009. Finally, a second survey was mailed to the mail group, and a final email was sent to the Internet group reminding legislators to respond. The appendix includes all the contact had with the state legislators.
Zoomerang, an online web survey service, was utilized to handle the web survey. Email addresses that were no longer valid resulted in “hard bounces,” and new email addresses were sought. In many cases, there were no alternative email addresses. We also discovered that after the election, many of the email addresses for legislators who did not seek reelection were no longer valid. This was also true, albeit to a lesser extent, with surveys mailed to legislators. Where possible, new email addresses and mailing addresses were obtained, and the survey sent again.
We conduct three analyses. First, we compare the response rates of the two types of surveys. Second, we will compare the representativeness of the respondents by survey type. The variables we focused on are age, tenure, region, chamber, party, gender, education, the type of survey, and legislative professionalism. 7 Third, we compare responses to key questions from mail and Internet surveys to see whether there is a difference. If we find little difference, it suggests that they elicit similar responses; if there are differences, it will simply suggest a difference but not indicate which is superior.
To test for differences in responses, we compared the responses of those who took the Internet survey with those who took the mail survey on 10 different questions. One question taps the difference between being a trustee or a delegate. The question used to measure this role orientation asked, “When there is a conflict between what you think is best and what you think the people want, do you think you should follow your conscience or follow what the people in your district want?”
8
Respondents were asked to use a 7-point scale with 1 = always district and 7 = always conscience. Two questions were used to ask how much time legislators spend doing their job. One asks about when the legislature was in session and the other when the legislature was not in session. The question wording was, “When your legislature is in session, approximately how many hours per week do you work on tasks associated with being a legislator?” and “When your legislature is NOT in session, approximately how many hours per week do you work on tasks associated with being a legislator?” Another question asked about the ideology of the district: “How would you describe your political views and those of others in your district?”
8
One of the actors was a voter in the district. The options ranged from 1 = extremely liberal to 7 = extremely conservative. Three questions asked about legislators’ district’s position on key issues. “Compared with the voters in the rest of your state, the voters in your district are [1 = significantly more to 5 = significantly less] supportive” of certain policies. The policies were English-only laws, state recognized same-sex marriages, and placing limitations on the government’s ability to tax. Another question asked, “What is your best guess as to the percentage of your district that identifies with the Democratic Party?” The other differences examined come from the question,
Which of the following best describes what you plan to be doing 5 years from now? Hold same or similar office, Hold a higher office, Hold a lower level office, Work for a party or political organization, Hold no political office, or Other.
Two variables were created from the above question, one for progressive ambition (those who want a higher office) and static ambition (those who want to hold same or similar office). These are not a full list of survey questions but are selected questions to offer measures of attitudes, behaviors, trait questions, and measures of their district.
Results
First, the response rate was significantly higher for mail than Internet surveys. Overall, the response rate (we used American Association for Public Opinion Research [AAPOR] response rate classification Response Rate 1 [RR1], which is the number of completions divided by the total number of eligible respondents) is 22.70% for the mail and Internet surveys together. The RR1 for the mail survey was 31.9%, and the RR1 for the Internet survey was 11.49%. The response rate for mail surveys was significantly better (t = 14.01, p = .000) than those for web surveys.
Second, although the mail survey had a higher response rate, it was less clear that it produced a more representative sample. Table 1 presents results from a t-test of response rates for a series of bimodal demographic variables. Here the t-test indicates whether response rate for one category of the bimodal variable is significantly different from the other category. First, the t-tests indicate neither type of survey produced a biased sample in party, chamber, or education. There were two characteristics overrepresented in the Internet survey: females and junior members. Females were significantly more likely to complete the Internet survey than males—16.2% to 11.9%. This finding is intriguing because most research on the general population find men more likely to respond to Internet surveys. The mean years of service for Internet responders was 7.9 compared with 9.2 for nonresponders.
Percentage Response Rate: Demographic Completion Rate by Survey Type.
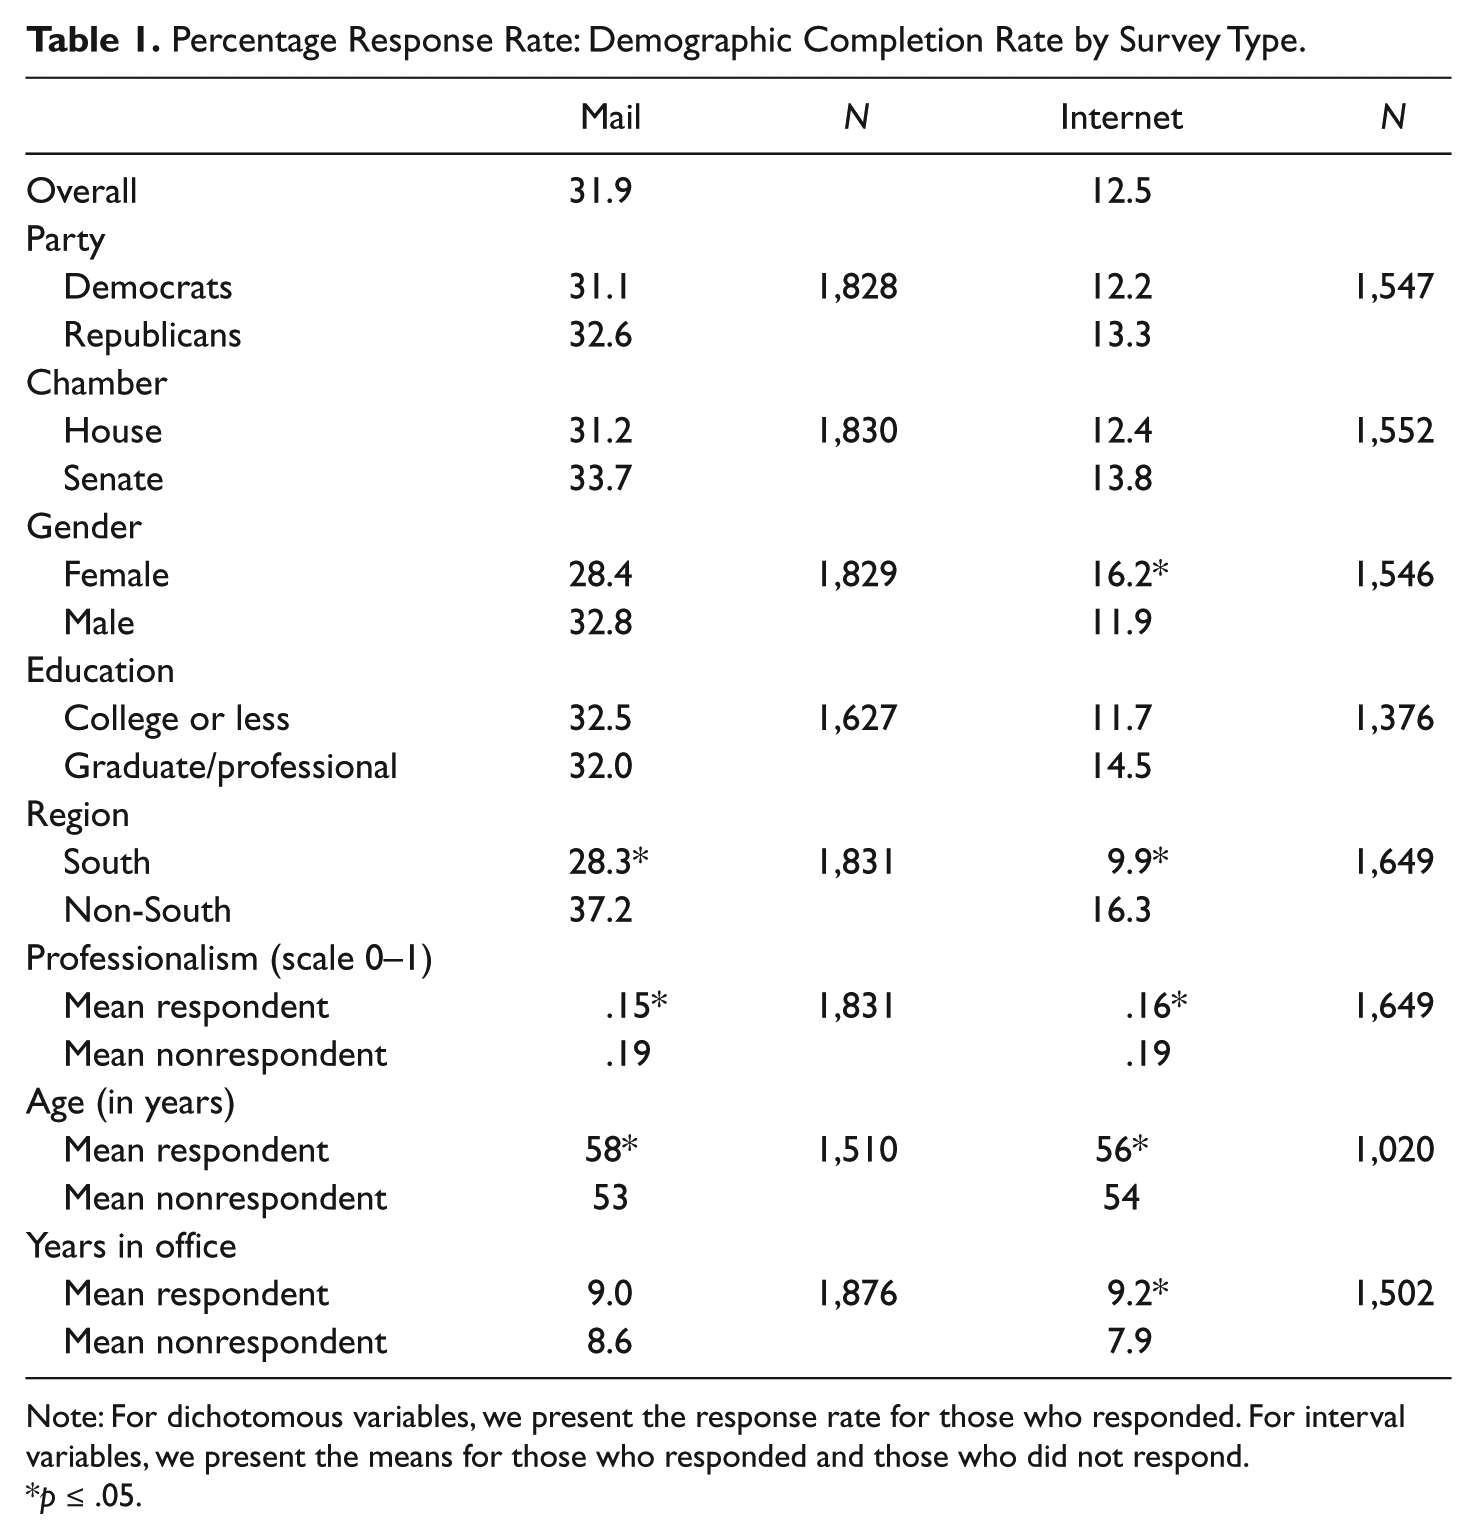
Note: For dichotomous variables, we present the response rate for those who responded. For interval variables, we present the means for those who responded and those who did not respond.
p ≤ .05.
Second, there were three characteristics, region, age, and professionalism, which were significantly overrepresented in both types of surveys. First, the mail survey response rate for legislators outside the South was 37% compared with 28% for legislators in the South. For the Internet survey, the pattern is the same with a 16% response rate for those outside the South compared with 10% for legislators from the South. Second, older legislators were more likely to complete the survey regardless of survey type than their younger colleagues, but the biggest difference was the response rate for mail surveys. The average age of those who responded to the mail survey was 58 compared with 53 for those who did not respond, a 5-year gap. For the Internet survey, the average age of respondents was 56 compared with 54 for nonrespondents, a year-point gap. Third, legislators from less professionalized legislatures were more likely to respond than those from more professionalized legislatures. The average legislator responding to the mail survey came from a legislature scoring a .15 on the scale, compared with .19 for those not responding to the mail survey. For the Internet survey, the scores were .16 and .19, respectively. 9
To further test for response bias, a logistic regression was run that includes each of the variables from Table 1. 10 A set of interaction variables that multiply mode of survey by legislator trait is also in the model. These interaction variables indicate whether legislators with specific traits were more likely to respond to one type of survey or the other. The results were presented in Table 2. Odds ratios instead of the normal logistic coefficients were presented in the table for a clearer understanding of the results. The findings show that regardless of survey mode, older legislators were more likely to complete the survey, and those from southern states, from more professional legislatures and who had served more years in office, were less likely to complete the survey. The one interaction term that was statistically significant was gender. Females were significantly more likely to complete the Internet survey than males.
Logistic Regression with Completed or Not Completed As Dependent Variable.
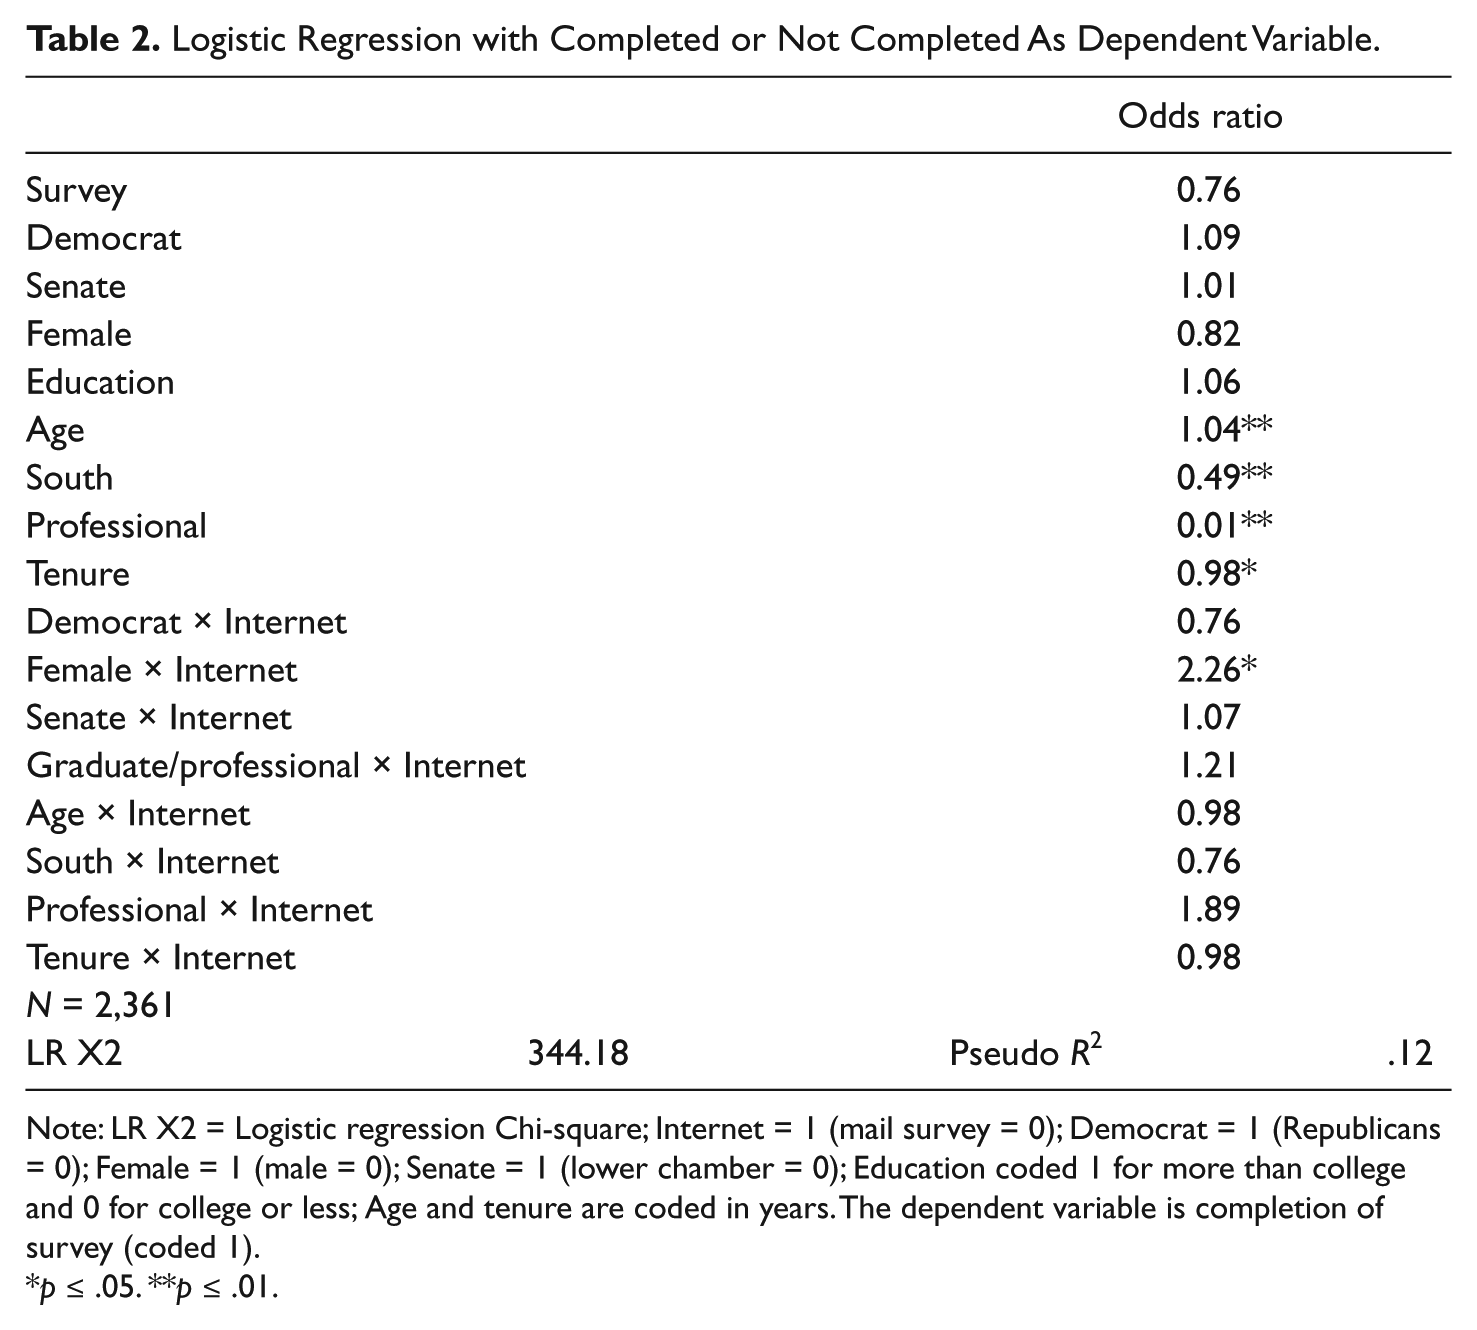
Note: LR X2 = Logistic regression Chi-square; Internet = 1 (mail survey = 0); Democrat = 1 (Republicans = 0); Female = 1 (male = 0); Senate = 1 (lower chamber = 0); Education coded 1 for more than college and 0 for college or less; Age and tenure are coded in years. The dependent variable is completion of survey (coded 1).
p ≤ .05. **p ≤ .01.
The above results suggest that although mail surveys produce a larger response rate, they are not necessarily more representative of the population. Neither survey produced biased results in party, education, or chamber. Both types of surveys produced biases in age, region, and professionalism. The biases in age and region were somewhat greater for mail surveys (see Table 1). The only really unique bias for Internet surveys based on Table 2 was that women were more likely to respond to them than were men, although in the bivariate less senior members were also more likely to respond to the Internet survey.
One-way analysis of variance (ANOVA) was used to test for differences in responses (see Table 3). These data suggest that both methods of surveys were likely to yield similar responses. The only statistically significant difference concerned the amount of time legislators worked when in session. Legislators who took the Internet version reported working significantly more hours when in session. Interestingly, these legislators reported working slightly fewer hours when not in session, although the difference was not significant. Overall, there are minimal differences between the two groups.
Differences between Responses by Mode of Survey.
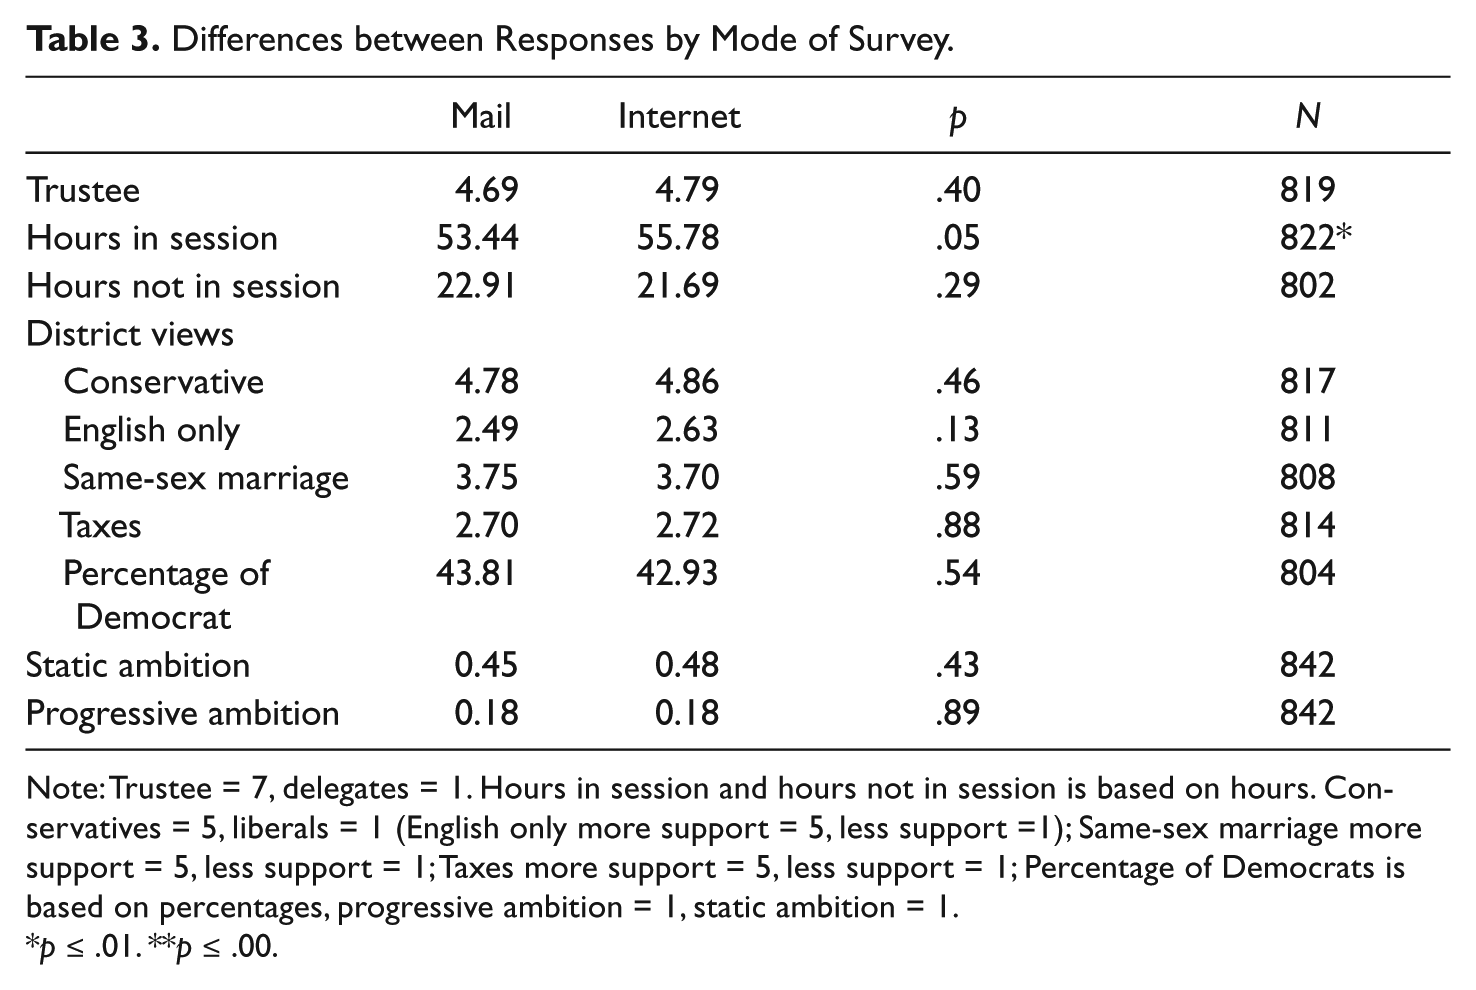
Note: Trustee = 7, delegates = 1. Hours in session and hours not in session is based on hours. Conservatives = 5, liberals = 1 (English only more support = 5, less support =1); Same-sex marriage more support = 5, less support = 1; Taxes more support = 5, less support = 1; Percentage of Democrats is based on percentages, progressive ambition = 1, static ambition = 1.
p ≤ .01. **p ≤ .00.
Conclusion
These findings suggest that although Internet surveys have lower response rates than mail surveys, they are not less representative of the population. With this project, the Internet surveys’ response rate was about a third that of mail surveys. However, we do not necessarily believe that this means Internet surveys are inferior. The Internet respondents were as representative as the mail respondents, although a little more female, and a little older, on average. In addition, the findings suggest that mail and Internet surveys resulted in similar responses to questions on various attitudes, traits, and reported behaviors. The obvious benefits of the mail survey were higher numbers but the Internet survey can generate a representative sample for less cost. The low response rate of Internet surveys could be detrimental when examining subgroups within the sample. Obviously, more respondents results in greater ability to break down the sample during analysis. However, if researchers increase the sample size of their Internet surveys, they can help compensate for the lower response rates. Moreover, as Internet surveys are less expensive if researchers use this advantage to increase the number of states examined, they do offer a viable alternative to mail surveys with some advantages.
Finally, it should be noted that we did not examine mixed method surveys, where respondents are offered a choice of survey mode. These may offer a way to reduce costs, although not to the same extent as simply using Internet surveys, while still allowing researchers a way to expand sample size and the population to include all states. We encourage other researchers to use mixed method surveys and report on their success.
Footnotes
Appendix
Acknowledgements
The authors would like to thank the small grant program of the American Political Science Association (APSA) and the Oklahoma State University Department of Political Science for funding this project. We also thank William Stewart, Monica Dudley, Chris Stuler, and Jada Butler, all from Oklahoma State University, and William Sweeney, of the University of South Alabama, for their research assistance.
Declaration of Conflicting Interests
The author(s) declared no potential conflicts of interest with respect to the research, authorship, and/or publication of this article.
Funding
The author(s) declared the following financial support for the research, authorship, and/or publication of this article: Rebekah Herrick received a grant from the American Political Science Association’s small research grant program to conduct the survey.