
Abstract
A comparative approach to studying the spread of policy innovations has recently yielded new and interesting results, as well as theoretical advancements, for policy diffusion research. Specifically, punctuated equilibrium theory has been offered as an explanation for why some policies spread quickly, while others do so normally, and still others are adopted very slowly. Studies of adoption speed, however, currently rely on careful case selection or a dichotomous categorization of adoptions as fast or slow to test why policies diffuse at different speeds. Building on this foundational work, I propose a method for measuring adoption speed as a continuous concept, so that it can be modeled directly as an important outcome of interest to diffusion scholars. I then use the new measure to evaluate how adoption speed varies across time and policy domain. I further demonstrate the utility of the measure as a dependent variable by replicating past results, including the interactive effect of complexity and salience on adoption speed and positive effect of federal incentives, as well as finding preliminary evidence that policy clusters spread more rapidly than the average stand-alone policy.
The American federal system affords the states opportunities to experiment with new ideas while learning from the experiences of their peers. Some ideas take hold and spread quickly, while others spread more slowly, and still others never get off the ground. The policy diffusion research program is inherently interested in why and how quickly innovative policies are adopted. Much of the extant research, however, focuses on the determinants of why a policy is adopted. Speed is less often systematically examined, primarily because it requires treating the policy as the unit of analysis, and large data sets of policies have only recently become available.
The state-centric approach to developing and testing diffusion theory has been a fruitful one; however, recent research demonstrates the additional value of a policy-centric approach (Nicholson-Crotty 2009). Whereas the state-centric approach helps us understand what makes a state more or less likely to adopt a given innovation, focusing on the policy as the unit of analysis allows us to test why diffusion patterns differ across diverse policy domains.
Examining diffusion speed, in particular, can help us test and advance policy diffusion theory in a new way. Even Walker (1969) observed that some policies spread more quickly than others (Nicholson-Crotty 2009). In fact, he postulated that the pace of adoption would increase over time, given advancements in communication technology and elite networking (Walker 1971). This remains, however, an untested supposition. It is difficult to test how and why some policies spread further and faster than others when our main outcome of interest is whether or not a state decides to adopt in a given year.
Although adoption speed is only one possibility for comparing innovations in a way that helps test and advance policy diffusion theory, it is particularly useful because it speaks to the different causal mechanisms underlying innovation adoption. Many studies frame diffusion as a process of incremental learning, though this is not the only potential causal pathway (Graham, Shipan, and Volden 2013; Shipan and Volden 2008). Incremental learning belies a process where some states innovate while others wait to evaluate their success before adapting and adopting. In other cases, however, states simply copy each other’s policies wholesale, which allows the policy to spread more quickly than otherwise expected under an incremental process. Past research makes clear that the American political system is prone not only to incrementalism but also to periodic punctuations where policies spread quickly (Boushey 2010; 2012; Nicholson-Crotty 2009) and in geographic patterns that are different than those anticipated by the early work on diffusion (Sigelman, Lowery, and Smith 1983). Examining the rate of policy adoption is a promising avenue for understanding why some policies follow an incremental adoption pattern while others burst onto the policy scene more quickly.
The extant research in this area provides insight into how a policy’s complexity and salience predict whether it is adopted quickly or slowly (Nicholson-Crotty 2009) and which types of policies diverge from a normal adoption pattern (Boushey 2010). Further advancements, however, require the development of a continuous measure of the dependent variable: adoption speed. A measure of adoption speed would allow researchers to directly model the rate of adoption and thus test why some policies spread quickly, others slowly, and still others follow a normal incremental pattern. To that end, I present a new continuous measure of adoption speed and use the measure to examine how it varies across time and policy domain. Doing so provides a test of Walker’s (1971) supposition that diffusion speeds up over time. Finally, I demonstrate the utility of modeling a continuous measure of speed by replicating past results regarding federal intervention and the interaction between policy complexity and salience, while also finding evidence that some policies spread more quickly when clustered together.
Policy Diffusion Theory and Adoption Speed
The prolific policy diffusion research program focuses primarily on answering why and how innovative policies spread within the American federal system and internationally (Graham, Shipan, and Volden 2013). Within the American context, scholars have identified specific internal characteristics, external influences, and policy attributes that shape the likelihood of a state adopting a new idea. Specifically, each state’s internal political, social, and economic environment shapes how receptive it is to new ideas (F. S. Berry and Berry 1990; Boushey 2010; Grossback, Nicholson-Crotty, and Peterson 2004; Savage 1978; Walker 1969), while the horizontal and vertical relationships within the American federal system promote, and sometimes inhibit, the spread of these ideas (W. D. Berry and Baybeck 2005; F. S. Berry and Berry 1990; Karch 2012; Nelson and Mason 2007; Shipan and Volden 2006; Welch and Thompson 1980). Furthermore, an innovation’s characteristics shape the rate, scope, and pattern of its spread (Boushey 2010; 2012; Mooney and Lee 1999; Nicholson-Crotty 2009; Savage 1985). In fact, it is the complex interaction of these three components that drive substantial variation in the diffusion of policy innovations (Boushey 2010; 2012).
Political scientists have also identified specific causal processes that motivate the spread of innovations. Policy learning, for instance, captures an incremental process whereby legislators are trying to solve a policy problem and do so by learning from the successes and failures of other states (F. S. Berry and Berry 1990; Gray 1973; Shipan and Volden 2008; Walker 1969). The normal s-curve of cumulative adoptions over time provides a useful heuristic for this process (Gray 1973) where a few initial innovators adopt a new policy, while the rest of the potential adopters wait to see how that policy is working before choosing whether to adopt it. Of course, the policy may be adopted wholesale, but it may also be altered to suit the needs and characteristics of a given state (Glick and Hays 1991; Hays 1996).
Although incremental learning receives a great deal of attention by political scientists, it is not the only causal process. Interstate competition is also a vital product of the American federal system (Dye 1990) and an additional motivator of innovation adoption (Baybeck, Berry, and Siegel 2011; W. D. Berry and Baybeck 2005; Shipan and Volden 2008). Social contagion propels the spread of an innovation through changes in state-level public opinion (Pacheco 2012). Finally, contagion also occurs as policies capture a greater share of national issue attention (Boushey 2010) and/or experience common exogenous shocks from federal intervention (Boushey 2012; Nicholson-Crotty 2009; Welch and Thompson 1980). This contagion prompts a faddish response where states directly imitate popular policy proposals and, consequently, ideas spread rapidly.
Until recently, however, political scientists focused largely on explaining the diffusion of individual policies, often finding an incremental learning pattern at work. That being said, scholars recognized early on that some policies spread more quickly than others and thus deviate from the expected incremental learning process (Savage 1985). Furthermore, research in other areas of policy making, namely, agenda setting, shows that the American political system is prone not only to incrementalism (Lindbloom 1959) but also to periods of rapid policy change (Baumgartner and Jones 2009; Jones and Baumgartner 2005). This is no less the case for state policy making and innovation adoption (Boushey 2012; Breunig and Koski 2006). It is useful, therefore, to examine adoption speed, as it helps us better understand the causal processes that underlie different policy diffusion patterns. Variation in the rapidity of innovation adoption helps scholars understand when policies spread rapidly, due to exogenous shocks, slowly due to internal barriers, or normally due to a mixture of the two (Boushey 2010; 2012).
In addition, studying the rate of adoption allows diffusion researchers to test how characteristics of the policies influence their acceptance by the states (Makse and Volden 2011; Nicholson-Crotty 2009). This is an important development, as these features are among the most manipulable aspects of the determinants of diffusion. It is far easier to alter a bill’s complexity or public salience than to change the professionalism of a state’s legislature. Such a line of inquiry becomes increasingly important for both scholars and practitioners as organizations like the American Legislative Exchange Council (ALEC) and the State Innovation Exchange (SiX) successfully target the states with volumes of model legislation (Hertel-Fernandez 2014).
At present, the most comprehensive study of diffusion speed is Nicholson-Crotty’s (2009) analysis of 57 policies, which shows how policy characteristics like salience and complexity interact to shape whether a policy is adopted quickly or not. Although this is an important advancement, the dependent variable used in the analysis, diffusion speed, remains a dichotomous categorization. The cut point is theoretically justified using the normal adoption curve from innovation theory (Rogers 2003); however, it does not capture the continuous underlying concept of adoption rate. 1 Therefore, the present approach only allows researchers to draw conclusions about the categorization of a policy as fast or slow. It does not offer a continuous measure of adoption speed, and thus, we cannot draw conclusions about the degree to which innovation attributes increase or decrease the speed of adoption.
Boushey’s (2010; 2012) work on merging punctuated equilibrium theory (PET) with policy diffusion theory also provides evidence that different types of policies (Lowi 1964; 1998; 1972) deviate from the expected incremental learning pattern. PET provides a useful theoretical advancement for understanding both rapid and incremental adoption; however, the existing tests of this theory do not yet directly model adoption speed. Boushey (2012) uses careful case selection, based on Lowi’s (Lowi 1964; 1972) policy typology and the Bass (1969) model to provide intuition into how policy characteristics influence the rapidity of adoption but does not directly measure or test them. Directly testing PET and understanding the factors contributing to rapid, normal, and slow adoption requires explicitly measuring and then modeling adoption speed. I turn now to proposing a new continuous measure of adoption speed for this purpose. After describing the data and method use to calculate the measure, I demonstrate the utility of directly modeling a continuous measurement of adoption speed by replicating important past results from Nicholson-Crotty (2009) and Boushey (2010; 2012), while also providing an advancement in the measurement of policy characteristics.
Measuring and Testing Adoption Speed
To improve the external validity of diffusion studies, researchers have assembled large data sets of policies adopted by the American states (Boehmke and Skinner 2012; Boushey 2010; Makse and Volden 2011; Nicholson-Crotty 2009). The largest publicly available data set was collected by Boehmke and Skinner (2012) and includes 136 policies from multiple domains whose first adoption occurred between 1912 and 2009. This article uses their data, as well as that collected by Makse and Volden (2011). It also uses data on 15 policies collected by the author, resulting in a full data set of 172 policies. 2 Both the Boehmke and Skinner (2012) and Makse and Volden (2011) data sets include adoptions that were collected by the authors themselves, as well as gathered from previously published diffusion studies. Although collecting first adoption dates is becoming easier as state governments put more materials on the Internet, this data set does not represent a random sample of policies. The lack of a clear sampling frame and necessity of convenience sampling for diffusion studies is a persistent issue for this research program (Savage 1978). This data set, however, confers two advantages for the present study. First, it provides a diverse set of policies that cover many of the major domains of state policy making (e.g., education, health, and criminal policies, among others). Second, given that these data were largely collected by other researchers, they were not chosen based on the dependent variable of this particular analysis (Nicholson-Crotty 2009).
Measuring Innovation Adoption Speed
I use survival analysis to measure adoption speed. Survival analysis is the prevailing methodology in policy diffusion studies that examine the likelihood of state innovation adoption; however, I use it in a different way to measure the relative speed of adoption for a given policy. 3 Instead of constraining each policy to the same specification of a baseline hazard function, I used the more flexible Weibull distribution for each calculation (see Box-Steffensmeier and Jones 2004). 4 The Weibull distribution allows the hazard to increase or decrease monotonically over time or reduces to a flat exponential distribution if the hazard does not change with time. The resulting scale parameter for each policy provides a measure of adoption speed that is comparable across policies, and the shape parameter provides a sense of how speed changes during the diffusion process. 5 They are comparable because each model is an intercept-only model with time to adoption as the response variable. Thus, the scale parameter (i.e., the constant) for each model is akin to an average adoption time but adjusted for the right censoring of observations that have not adopted the policy. I then subtract each speed estimate from one and rescale them so they range from zero (lowest speed) to one (highest speed).
To make the interpretation of the speed measures more intuitive, Figure 1 displays the cumulative adoptions of three different policies over time. The name and rescaled speed calculation are included next to each plotted line. Given the distribution of adoptions over time for each policy and variation in how widely they are adopted (i.e., the degree of right censoring), the subsequent speed measures perform as expected. For example, all 48 states adopted old age assistance programs within three years of the federal government passing the Social Security Act of 1935 (SSA). 6 However, states were far slower to adopt early voting and have remained reticent to do so. Two states adopted early voting in 1970 (Hawaii and Idaho) but no more followed suit until the 1990s. Furthermore, only 16 states had adopted early voting at the time that the data were collected. As a result, these policies represent the fastest and one of the slowest in the data set, respectively.
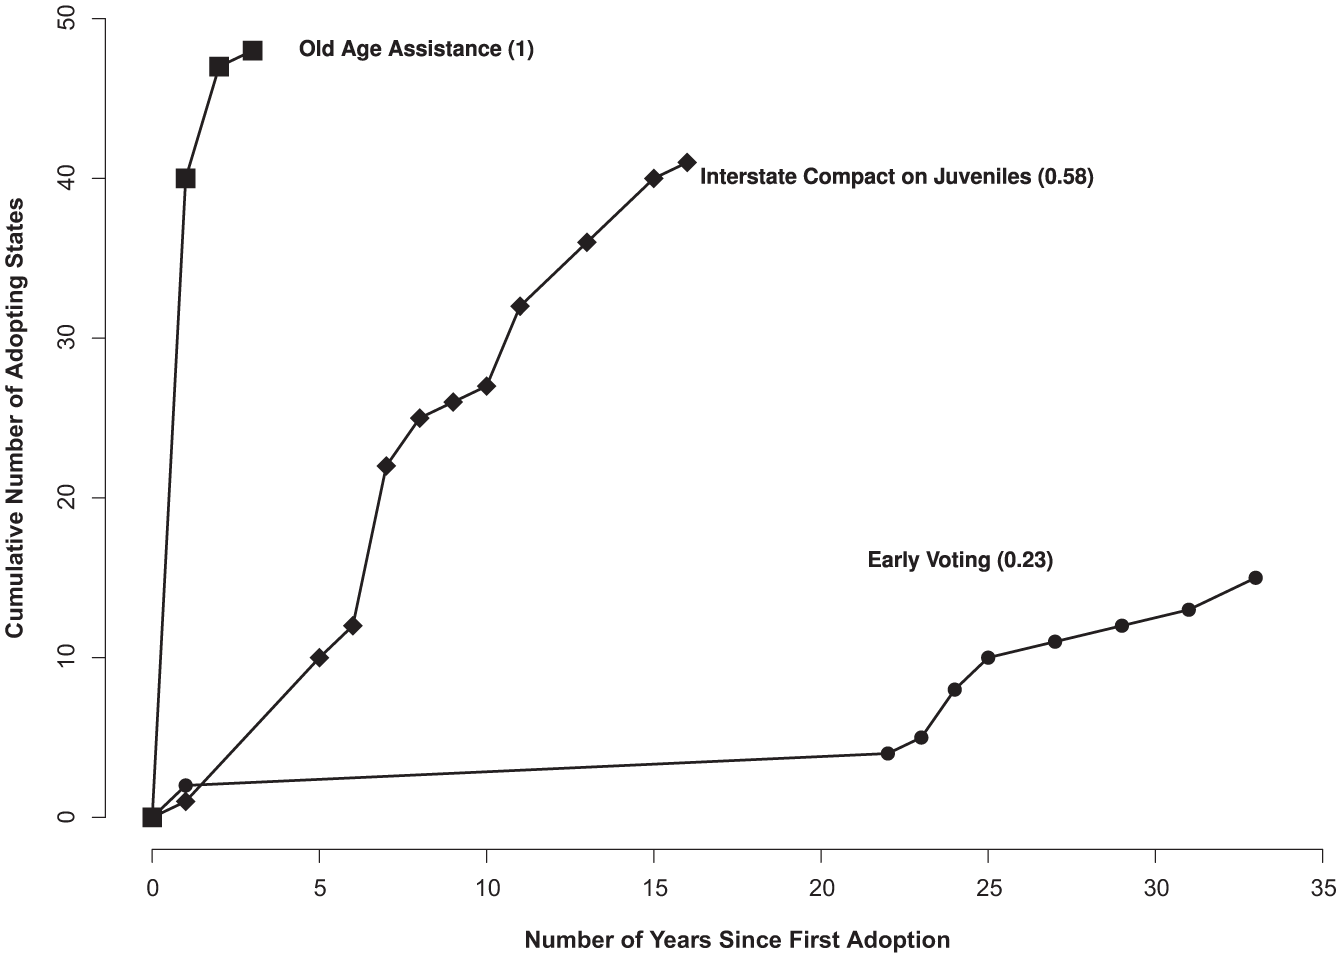
Plot of the cumulative number of adoptions across years since first adoption for a fast-adopted, slow-adopted, and average policy.
State adoption of the Interstate Compact on Juveniles, however, represents a middle-of-the-road policy, in terms of speed. It displays an incremental adoption pattern in that a lag occurred between the first few adoptions in 1950 and 1951 and the steady stream that followed between 1955 and 1966. These three policies highlight how this measure is useful for arraying policies by their adoption speed. It conforms with what is known about how policies deviate from the normal incremental learning pattern (Boushey 2010; Gray 1973) and is thus useful for identifying departures from incremental learning that may instead follow an alternative causal process (Boushey 2010; Nicholson-Crotty 2009; Shipan and Volden 2008).
Comparing the Dichotomous and Continuous Measures
Using survival analysis to calculate the speed measure confers advantages over the previous approach of dichotomizing policies as either fast or slow. First, my approach allows the resulting speed measure to incorporate information about nonadoption. Nicholson-Crotty’s (2009, 197) speed measure is based on whether “over 50% of adopters do so within the first third of the temporal distribution.” This does not capture the fact that policies vary in the extent to which they are adopted by all 50 states. A survival model allows for right censoring, which adjusts the resulting hazard function based on the fact that these units have not adopted at the end of the measured time period. It also does not require a decision about when to end the distribution of adoptions, which is useful given that most of the adoption data collected by diffusion scholars capture only a snapshot of time. 7 Finally, and perhaps most importantly, my approach does not require selection of a cut-off point for defining a rapid adoption. It captures the continuous nature of adoption speed and consequently allows researchers to examine how policies are sorted along this dimension and directly models the factors that relate to adoption speed.
As a demonstration of the differences between the dichotomous and continuous measures, Figure 2 displays a scatterplot of the estimated speed measures along the y-axis. They are arranged along the x-axis based on the percentage of policy adoptions that occurred in the first third of the observed adoption timespan (i.e., the cut-point use in Nicholson-Crotty, 2009). If the continuous measure is simply dichotomized based whether they were adopted faster or slower than average, the black dots indicate policies where our measures agree, and the red triangles indicate policies that are misclassified under one of the measures.
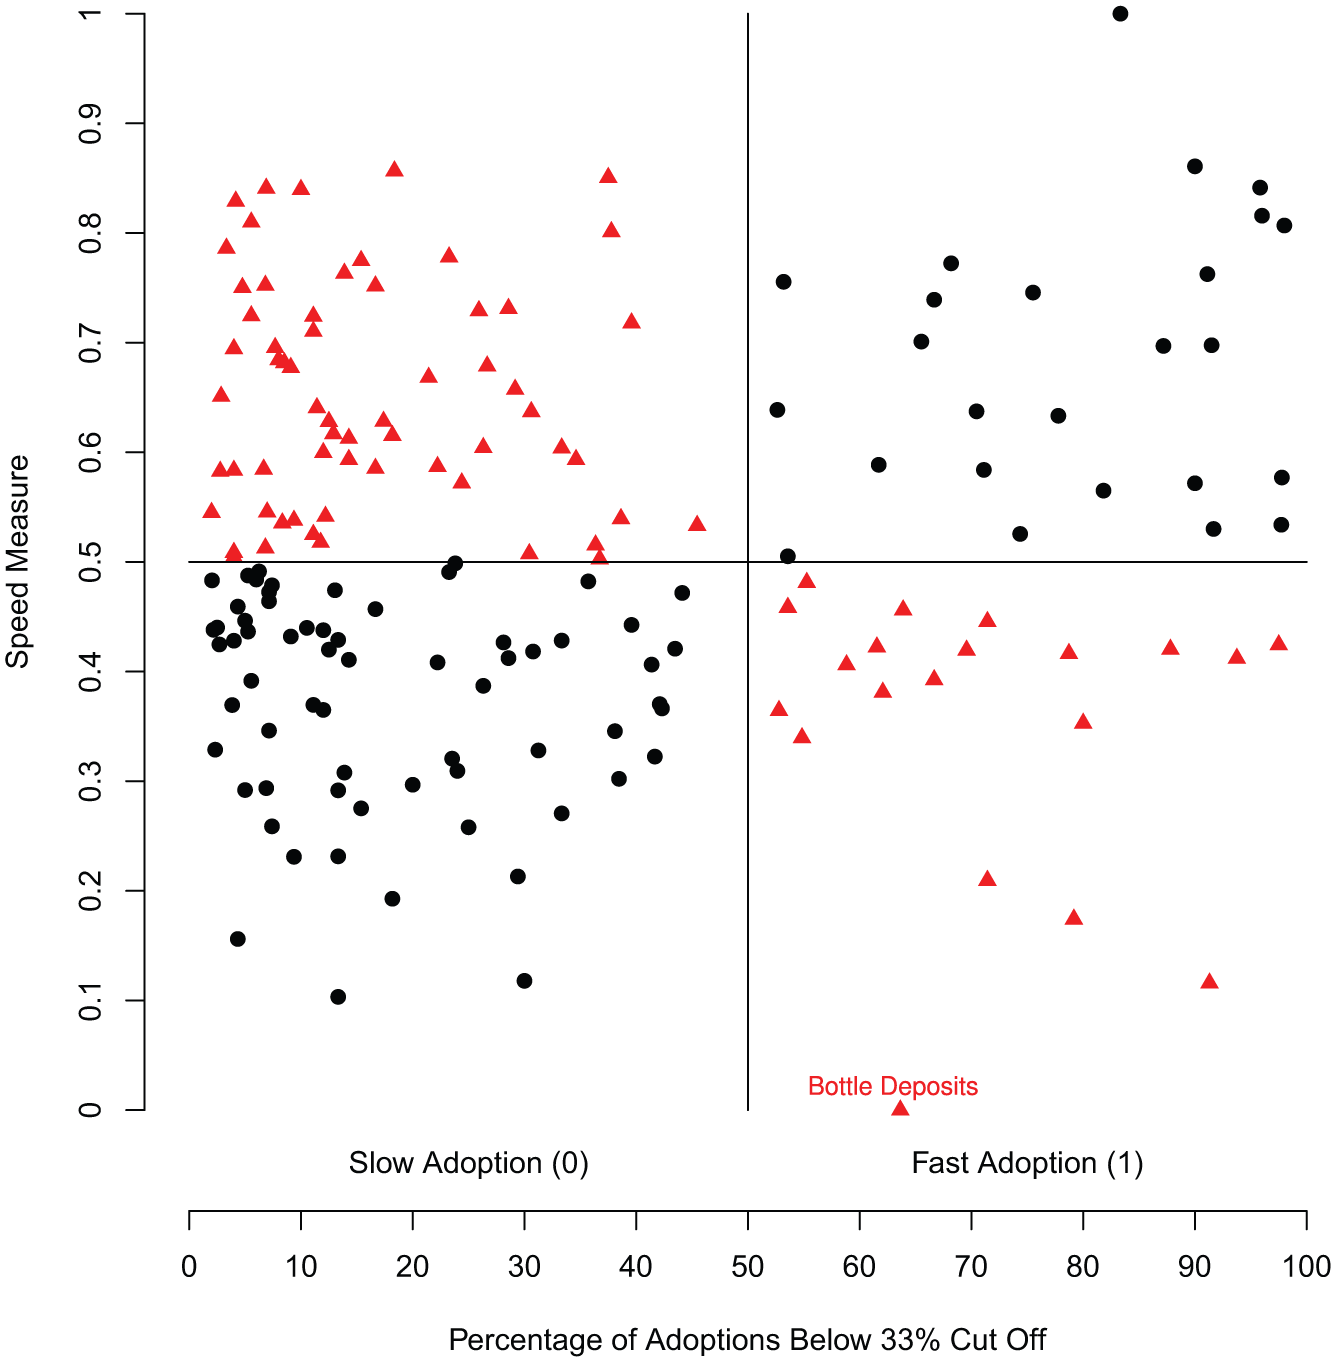
Scatterplot of the estimated adoption speed measures and their corresponding dichotomous classification.
An illustrative example demonstrates why my measure categorizes some differently and the advantages of the continuous measure. State bottle deposit laws, for instance, are the slowest diffusing in the data set. They are also a fast adoption using the dichotomous categorization. The discrepancy arises due to the fact that the initial adoption occurred in 1971 and the last recorded adoption is in 2002. Of the 11 adopting states, 10 adopted the policy by 1986, which is what makes it a rapid adoption under the previous coding scheme. This ignores, however, the fact that only 11 of the 50 states adopted the law, and there was a substantial gap between the first and last recorded adoption. The continuous measure is adjusted based on both of these features.
Preliminary Analysis Using the Speed Measures
Initial exploration of the speed measures confirms a long-posited theory that policy innovations spread more rapidly throughout the second half of the twentieth century (Walker 1969, 1971). Specifically, Walker predicted that interstate professional organizations for bureaucrats and legislators would increase cross-state communication, as well as the pressure to conform, and thus also increase the rapidity of innovation adoption. Figure 3 displays a scatterplot of the adoption speed measures across time. They are plotted based on the year of the first adoption. Also plotted is a vertical line marking the year 1965, after which point speed appears to be consistently increasing. This figure supports Walker’s prediction, which appears quite prescient given his article was published in 1969. 8 Furthermore, this suggests that learning is either declining as a motivating mechanism of diffusion or occurring more quickly over time. Further empirical testing is required to confirm the cause of this trend in adoption speed.
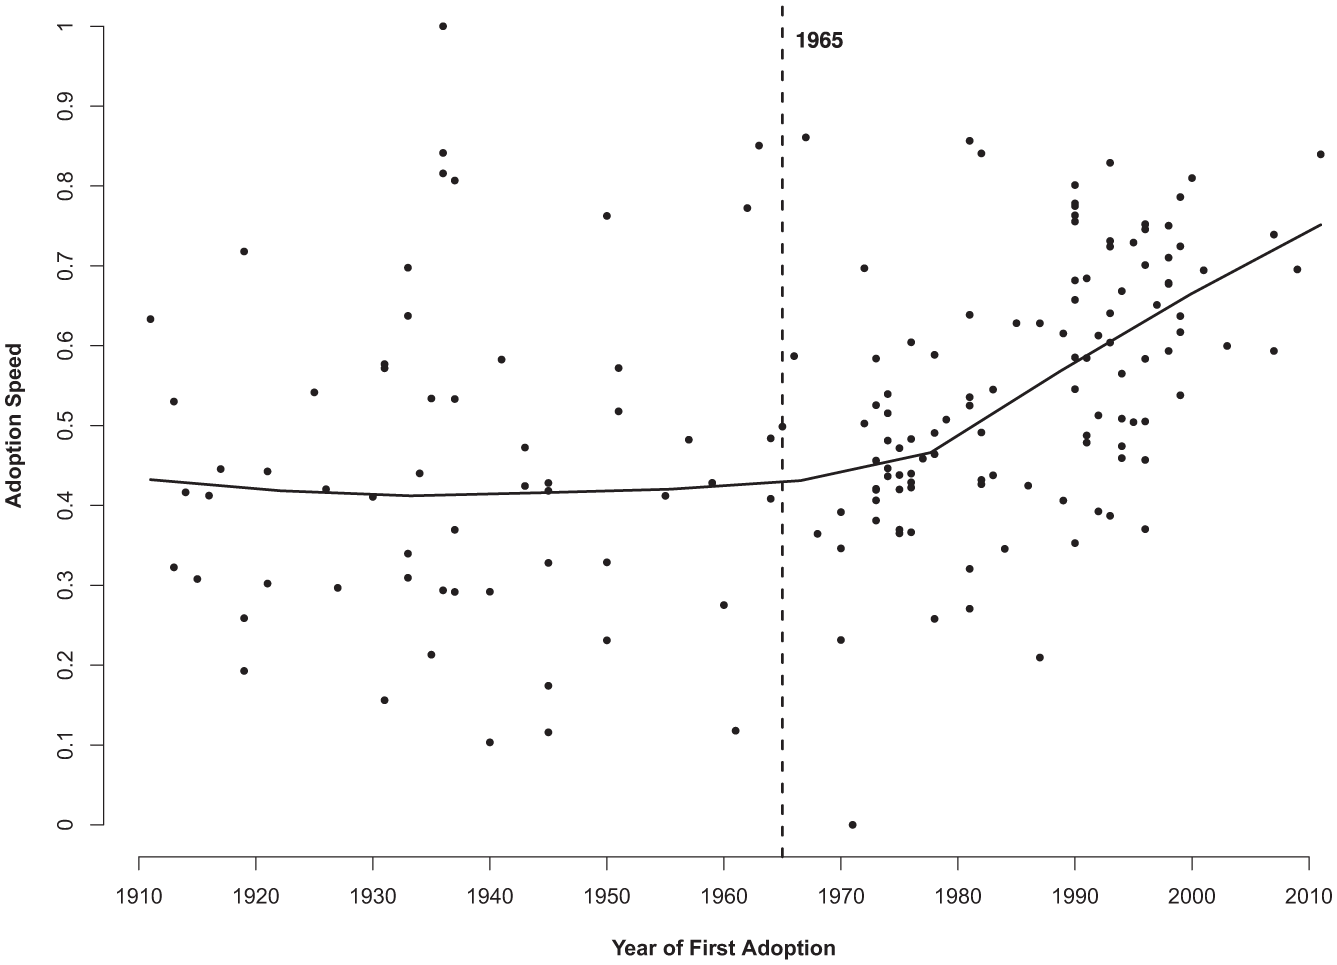
Scatterplot of adoption speeds across time with a Local Regression (LOESS) line demonstrating the increase in adoption speed after 1965.
Given the identification of each policy with a particular domain, I can also examine the differences in speed across domains. Figure 4 shows the mean and 95% confidence intervals for the 17 policy domains included in the data set. 9 It also shows a solid horizontal line at the average speed (0.51) and a dashed line at the midpoint between 0 and 1 (0.50). Including both demonstrates that there is very little skew toward either fast or slow policies in the data set. Also included are the number of observations for each policy domain. Given the variation in the number of included policies, there is associated variance in the precision of the estimated mean speed for each category. That being said, this figure provides an initial intuition regarding whether certain types of policies tend to spread more or less quickly than the average for the data set. Including all the categories further highlights the domains in which diffusion scholars should work to collect additional adoption data. Many of the under-represented domains are important areas of state legislative activity (e.g., agriculture). It is presently difficult to compare the average speeds across domains, as there is not enough precision in their mean speeds. It is possible to evaluate how a domain compares to the average speed of the entire set, but it is difficult to compare between domains. Additional data aggregation efforts are necessary for more precise comparisons between domains.
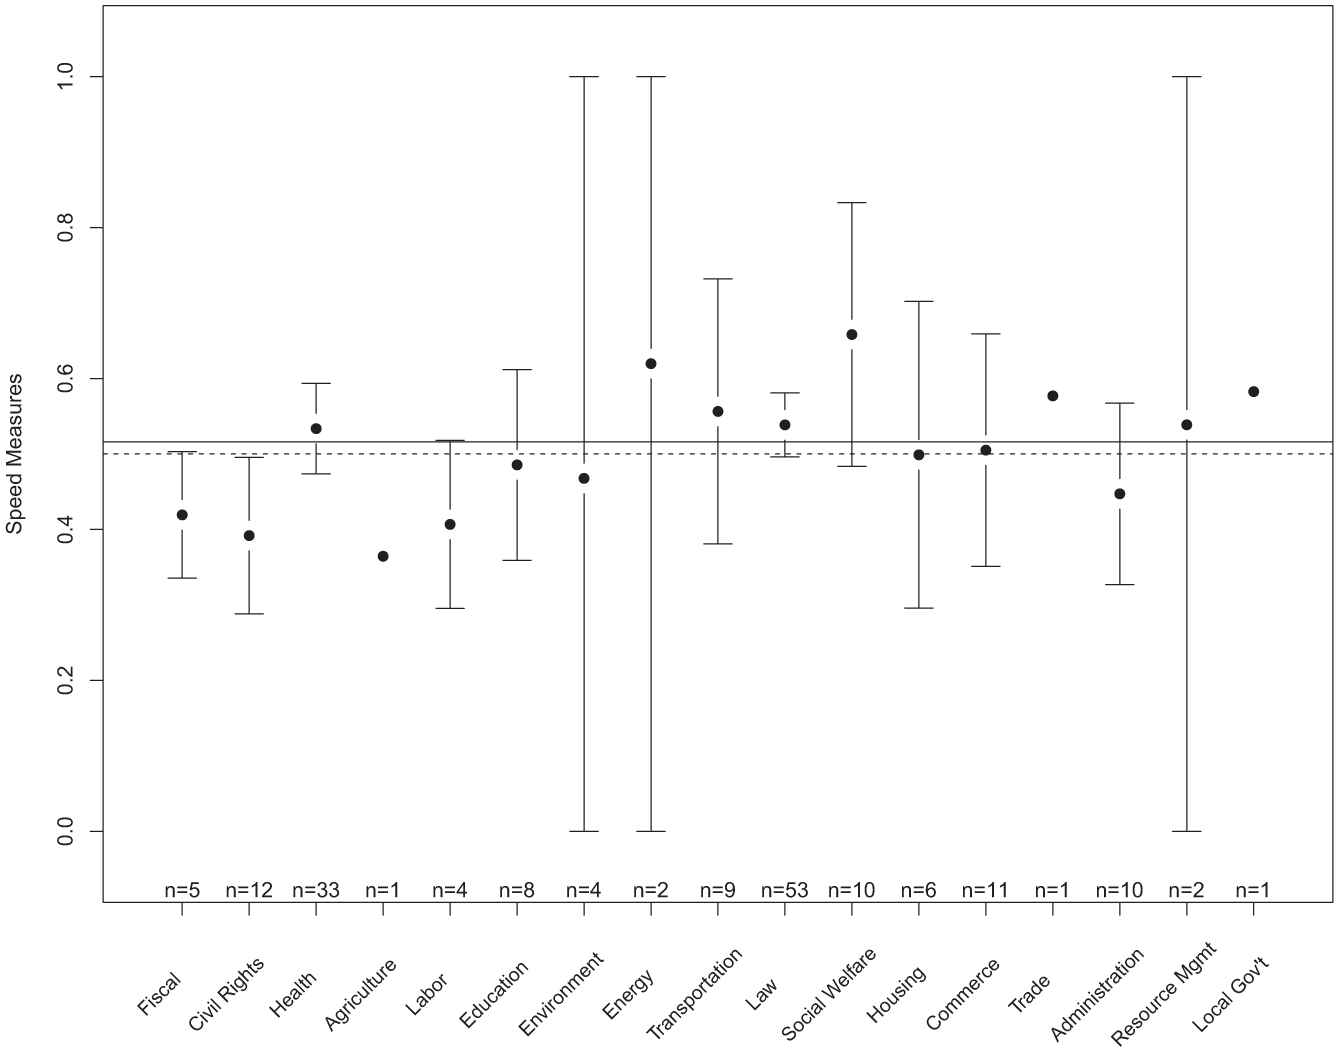
Plot of mean speeds and 95% confidence intervals for 17 policy domains. Domains are assigned based on the Policy Agendas Project coding scheme.
Civil rights policies clearly spread more slowly than average, which is surprising given that this category often includes morality policies that are expected to spread more quickly (Mooney and Lee 1999). Fiscal policies also spread slower than average. Although the precision of these estimated means should improve as researchers continue to gather information on more policies, it is clear that substantial variation remains, even within policy domains that are well represented in the data set.
Modeling Adoption Speed
Having laid out the logic of the new measure of adoption speed and explored some initial findings, I now turn to demonstrating the utility of using a continuous measure of adoption speed as a dependent variable. 10 To do this, I draw on Boushey’s (2010; 2012) theoretical framework and related findings (Nicholson-Crotty 2009; Makse and Volden 2011). Specifically, I examine how some characteristics of the innovations, as well as an exogenous shock from federal intervention, affect the speed of innovation adoption. In doing so, I test two existing hypotheses while also testing a new hypothesis about the effect of clustering on the speed of policy adoption. 11
Salience and Complexity
Two policy characteristics that exhibit consistent effects on policy innovation adoption are complexity and salience (Boushey 2010; J. Clark 1985; Eshbaugh-Soha 2006; Gormley 1986; Hays 1996; Karch 2007; Makse and Volden 2011; Mooney and Schuldt 2008; Nicholson-Crotty 2009). Technically, complex policies tend to spread slowly, as they require the extensive engagement of experts both for formulation and implementation. Furthermore, legislators have a higher threshold of skepticism to overcome in deciding to adopt these new ideas (Karch 2007). Although complexity acts like a break pedal, high public salience is the gas that increases the likelihood of rapid adoption. There is a higher demand among constituents for a policy solution if the problem is highly publicized or widely felt, and when policies gain a larger share of the agenda space, they are more likely to experience a punctuation (Baumgartner and Jones 2009; Boushey 2010). Given that one applies a break and the other gas, these two characteristics have an interactive effect on adoption speed (Nicholson-Crotty 2009).
I follow the current convention for classifying policies as complex, which relies on researcher evaluation and assignment of each policy to a particular domain (Nicholson-Crotty 2009; Ringquist, Worsham, and Eisner 2003). Policies are complex if they fall into the “energy, environmental pollution, health care (provision, finance, and licensing), taxation, trade, and fiscal regulation” policy domains (Nicholson-Crotty 2009, 198). 12 Thus, policies are either complex or they are not. 13 There are 46 complex policies in the final data set. Consistent with current evidence, I expect that technically complex policies are adopted more slowly than simple ones.
I also include two measures of national issue salience: national media coverage and public opinion. National media salience is measured using the proportion of New York Times coverage for a given policy’s major topic area. 14 Public opinion is captured via Gallup’s Most Important Problem poll. 15 The Gallup Poll captures the relative importance of each policy topic among citizens. National media and a higher ranking of importance among the public should raise their share of national issue attention and thus increase the speed at which states consider and adopt related innovations.
Finally, I include interactions between each salience measure and complexity to test their conditional relationship with speed. I expect salience to show a positive effect on adoption speed but for that effect to be smaller, or perhaps nonexistent, when a policy is complex.
Policy Clustering
One, previously untested, concept from the broader theory of innovation diffusion that applies well to public policy is the “technology cluster” (Rogers 2003). Essentially, a technology cluster represents closely related innovations where “the adoption of any one technology from a cluster, spurs adoption of related technologies within the same cluster” (Vishwanath and Chen 2006, 1452). This is not only a phenomenon in technology innovations (Knudsen, Ducharme, and Roman 2007), though it is perhaps most visible in that domain. Political scientists are familiar with the concept of technology clusters through the frame of omnibus legislation. Sometimes, these are unrelated bills, some of which are less broadly palatable among the chamber, but more often they include related bills that are bundled together to achieve one large policy change (i.e., a punctuation) when many incremental efforts may otherwise fail (e.g., the Affordable Care Act). In the case of policy diffusion, related innovations may spread together, thus increasing their ability to spread quickly. 16
I use two specific criteria in identifying policy clusters in the data set. First, the policies must be topically related and second, their first adoption should occur in the same year or very close to the same year. Topical relation refers to whether the policies are categorized using the same major topic code. In the present case, I use a strict standard of temporal relation. Specifically, I only identify a group of policies as a cluster if their initial adoption year is the same. 17 This increases the likelihood that the policies were either packaged together by the original adopter or could potentially be packaged together by subsequent adopters. Using these criteria, I identified one clear policy cluster in the data set. It includes four health insurance regulations—guaranteed issue of health insurance, guaranteed renewal of health insurance, health insurance portability, and health insurance preexisting condition limits—that are closely related in terms of the issue they are addressing (i.e., health insurance), and all started diffusing in the same year (1990). Furthermore, of the 47 states that adopted at least one of these provisions, 19 adopted all four in the same year, and many of the remaining states adopted the policies within a three-year window. This further suggests that these laws were either explicitly bundled together or considered simultaneously and passed in short succession. Given the likelihood that these policies were considered and adopted in tandem, they are expected to behave like a technology cluster and spread faster than the average policy.
Federal Intervention
A long-standing finding in policy diffusion research is that federal intervention, either directly through mandates and incentives or indirectly through issue attention, raises the likelihood and speed of innovation adoption (Allen, Pettus, and Haider-Markel 2004; Karch 2006; 2012; Nicholson-Crotty 2009; Welch and Thompson 1980). Boushey (2010; 2012) refers to federal intervention as an exogenous shock that raises the national profile of a policy and thus its position on state agendas. Similar to previous studies, federal incentives measured using a dichotomous indicator of whether a financial incentive was available during the time that states were adopting the measure (Nicholson-Crotty 2009).
Results of the Adoption Speed Model
When selecting a modeling approach for studying diffusion speed, it is important to account for the fact that there is uncertainty in the associated estimates. Modeling them directly without accounting for this uncertainty can result in inconsistent standard errors and induce heteroscedasticity (Lewis and Linzer 2005). One approach to modeling how policy characteristics associate with more or less rapid adoption is to use a pooled survival model and include fixed effects for the policies in the main and ancillary equations. In fact, including only these fixed effects and no covariates will recover the same raw scale and shape parameters calculated above.
Table 1 presents the results of a series of Weibull-distributed accelerated failure time (AFT) models, which examine how the policy attributes presented above relate to how quickly a policy spreads. Given the AFT form, coefficients with a negative sign are interpreted as decreasing the time to failure (i.e., faster adoption), and those with a positive sign are interpreted as increasing the time to failure (i.e., slower adoption). The Base Model does not include any policy fixed effects, but it does generally support the hypotheses presented above. 18 Federal incentives and national media salience (i.e., coverage in the New York Times) decrease the average time to adoption, and the health insurance cluster also has a faster than average pace of adoption. The results also show the conditional relationship between policy complexity, public salience, and adoption speed. The second model, however, demonstrates that national media salience does not appear to have the same interactive effect.
Table of Results for Weibull-Distributed Pooled Accelerated Failure Time Models of Policy Innovation Adoption.
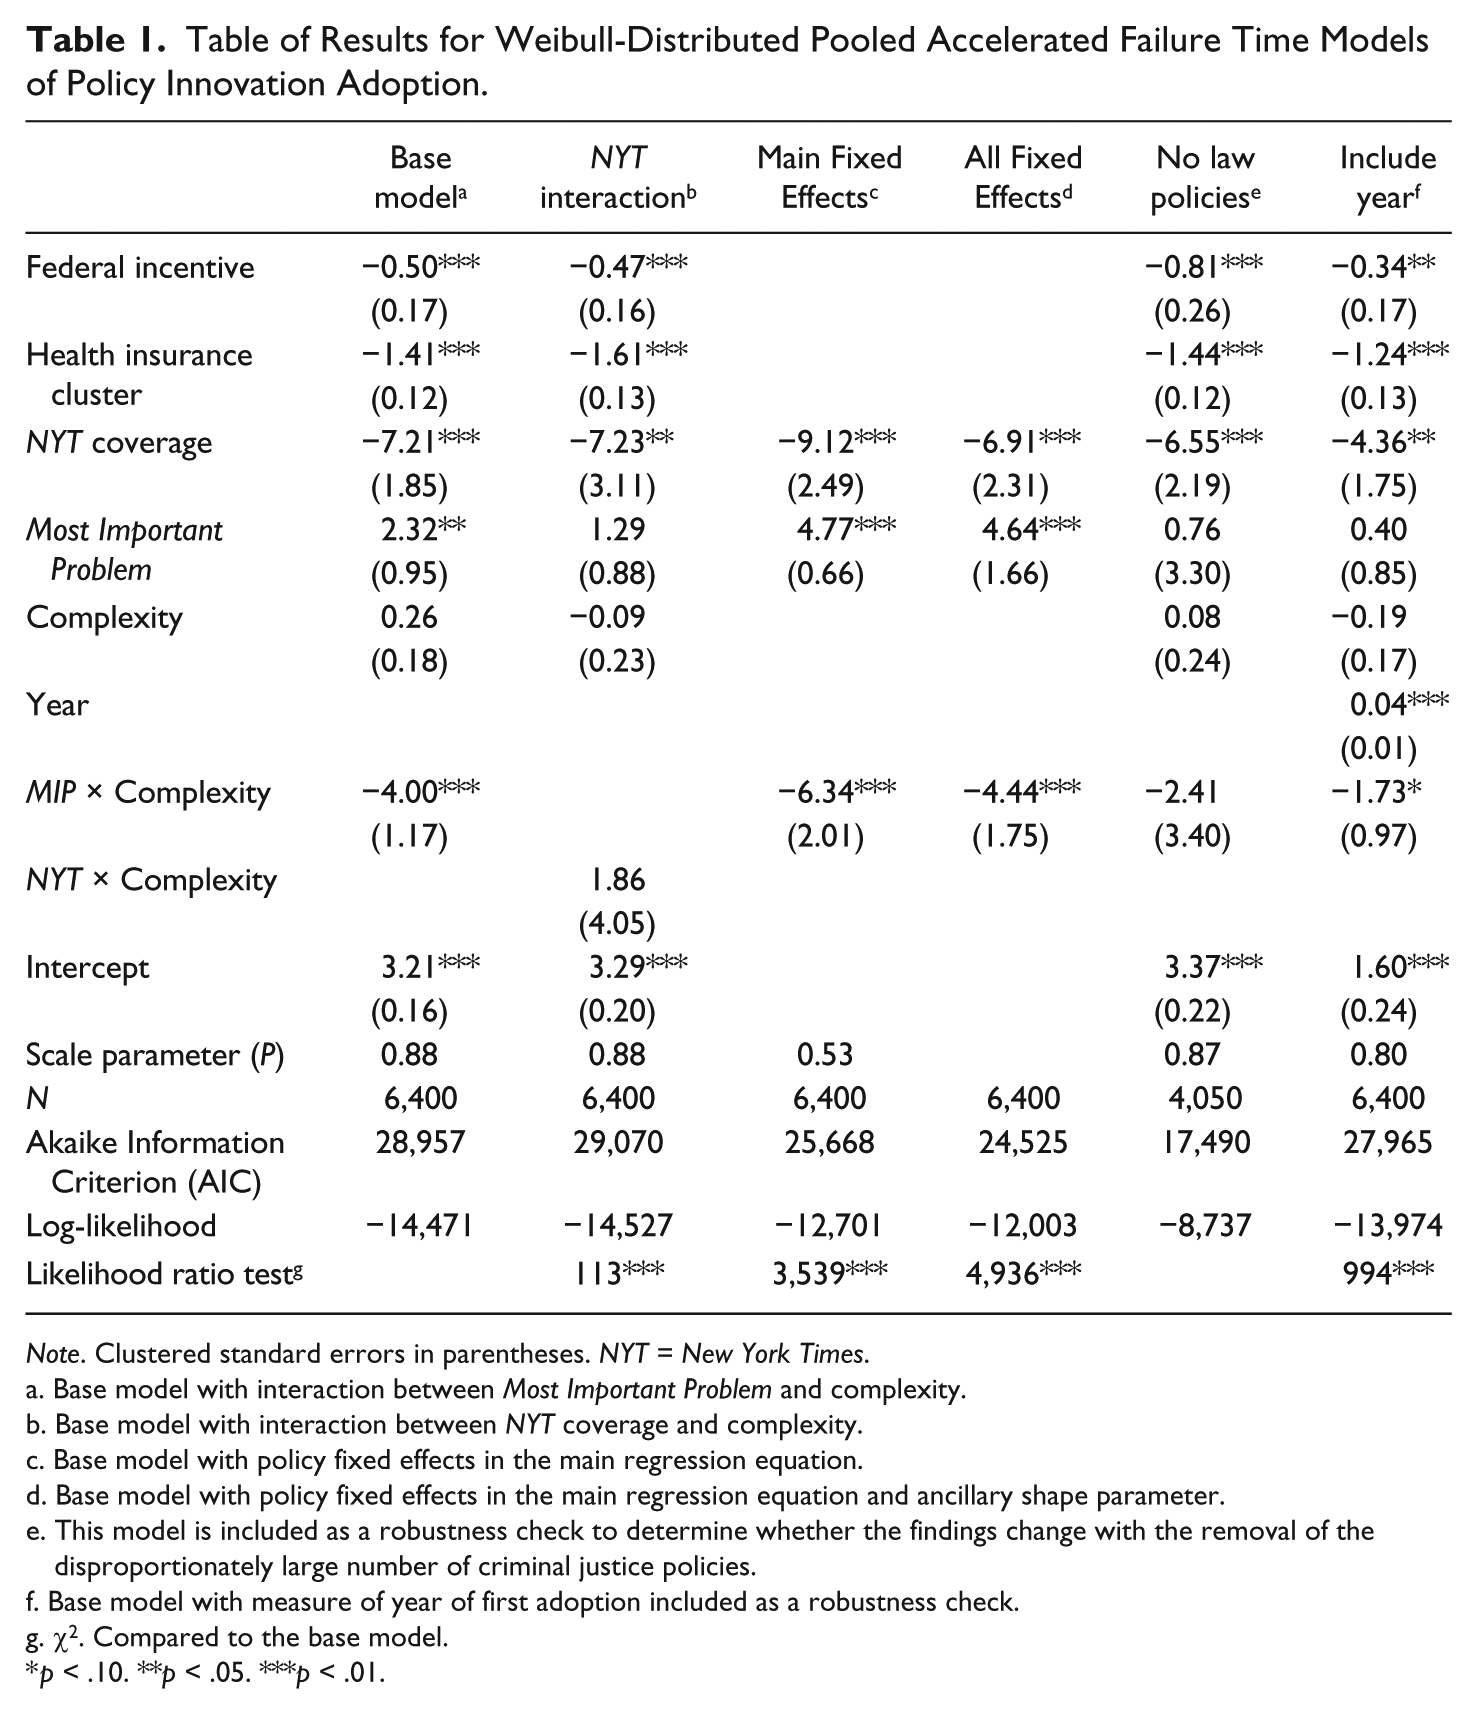
Note. Clustered standard errors in parentheses. NYT = New York Times.
Base model with interaction between Most Important Problem and complexity.
Base model with interaction between NYT coverage and complexity.
Base model with policy fixed effects in the main regression equation.
Base model with policy fixed effects in the main regression equation and ancillary shape parameter.
This model is included as a robustness check to determine whether the findings change with the removal of the disproportionately large number of criminal justice policies.
Base model with measure of year of first adoption included as a robustness check.
χ2. Compared to the base model.
p < .10. **p < .05. ***p < .01.
To allow for variation in the shape and scale parameters across the policies, the next two models include fixed effects for policies in the main equation and then in both the main and ancillary equations. When they are added to the main equation, but P is still constrained to a single value, national media salience, public salience, and the interaction yield similar signs and statistical significance, though the absolute size of each effect increases. 19 All these covariates retain the same signs and levels of significance when fixed effects are added to the ancillary term, though the magnitude of the effects declines.
To provide a clearer picture of the conditional effects of complexity and salience, Figure 5 plots the marginal effect of public salience (Most Important Problem) for noncomplex and complex policies. Interestingly, I find the opposite of the expected effect of salience on adoption speed. For noncomplex policies, increasing public salience actually increases the time it takes for a policy to diffuse. Meaning, they diffuse more slowly than those with lower public salience. For complex policies, the effect of public salience is no longer distinguishable from zero. The interaction also suggests that increasing salience decreases the effect of complexity; however, the estimate of that effect cannot be directly evaluated, as it is incorporated across the set of policy fixed effects.
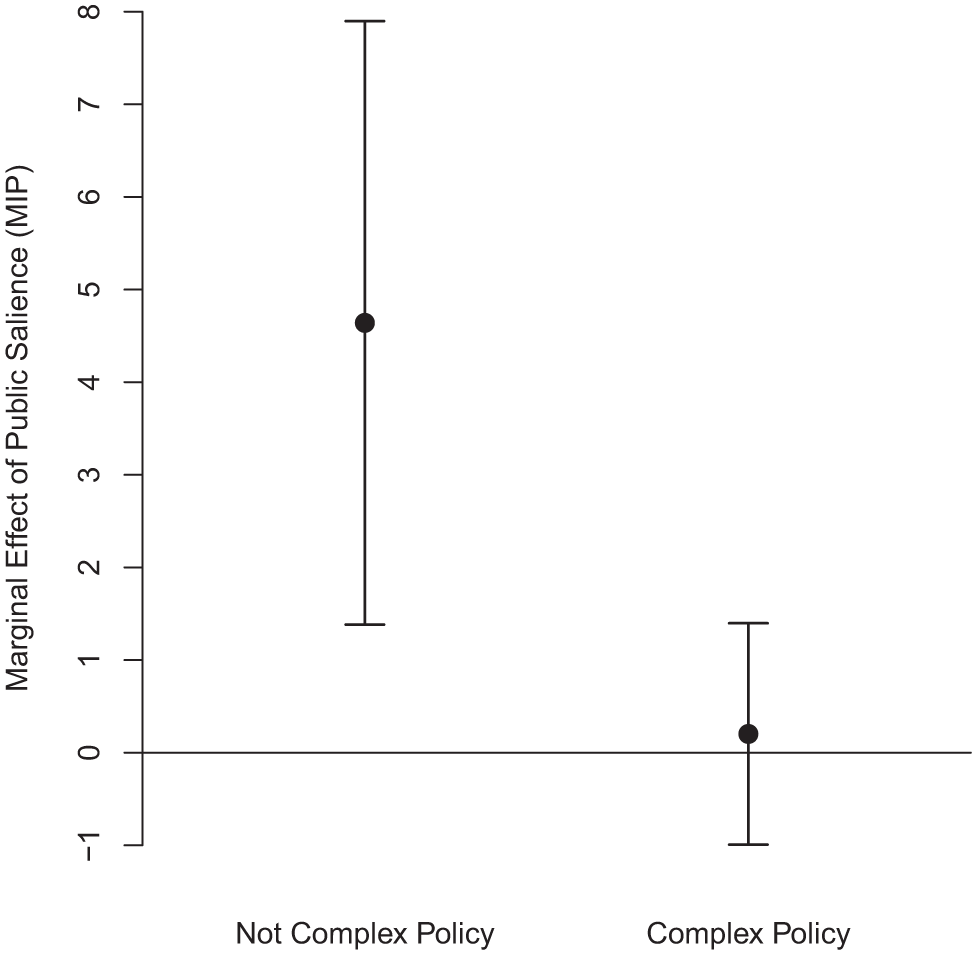
Marginal effect of public salience by policy complexity with 95% confidence intervals.
This finding is important for three reasons, two of which are methodological and one theoretical. First, it corroborates the conditional effects of salience and complexity (Nicholson-Crotty 2009) with new data and a new approach. However, it does so for public salience, not media salience. 20 Second, the marginal effects plot demonstrates the utility of using a continuous measure of adoption speed. Instead of examining the predicted probability of adoption for policies sorted into discrete categories, researchers can now directly examine how speed changes across covariates of interest. From a theoretical standpoint, this finding suggests that there is a difference between the effects of media and public salience on the rapidity of adoption. While increasing media salience, all else equal, associates with faster diffusion, public salience associates with slower diffusion for noncomplex policies only. Future research should explore the differences in these mechanisms. It appears that legislators may be taking more time with policies that are popular among the public than when a policy area is receiving increased national media attention.
The remaining two models are included as robustness checks. Recognizing the abundance of criminal justice policies in the data set, I remove them to examine whether they are having a disproportionate influence on the results. The results are generally consistent with the Base Model, with the exception of the interaction. Likewise, the results are fairly robust to the inclusion of the year of adoption, which controls for the positive time trend in diffusion speed established above. 21 Including this measure shrinks some of the coefficients from the results reported above, but the standard errors remain largely the same. One explanation is that the time trend, similar to including duration dependence in an event history model (Zorn 2000), is absorbing variation from policy-level covariates that vary over time and are missing from this preliminary analysis. In this case, those missing covariates are likely collinear with measures that also vary over time, like New York Times coverage and Most Important Problem ratings. A second possible explanation is that there is omitted variable bias from state-level covariates (e.g., slack resources, like per capita income) that are also increasing over time and whose growth may generally impact the ability of all states to adopt innovations more quickly.
The results presented here are only a preliminary demonstration of the potential for modeling adoption speed. Further advancement in the measurement of innovation attributes is necessary for a more complete specification of this model. Thus, although the results confirm some past findings and establish new ones, the limitations in measuring policy characteristics are by far the most vexing for this line of research. Thus, developing better measures of policy traits is an important avenue of future research. In addition, as scholars develop larger data sets of policy adoptions, it would be useful to explore the benefits of directly modeling the speed measures and the available scale parameters, using other methodologies that incorporate uncertainty when using estimated values as dependent and independent variables (Crabtree and Fariss 2015; Fariss and Schnakenberg 2014; Rubin 1987). This approach, or the use of random effects in a pooled model (T. S. Clark and Linzer 2014), would allow for estimation of effects that are policy invariant.
Conclusion
A comparative approach to studying policy innovation diffusion holds promise for helping diffusion scholars understand not only why states adopt but also why some policies spread in very different temporal and spatial patterns than others. Using the rapidity of adoption as the outcome of interest is one avenue for advancing diffusion theory, including the research on its underlying causal mechanisms. This article makes two important contributions to this line of inquiry. First, it provides a method for a continuous measure of adoption speed. The continuous measure provides confirmation of Walker’s (1971) theory that diffusion rates would increase as more avenues for the transference of policy and political information across state lines became available. Furthermore, the continuous measure allows for initial analysis of which policy domains are adopted faster or slower than average. Finally, using a continuous conceptualization of speed as a dependent variable not only allows scholars to replicate important past results, such as the conditional effect of complexity and salience on adoption speed and the positive influence of federal incentives on the rate of adoption, but also allows for the examination of changes in speed across values of interesting covariates. This will be useful as additional innovation attributes are identified and measured.
Second, this article contributes to the measurement of additional innovation attributes beyond complexity and salience by examining how the clustering of four health care policies related to faster than average adoption rates. As noted, additional data collection and testing are required to gain a better understanding of variation in the success of policy clusters, but this article provides a method for defining and testing them.
Innovation attributes provide fertile ground for future research on policy innovation diffusion. So far, complexity and salience have received the most scholarly attention; however, Rogers’s (2003) general theory of innovation diffusion offers many avenues for developing further measures of relevant attributes. The challenge is to develop valid and reliable measures of these characteristics that can be applied across different types of policies without resource-intensive surveying of state officials (see Makse and Volden 2011). Given that many of these attributes are in the eye of the beholder, surveys are the most accurate assessment of the characteristics for a policy; however, the work on salience and complexity shows that it is possible to develop useful proxy measures for these attributes.
Boushey’s (2010; 2012) PET model demonstrates the need to not simply consider attributes independently but to consider their interaction with exogenous shocks, internal obstacles, and interstate coordination among interest groups. The preliminary analysis provided above incorporates some of these components, but more work needs to be done to capture interest group coordination efforts, in particular. One avenue for developing this further could be to incorporate Gray and Lowery’s (1993; 1996) work on interest group density to test whether the density of groups within particular policy domains affects how quickly those policies can spread. Measuring speed is an important step toward fully and directly testing PET, but additional development of measures for state characteristics, policy characteristics, and interstate organization coordination is also needed. All these potential avenues for future research can serve to expand our theoretical and empirical understanding of policy diffusion in the American states.
Footnotes
Appendix
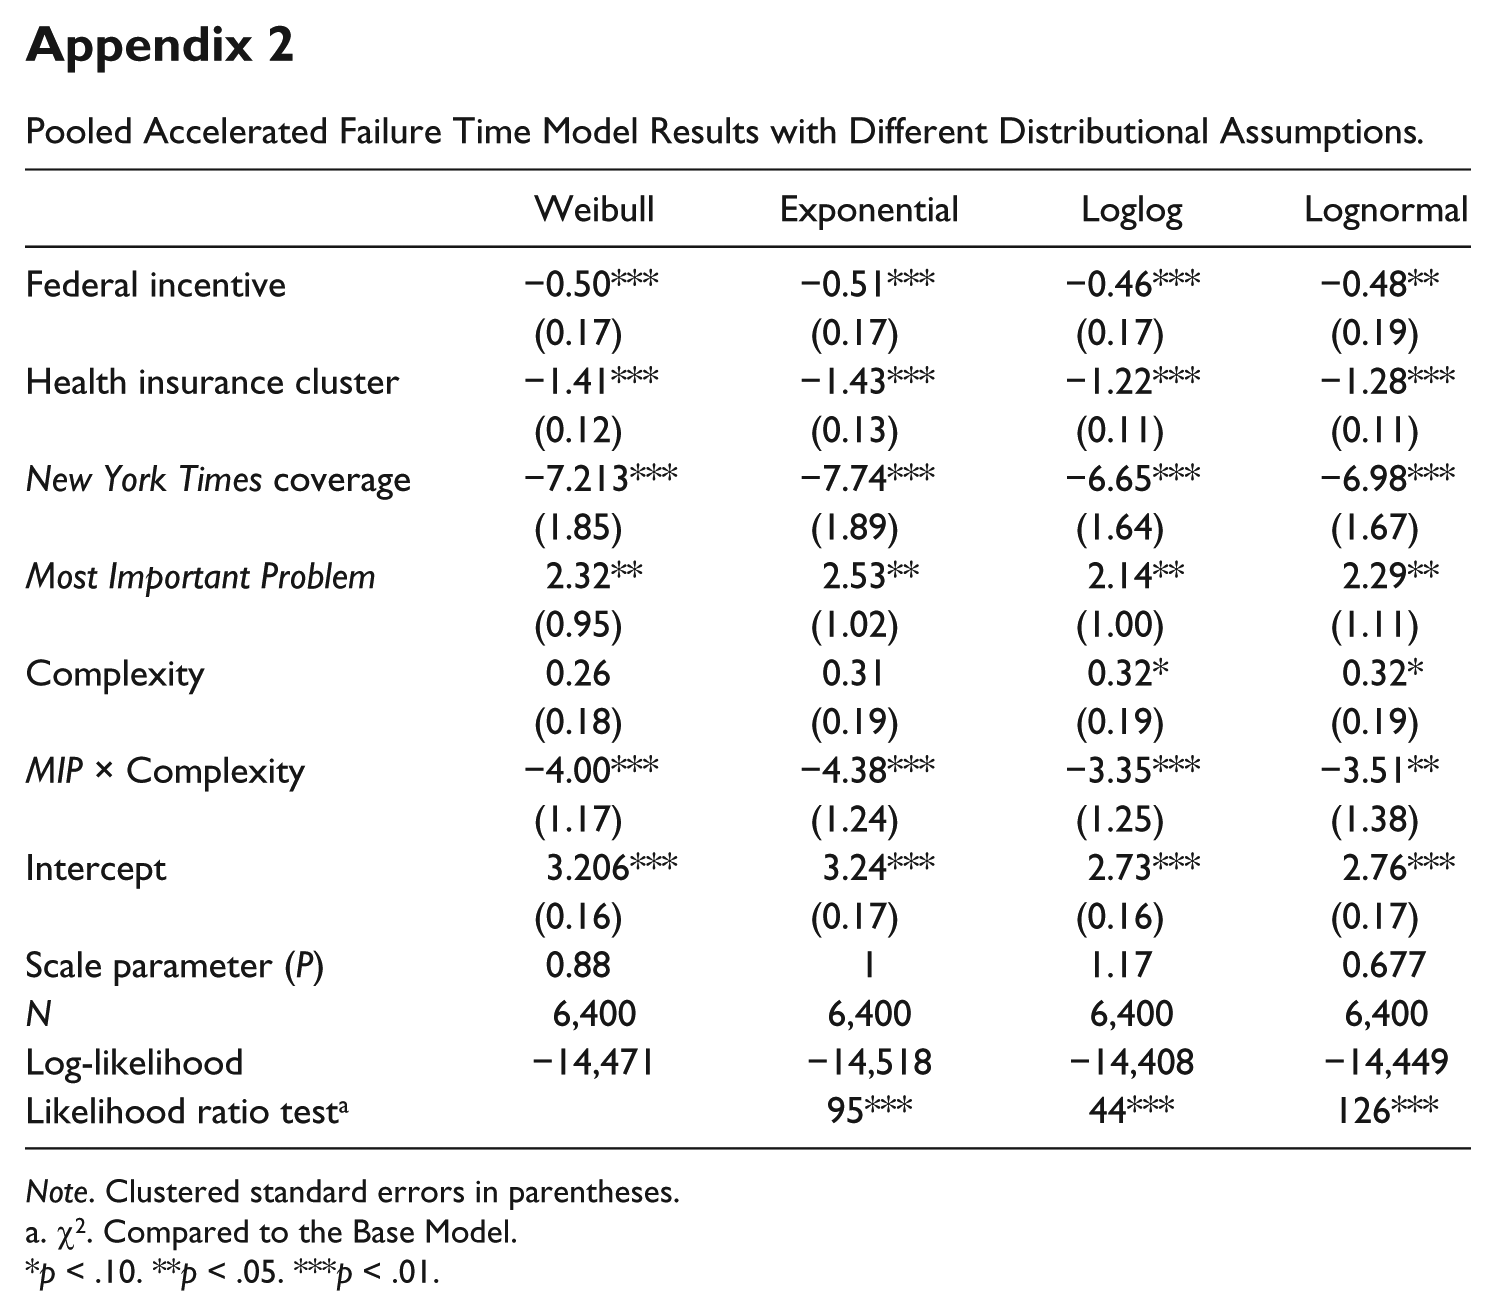
Pooled Accelerated Failure Time Model Results with Different Distributional Assumptions.
| Weibull | Exponential | Loglog | Lognormal | |
|---|---|---|---|---|
| Federal incentive | −0.50*** | −0.51*** | −0.46*** | −0.48** |
| (0.17) | (0.17) | (0.17) | (0.19) | |
| Health insurance cluster | −1.41*** | −1.43*** | −1.22*** | −1.28*** |
| (0.12) | (0.13) | (0.11) | (0.11) | |
| New York Times coverage | −7.213*** | −7.74*** | −6.65*** | −6.98*** |
| (1.85) | (1.89) | (1.64) | (1.67) | |
| Most Important Problem | 2.32** | 2.53** | 2.14** | 2.29** |
| (0.95) | (1.02) | (1.00) | (1.11) | |
| Complexity | 0.26 | 0.31 | 0.32* | 0.32* |
| (0.18) | (0.19) | (0.19) | (0.19) | |
| MIP × Complexity | −4.00*** | −4.38*** | −3.35*** | −3.51** |
| (1.17) | (1.24) | (1.25) | (1.38) | |
| Intercept | 3.206*** | 3.24*** | 2.73*** | 2.76*** |
| (0.16) | (0.17) | (0.16) | (0.17) | |
| Scale parameter (P) | 0.88 | 1 | 1.17 | 0.677 |
| N | 6,400 | 6,400 | 6,400 | 6,400 |
| Log-likelihood | −14,471 | −14,518 | −14,408 | −14,449 |
| Likelihood ratio test a | 95*** | 44*** | 126*** |
Note. Clustered standard errors in parentheses.
χ2. Compared to the Base Model.
p < .10. **p < .05. ***p < .01.
Acknowledgements
The author would like to thank Michael Berkman, Charles Crabtree, A. Lee Hannah, David Lowery, Todd Makse, Chris Ojeda, Julianna Pacheco, Amanda Jo Parks, Craig Volden, the anonymous reviewers, and special issue editors, especially Fred Boehmke, for their helpful comments and critiques of this manuscript.
Authors’ Note
Declaration of Conflicting Interests
The author(s) declared no potential conflicts of interest with respect to the research, authorship, and/or publication of this article.
Funding
The author(s) received no financial support for the research, authorship, and/or publication of this article.