






Abstract
This article examines the impact of electoral politics on state welfare policy in the post-civil rights era South. In contrast to an emerging consensus concluding that southern African Americans materially benefited from rejoining the electorate, this study suggests that higher black registration rates actually reduced states’ poverty relief efforts. In the years immediately following the Voting Rights Act (VRA), when Democrats controlled state government, the significant negative relationship between the size of the black electorate and state welfare generosity was moderated to some extent by high levels of partisan competition. In such cases, Democrats ostensibly chose a “core” targeting strategy of pursuing lower-income votes and had the institutional wherewithal to purchase these votes with policy concessions. Overall, however, the liberal “Downsian” policy response to African American mobilization was dominated by an antiredistributive response. In the South, welfare policies were relatively conservative vis-à-vis the other states during Jim Crow and became more so in response to black voting.
Keywords
Did de facto reenfranchisement and the return of competitive politics benefit African Americans in the post-Jim Crow South? The answer to this question is decidedly unclear, despite (or perhaps because of) the fact that it is informed by no less than four theories of elite policy setting. These theories stress countervailing but not necessarily exclusive electoral dynamics—two that predict “yes,” electoral forces should have benefited African Americans policy-wise, and two predicting they did not.
Setting the others aside for now, I will focus first on the paradigm that currently dominates southern scholarship, which predicts that blacks benefited from regaining suffrage. The case for this affirmative prediction draws on standard theories of democratic accountability and the experience of newly enfranchised groups in many other contexts. Following Gilens and Page (2014), I will refer to this as the leftward “Downsian” prediction, in reference to the spatial logic of electoral competition popularized by Anthony Downs (1957) and the direction of the policy shift it is thought to have generated in the South.
The Downsian model predicts that candidates in a competitive two-party system are driven to adopt centrist policies, and, if the median voter were to change following an expansion of the electorate, electoral competition between the candidates would drive them to move policy toward the median of the new voters. 1 Whether they employ a spatial metaphor or not, the basic logic of the Downsian result underlies many authors’ intuitive notion that elections provide an accountability mechanism benefiting groups that are able and willing to vote (e.g., Piven and Cloward 2000).
Many questions remain unanswered about the consequences of black voting in the South. Nevertheless, a consensus is forming around a number of studies suggesting that a leftward Downsian response dominated after the 1960s and pulled policy in a “pro-black,” redistributive direction. Studies supporting this view have considered the distal economic consequences of black voting (e.g., Gavin Wright 2013) and the proximal policy consequences in Congress (e.g., Lublin 1997), at the state level (e.g., Cascio and Washington 2013; Husted and Kenny 1997), and at the local level (Keech 1968).
Focusing specifically on state welfare policy, this article questions the emerging consensus. In stark contrast to existing work, it shows that the influx of black voters into the southern electorate did not generally produce the redistributive response suggested by the conventional Downsian account. In fact, I find that increases in the size of the black electorate were associated with substantial decreases in state welfare spending.
Specifically, this article uses state-level voter registration data for the period from 1960 to 2008 to quantify African Americans’ notional electoral power, and a variety of state budget items to examine its effect. The dependent variables include an expansive set of state appropriations encompassing Aid for Families with Dependent Children (AFDC), Medicaid, and the state-funded portion of Supplemental Security Income (SSI).
I make two kinds of comparison to evaluate the long-run impact of African American political participation. First, it is well known that southern welfare benefits were historically low in the national context, in large part because southern congressmen gutted federal legislation at the inception of the U.S. welfare state so that the South could better manage regional labor markets (e.g., Katznelson 2013; Quadagno 1988). 2 Less well known is the fact that the southern and nonsouthern states began in 1960 from a position of relative parity with respect to other common welfare effort metrics, including total per capita welfare expenditure. After the 1960s, however, the South fell far behind the U.S. average in these metrics as well, despite the fact that voting rights legislation of the 1960s introduced millions of ostensible fiscal liberals into the southern electorate.
Although it is suggestive, this cross-regional comparison is clearly not sufficient to identify the impact of black mobilization. I, therefore, employ a more sophisticated regression strategy that utilizes a general error correction model (ECM) and time-series cross-sectional variation among the southern states to identify the short- and long-term effects of changes in black registration, controlling for changes in southern poverty and other potential confounds. My key findings, in order of significance, are as follows.
First, the proportion of state registrants African American had a statistically significant and substantively large negative effect on the southern states’ average per capita welfare expenditure; the ratio of welfare spending to state GDP; and the ratio of welfare to total expenditures. A 10-percentage point increase in the share of state registrants African American, for instance, leads to a remarkable $509 reduction in the estimated equilibrium level of annual per capita welfare spending in Democratically controlled states after 1980. This would reduce the average 2008 expenditure by 20.6%.
Second, in the two decades after the Voting Rights Act (VRA), state-level competition between Democrats and the resurgent GOP (Grand Old Party) produced more generous welfare policies in sessions during which Democrats controlled the state legislature and/or the governorship. In such settings, Democrats ostensibly had the means and the motive to follow a “core” targeting strategy by courting black voters with more favorable policy, and they appear to have done so. Although statistically significant, the liberalizing influence of competition was insufficient to offset the dominant reactionary response to black mobilization. The competition effect was evident through the 1970s, then it evidently disappeared.
These findings are important because they cast substantial doubt on the emerging consensus about the policy impact of black participation after Jim Crow. Significantly, the results also suggest that two neglected theories of elite policy setting should be resurrected as plausible explanations for the dominant southern trends.
The first theory, with many exponents in the broader literature, is the well-known “racial threat” model, which posits that whites who live in areas with large minority populations develop antagonistic racial attitudes that translate into less liberal policy (cf. Key 1949). Blalock’s (1967, 147) original formulation in particular identifies two sources of interracial friction: economic and political competition. The latter fricative source plausibly explains the reactionary patterns documented here.
If one sticks to the Downsian framework as a model of policy change after large suffrage extensions—a context where it has had a rather good predictive record—the southern states’ regressive response could be explained by a large rightward pull from reactionary white voters overwhelming a smaller leftward pull exerted by black registrants, which forced equilibrium policy in a conservative direction. Radcliff and Saiz’s (1995) work suggests that reaction to black voting helps explain conservative welfare patterns in the broader national context, but the political threat thesis has been substantially overshadowed in recent southern scholarship. It deserves reconsideration.
If the political threat thesis has been overshadowed recently, then the “partisan competition” model, focusing on the strategic response of Democrats to new threats on the right from the GOP, has been totally ignored. As I discuss below, my results indicate that V. O. Key’s (1949) famous thesis that the South’s “have-nots” should benefit from sustained two-party competition—once the subject of a vital literature in state politics—is consistent with early post-VRA spending patterns but not later ones.
This article is organized as follows. The next section distills the central predictions of the theories described above, notes some possible contingencies, and summarizes their testable implications. The following section reviews the existing evidence regarding the policy consequences of black voting in the South, focusing on the inconclusiveness of previous southern welfare studies. The article subsequently describes the data and empirical method, presents the statistical results, discusses their relationship to the focal models of southern policy setting and concludes.
Theoretical Electoral Forces Affecting Southern Welfare Policy
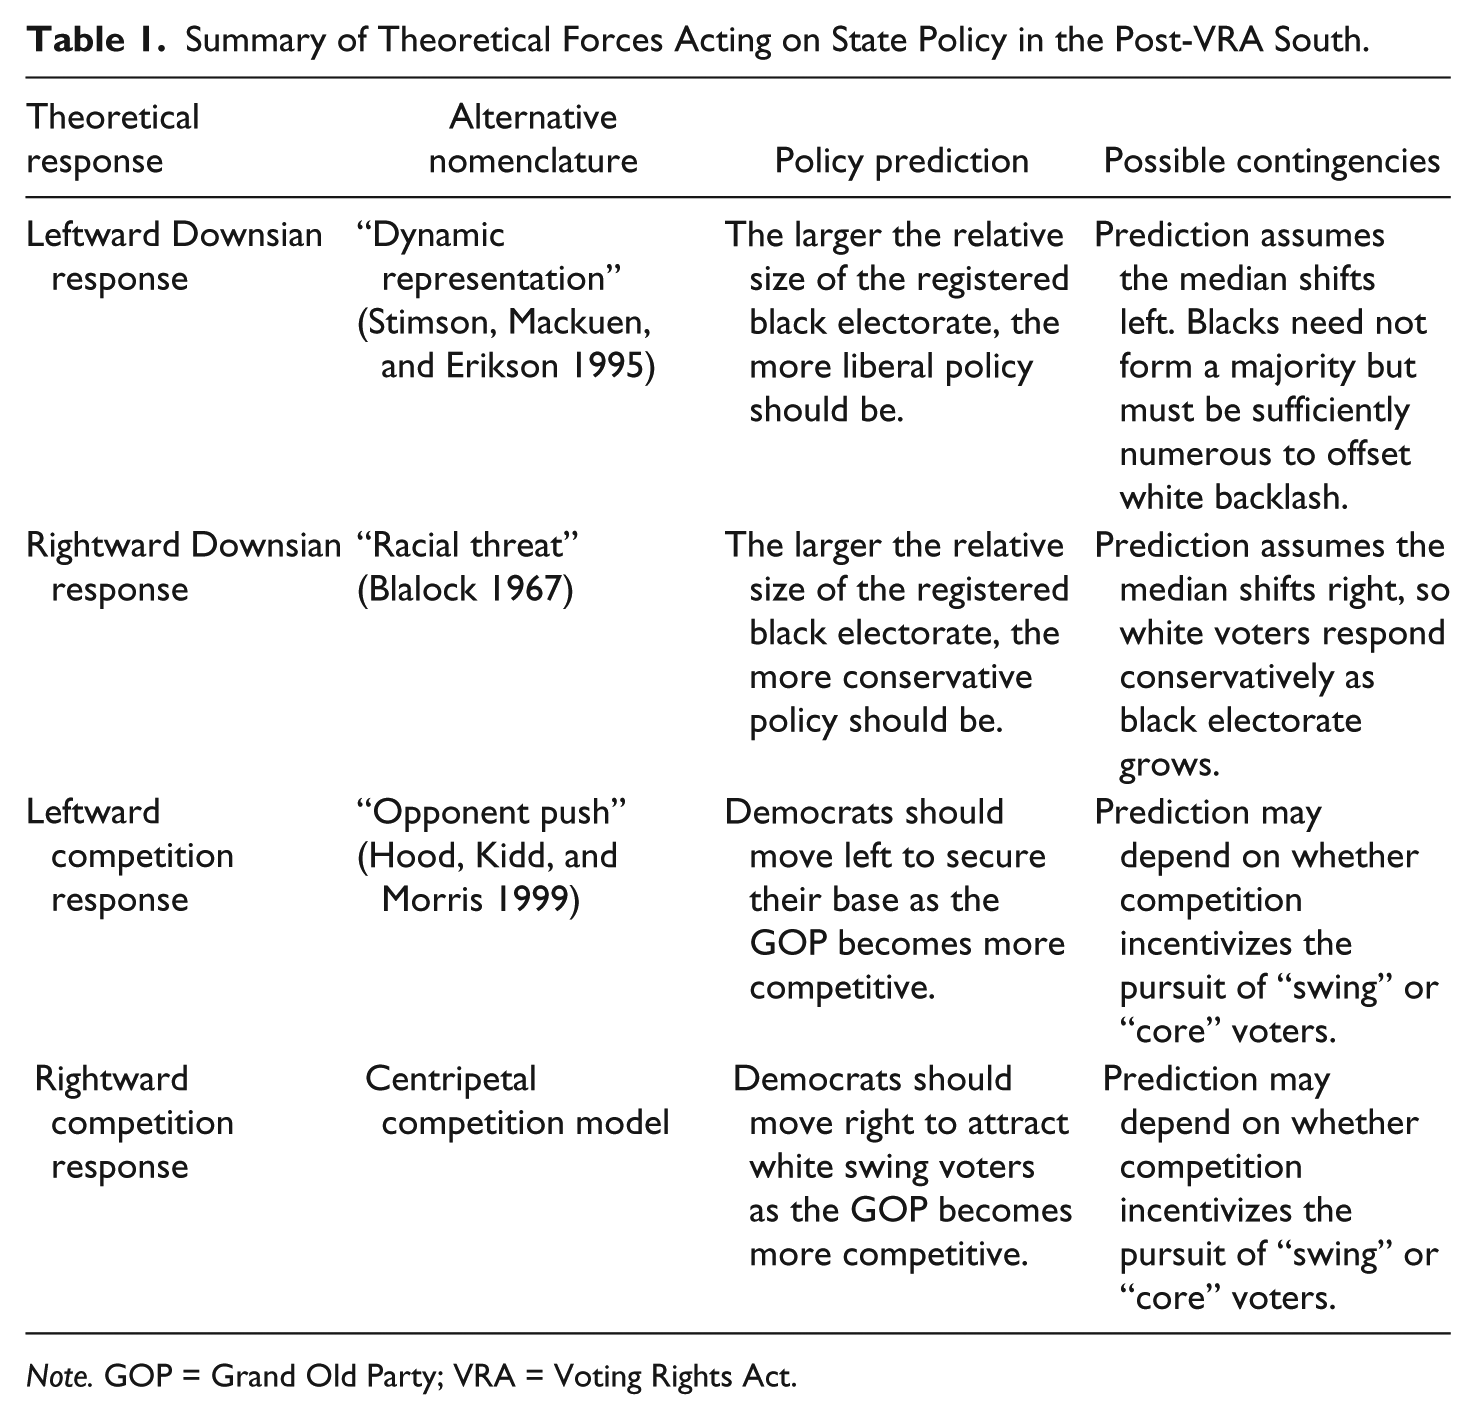
Table 1 summarizes the four theoretical dynamics examined in this study concerning the welfare implications of electoral and partisan change in the post-VRA South. The first two theories focus on the link between states’ welfare policy and the distribution of preferences among eligible voters, specifically as these relate to the electorate’s racial composition.
Summary of Theoretical Forces Acting on State Policy in the Post-VRA South.
Note. GOP = Grand Old Party; VRA = Voting Rights Act.
Both of these theories rely on a Downsian spatial model of policy setting, and both assume that blacks, as a group, are further left than whites on a unidimensional redistributive spectrum (favoring more redistribution). The Downsian model predicting more liberal post-VRA policy, however, assumes the states’ median voters would have moved left as the black electorate grew, whereas the version predicting a conservative policy shift assumes the opposite, per the racial threat model (Blalock 1967).
A few points will clarify my tests of the two spatial hypotheses. First, in his seminal formulation, Downs (1957) describes competition between two “teams” vying for office, each thought of as a unitary actor. In our case, suffice it to say, the states vary considerably with respect to the relative strength of the governor and the legislature in setting the budget, but both institutional actors play a role. 3 This article looks at the net result of state budget processes on welfare spending levels, as have virtually all related studies, and treats the state Democratic and Republican parties as unitary purposive actors. In this sense, it is particularly faithful to Downs’s model.
Second, to quantify leftward Downsian pressure, I will use the share of registered voters African American. In the early sample especially, when blacks could not easily register, this variable (and the black share of actual voters, a variable for which data are unavailable) better captures the theoretical electoral construct than does the black share of the general population, the proxy used in virtually all previous work.
Finally, notice that the two Downsian dynamics in Table 1 are countervailing, but they are not mutually exclusive. In fact, the net policy response to the black electorate is the product of the “pro-black” electoral response and the “racial threat” counter-response, and as previous scholars have noted, these generally interact with majoritarian institutions to produce a nonlinear relationship between the size of the black electorate and policy liberalism (cf. Cameron, Epstein, and O’Hallaran 1996).
At low levels, the black electorate may engender little racial threat and thus allow liberal policy to prevail. As the number of black registrants increases, racial threat may lead to increasingly conservative policy until blacks are sufficiently numerous to determine election outcomes, after which we may expect more liberal policy as the black electorate increases further. Lublin (1997) and others looking at congressional policies have estimated this inflection point to lie at around a 40% black population share, higher than all observations in my post-VRA sample. 4
Now note, there is also a second set of countervailing theories in Table 1 that focuses less on the policy preferences of the electorate and more on the competitiveness of the party system. One such theory, which Hood, Kidd, and Morris (1999) attribute to Downs (1957), predicts in the present context that threatened Democrats would have responded to electoral competition from upstart Republican state parties by moving redistributive policy right toward the GOP, to reduce the opposition’s appeal to conservative whites. 5
In contrast to this centripetal thesis, there is a centrifugal alternative, dubbed the “opponent push” hypothesis by Hood, Kidd, and Morris (1999), that traces its lineage to Key’s (1949, 307) influential prediction that the return of competitive two-party elections in the South would encourage an “organized” politics and lead Democrats (and possibly the GOP) to pursue policies favorable to blacks and lower-income whites. In the “Discussion” section, I revisit Key’s theory in light of my new evidence.
Existing Evidence
How well does existing evidence support our focal theories? Although the predictive power of the Downsian model has been questioned in constant turnout regimes (e.g., Bartels 2008; Gilens and Page 2014), it has fared much better as a model of fiscal change after large historical enfranchisements. Around the world, following woman’s suffrage, the enfranchisement of the working classes, the introduction of compulsory voting, and so on, election-minded officials have substantially revised budgetary policies on both of sides of the government’s ledger to win the support of new voters. 6
Most recent literature suggests that the post-VRA South was not different. Husted and Kenny’s (1997) frequently cited study of state welfare spending, for instance, forms the basis for much of the conventional wisdom in the economics literature concerning the policy consequences of black voting. The authors conclude that the removal of legal barriers induced a leftward shift in the southern states’ median voters that increased welfare expenditure.
Cascio and Washington (2013) use a different, but also indirect, difference-in-differences strategy to measure the impact of black enfranchisement on the intrastate distribution of state-to-county transfers. The authors conclude the elimination of “literacy tests was accompanied by a shift in the distribution of state aid toward localities with higher proportions of black residents.” Like Husted and Kenny, the authors do not directly measure black mobilization, which opens the door for various inferential threats. 7
The preponderance of recent evidence in the political science literature further supports the view that black mobilization engendered liberal policy. At the state level, Fording’s (1997) study of welfare generosity, for instance, concludes that the size of the black population interacted with the incidence of violent protest to produce a positive impact on the number of welfare recipients, because it signaled a willingness of African Americans to press their interests at the polls. Similarly, Yates and Fording (2005) conclude that large black populations place an “electoral constraint” on GOP state lawmakers, leading them to implement less racially biased incarceration policies.
At the U.S. congressional level, numerous studies looking at the effect of black population size on the policies of southern members conclude there was a negative relationship between the black share of the district population and the conservatism of its member’s voting record (e.g., Hood and Morris 1998; Lublin 1997). At the local level, Keech (1968) argues early advances in black voting improved municipal services in southern cities, and Keiser, Mueser, and Choi (2004) find that the incidence of locally administered sanctions on AFDC recipients in the Midwest decreases as African Americans’ ostensible local voting power increases.
In contrast to the positive findings noted above, Radcliff and Saiz (1995) and Krueger and Mueller (2001) consider a measure of relative black-white turnout rates on states’ per capita AFDC expenditures (i.e., black turnout%/white turnout%). While the research is not strictly Downsian because this variable does not account for the relative size of the black and white electorates, these two studies do indicate, suggestively, that increases in black/white turnout rates had a negative impact on AFDC expenditures.
Unfortunately, these studies are also of limited use for present purposes. Not only do they effectively ignore the relative number of black and white voters, the authors do not look at the South specifically, nor do they examine the pre-1980 period when the most dramatic increases in black voting took place. Nevertheless, their results lead the authors to somewhat radical conclusions.
In particular, Radcliff and Saiz (1995, 790) asked, why should African Americans choose to press their interests through the ballot box, when their participation may actually be counterproductive . . . our results clearly suggest that blacks as a group may have rational incentives to demobilize. If so, then our theoretical understanding of democratic practice may itself be in need of revision.
The ascendancy of the “leftist” Downsian perspective in southern scholarship has substantially displaced the “racial threat” model, although it still has many adherents in other fields. In particular, scholars looking at national samples in the post-1980 era find a negative relationship between racial diversity and state welfare generosity (e.g., Howard 1999; Matsubayashi and Rocha 2012) and a positive relationship between the size of states’ black populations and the restrictiveness of their welfare regimes (e.g., Fellowes and Rowe 2004; Soss et al. 2001).
In the economics literature, Alesina and Glaeser (2004) attribute the divergence in the postwar welfare states of the United States and Western Europe to the interaction of political institutions and race. Their conclusions complement work by Alesina, Baqir, and Easterly (1999) regarding U.S. municipal expenditures on public goods, and state-level evidence from Poterba (1997) and Lind (2007) regarding education and welfare, respectively.
Racial threat studies such as these produce remarkably robust if somewhat puzzling findings. In general, they do not go far to identify the political versus nonpolitical sources of racial threat, by estimating the independent effects of the black share of the electorate and the general population, for instance (cf. Branton and Jones 2005; Glaser 1994).
Data
This study employs pooled time-series cross-sectional data to examine the impact of electoral factors on annual state welfare effort in the 11 states of the former Confederacy during 1960 to 2008. Summary statistics and data sources are provided in the online appendix. Dollar denominated variables were converted to constant 2013 dollars using the Bureau of Economic Analysis’s state and local government price index.
Dependent Variables
As in scores of previous studies, I assume that black voters, being economically less well off as a group, benefit from redistributive policy. So, my dependent variables are various measures of welfare generosity. 8 The premise of my Downsian tests are supported by the fact that blacks across the socioeconomic scale overwhelmingly favor more redistribution than whites (Johnson 2001; Wood 1990).
Which welfare variables should one look at? Previous work explores a variety of welfare metrics, including per capita expenditures on AFDC (Matsubayashi and Rocha 2012; Gerald Wright 1976); benefit levels for AFDC, and its successor, Temporary Aid for Needy Families (TANF; Berry, Fording, and Hanson 2003); TANF eligibility requirements (Fellowes and Rowe 2004; Soss et al. 2001); average welfare payment per recipient (Johnson 2001); and the relative “equity” of AFDC payments, defined as the percent of state income devoted to welfare (Hill, Leighley, and Hinton-Andersson 1995; Krueger and Mueller 2001, 172).
Most previous studies look at the post-1980 era when the House Ways and Means Committee began reporting state welfare parameters in its annual Green Book. 9
The fiscal data analyzed in the present study were created from annual editions of the U.S. Census of Governments (COG) reports using standard budget categories defined by the Census Bureau. I use these data because they offer a consistent time series dating back to 1958 and a comprehensive measure of welfare spending.
One feature of the COG data is that state expenditures are classified by function, not program. Thus, specific programs such as AFDC or Medicaid may have portions of their appropriations compiled under different COG item codes, according to the purpose toward which they were spent. To provide a broad picture of state welfare efforts, I look at all payments made under the federal categorical public assistance programs. This includes SSI, AFDC/TANF, and Medicaid, other cash payments made by the state to low-income persons, payments to private vendors for welfare services, the construction of welfare institutions, and child services. 10
Key Independent Variables
The focal independent variables in this study are the proportion of state registrants black, partisan control of state government, and the competitiveness of the state party system. Per the Downsian models, the “treatment” variable is the size of the black electorate, operationalized here as the proportion of registered voters African American. This is arguably the most direct measure of the black electorate, along with the proportion of actual voters black. 11 The rationale for using registration rather than turnout data is that the latter are not available until the 1980s when the Current Population Survey (CPS) started producing state-level estimates. That said, the proportion of voters black and the proportion of registrants are highly correlated. Moreover, as Parker’s (1990, 7) study of Mississippi suggests, registration may be an even better variable for our purposes insofar as it was more easily tracked by officials and better captures blacks’ potential electoral threat.
The trends in southern registration rates by race and the proportion of registrants African American are graphed in Figure A1 in the online appendix. Notice that the VRA of 1965 was particularly important for increasing black participation, but earlier mobilization efforts by groups such as the Voter Education Project (VEP), and subsequent events, notably the presidential candidacy of Jesse Jackson, played an important role in boosting black registration (Timpone 1995). Across the South, African American registration rates more than doubled during our sample, from 29.3% in 1960 to 74.0% in 2008.
From the perspective of Downsian-type models of policy setting that focus on the location of the median voter, it is important to note that participation rates among native whites also increased in the post-civil rights era, and millions of white immigrants joined the southern electorate (Polsby 2004, chap. 3). In 1960, the registration rate among whites in the South was 59% region-wide, but beginning in the 1980s, white registration rates regularly topped 70% in presidential election years. All told, the proportion of southern registrants black grew 84.9% in the sample, from 10.4% in 1960 to 22.3% in 2008, with the greatest changes occurring in Deep South states such as Mississippi, where the percentage of registrants black increased from 5.1% in 1964 to 27.1% in 1966.
The other key independent variables are partisan control of state government and interparty competition. To test for heterogeneous effects across the parties, I interact the main regressors with variables indicating unified control of the state legislature and the governorship by the Democrats and Republicans or divided government. To measure party competition, I use a standard metric in the literature known as a folded Ranney index, a moving average of the Democratic seat share in the state’s upper and lower houses and the Democratic gubernatorial vote share, “folded” about 0.5 so that it ranges from 0.5 (no competition) to 1 (perfect competition). That is, Competitionst = 1 − |0.5 − Ranneyst|, where Ranney is the average described above. The averaging window was four years in the version of the index used in the regressions reported below. 12
Control Variables
This study controls for a number of potentially confounding legislative and state demographic variables. First, note that the welfare appropriations studied here include “pass through” money from the federal government. The historical AFDC program, for instance, was based on a grant-in-aid system in which the federal government matched state spending. Depending on the state’s ability to pay, the federal government provided 50% to 80% of the state’s average AFDC cost per case, regardless of the number of cases. 13 To control for the income effect of federal subsidies, the regressions include total federal grants per capita in thousands of dollars (Federal grants) and the federal AFDC matching rate for the focal state-year (Federal AFDC/TANF match rate). 14
A second important consideration is the passage of the Personal Responsibility and Work Opportunity Act (PRWORA). Bill Clinton signed the bill in 1996 in response to mounting dissatisfaction with the welfare system, with the hope that it would revive the Democrats’ flagging support from working class voters by “changing welfare as we know it.” PRWORA replaced the AFDC/Aid to Dependent Children (ADC) program, in existence since 1935, with TANF. The legislation instituted work requirements, replaced the AFDC entitlement with a five-year maximum eligibility, and changed federal contributions to a block grant system that gave states greater leeway to design eligibility. To control for this legislation, the regressions include an indicator Post-TANF that equals 1 beginning in 1997 (the first full year of implementation), and 0 otherwise.
State appropriations were also influenced by demographic, legislative, and other factors unrelated to black voting. I control for a set of variables similar to those in previous studies, including the state’s real per capita income (Per capita income), the proportion of the population over age 65 (Prop. age 65+), the proportion living in a metropolitan l area (Prop. metropolitan), the number of female-headed families with children under age 18 per 100 persons (Female headed households), and the lagged share of individuals below the poverty line (Poverty prop.), to help control for welfare demand and state capacity to provide high average benefits. Retail wage, the mean real monthly wage in the state’s retail sector, is included to account for Moffitt, Ribar, and Wilhelm’s (1998) contention that state welfare levels are set so as to disincentivize the poor from dropping out of the labor force and to promote equity between the nonworking and working poor.
Method
My analysis utilizes an error correction model (ECM) that captures the theoretical dynamics of welfare policy. State-of-the-art studies of state spending generally control for serial correlation using dynamic regressions with a single lagged value of the dependent variable and unlagged covariates. This is known as a partial adjustment (PA) model. I use an ECM instead for theoretical and practical reasons.
Theoretically, I argue that the total effect of change in the variables of interest are not likely to be observed the year after they occur. Rather, I presume there is an equilibrium welfare effort level for each state, denoted Ws, that depends on the size of the black electorate, partisan competition, the party that controls state government, and other state characteristics, denoted σ. For exposition, consider a simple version of the model where Xs represents a single independent variable. I assume the equilibrium relationship between welfare spending and X is defined by a steady state: Ws = σ + δXs.
Shocks to the key independent variables, including Competition and the Proportion of registrants black, presumably affect two kinds of change in welfare spending. Were an exogenous shock in t − 1 to increase the share of black registrants, say, we might expect an immediate impact on the next year’s budget as state politicians scramble to respond. So, ΔWst would react to ΔXst. Here, I use the notation Δ to denote the first-difference operator, that is, ΔWst ≡ Wst − Wst-1. It is also likely that a (persistent) shock to the racial composition of the electorate would disturb the equilibrium relationship between Xs and Ws (per the Downsian model, for example), sending Ws to a new equilibrium corresponding to the new value of Xs. A general formulation of this model is the following single-equation ECM 15 :

In this model, β 0 indicates the immediate, transitory “short-term effect” of an increase in X on Ws. β 1 is the “error correction term” that dictates how quickly welfare spending reaches its new post-shock equilibrium—note that if the ECM is an appropriate model, our estimate of β 1 should be significant and lie in the interval (−1, 0). The term β 2 in the ECM is known as the “long-run multiplier”; it represents the effect of a (sustained) one-unit increase in X on the equilibrium value of Ws. Simple algebra demonstrates the ECM can be rewritten in the following estimable form:

The coefficients of the ECM in equation (1) are obtained using standard ordinary least squares (OLS) estimation of the equivalent representation in equation (2), where
As alluded to above, standard practice in the state welfare literature employs a “partial adjustment” (PA) model, isomorphic to model (1) with the restriction that β1 − β0 = 0. De Boef and Keele (2008) argue such PA models are widely used as a fix for serial correlation, but without sufficient theoretical motivation. They find scholars rarely test the validity of the PA’s implied restrictions on the general ECM and incorrectly interpret the model’s dynamics. In our case, a series of F tests and Akaike Information Criterion (AIC) tests indicated that the implied restrictions significantly lowered the fit of our models, leading us to confidently reject the standard PA model (and static specifications). Thus, standard models risked misestimating the long-run effect of changes in the southern electoral environment.
In addition to providing a good representation of the dynamics I seek to evaluate, the general ECM also has other practical virtues. In particular, we are examining expenditures that exhibit consistent secular growth and are widely believed to be nonstationary (contain a unit root). 16 This is considered an extremely grave validity threat that could render conventional OLS methods useless, including the industry standard PA model (Wooldridge 2009, 636). In our setting, nonstationarity could make variables that trend with welfare appear statistically significant even if they bear no causal relationship.
With data such as ours, ignoring nonstationarity may be problematic because our panels are nearly 50 years long, and our tests are far from rejecting the null of nonstationarity in the dependent variables, indicating they may contain unit roots (or are long-memoried with roots near unity). 17
Tests confirmed, however, that the first-differenced time series pass the appropriate stationarity test, instilling confidence that the ECM methodology is valid. 18 The final OLS models include state fixed effects and a separate linear trend term for each budget regime type (unified Democratic, unified GOP, or divided). I estimated the models using a heteroskedasticity and autocorrelation-consistent fixed effects estimator developed by Baltagi and Wu (1999) to address the serial correlation that remained in the data after first-differencing (which was diagnosed by a test due to Wooldridge 2010).
Empirical Analysis
This section reports my main empirical results. The online appendix also reconsiders the evidence in Husted and Kenny’s (1997) widely cited study. There, I demonstrate that the authors’ conclusion that black voting increased state redistribution does not hold if one quantifies the black electorate directly using registration data, restricts the sample to the South, or utilizes more controls and regression models consistent with current practices. Any of these brings the results of Husted and Kenny’s estimation approach in line with the negative ones reported here.
Evidence Regarding Four Measures of State Redistributive Effort
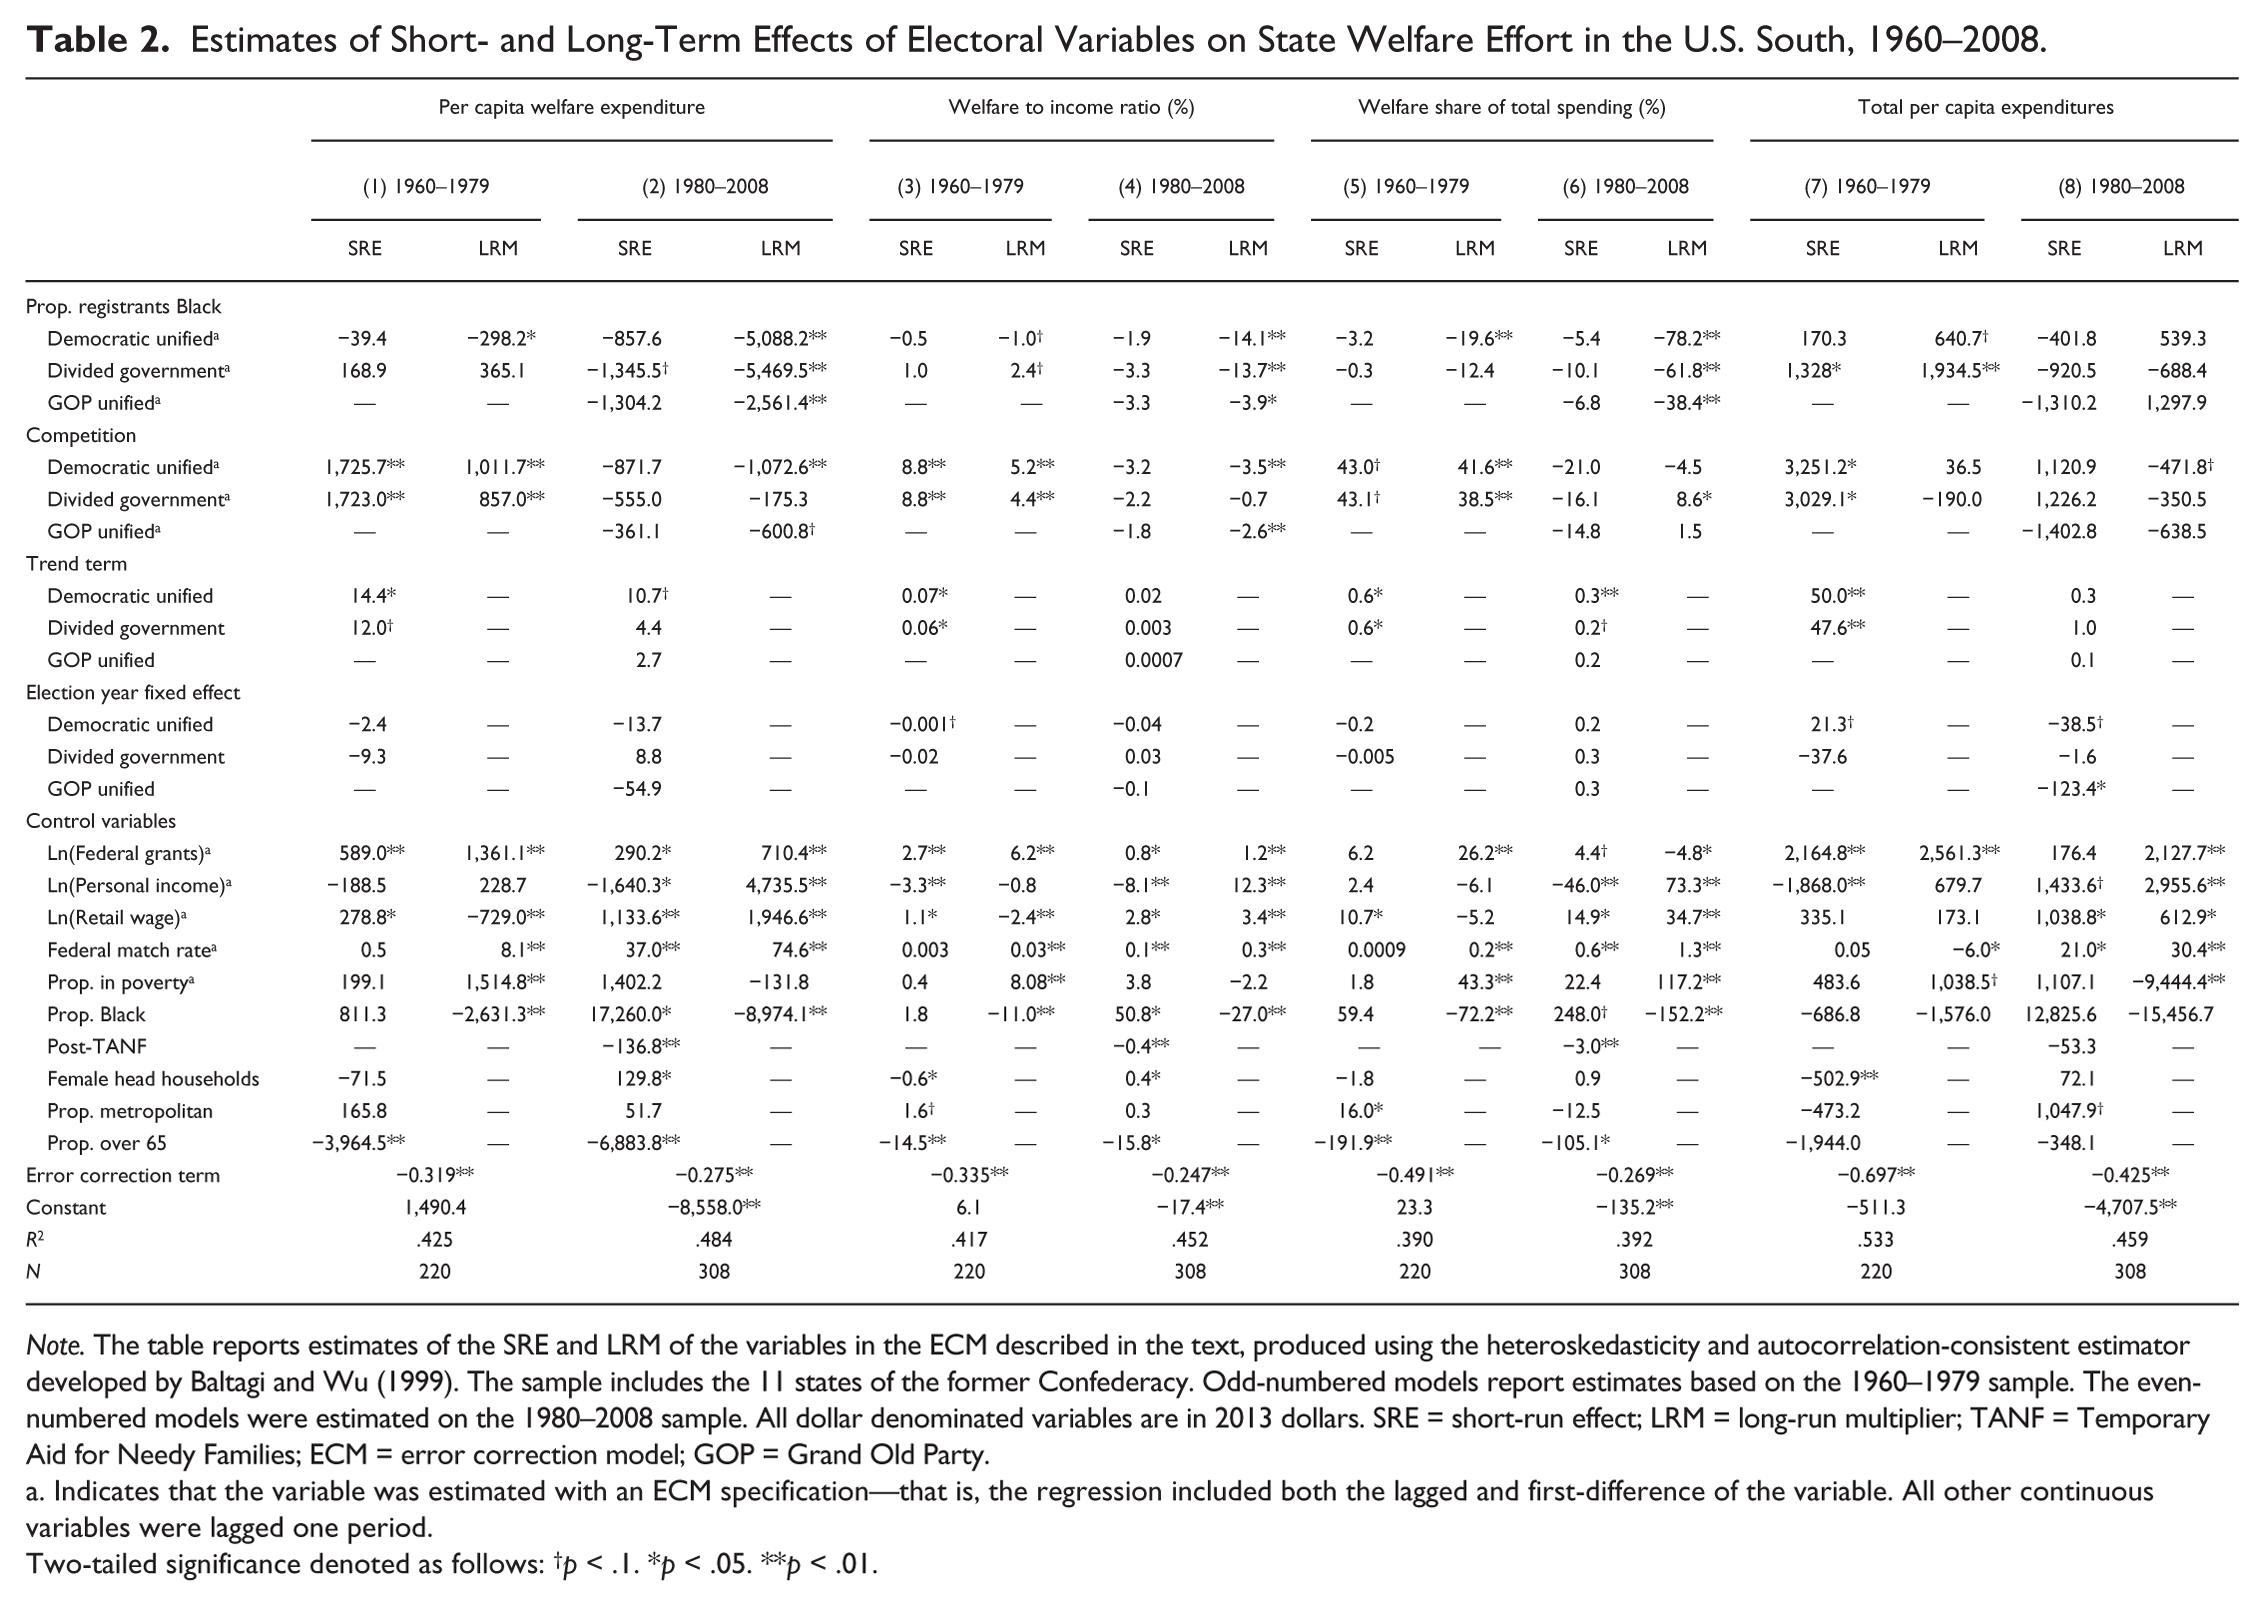
The main results are found in Table 2. I considered several variations of the model with logged and unlogged variables (all of which produced similar results). I thus focus on the essentially “level-level” specification in the table because it makes the effects easily discernable without compromising the models’ fit. 19 Most welfare studies report one-tailed tests but, given our discussion above, the policy effects of black registration and party competition are not obvious. So, the significance levels are based on more conservative two-tailed tests. For each dependent variable, I estimated the model twice: once on the 1960 to 1979 sample (the odd-numbered models) and once on the 1980 to 2008 sample (the even-numbered models). Dividing the sample in this way allows me to point out interesting changes over time.
Estimates of Short- and Long-Term Effects of Electoral Variables on State Welfare Effort in the U.S. South, 1960–2008.
Note. The table reports estimates of the SRE and LRM of the variables in the ECM described in the text, produced using the heteroskedasticity and autocorrelation-consistent estimator developed by Baltagi and Wu (1999). The sample includes the 11 states of the former Confederacy. Odd-numbered models report estimates based on the 1960–1979 sample. The even-numbered models were estimated on the 1980–2008 sample. All dollar denominated variables are in 2013 dollars. SRE = short-run effect; LRM = long-run multiplier; TANF = Temporary Aid for Needy Families; ECM = error correction model; GOP = Grand Old Party.
Indicates that the variable was estimated with an ECM specification—that is, the regression included both the lagged and first-difference of the variable. All other continuous variables were lagged one period.
Two-tailed significance denoted as follows: †p < .1. *p < .05. **p < .01.
As discussed in the previous section, the effects of the key explanatory variables were estimated using an ECM specification—using the lagged value of these covariates and the difference between their current and lagged value as regressors. For such variables, Table 2 reports estimates of the immediate short-term effect after a one-unit change in the covariate and the long-term effect of such a change on the steady state value of the dependent variable (assuming the shock is permanent). With reference to equation (2), these estimates are
The main findings are these: (1) Change in the proportion of registrants black did not impact state welfare expenditures immediately, but it did have a substantively large negative impact on states’ long-term equilibrium welfare effort; (2) Prior to 1980, during sessions when Democrats had unified control of state government (85% of the subsample) or shared control (15%), increases in the state’s partisan competitiveness precipitated significantly higher long-term welfare effort, consistent with Key’s (1949) famous thesis; (3) There was a structural break evident by the early 1980s, however, after which the liberalizing competition effect was greatly reduced and the antiredistributive backlash to black mobilization significantly increased; and (4) The estimated effects of the control variables are in the expected direction, and most are significant.
Focusing on the controls first, consistent with previous work, increases in the state’s total federal grant receipts and state GDP had a positive impact on expected long-run welfare levels. 20 In the later sample, the poverty rate, federal AFDC/TANF matching rate and retail wage had a significant positive long-run multiplier as well. The last finding is consistent with Moffitt, Ribar, and Wilhelm’s (1998) claims about labor market disincentives and political pressure to keep welfare benefits in line with the prevailing wage rate.
States evidently reduced welfare spending after PRWORA, consistent with the fact that work requirements and time limits pushed a record number of recipients off the rolls, and states with more citizens over 65 had lower spending, consistent with the conventional wisdom that seniors effectively lobby for lower taxes (cf. Poterba 1997). There is also evidence of a positive linear trend in welfare growth across all partisan regimes (due in large part to Medicaid growth) and evidence of electoral spending cycles. In unified GOP regimes, total state spending falls an expected $128 in election years (column 8), an estimated $55 of which comes from welfare cuts (column 2).
Now consider the variables of primary interest. I find no immediate impact from change in the racial composition of the electorate, but there is evidence of a substantial long-run effect, particularly after the 1970s. According to the estimates from the 1960 to 2008 sample, the expected long-term effect of a 10-percentage point increase in the share of registrants African American is a reduction of $509 in per capita welfare spending in Democratically controlled states. Were this hypothetical change followed by an unbroken spell of unified GOP control or divided government, the corresponding decrease in welfare spending would be $256 and $547 per annum, respectively. 21
To put the results in a different perspective, in 2008, annual per capita welfare spending in Georgia was $2,148 and $2,924 in the non-South (up from $269 and $246, respectively, in 1960). Were one to entertain a counterfactual similar to Radcliff and Saiz (1995), assuming no other changes, these results suggest that a complete demobilization of black registrants in Georgia in 2008 would increase the state’s per capita welfare spending by $801 real dollars by 2016 (because the GOP retained unified control). This would make the Peach State more generous than the non-South average, as it was in 1960. 22
The significant negative long-run impact of black registrants is robust across the other welfare spending metrics in Table 2. Models 3 and 4 estimate the ratio of welfare expenditures to income, a measure of welfare “equity” studied elsewhere (Krueger and Mueller 2001; Lind 2007). Models 5 and 6 examine the welfare share of total state expenditures (Husted and Kenny 1997). Sizable black electorates significantly decrease the estimated equilibrium level of each.
Note, I do not find that black registrants had a durable effect on total state spending, a general metric of “state activism” used elsewhere (Radcliff and Saiz 1995). In the 85% of observations in the pre-1980 sample with unified Democratic government, a 10 percentage point increase in the black registrant share (1.5 times the average increase during 1960 to 1980) produces an estimated $64 increase per capita in the equilibrium size of the state budget, and three times more under divided control. After 1980, the effect is statistically indistinguishable from zero.
The second key finding pertains to partisan competition. In the first part of the sample, interparty competition exerted a liberalizing influence, consistent with V. O. Key’s (1949) prediction. The mean value of the Ranney index climbed from 0.55 to 0.69 during 1960 to 1980. According to my estimates, this had the effect of increasing welfare spending by $142 per person in Democratic states and $120 when the parties split power.
Crucially, however, Table 2 indicates a substantial structural break occurred by the early 1980s—the results are robust to various sample restrictions—that significantly increased the antiredistributive response to black mobilization and reversed the sign of the competition effect. If anything, greater interparty contestation produced smaller welfare budgets after 1980. The next section discusses possible explanations.
Finally, relative to previous studies, these results offer a more precise picture of the mechanisms underlying the “racial threat” phenomenon because they include both the proportion of state residents black and the proportion of registrants black. The fact that both variables are negative suggests that the perceived threat posed by African Americans stemmed from their political participation as well as their relative frequency in the general population. This updates the standard “racial threat” finding that states with larger black populations have less generous welfare regimes (Gerald Wright 1976).
Robustness and Specification Tests
The main findings are robust to alternative specifications of the model and pass multiple specification tests. One concern is that my inferences are compromised by a “history” threat, some unmeasured factor negatively affecting welfare policy after the civil rights era. To mitigate this concern, I replaced the party-specific trend terms with year fixed effects and found this had not changed my conclusions, instilling more confidence that the effects are correctly attributed.
Several other tests increase our confidence in the results. Scatter plots of the residuals against the predicted values of the dependent variables show the expected random cloud and k-density plots of the residuals were normal looking, as were the QQ-plots. Ramsey-Reset tests and AIC tests failed to flag any obvious specification errors. The one set of estimates that were somewhat sensitive to alternative specifications were the coefficients in GOP unified sessions, which had a tendency to jump around when various lags of partisan control were added. This is likely due to the small N associated with these observations.
I paid special attention in the specification tests to the size of the black electorate. As noted in the theory section, authors find in other contexts evidence of a nonlinear relationship between African American population size and policy outcomes when the black share exceeds 40%, due to an interaction between racial threat and majoritarian elections. According to the AIC criterion and the “lrtest” for nested models in Stata, quadratic terms were empirically unjustified here.
Collinearity is also a potential concern because the share of registrants black and the population share black are closely related, and many of the variables trend together. 23 Fortunately, across all the models, the variance inflation factors (VIFs) of the differenced value of the two black shares were below 1.5 and 3.5, respectively. Some economic covariates had higher VIFs, closer to 10. Dropping variables is a possible strategy to reduce collinearity if they are orthogonal to those of primary interest, but the variables in question (real income, federal grants, retail wage) are theoretically important, and it is generally held that misspecification error is worse than collinearity (Arceneaux and Huber 2007). I thus used principal component analysis to reduce many variables to two dimensions and reestimated the model using the factor loadings, with similar results.
Discussion: Resurrecting the Racial Threat and Party Competition Models
My findings present two fundamental puzzles: how was the conservative welfare response to black mobilization sustained in political equilibrium? And why did Democrats evidently respond to partisan competition before the 1980s by increasing state welfare, then abandon this strategy in favor of a budget-cutting response?
Notice first-past-the-post elections imply minorities are not influential until they reach a near-majority if voting is racially polarized. Krueger and Mueller (2001) make this point regarding partisan coalitions, for instance. It is possible, therefore, that blacks never possessed sufficient mass to influence the median legislator, governor, and so on. 24 So, institutions could produce a zero-correlation between welfare spending and black registrants; but it is difficult to see how institutions alone could explain why more black voters would lead to strictly less welfare, as the above findings suggest.
An obvious thesis, with many adherents in the academic literature, is that whites’ affinity for redistribution is negatively correlated with their states’ black population. In our case, this “racial threat” hypothesis leads to questions about precisely when and how whites living among large black concentrations came to acquire their conservative views. Key’s (1949, 8) observations regarding within-state variation in conservatism notwithstanding, pollsters from the 1950s do not find that whites in black areas of the South were any more conservative than other white southerners (although surveys do consistently find white southerners were significantly less fiscally conservative in the 1950s than their northern coracials). 25
Variation in white demand for conservative policy, in other words, seems to be a direct consequence of the civil rights era, perhaps of black voting. This conclusion is consistent with Glaser’s (1994) view that the particular form of racial conservatism in the Deep South was closely tied to politics and, in his interpretation, whites’ perception that black political power was inversely related to their own: Deep South racism stems not “from an inherited, generalizable racist syndrome in the heavily black parts of the South . . . [rather,] whites [who] live in areas with greater proportions of blacks, perceive a stronger connection between black political gains and white political losses” (p. 35).
Many believe the 1960s “propelled politics in virtually every southern state several notches to the right on racial issues” (Klarman 1994). If this reactionary racial “backlash” is to explain my policy findings, it would need to extend to economic redistribution and relate positively to the size of the black electorate.
This brings up the “how” question: how exactly was the apparent political threat response activated? Scholars note post-VRA elite discourse evolved from explicitly racist messages toward fiscally conservative and racialized economic messages. Republicans after Nixon carefully calibrated their appeals to unify disaffected southerners and their national constituency. In the opposite camp, George Wallace eschewed his former redistributive platforms in favor of antiwelfarist populism, and later generations of Democrats, epitomized by Bill Clinton and the Democratic Leadership Council, borrowed much of his substance, if not his tone. 26
So, did conservative ideologies flourish in states with larger black electorates because elites were more likely to make conservative appeals there? Or was conservatism an unprompted response on the part of whites who perceived more threat in states with blacker electorates? Scholars have investigated “bottom-down” versus “top-up” processes before in this context, but it may be worth another look given my specific findings regarding black registration (cf. Lee 2002).
The second puzzling aspect of my findings concerns the Democrats’ apparent strategy reversal: before the 1980s, Democrats responded to GOP competition by passing more generous welfare budgets, as Key (1949) predicted, but favored the opposite response afterward. Key’s competition hypothesis was sufficiently interesting to spawn many empirical tests, but it lacks the analytical precision to explain the Democrats’ apparent strategic reversal. 27
The most promising analytical approach to this question, I argue, conceives of welfare spending as a policy-targeting problem (cf. Barrilleaux, Holbrook, and Langer 2002). In this mold, we might ask, when would competition lead Democrats to court their “core” supporters rather than “swing” voters? Here, the “core” supporters would be lower class whites and blacks, and “swing” voters, moderate-to-conservative whites more easily poached by the GOP. Cast in this light, our puzzle relates to a large literature that might offer guidance.
In fact, Cox (2010) and Smithies (1941) argue that the necessities of mobilizing their base and suppressing upstart competitors incentivize parties to pursue core-targeting. The notion here is that parties risk the loss of core supporters to abstention or upstarts if they move to centrist positions. Thus, as Downs (1957, 117) put it, a party’s optimal spatial strategy depends on “how many ‘extremists’ [it] loses by moving towards the center compared with how many moderates it gains thereby.” 28
Certain aspects of this theory seem relevant for our welfare puzzle. Early on, blacks might have turned to the “upstart” GOP, which traced its lineage to Lincoln, after all, and was in fact more liberal on civil rights issues through the 1970s (Carmines and Stimson 1989). Early on, Democrats might also have feared upstarts in their primaries, particularly after the reforms that followed the McGovern-Fraser commission.
Per the Cox-Smithies logic, another reason Democrats may have led with a core-targeting welfare strategy is that African American turnout was significantly lower and more variable before 1980, and as previous studies in Mississippi suggest, it was also sensitive to the distribution of welfare payments (see Kernell 1973; Salamon and Van Evera 1973). Indeed, compelling nationwide studies by Ansolabehere and Snyder (2006) suggest targeted transfers are routinely used by state lawmakers to mobilize their supporters and are remarkably effective at increasing turnout.
How then could we rationalize the Democrats’ apparent switch to the targeting of swing voters? Both the competition suppression and turnout-buying aspects of the Democratic calculus changed. In later years, as Frymer (2010, 8) suggests, blacks were less apt to threaten abstention or throw their support behind another party. 29 Indeed, blacks now vote at higher rates than whites in the South and are widely considered the most loyal demographic in U.S. politics. Furthermore, the Democratic Party elite reasserted control over party primaries, thereby reducing the threat of internecine competition that might otherwise pull Democrats to the left.
Conclusion
This article examined the impact of political change in the South on state welfare policies during 1960 to 2008. In contrast to previous work, I showed that the influx of African American voters and competitive politics did not produce the liberal public policy response suggested by many previous studies.
I made several specific points. First, by some meaningful metrics, minimal differences existed between the South and the other states before blacks voted in large numbers: in 1960, the average southern state spent more on public welfare than the average nonsouthern state relative to total expenditures, and only slightly less on a per capita basis.
Welfare appropriations grew much slower in the South than other sections, however, such that the former Confederates were spending much less at the end of the Reagan era – 30% less per capita basis in 1988. The interregional gap closed somewhat by the end of the sample but never fell below 18%, despite the fact that the South remained the poorest region and despite the fact that it contained by then a mobilized, redistribution-favoring black electorate that voted more consistently than whites (CPS 2012).
In fact, my time-series cross-sectional analysis indicates that the black share of state registrants has had a significant antiredistributive effect on state welfare effort, controlling for exogenous change in southern poverty and numerous other validity threats. Before the 1980s, I find evidence that the conservative reaction to black electoral power was offset in competitive, Democratically controlled states, plausibly consistent with Key’s (1949) famous hypotheses. Although it was statistically significant, however, the liberalizing competition effect was smaller than the antiredistributive “backlash” effect, and it changed sign in the 1970s.
The findings reported here thus conflict with the conventional wisdom regarding southern welfare established by Husted and Kenny (1997), the predictions of economic theorists about the policy implications of turnout (Meltzer and Richard 1981), and the experience of newly enfranchised groups in other contexts, including former slaves during Reconstruction (J. M. Kousser 1974) and women in the United States following the Nineteenth Amendment (Miller 2008).
Significantly, the results may also shed light on why redistribution tends to be negatively correlated with racial diversity. Across fields, many studies document this robust negative relationship but fail to offer a precise explanation for it (see Branton and Jones 2005 for a critique along these lines). Southern welfare spending patterns suggest political conservatism is not activated exclusively by mere exposure to minorities but responds at least as much to distinctly political mechanisms, in this case, African Americans’ potential voting power (cf. Glaser 1994).
Footnotes
Acknowledgements
I am indebted to Gary Cox for comments on an early draft and Karrie Koesel, David Steinberg, and the anonymous referees of this journal for comments on later versions.
Declaration of Conflicting Interests
The author(s) declared no potential conflicts of interest with respect to the research, authorship, and/or publication of this article.
Funding
The author(s) received no financial support for the research, authorship, and/or publication of this article.

Notes
Author Biography
References
Supplementary Material
Please find the following supplemental material available below.
For Open Access articles published under a Creative Commons License, all supplemental material carries the same license as the article it is associated with.
For non-Open Access articles published, all supplemental material carries a non-exclusive license, and permission requests for re-use of supplemental material or any part of supplemental material shall be sent directly to the copyright owner as specified in the copyright notice associated with the article.
