
Abstract
Members of historically underrepresented groups—women, African Americans, Latinos, and workers—are serving in American legislatures in increasing numbers. However, legislators wield substantially greater power in the lawmaking process when they hold leadership positions. Incorporation of these groups into leadership positions could indicate fuller political representation, but scholars to date have not assessed how well these groups are represented in leadership. We analyze original data describing the backgrounds of approximately 2,200 leaders in 30 states between 2003 and 2014. The data show that, on average across states, members of these groups are as well represented in state legislative leadership positions as they are in rank-and-file membership, but there is substantial variation across states and across parties. We then ask what factors might explain this variation and explore institutional characteristics, like the number of leadership positions or leader selection methods. The results show that legislative chambers with a higher number of leadership posts tend to have more women in leadership, and that selection through elections is associated with decreased African American presence in leadership. The findings have implications for minority incorporation and influence in American politics.
Keywords
It is well-known that women, racial and ethnic minorities, and blue-collar workers are underrepresented in American legislatures compared with their presence in the broader population (Carnes 2013; Casellas 2011; Hero 1998; Swers 2002). In addition, members of these groups face additional challenges once inside legislative bodies to exercise power and influence political outcomes (Hawkesworth 2003; Reingold 2008). One way for legislators to wield influence is to advance to legislative leadership, where members can help shape their party’s agenda and sway colleagues’ votes. However, it is unclear how freely legislators from non-traditional backgrounds are able to advance to internal positions of power.
A cursory look to top Congressional leaders might confirm suspicions of exclusivity in American legislatures. Despite the steady increase in women serving in Congress over the last two decades, Nancy Pelosi has been the first and only woman to serve as Speaker of the House. No African American, Latino, or blue-collar worker has served as Speaker. No women, African Americans, or Latinos have served as Senate Majority Leader either, and the last blue-collar worker to serve in the position was Robert Byrd. 1 To be certain, more women, minorities, and workers have served in lower profile Congressional leadership positions than in the very top positions (e.g., current Assistant Democratic Leader and Whip James Clyburn, or current House Republican Conference Chair Liz Cheney). American legislative scholars rarely ask how members of underrepresented groups move up in the ranks within legislatures (though see Jewell and Whicker 1994; Smooth 2008). Following this line of inquiry can answer important questions about the inclusivity of American political institutions and the influence that traditionally underrepresented groups can wield within them.
In this article, we attempt to answer two questions, one empirical and one theoretical. First, are women, minorities, and workers underrepresented in legislative leadership positions compared with their colleagues? To answer this question, we examine original data from 30 state legislatures over the period of 2003–14. Specifically, we study women, African Americans, Latinos, and blue-collar workers. We recognize that these groups have distinct histories and experience different sets of opportunities and obstacles to advancement in modern American politics. Yet, we might also reasonably expect that factors that hinder promotion to leadership among individuals from one non-traditional group might also hinder individuals from other non-traditional groups.
We find that, on average, these groups occupy similar proportions of leadership positions as they do rank-and-file legislative seats. This finding suggests that, once in the legislature, women, minorities, and workers advance into the leadership ranks at similar rates to their peers and do not face systematic exclusion from higher internal office. However, we note two trends masked by a simple comparison of means. First, and unsurprisingly, stark partisan differences emerge from the data; these groups tend to hold more leadership positions in the Democratic Party than the Republican Party. Second, a good deal of variation across state legislative chambers emerges. While some chambers’ party leaderships are quite inclusive, others are less so, a finding that cannot be chalked up to partisan differences alone.
The second question we explore is a theoretical one: can institutional design help to explain that variation in inclusivity across chambers? Institutional rules can affect composition by lowering the barriers to join the ranks of leadership, or by raising those barriers and concentrating power in the hands of a few long-serving members. Specifically, we assess whether the number of leadership positions, selection methods, professionalism, and term limits affect who moves from serving as a rank-and-file legislator to serving as a legislative leader.
We find consistent evidence that women—especially Republican women—are more likely to advance to leadership when a chamber has more leadership positions available and that African Americans are more likely to advance to leadership through appointment by a chamber’s presiding officers. Beyond these particular findings, however, we do not find evidence that institutional design creates universal barriers for underrepresented groups to advance to leadership. More consistently, we find that a larger presence for each of the groups within the chamber is positively associated with members of that group advancing to leadership positions. The results point to a pipeline problem, given that our data show rough parity between group representation in rank-and-file membership and in leadership in both parties. The findings from this initial exploration into leadership diversity emphasize the need for more research into how these members of politically underrepresented groups advance to positions of greater power within legislatures.
Diversity in Legislative Leadership
The absence of blacks, Latinos, women, and workers from representative bodies has received considerable scholarly attention (Carnes 2013; Casellas 2011; Fox and Lawless 2004; Lublin 1997; Sanbonmatsu 2006). 2 This is for good reason because when these groups are not in office, it speaks volumes about who is fit to serve. It also reinforces views espoused by some that people of a certain profile—white, male, and middle or upper class—are more suitable to serve in elected office (see Mansbridge 1999; A. Phillips 1995). Who has a seat at the table is clearly worthy of scholarly attention, yet it is also critical to consider whether historically marginalized groups can become influential within legislative bodies.
Although influence can be measured using membership in a dominant coalition (e.g., Browning, Marshall, and Tabb 1984), we examine influence based on the acquisition of leadership positions. Why study legislative leaders? One reason is that these actors have formal powers that allow them to shape politics and policy in their states. House speakers, for instance, have powers to appoint other leaders and committee chairs, allocate legislative resources, and control the agenda on the House floor (Anzia and Jackman 2013; Clucas 2001; Kanthak 2009; Mooney 2013). Lower level leaders have additional influence: party caucus chairs help set policy goals while whips enforce party discipline. Legislative leaders also possess other formal powers such as assigning committees and killing legislation (Boyarsky 2008; Brown 2008).
Leaders also hold informal powers in the sense that they possess greater status and influence among their colleagues as a result of their position. Leaders use their internal influence to make decisions on what provisions or budget items make it into bills introduced to the floor and ultimately what passes. Rank-and-file legislators learn to defer to leadership decisions. Smooth (2008) contends that informal networks and backroom meetings among leaders, in addition to their formal responsibilities, provide them influence. She notes that legislators without standing in these more informal networks, particularly legislators from non-traditional backgrounds, find that their policy priorities gain little traction in the legislature, even when their own party is in the majority.
Leaders also gain informal influence from their outsized role in fundraising for their fellow legislators. For example, during his time as Speaker of the House in California, Willie Brown used this “power of the purse” to maintain his party’s majority in the state legislature, which in turn allowed him to remain Speaker (Clucas 1995). Over time, state legislative campaigns have become more expensive, and while all legislators are required to raise funds, party leaders and committee chairs are expected to bring in more money (Powell 2012). These actors receive greater media attention and have greater name recognition, which can be used to their political advantage.
Finally, in addition to wielding political power in the legislature, leaders serve as role models within their states. Karen Bass, for example, made history in 2008 by becoming the first African American woman to serve as any state’s Speaker of the House, doing so in California. Her intersectional identity allowed her to serve as a role model to African American men, women of all racial backgrounds, and her presence especially inspired African American women that they, too, could achieve much success in politics. Other legislative leaders may be less famous than the Speaker, but these individuals should be viewed as role models in the same way given their standing in the legislature.
In essence, party leaders run the show. The policies and laws that legislatures create are often a direct result of the efforts that leaders make to organize their own caucus and negotiate with the other party. Consequentially, the inclusion of traditionally marginalized groups with distinct policy preferences into legislative leadership could greatly improve the group’s prospects for passing and implementing their own preferred policies.
Data
We focus our study of leadership diversity on American state legislatures. States provide greater variation in the diversity of legislative leaders than Congress does. For example, an examination of gender diversity for Speaker of the U.S. House would be limited to a case study of Nancy Pelosi. In state legislatures, however, six women served as state house speakers in January 2019. 3
To describe the demographic composition of state legislative leadership, we rely upon original data describing the gender, race, ethnicity, and previous occupation(s) of legislators in 30 states. 4 We gathered data describing roughly 10,000 state legislators from state legislative websites, manuals, blue books, and other official state data sources. Our data cover six legislative terms beginning with 2003–04 and continuing to 2013–14. 5 These years represent the period of time that allowed us to maximize the number of states included in our data—the state records we relied on became increasingly spotty prior to 2003. The remaining states for which we did not collect data either do not collect and publish such data or did not make the data available for the time period of interest. 6
From these data, we identified approximately 2,200 state legislative leaders over the same period of observation. We define leadership broadly. We do not limit leadership to a specific set of positions, in part because we consider the variation in the number of leadership positions in creating opportunities for underrepresented groups interesting to study in its own right (see below). We rely upon state sources to define which positions count as leadership positions. Generally speaking, leadership positions include speakers and speakers pro tem in lower chambers, presidents and/or presidents pro tem in upper chambers, and party leaders, whips, party caucus chairs, and floor leaders in all chambers. 7 Leadership varies widely across the states in terms of scope. The non-partisan Nebraska Unicameral Legislature has only one leadership position, the Speaker, whose primary role is to set the agenda for floor votes. On the other end of the spectrum, the Connecticut House places dozens of its members in leadership positions. In the 2009–10 term, 72 members of the Connecticut House served in leadership positions, often with multiple members holding titles like Assistant Minority Leader or Deputy Majority Whip. We do not include committee chairs among leadership positions. 8
We aggregated our individual-level data to state legislative chambers to create our unit of analysis. Using chambers, rather than states, allows us a larger number of observations and greater variation to leverage in our analysis. We matched our legislative leaders to our data describing the race, ethnicity, gender, and occupation of rank-and-file legislators. We calculated the variables Percent Women Leaders, Percent Black Leaders, Percent Latino Leaders, and Percent Worker Leaders simply by dividing the number of leaders in each group over the total number of leadership positions in the chamber.
We also calculated these variables by party for each observed chamber. Due to differences in each party’s coalition of political support, Democrats have a greater supply of rank-and-file legislators from these groups to promote to leadership positions. A 2015 analysis of state legislature composition by the National Conference of State Legislatures showed that women made up 34% of Democratic state legislators, compared with 17% of Republican officeholders (Kurtz 2015). The same analysis showed that racial/ethnic minorities comprised 33% of Democratic state legislators, compared with 5% of their Republican counterparts, though the analysis did not provide partisan differences by each racial/ethnic group. That said, African American state legislators are almost always Democrats (King-Meadows and Schaller 2006), and many non-Cuban Latinos tend to identify with the Democratic Party (McClain and Johnston Carew 2018), not to mention that Latino state legislators tend to share political preferences with the Democratic Party (see Casellas 2011, 30). Workers comprise a small number of both Democratic and Republican officeholders.
Coalitional differences notwithstanding, both parties have electoral incentives to promote a diverse range of legislators to leadership positions. Although we are unaware of any studies describing voter sentiment about legislative leaders specifically, studies show individuals have increased support, positive feelings, or feelings of legitimacy when people like them are on the ballot or hold public office. In particular, Rocha et al. (2010) find that blacks and Latinos are more likely to vote in states where a larger proportion of group members serve in the state legislature. Clark (2019) finds that blacks are more likely to express a high interest in politics and are more likely to vote in states where more blacks serve in the legislature, and Atkeson and Carrillo (2007) indicate that women have higher levels of political efficacy in states where more women serve in the legislature. Placing women, minorities, or workers in the most prominent positions in a party’s hierarchy signals the party’s commitment to representing these demographic groups. Even symbolic or token promotion could be electorally helpful, allowing a political party to remain in power.
We first explored how women, racial/ethnic minorities, and workers are represented in leadership compared with rank-and-file membership. Figure 1 plots the mean percentage of leadership positions held by each group alongside the mean percentage of seats held by each group in our 30 state legislatures. For each group, we present the chamber averages (“All Leaders” and “All Members”) beside the averages for the Democratic caucuses and the Republican caucuses across our 30 states.
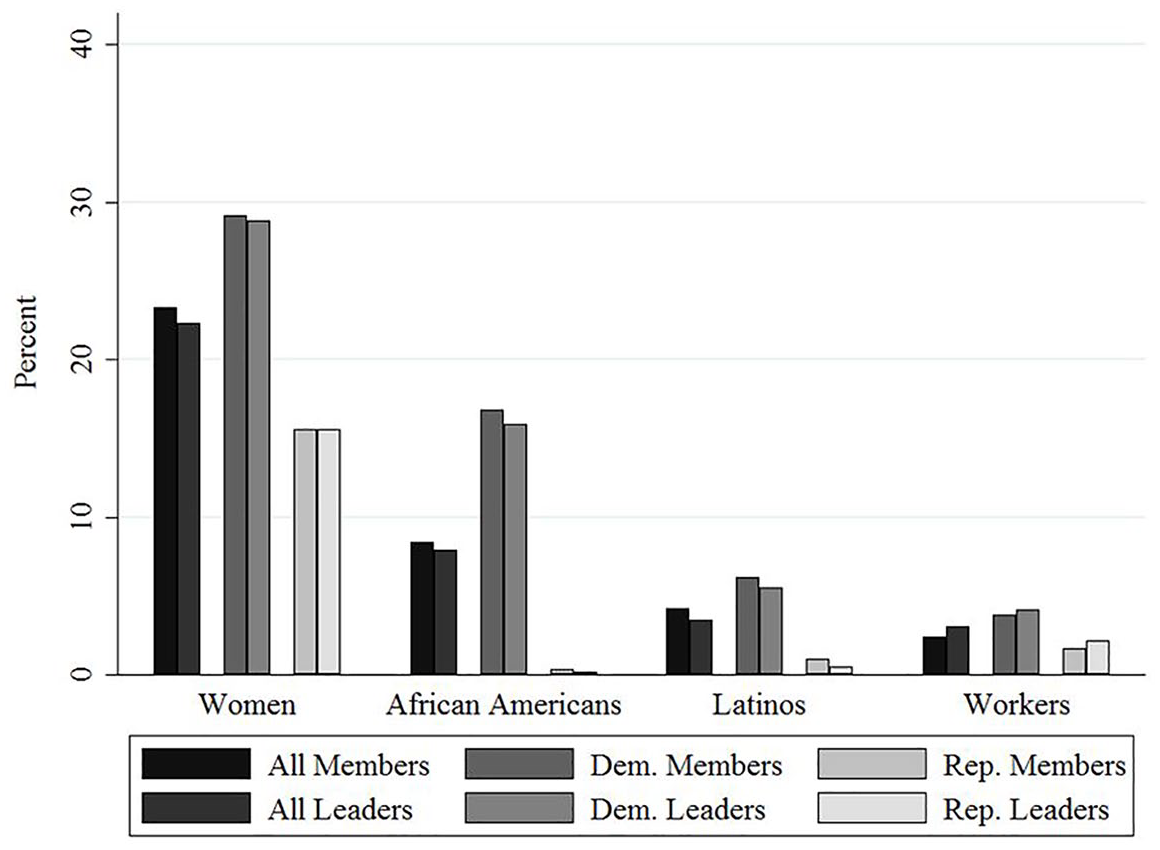
Group representation in membership and leadership.
Beginning with chamber averages, irrespective of party, the representation of each group in leadership falls remarkably on par with group representation in the rank-and-file. In membership, women hold 23% of seats, while African Americans hold 8%, Latinos hold 4%, and workers hold 2%. Women hold roughly 22% of the leadership positions in our data, while African Americans hold 8%, Latinos hold 4%, and workers hold 3%. This initial finding suggests that historically underrepresented groups do not face systematic exclusion from leadership positions in state legislatures. This finding is surprising because we might expect groups already underrepresented in the legislature to face further barriers to advancement.
How does the distribution break down by party? The data show that each of the four groups is more likely to fill leadership positions in the Democratic Party than the Republican Party. For African Americans and Latinos particularly, the differences are stark. Roughly 15% of Democratic leaders in our 30 states were African American, though only three black Republican leaders in total appeared in our data. Republican Latinos in leadership were rare compared with Democratic Latino leaders and served primarily in one state’s leadership (Florida). Partisan differences were less disproportionate but still notable for women (29% of Democratic leaders, 16% of Republican leaders) and workers (4% of Democratic leaders, 2% of Republican leaders).
Clearly, there are differences in diversity between the two parties in terms of what percentage of leadership positions are held by each group. However, there do not seem to be differences within parties in terms of the parity of each group’s seats in membership and leadership. To put it another way, Democratic women and Republican women alike hold a proportion of leadership positions roughly equivalent to the proportion of seats they hold within their respective caucuses. The same seems to hold true for blacks, Latinos, and workers.
Of course, Figure 1 only presents the averages across all chambers in our data. While inclusivity in leadership positions roughly matches inclusivity in rank-and-file seats, it varies across states. In some states, members of these groups may be overrepresented in leadership compared with their presence in membership, while in other states these groups may be underrepresented. In Figure 2, we plot each group’s representation in membership and leadership by chamber. The reference lines in each panel of Figure 2 plot parity, indicating that the presence of each group in leadership is equivalent to their presence in membership. 9 The plot shows that the averages above mask the variation across state legislative chambers in inclusivity in leadership. To use women as an example, in reference to panel (a) of Figure 2, women are overrepresented in leadership in some chambers, filling up to 100% of leadership positions. However, in others, women are underrepresented; for example, two chambers in the data had no women holding leadership positions, despite women holding more than 30% of the seats. Maps describing over-time parity in representation between leadership and membership by group are presented in Figure A1 in the Supplemental Appendix. In the following section, we examine the factors that might contribute to this variation in inclusivity across chambers.
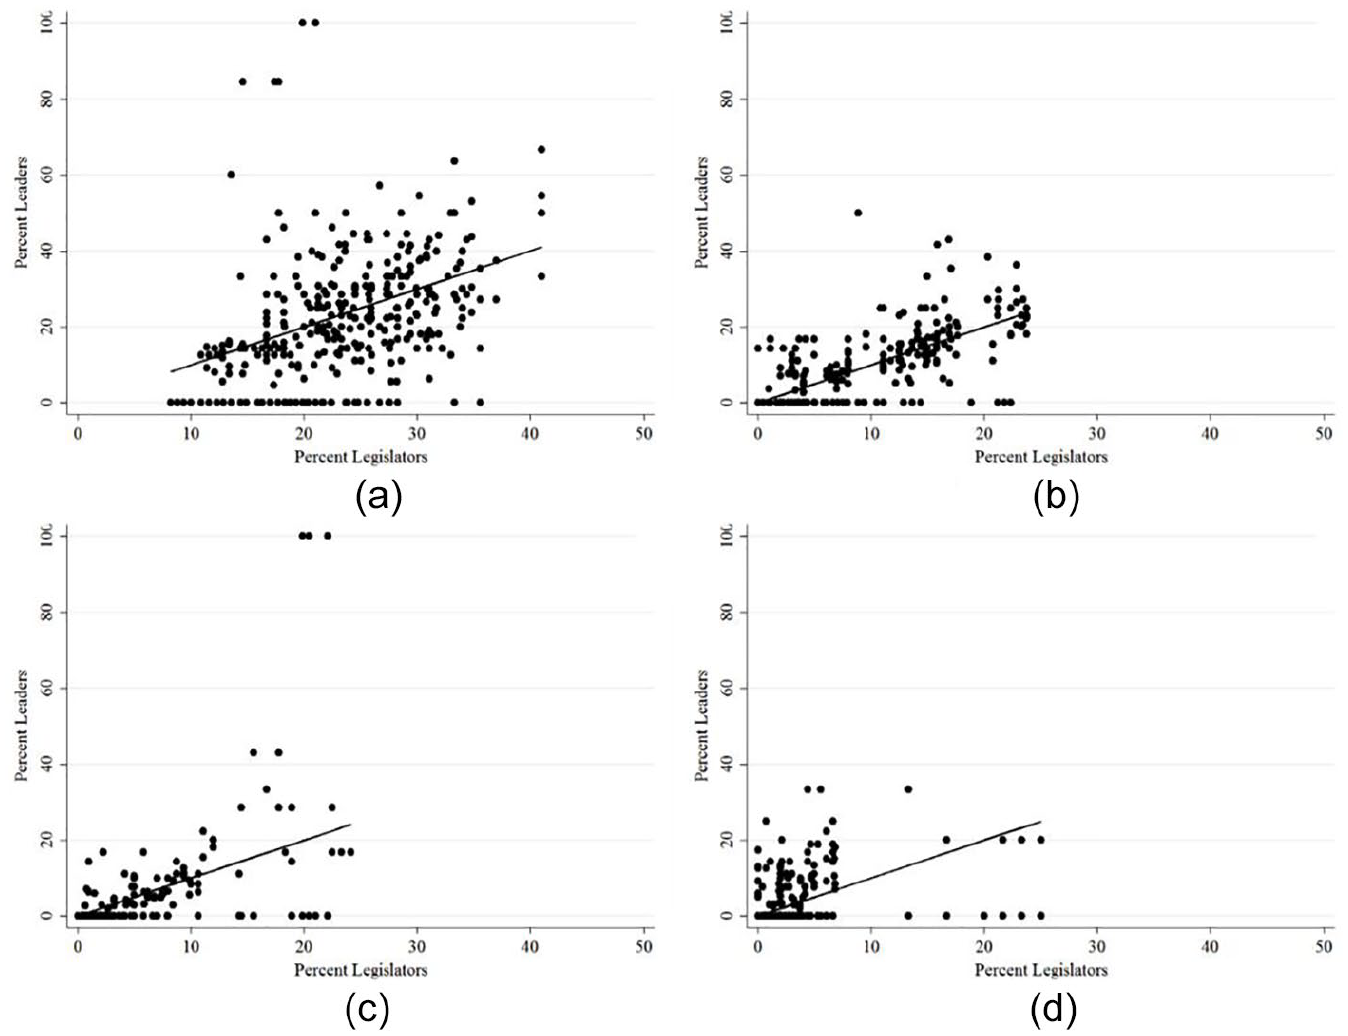
Parity in representation between membership and leadership: (a) women, (b) African Americans, (c) Latinos, and (d) workers.
Legislative Institutions and Leadership Diversity
What explains the variation in chambers’ inclusivity of women, minorities, and workers in legislative leadership? We explore whether certain types of legislative institutions are associated with greater inclusion of underrepresented groups in legislative leadership. Institutional rules, such as those establishing selection methods for political positions, and traits, such as the resources available to members, have been studied for their effects on the inclusion of underrepresented groups in rank-and-file membership. Institutions can create opportunities or raise barriers to inclusion. We expect that some of the same institutional rules that shape legislative membership may also shape the composition of legislative leadership.
As an initial look into how institutional design structures who serves in leadership, we examine four institutional variations across states: number of leadership positions, procedures for leadership selection, professionalism, and term limits. We lay out our expectations for each in turn. Because of the limited research on underrepresented groups in legislative leadership, we frequently rely on findings from the promotion of these groups to other political positions—city council members, judges, and political appointees in bureaucratic agencies—to guide our expectations.
Number of Leadership Positions
A higher number of leadership positions create more opportunities for legislators to advance. Increased opportunity likely enables more members from underrepresented groups to serve. Undergirding this intuition is the prestige theory, or the idea that when more positions are available that an office becomes less desirable, reducing competition for positions and making it easier for underrepresented groups to attain them. 10 Another take on these findings is that when more positions are available that greater opportunities exist for legislators from traditionally underrepresented groups to serve in leadership (Jewell and Whicker 1994); put differently, the more leadership positions available, the more likely it is that minorities will be able to serve in such positions.
Supporting evidence for this theory can be found in other parts of government. City councils that are larger have more black, Latino, and women members (Alozie and Manganaro 1993a, 1993b). More judges who are racial and ethnic minorities and women serve in states where more judicial positions are available (Bratton and Spill 2002; Hurwitz and Lanier 2003). For our purposes, it is less important whether greater diversity arises because these positions are less desirable to traditional office holders or because there are more opportunities for underrepresented groups to serve. Regardless of the mechanism at work, we expect that states with a greater number of leadership positions will have greater diversity in leadership. We formally state this expectation as follows:
Leadership Selection Methods
Another institutional trait we consider is the selection method for leadership posts. We expect that leadership diversity should be greater when leaders are appointed. For electoral reasons, leaders may want to appease different aspects of the constituency by selecting an underrepresented person to serve in a position of power. For example, Democratic Party leadership in a state may choose to appoint African Americans to leadership positions as a way to reward the group for helping the party win various elections, both district and statewide. On the flip side, underrepresented groups may have a challenging time attaining leadership positions through elections. In general, these groups do not hold enough seats in legislatures to ensure that one of their own will be voted into a leadership position. Moreover, non-group members may be hesitant to a non-traditional legislator to assume a leadership role due to an adherence to tradition and/or bias.
A handful of studies have examined how selection method affects leadership diversity in state legislatures. In a case study, Clucas (1995) explains how Willie Brown became the first African American Speaker of the House in California by winning the support of both Democrats and Republicans. Other accounts of legislative diversity examine multiple states and tend to focus more on how institutions affect leadership diversity in legislatures. Darcy (1996) shows that selection method does not affect whether women serve as committee chair, but that women tend to lead committees that have jurisdiction over matters such as education, health, and social and human services. This pattern suggests that women are likelier to chair committees that concern traditional women’s issues (see Osborn 2012). Orey, Overby, and Larimer (2007) find little evidence selection method affects whether blacks serve as committee chairs.
Turning to other examples of political leaders, more black judges, both male and female, are selected through appointment (Martin and Pyle 2002), although Alozie (1988) suggests that judicial selection method does not influence the presence of black judges. A greater number of white women judges serve when judges are elected through non-partisan elections (Martin and Pyle 2002), and others suggest that women are appointed to serve as judges so long as there is not already another woman serving in that capacity (Bratton and Spill 2002). Hurwitz and Lanier (2003) argue that more women and racial and ethnic minorities serve in office when two things are true: elites play a role in the nominating process, and these elite actors are liberal. Although findings are mixed concerning whether judicial diversity is better served by elections or appointments, overall, enough evidence exists to suggest that elections will not serve as a boon for increased leadership diversity. We formally state our expectation for legislative leaders as follows:
Legislative Professionalism
Studies consider how legislative professionalism affects the descriptive representation of African Americans, blue-collar workers, Latinos, and women. Casellas (2011) provides strong evidence that fewer Latinos serve in states with professionalized legislatures, arguing that as political newcomers it is difficult for the group to win elected office in such settings. For women, findings are mixed, with some studies finding that professionalized legislatures depress the number of women (Diamond 1977; Hogan 2001; Squire 1992), while others find this institutional trait matters little for whether women serve in the state legislature (Darcy, Welch, and Clark 1994). More African Americans serve in states with professionalized legislatures (Clark 2019; Squire 1992), but professional legislatures tend to attract members who have traditional economic advantages to serving in office, thereby depressing the number of blue-collar workers (Carnes and Hansen 2016).
When it comes to leadership selection, states with professionalized legislatures have more established patterns of succession (Chaffey and Jewell 1972). In other words, people who have seniority are awarded leadership positions. Our expectation is that a reliance on succession will benefit members who are white, male, and white-collar because these group members have traditionally served in elected office and continue to be overrepresented in state legislatures. Assuming that professionalized legislatures rely on established patterns of succession to select leaders, and given the profile of legislators who are likely to be long-serving members, it follows that professionalized legislatures will be places where fewer minorities serve in leadership. We formally state our expectation as follows:
Term Limits
Currently, 15 states force legislators to retire after one to three terms in office, and evidence is mixed concerning how term limits affect the demographic composition of legislatures. On the one hand, studies show that term-limited states have more state legislators who are Latino (Casellas 2011), black (Carroll and Jenkins 2005), and female (Darcy, Welch, and Clark 1994; Thompson and Moncrief 1993). An explanation for these findings is that term limits remove incumbents from office, and once these seats are open it becomes easier for underrepresented groups to win elected office. On the other hand, studies find term limits to have no appreciable impact on whether women or racial and ethnic minorities serve in state legislatures (Carey et al. 2006; Carroll and Jenkins 2001). These studies provide different explanations for why term limits fail to increase the number of state legislators who are women and racial and ethnic minorities, but what can be gleaned from these studies is that the presence of an institutional trait alone does not increase the presence of underrepresented groups in office.
Few studies consider how term limits affect leadership diversity in state legislatures. Orey, Overby, and Larimer (2007) find that term-limited states have fewer black committee chairs in 1999, but term limits are unrelated to whether blacks serve as committee chairs in 1989. Jewell and Whicker (1994) argue that term limits should increase the number of women in leadership, with the logic being that term limits induce turnover, which provides women a greater opportunity to attain positions of power.
We expect term limits to increase leadership diversity in state legislatures. Our expectation is primarily due to how term limits affect stability in membership. Term-limited states have greater turnover in membership (Moncrief, Niemi, and Powell 2004). State legislatures with less stability in membership will also have less stability in leadership. Non-traditional groups ought to have a greater opportunity to become leaders in places where leadership is constantly changing, as opposed to when it is more static, as should be the case in states without term limits. We formally state our expectation as follows:
Analysis and Results
As outcome variables, we use the same variables calculated above for the descriptive analysis: Percent Women Leaders, Percent Black Leaders, Percent Latino Leaders, and Percent Worker Leaders. We also follow the descriptive analysis above in using state legislative chambers as the unit of analysis. We note that because we are interested primarily in the role that universal legislative rules and institutional characteristics play in determining our outcome variables, our measures combine all leaders serving in both majority and minority party leadership positions. Further below, we break out the analyses by party.
We study the impact of four different institutional characteristics in allowing members of these groups to serve in leadership positions. The first characteristic, Number of Leadership Positions, is calculated from the data collection described above. The second characteristic captures the selection method for leaders in each chamber. All state house speakers and all senate presidents (or presidents pro tem, in states where lieutenant governors serve as senate presidents) are elected by membership. However, state chamber rules differ on whether the remaining leadership positions are elected by membership or appointed by the chamber’s presiding officer. Data describing selection methods come from the Book of the States, published annually by the Council of State Governments. To simplify the process for quantitative analysis, we created a binary variable with values of 1 indicating states where non-presiding officers are elected and 0 indicating chambers where non-presiding officers are appointed. 11 The third institutional characteristic, Legislative Professionalism, is gathered from estimates created by Bowen and Greene (2014). We expect that greater professionalism will be associated with a less diverse legislative leadership. The final institutional characteristic, Term Limits, is gathered from the National Conference of State Legislatures. Because term limits for some state-terms in our data were later overturned by court challenges, we observe values of 1 for this variable if term limits were implemented in the term of observation and 0 if they were not.
Institutional characteristics are not the only factors that affect whether legislative leaders are diverse. We also control for a series of potentially confounding factors. First, we control for presence of each group among the rank-and-file members of each chamber (Jewell and Whicker 1994; Orey, Overby, and Larimer 2007). In short, the greater the seat share held by diverse members, the likelier legislative leaders are to come from these groups. Another possibility is that minority group members have higher qualifications upon arrival in office (Hardy-Fanta et al. 2016), making them excellent candidates to ascend into leadership quickly. Not only are group members needed to occupy these positions of leadership, but also the more direct power they have through their seat share, the more influential or effective they can be in attaining leadership positions (c.f. Kanthak and Krause 2012). 12
Second, we control for which party holds the majority in each chamber. Our outcome variables measure the presence of underrepresented groups in leadership in both majority and minority parties. Majority parties hold at least as many, and sometimes more, leadership positions than minority parties across states in our measure. If parties are unbalanced in the degree to which they incorporate underrepresented groups into their respective leadership teams, then accounting for which party holds more leadership positions should in part account for variation in leadership diversity. We include a binary variable with values of 1 indicating a Democratic majority in the chamber-term. We expect that states with a Democratic majority will have more leadership diversity due to each of our four groups having stronger ties to the Democratic Party in the era studied.
Finally, we control for the political environment in Southern states. Jewell and Whicker (1994) point out that in many southern states that leadership continues to be all male. One potential explanation for this trend is that southern states also have a traditionalistic political culture (Elazar 1984), places that adhere to traditional gender roles, racial hierarchies, and the notion that politics is a realm where the elite should rule. As a result, in the South, it may be that white-collar white males are the primary occupants of leadership positions (see also Smooth 2008). Summary statistics for all variables are presented in Table A1 in the Supplemental Appendix.
Modeling our data poses something of a challenge. Our data are time-series cross-sectional (TSCS) by term and observed at the chamber level. Moreover, we observe multiple correlated dependent variables. To be clear, we do not view the competition for leadership positions between these four groups as a zero-sum game; membership in these groups is not mutually exclusive. 13 However, empirically, we do observe small correlations (both positive and negative) between each pair of dependent variables. Table A2 in the Supplemental Appendix presents the full correlation matrix.
Model selection for these data involves tradeoffs. As a result, we estimate multiple models below as a way to observe whether our findings depend on model choice. Although the results we observe do vary somewhat depending on model choice, we are able to draw a limited set of conclusions based on common results across model specifications. We begin by presenting and interpreting results from a seemingly unrelated regression (SUR) model. SUR allows us to model several related outcome variables simultaneously, which better accounts for contemporaneous correlation between the error terms than if the models were estimated separately. 14 For the purposes of this model, we pool all observations. This approach ignores the clustering of observations within chambers over time. However, in later supplementary models, we account for clustering in chambers and states in a multilevel modeling framework. We also include fixed effects for terms to account for the growing presence of women and Latinos in membership (and women in leadership) over the period of observation.
The results of the SUR model are presented in Table 1. Our first hypothesis states that the number of leadership positions should be positively related with leadership diversity, controlling for other variables in the model. The results show that the number of positions is positively and significantly related to the percentage of women in leadership. However, the relationship is substantively small. The coefficient estimates indicate that for each additional leadership position, the percentage of women rises 0.27 percentage points. We also note that the results indicate a positive association between the number of leadership positions and the percentage of leadership positions held by Latinos, though the estimate is not significant at conventional levels. The number of positions seems to have no appreciable relationship with the percentage of African Americans or workers in office. Overall, we find partial support for our first hypothesis.
Seemingly Unrelated Regression Model.

Note. Standard errors in parentheses. FE, fixed effects.
p < .05.
The second hypothesis states that elections should be negatively associated with leadership diversity. Contrary to expectations, the results suggest that the use of elections to select leadership is positively and significantly related to the percentage of Latinos in office. On average, chambers with elections see more than a 4-percentage-point increase in Latinos in leadership position compared with chambers that appoint leaders. In line with the second hypothesis, however, the results indicate that leadership elections are negatively and significantly related to the selection of black lawmakers to leadership positions. Chambers with elections see a roughly 5-percentage-point decrease in African Americans in leadership positions on average, compared with chambers where leaders are appointed. The results suggest that presence of women and workers in leadership has no discernible association with selection method. Overall, we find mixed support for our second hypothesis.
Our third hypothesis states that legislative professionalism should be negatively related to leadership diversity. The signs of the coefficient estimates would suggest that higher professionalism is associated with a higher percentage of female leaders but lower percentages of black, Latino, and workers in leadership. However, none of these estimates are statistically significant. Our fourth hypothesis states that term limits should be positively related to leadership diversity. Here too, none of the estimates are statistically significant. Moreover, the sign falls in the opposite of the expected positive direction for all groups except African Americans. Therefore, we find no support from the model for either the third or fourth hypothesis.
We hypothesized that reliance on succession would lead to professionalized legislatures having fewer diverse leaders, but the relationship between legislative professionalism and leadership powers might explain our null findings. Richman (2010) finds that state house speakers are less powerful in more professionalized legislatures. This trend suggests that in professionalized legislatures that leadership positions may generally be less powerful and thus less desirable. Consistent with prestige theory, these positions may be more available to women, blacks, Latinos, and blue-collar workers. All told, it could be that professionalized legislatures both rely on succession to select leaders and are places where leadership positions are less desirable, and these two things cancel each other out in the aggregate.
As for the null findings for term limits, one explanation lies in what studies find when examining how this trait affects the demographic makeup of legislatures. As mentioned earlier, many studies find that term limits in and of themselves matter little for electing more women and racial and ethnic minorities to office. Term limits have some important political consequences (Carey et al. 2006), but diversity in legislative leadership is not one of them.
Surveying the control variables, a greater presence of each group in rank-and-file membership is positively related with a greater presence of that group in leadership, in line with expectations. Democratic control does not appear significantly related to any of the outcome variables, but the results indicate that workers are less likely to advance to leadership positions in Southern legislative chambers. 15
As noted above, leaders from these demographic groups are concentrated within the Democratic Party. Therefore, we analyze the outcomes for each party separately. Table 2 presents the results of two SUR models, with results for Democrats in the left panel and Republicans in the right. Here, the outcome variables are the same—percentage of leadership belonging to each group—but restricted to each party. The independent variable, Number of Positions, in these models is also restricted to a count of leadership positions within each party’s leadership in the observed chamber.
Seemingly Unrelated Regression Model by Party.
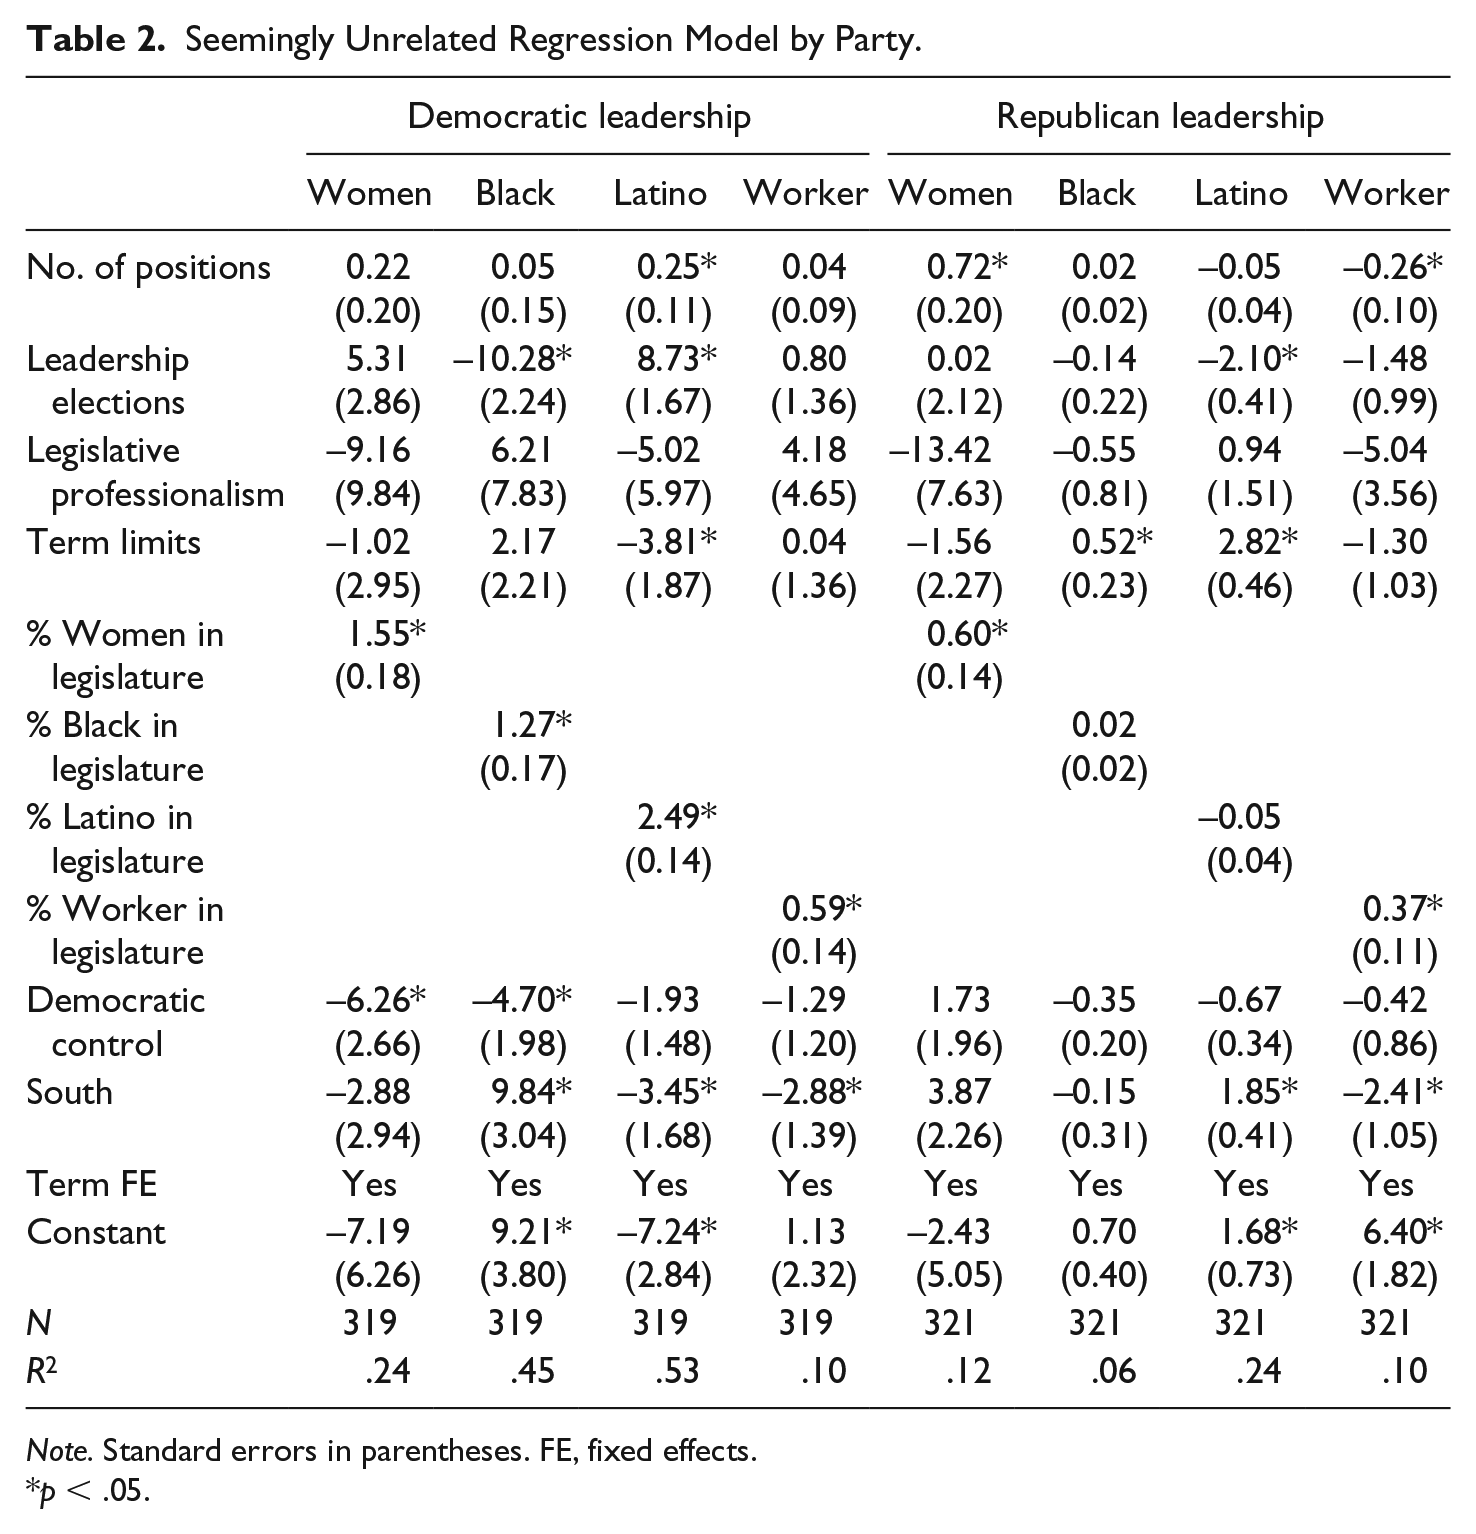
Note. Standard errors in parentheses. FE, fixed effects.
p < .05.
Comparing the results for each party separately, asymmetric patterns in the rise to leadership emerge. First, the number of positions available in each chamber’s Democratic Party appears unrelated to the elevation of these groups to leadership. However, in the Republican Party, women rise to leadership positions when there are more positions available. The model indicates that for each leadership position added, women’s share of leadership position increases by 0.72 percentage points. This finding lends some support to a prestige theory explaining the rise of Republican women to leadership (a finding reinforced by the negative association between legislative professionalism and the proportion of women in Republican leadership). Another possibility is that, to combat political narratives around gender and representation that tend to put their party in a negative light, Republicans feel greater political pressure than Democrats to incorporate more women into leadership as the size of its leadership expands. We note, however, that the opposite is true for Republican workers, who tend to rise to power when fewer positions are available. The difference in patterns between these groups may be explained by the relatively small number of workers in office compared with women.
Second, the positive association between elections and Latinos in leadership and negative association between elections and African Americans in leadership found in Table 1 are replicated among Democrats in Table 2. The results in Table 2 indicate that Latinos in Republican leadership are more likely to be appointed and serve in states with term limits. However, these findings are likely attributable to that leadership appointments and term limits are both found in Florida’s legislature, where most Latino Republican leaders in our data are found (a possibility underscored by the lack of similar findings in Table A7 in the Supplemental Appendix, when state and chamber random effects are included in the model). We note that our data set contains a total of 10 Latino Republican leaders, making us cautious to generalize from these findings. We also find an association between term limits and the promotion of black Republicans to leadership, though similarly here, the small number of black Republican leaders (N = 3) makes us hesitant to draw any broader conclusions from this finding.
Among the controls, a greater presence of each group in the legislature is positively associated with more Democratic leaders from each group. A coefficient estimate equal to 1 for these variables indicates that a 1-percentage-point increase in membership presence translates into a 1-percentage-point increase in leadership presence, controlling for other variables in the model. The coefficient estimates for Democratic women and Latinos fall more than two standard errors above 1, indicating that Democrats place these groups into leadership at a higher proportion than their presence in membership. We cannot reject a null hypothesis that black presence in leadership grows proportionately to its presence in membership, and we can conclude that the presence of workers in Democratic leadership lags behind its presence in membership. While greater numbers of women and workers in membership are associated with more women and workers in Republican leadership, the number of minority legislators is unrelated to the number of Republican leaders from minority groups.
Intriguingly, the negative and significant coefficient estimates for the Democratic Control variable indicate that Democrats taking majority control seems to be negatively associated with the proportion of that party’s leadership who are women and African Americans, controlling for other variables in the model. We estimate that Democratic women hold roughly 6 percentage points fewer leadership positions when Democrats are in the majority. For blacks, the figure is nearly 5 percentage points fewer. Although we can provide no definitive answers here, two potential explanations come to mind. First, it could be that increased competition for leadership positions, which become more desirable when a party holds the majority, crowds out consideration of traditionally underrepresented groups in the party. Second, specifically for African Americans, it could be that rank-and-file Democrats do not feel compelled to reward blacks with leadership positions because they take black allegiance to the party for granted.
We want to caution readers that these findings are not replicated at conventional levels of statistical significance under an alternative model specification in Supplemental Table A7. However, these findings are worth exploring because they contrast with our expectation that Democratic majorities would be positively associated with greater presence in leadership. We further investigate this dynamic in Tables A4 and A5 in the Supplemental Appendix, comparing how well each group’s membership is incorporated into legislative leadership depending on which party holds the majority. We extend the models above by interacting the membership variables with Democratic control. While Table 2 lets us observe how leadership presence changes under Democratic control, this new test allows us to observe how parity between membership and leadership changes when Democrats are in control. Positive and significant coefficient estimates for these interaction terms would indicate that the relationship between group presence in membership and group presence in leadership grows increasingly positive under Democratic majorities. Supplemental Table A4 suggests that women are no better or worse incorporated into leadership when Democrats hold the majority than when Republicans do, as indicated by the insignificant estimate for the interaction term between the two variables. However, African Americans are better incorporated under Democratic majorities, while Latinos and workers are under Republican majorities.
Breaking out the results by party in Supplemental Table A5, we find that Democratic women and Republican women fare no better in incorporation when Democrats are in the majority. Democratic Latinos and workers in both parties seem to be less well incorporated when Democrats hold the majority. However, black Democrats are no better incorporated into leadership when Democrats hold the majority than when they are in the minority. In addition, the results show that which party holds the majority makes little difference to the incorporation of Latinos into Republican leadership.
Robustness Checks
While the models presented in Tables 1 and 2 account for contemporaneous correlation in the error terms between each group’s presence in legislative leadership, they do not account well for the clustering of observations within chambers and within states. To determine whether our results hold while accounting for clustering, we conduct our analyses using a multilevel modeling approach. We use three-level models, nesting observations of terms within chambers and within states. Separate models are estimated for each group.
Using this modeling approach, we replicate Table 1 in Table A6 in the Supplemental Appendix. Generally speaking, while we observe small substantive differences in coefficient estimates, we obtain very similar findings using alternate model specifications in terms of the direction and significance of the estimates in Table 1. The most notable divergence is that the multilevel model in Supplemental Table A6 no longer produces a statistically significant estimate for the positive relationship between Latino presence in leadership and leadership elections.
However, the findings in Supplemental Table A7 diverge from those presented in Table 2 in a number of notable ways. In fact, many of the observed significant relationships in Table 2 are not obtained in the multilevel models. Looking at Supplemental Table A7, we find little evidence that women and black Democrats obtain relatively fewer seats when Democrats hold the majority; that Democratic Latinos benefit when the number of leadership positions increases or when leadership positions are elected; that Latinos of either party are affected by term limits; or that Latinos or workers of either party are affected by being in the South. This suggests many of the results in Table 2 are dependent upon model specification.
However, we do see fairly stable results for a number of variables across both specifications. We consistently find a positive, significant relationship between women in Republican leadership and the number of leadership positions; a negative, significant relationship between blacks in Democratic leadership and leadership elections; and a positive, significant relationship between blacks in Democratic leadership in the South. In addition, we obtain stable estimates, both in terms of coefficient size and significance, across both parties for all eight membership composition variables.
Critical Mass and Legislative Leadership
A possibility not addressed in the models so far is whether traditionally underrepresented groups need to achieve some sort of “critical mass” or “tipping point” in terms of presence in the body before they begin to be represented in leadership. Such a relationship has been theorized in the literature on the substantive representation of numerically small groups, whereby these groups need sufficient descriptive representation to achieve group policy goals (Kanter 1977; Mahoney and Clark 2018; Schwindt-Bayer and Mishler 2005). To assess this possibility, we replicate and extend the models in Tables 1 and 2 by adding squared terms for the group membership variables. Modeling the relationship this way does not allow us to identify a precise threshold after which members of a group are more likely to become leaders. However, if the theory helped to explain the incorporation of these groups into leadership, we would expect to see a positive and significant coefficient estimate for the squared term, indicating that the proportion in leadership increases at a higher rate as the proportion in membership increases.
Coefficient estimates and standard errors for the component and squared terms are presented in Tables A8 and A9 of the Supplemental Appendix. In Supplemental Table A8, which looks at group representation in chambers overall, we see no evidence that critical mass of group members in membership is necessary for group representation in leadership for women, African Americans, or Latinos. The results indicate that, if anything, the proportion of leadership composed of workers diminishes as the presence of workers in membership increases.
Supplemental Table A9 breaks out the results by party. This same trend for workers is observed within each party. The results also indicate that the proportion of black and Latino legislators in Republican leadership diminishes as the proportion of black and Latino legislators grows. However, as Latinos make up a greater proportion of legislators, Latino representation in Democratic leadership appears to grow. We continue to find no evidence of a curvilinear relationship between group presence in membership and leadership for women in either party or for black Democrats.
Another possibility in this vein is that a larger group presence in rank-and-file membership allows for groups to exert greater political influence in winning leadership positions when those positions are elected by the membership. We test this possibility by interacting variables capturing each group’s membership presence with the indicator variable for leadership elections. A positive and significant coefficient estimate for these interaction terms would indicate that elections allow underrepresented groups to hold a greater proportion of leadership positions as their size in the body grows. The results are presented in Tables A10 and A11 in the Supplemental Appendix. Table A10 shows mixed results across groups. While Latinos appear to translate their presence in the body to presence in leadership under elections, African Americans appear to lose presence in leadership under elections as their membership grows. The results show no significant interactive effect for women or workers. Breaking down the results by party in Table A11, we see that these relationships hold for Democratic Party leaders, though workers also seem to be able to capitalize on elections to increase their membership in the Democratic Party. Among Republicans, we see no significant interactive effects except for Latinos, where this group also appears to lose out in leadership positions under elections as their membership grows.
Overall, these results present a mixed picture on how group size in the body translates into group presence in leadership. The results in Tables 1 and 2 consistently show a linear relationship between group presence and group size within chambers (except for black and Latino Republicans). However, we do not see consistent evidence that a critical mass of members from an underrepresented group is needed to win leadership positions, even when leaders are elected by the body.
Intersectionality and Diversity in Legislative Leadership
A natural question that arises in our research is how the findings change once an intersectional approach is applied. For example, Scola (2007) shows rather convincingly that what scholars believe to be the factors that explain the presence of women state legislators is actually what predicts the presence of white women state legislators. In a later work, Scola (2014, chap. 4) further shows that the factors that explain the election of women of color to the state legislature are not identical to those that explain the election of men of color to the state legislature. Based on Scola’s work, it is reasonable to expect that white women and women of color follow different trajectories in their legislative careers.
While we cannot model all possible intersections between groups here, as a tentative look, we estimate a SUR model including separate terms for white women, black women, and black men. The results are presented in Table A12 in the Supplemental Appendix. We want to urge caution in the interpretation of these results, since the underlying dispersion of these three groups across chambers is in many cases quite small. 16 The results in this model diverge in several notable ways from the findings in Table 1. The findings here suggest that leadership elections are negatively associated with black women’s advancement to leadership, but have no noteworthy relationship with black men’s advancement. They also suggest that Democratic majority control is positively associated with the advancement of more white women to leadership, but negatively associated with the advancement of black women to leadership. Given the instability of the results across model specifications, we are hesitant to conclude definitively that black women face different experiences than either white women or black men in moving to leadership based on these data. However, the divergence in results certainly suggests that intersectional differences should be explored in future research on this question.
Over-Time Changes
Group presence in both membership and leadership can vary term-to-term, particularly in states with a small overall membership. The retirement or electoral defeat of one legislator, for example, may have implications for how we observe a group’s presence in leadership in a chamber like the Alaska Senate, which has only 20 seats. To estimate how fluctuations in group representation in the membership impact diversity in the leadership, we estimated a SUR model. The dependent variable is the change in each group’s representation in leadership from the prior term to the observed term (e.g., ∆% Women in Leadership), and group representation in membership is also measured as the difference in its proportion of seats between the prior and the observed terms (e.g., ∆% Women in Legislature).
The results are presented in Table A14 in the Supplemental Appendix. We find no significant relationship between term-to-term changes of group representation in leadership and term-to-term changes in membership. This finding suggests that diversity in leadership is stable in the short term. The model does not rule out the possibility that long-term changes in the composition of membership result in a changing composition of the leadership. However, the model does suggest that a sudden influx of an underrepresented group into a legislative body does not result in an immediate incorporation of that group into party leadership, in line with common expectations that members move into leadership positions as their tenure in the body increases.
Conclusion
The exploratory analyses above sought to describe and offer tentative explanations for the descriptive representation of four historically underrepresented groups—women, African Americans, Latinos, and workers—in state legislative leadership. Using available data from 30 states, we uncovered no evidence that these groups, once elected to legislative seats, are excluded from party leadership positions, though all four groups are more likely to serve in Democratic leadership than Republican leadership. However, we did observe some variation in inclusivity across chambers and asked whether institutional rules and arrangements could explain that variation. The findings above lead us to draw the broad conclusion that institutional characteristics, with some exceptions, do not seem to be systematically associated with the advancement (or lack of advancement) of underrepresented groups to leadership positions. This seems especially true for legislative professionalism and term limits, for which very little evidence presented here points to the conclusion that either is related to diversity in leadership.
Those characteristics that are related to an increased or decreased presence of underrepresented groups in leadership are not universal across groups. That is, the relationships between institutions and the promotion of each group observed were not the same across groups. Our findings do suggest that certain legislative institutions do create greater leadership opportunities for specific groups. For instance, more positions help women—especially Republican women—obtain greater power. Leadership appointments help African Americans do the same.
Our findings also point to the importance of a pipeline of underrepresented group members from the rank-and-file to leadership. When more members of an underrepresented group are present in a legislature, more members also tend to be present in leadership. This finding may seem self-evident at one level, but it also suggests that neither pure tokenism—advancement to leadership without a noticeable group presence in the body—nor a backlash effect—a declining presence in leadership as rank-and-file membership grows—explains the presence of women, minorities, and workers in leadership positions.
Two limitations of the analysis are worth highlighting. First, the analysis is constrained to 30 states over six legislative terms, and so it only provides a snapshot of the state of diversity in legislative leadership in the early twenty-first century. An extension of these data into future terms may be better able to shed light on the dynamic process of advancement to leadership. Second, the relationships we are able to observe in this analysis do not constitute causal evidence. Although analysis of the TSCS data likely provide a clearer picture than a simple analysis of cross-sectional data could, we want to caution readers that threats to inference remain. For example, it could be the case that the advancement of more members of underrepresented groups to leaders could be endogenous to legislative institutions, for instance, if majority group members were to change the rules to protect their privileged positions in a legislature. Future research may explore this possibility.
A final question that this research does not answer is what difference the presence of underrepresented groups in leadership make: whether to the operation and procedures of the legislatures, the policies it passes, or its responsiveness to citizens. Rather, this article represents an attempt to map out minority representation in leadership and explore the relationship between institutional characteristics and leadership diversity. The presence of traditionally marginalized groups in leadership certainly has symbolic importance—it speaks to questions of who is fit for office and who is capable of leadership. But the full implications of presence in leadership remain to be seen.
Supplemental Material
Appendix_R_and_R – Supplemental material for Diversity in Party Leadership in State Legislatures
Supplemental material, Appendix_R_and_R for Diversity in Party Leadership in State Legislatures by Eric R. Hansen and Christopher J. Clark in State Politics & Policy Quarterly
Footnotes
Acknowledgements
The authors thank Tracy Osborn for her helpful comments; Jason Windett for sharing data; and Elisa D’Amico, Mason Dufresne, Dan Gustafson, Adam Hii, David Joyner, Melissa Lee, Amanda Lewellyn, Katie Pischke, Jacob Smith, and Adam Weber for research assistance. Any errors remain the responsibility of the authors.
Declaration of Conflicting Interests
The author(s) declared no potential conflicts of interest with respect to the research, authorship, and/or publication of this article.
Funding
The author(s) received no financial support for the research, authorship, and/or publication of this article.
Supplemental Material
Supplemental material for this article is available online.
Notes
Author Biographies
References
Supplementary Material
Please find the following supplemental material available below.
For Open Access articles published under a Creative Commons License, all supplemental material carries the same license as the article it is associated with.
For non-Open Access articles published, all supplemental material carries a non-exclusive license, and permission requests for re-use of supplemental material or any part of supplemental material shall be sent directly to the copyright owner as specified in the copyright notice associated with the article.