
Abstract
Though elite-based campaign mobilization was thought to be dead just a few election cycles ago, it has come roaring back in recent years. The vast majority of this direct voter outreach is coordinated through campaign field offices. Despite the increasing importance of such activities, little is known about where campaigns choose to locate these field offices and what effect campaign offices have on election outcomes. We develop a theoretical argument about where candidates will locate these offices, and test our argument using data from recent elections. We also show that these field offices increase county-level vote share by approximately 1%, netting Obama approximately 275,000 additional votes in the 2008 election. We conclude by discussing the normative implications of increased campaign investment in field operations.
Campaigns have many options by which to reach out to citizens and encourage voting. Historically, elite mobilization drove turnout in U.S. elections and party machines worked to turn out their partisan base (Aldrich, 1995). Over the last few decades of the 20th century, that pattern reversed itself, and many argued that mobilization was now a thing of the past (Rosenstone & Hansen, 1993). Instead of being distinguished by in-person contact, campaigns increasingly became impersonal, mass media–driven affairs. There is evidence that recent elections—most notably the 2004, 2008, and 2012 campaigns—marked a real return to elite-driven mobilization efforts. This was especially true of 2008 and 2012, when the Obama campaign in particular made an unprecedented investment in voter outreach and mobilization.
Unlike patronage-driven mobilization networks of an earlier era, today’s mobilization efforts consist of establishing a series of campaign field offices to serve as points of coordination for voter outreach, phone banking, and canvassing (Silva, 2008; Zeleny, 2008). Little is known about the effects of these field offices, despite their important place in contemporary elections. We provide the first systematic exploration of campaign field offices by focusing on two related questions. First, we explore where campaigns choose to locate their field offices. Building on literature on the targeting of campaign resources, we develop a set of predictions about the placement of campaign field offices. Second, we explore the effects of these offices, and show that field offices boost a presidential candidate’s vote share, consistent with our argument that these field offices help coordinate voter contact efforts.
Our study is among the first to systematically document and describe how field offices help to mobilize voters in campaigns, a significant addition to earlier studies showing the return of elite-driven mobilization strategies (Gerber & Green, 2000). More broadly, our results illustrate how campaign resource allocation strategies have crucial ramifications for citizens’ level of political involvement. Campaign targeting and contact shapes citizens’ engagement with—and knowledge about—the campaign (Gimpel, Kaufmann, & Pearson-Merkowitz, 2007), and citizens are more likely to participate in politics if they are asked (Rosenstone & Hansen, 1993; Verba, Schlozman, & Brady, 1995). Field offices are the point of contact between a campaign and volunteers, serving as a facilitator for voter contact within that campaign, and perhaps spurring continued involvement and engagement in other races. Given the normative importance of generating and sustaining citizens’ involvement with politics, it is essential to understand the logistics of how campaigns reach out to voters. By investigating the placement and effects of field offices, we help to illuminate this understudied portion of the participation puzzle.
Where Should Campaigns Locate Field Offices?
We assume that campaigns strategically target resources to maximize their probability of winning the election (Bartels, 1985; Shaw, 2006). Campaigns (with few exceptions) face limited resources and have to spend them efficiently, requiring strategic decisions by candidates. Thus, candidates must decide how to allocate resources between media campaigns, personal campaign events, and mobilization efforts.
As campaign-based mobilization was considered mostly dead, the “air war” received the lion’s share of attention from political scientists. We now know much about how campaigns choose to target those resources and what effects they have (Campbell, 2008; Franz, Freedman, Goldstein, & Ridout, 2007; Huber & Arceneaux, 2007). Other scholars have documented that returns on campaign investment on the candidate’s time and presence has a real but modest effect in elections (Althaus, Nardulli, & Shaw, 2002; Shaw, 1999; West, 1983). These expenditures of financial capital are undoubtedly important, but campaigns also actively recruit and implement human capital to mobilize voters in their community.
We argue that the field office is a prominent feature of the modern mobilization effort. Field offices serve as coordination points for voter contact and outreach: they are the clearinghouse for organizing and coordinating volunteers, who provide the labor needed to knock on doors and make phone calls to mobilize and persuade voters (Exley, 2008; Sulzberger & Barbaro, 2012). 1 Recent research shows how local volunteers are more effective at get-out-the vote (GOTV) operations (Sinclair, McConnell, & Michelson, 2013), making the ability to organize local supporters crucial. Some central point of control and coordination is necessary, as campaigns wish to utilize voter-level information to maximize differential turnout: identifying and mobilizing their own supporters, not their opponent’s. Much has been made of the apparent disparity between the Obama and Romney data operations, but less has been said about how this information was utilized and implemented. Field offices provide the link between voter data and voter contacts, allowing campaigns to target their appeals to their chosen voters. Real-time data on enthusiasm, persuadable voters, and volunteer capacity must come in part from a vigorous field operation (Issenberg, 2012). It would be a mistake to praise the cutting-edge technology and data strategy of recent campaigns without acknowledging their increased reliance on old-fashioned shoe leather and face-to-face conversations with neighbors.
We argue that field offices are now crucial to a successful campaign (Oppel, 2011), and their use is likely to increase in the future (Zeleny, 2013a). The availability of voter-level data increases the importance campaigns place on generating personal contacts with voters (Gerber & Green, 2004; Shaw, 2006). It is essential to contextualize the role of field within the broader context of campaign expenditures and investments. Though the literature on the voter contact strategies and GOTV efforts that are coordinated from field offices is voluminous (Alvarez, Hopkins, & Sinclair, 2010; Gerber & Green, 2000; Middleton & Green, 2008), there is only one published study of field offices, focused specifically on a small number of battleground states in 2008 (Masket, 2009). We know that the Obama campaign benefited from mobilization in 2008 (Osborn, McClurg, & Knoll, 2010), but we do not know much about where such mobilization was carried out in the field. Examining the placement of field offices, given their central role in voter outreach, can help correct this deficit. 2
If field offices are indeed the hub of mobilization efforts, then there are three key strategic questions faced by campaigns. First, which states should receive field offices? Even in the least mobilization-oriented campaign, candidates will open offices in battleground states (Shaw, 1999, 2006), especially those with large numbers of electoral votes (Colantoni, Levesque, & Ordeshook, 1975; Kelly, 1961). While battleground states should receive most of the field offices, they will not receive all of them. Campaigns also open field offices where they can generate positive externalities for other candidates and lay the groundwork for success in future elections. For example, Obama put field offices in Utah in 2008 not because he thought he could win the state, but rather because he wanted to help down-ballot Democrats (Newton-Small, 2008), a pattern seen in other states as well (Heberlig, Francia, & Greene, 2010).
While it is obvious that campaigns will focus most of their attention on battleground states, it is less clear whether they will direct their attention to core or swing areas within a given state. At the individual level, most theories argue that campaigns should target core voters—if core voters come to the polls, they will support their party’s candidates. Swing voters, by contrast, might defect and support the opposition (Cox & McCubbins, 1986). While we focus here on core versus swing counties rather than voters, the logic is the same: core counties (those that consistently support a party’s nominee) have large concentrations of supporters, meaning that mobilization efforts are likely to yield a large payoff for a campaign. This sort of “deep” investment in areas rich with supporters is a useful complement to the “broad” outreach of television advertising across larger media market areas. Mobilizing in swing counties (i.e., those that could go for either campaign) is far riskier because campaigns must be far more cautious to avoid mobilizing opposing partisans (Chen & Reeves, 2011).
This core voter logic is particularly compelling at the county level for two additional reasons. First, the types of person-to-person contacts delivered by field offices are likely to focus on mobilization more than persuasion (Alvarez et al., 2010; Middleton & Green, 2008). Second, offices might also be placed in core areas due to greater concentrations of preexisting activist networks and availability of motivated volunteers (Rosenstone & Hansen, 1993), which would also explain why such campaign effects typically mobilize core supporters (Holbrook & McClurg, 2005; McGhee & Sides, 2011). The implementation of targeted voter mobilization at the local level requires a point of coordination between the campaign’s data and strategy staff and the local volunteers who are out in the field making the contacts. Campaigns should find active volunteers and more receptive voters to target in core areas, and thus use their field resources most efficiently in those areas. We expect to find that campaigns target more field offices to core counties to “run up the score” where their voters are plentiful.
Finally, there is the question of whether campaigns “match” their opponent’s behavior (see also Masket, Sides, & Vavreck, 2013). If one campaign opens a field office in a given county, does their opponent also feel the need to open one there as well, to avoid ceding the county to their opponent? Above, we argued that campaigns concentrate their field offices in core areas. Given this, we would not expect to see much matching there: if Obama opens a field office in a heavily Democratic area, then it will likely not benefit Romney much to open one there. However, if a campaign opens a field office in a swing county, then we expect his opponent to do the same to avoid ceding that county to the opposition. Therefore, we expect to find that campaigns match their opponent’s behavior in swing counties, but not in core areas.
Data and Method
To test these hypotheses about the location of field offices, we use data on the placement of field offices from the 2012 election. We use 2012 because it is the best example of an election with a significant field investment by campaigns and reliable data that reflect their activities (for a related analysis, see Masket et al., 2013). While we accept that this limits our analysis somewhat, we view it is an important (and current) first step to studying the dynamics of field office placement.
We focus our analysis here at the county level. Counties are politically meaningful entities for the mass public and elites (Aistrup, 2004). When devising their field office strategy, and thinking about voter outreach more generally, campaigns often think in terms of county-level totals and organize at the county level (Coffey et al., 2011). The intended contacts by a local field office often spread beyond town borders as well, making municipalities too small of a unit and states too large. Given this, we proceed at the county level for our analysis of field office placement.
We focus on the strategic decisions made about how to allocate campaign field offices. To do so, we estimate the following equation:

where yi is the number of field offices in county i,
Candidate Field Office Placement, 2012 Data.
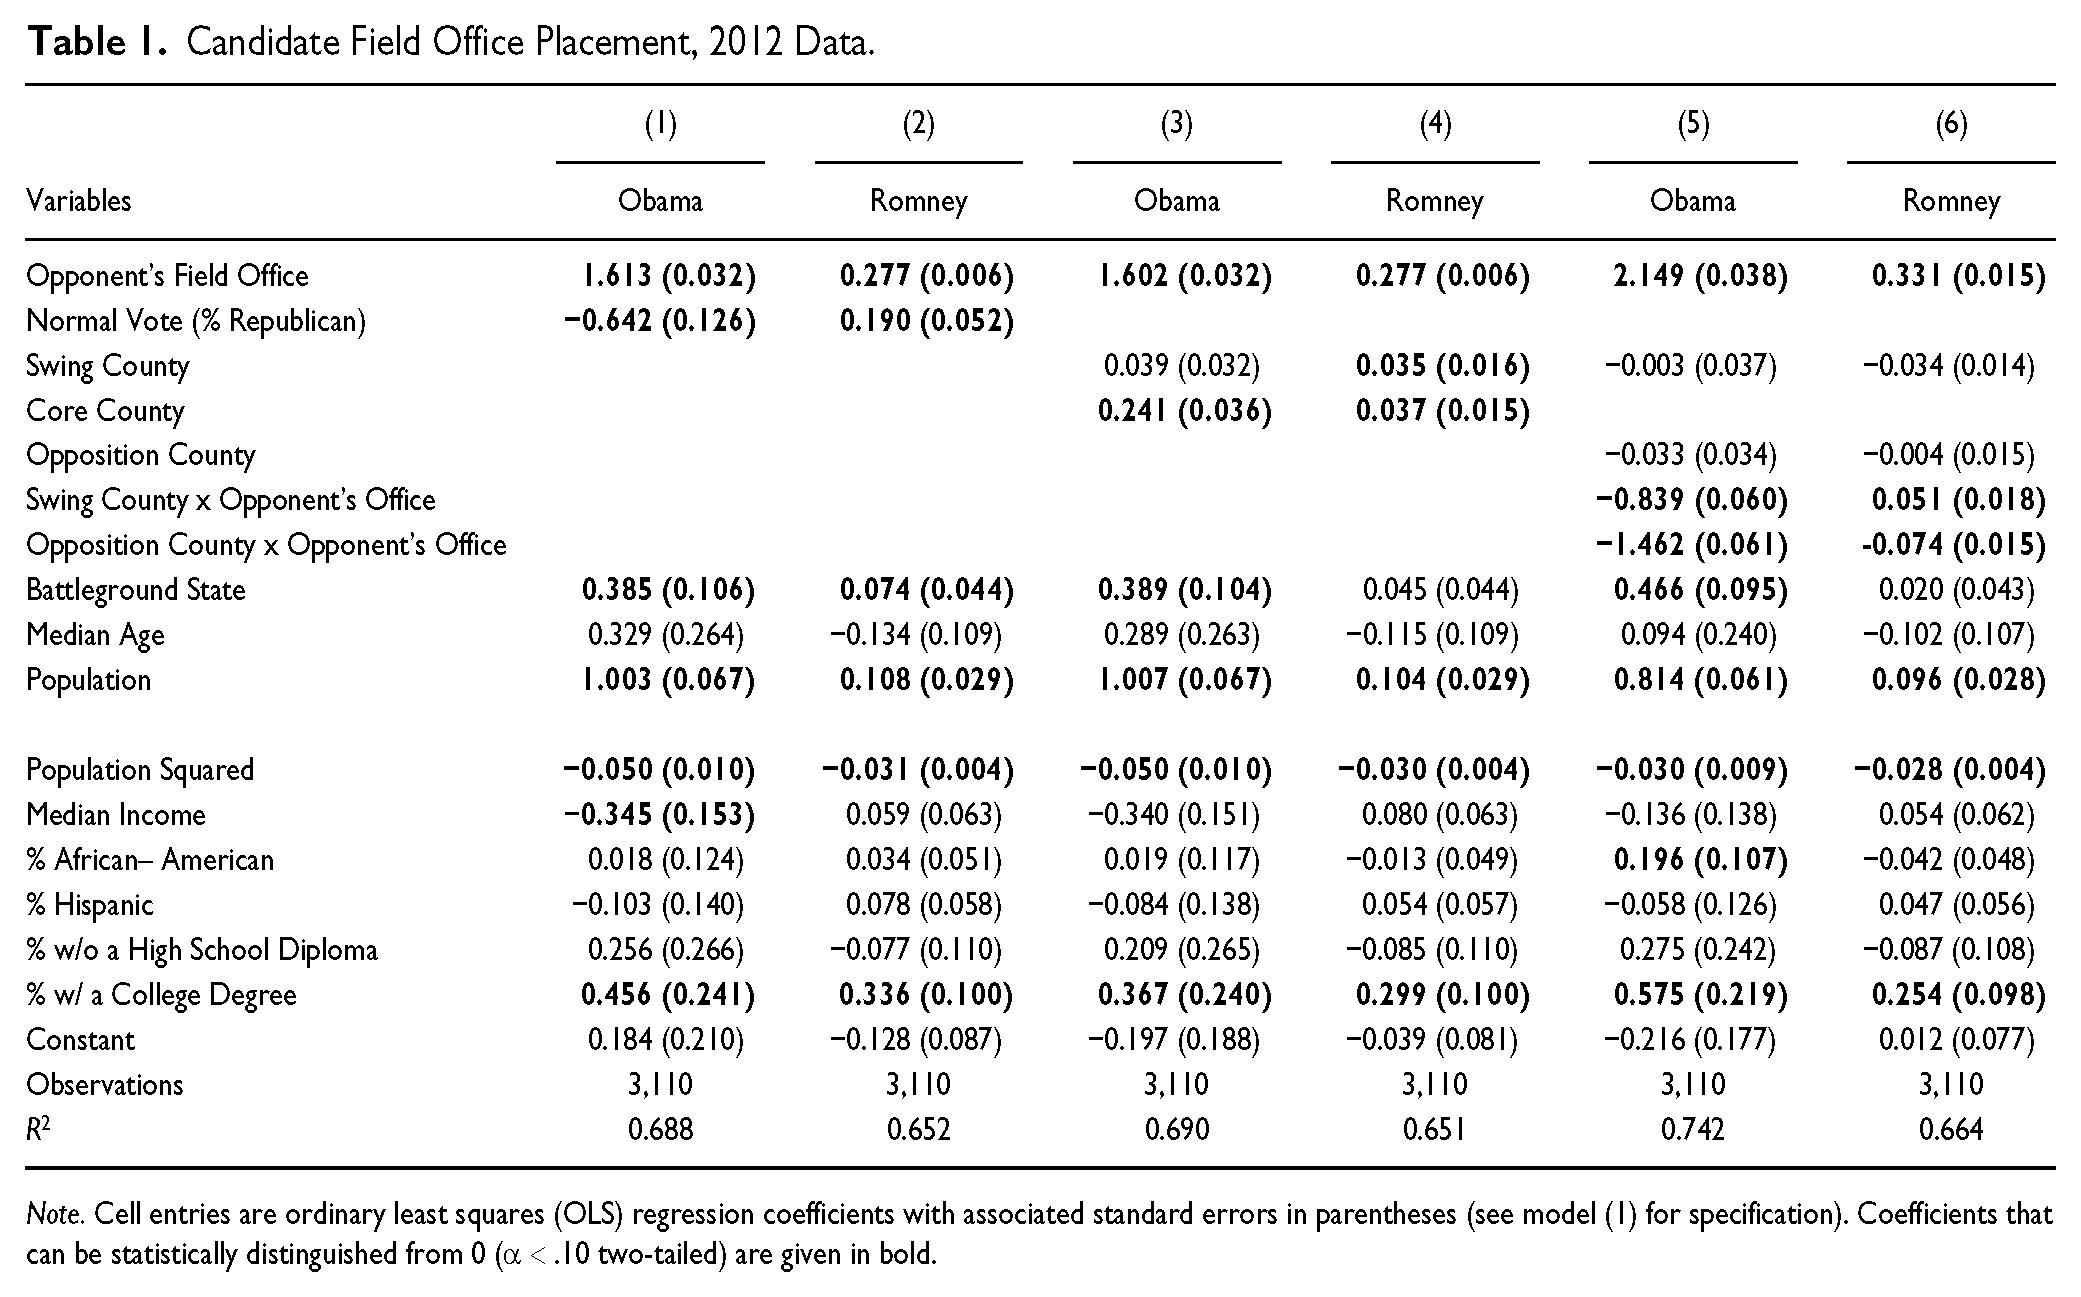
Note. Cell entries are ordinary least squares (OLS) regression coefficients with associated standard errors in parentheses (see model (1) for specification). Coefficients that can be statistically distinguished from 0 (α < .10 two-tailed) are given in bold.
Table 1 immediately confirms our first prediction about field office placement: most field offices are placed in battleground states (see Models 1 and 2 in Table 1). It is worth noting, however, that not all field offices are placed there: in 2012, both campaigns placed approximately one quarter of the field offices outside the core battleground states. 3 Though we lack the data to test for why campaigns place field offices in nonbattleground states, such offices are likely playing one (or more) of three roles: they may be explicitly designed to help down-ballot candidates, they may be building a volunteer base for future electoral success in a given area, or they may be forcing the opposition to spend time and resources defending what it perceives to be “safe” areas. Arbitrating between these possibilities with more micro-level data is an important task for future research.
Models 1 and 2 also show that, consistent with our logic, campaigns invest more heavily in their core areas: areas with higher Republican normal vote 4 have more Romney field offices and fewer Obama ones. To unpack the data a bit, and more explicitly test the core versus swing county logic, Models 3 and 4 include indicators for core and swing counties separately. We define core counties as those that went for the same candidate in 2004 and 2008, while swing counties are those that switched sides. 5 Interestingly, these results differ by party. Obama invested heavily in core Democratic areas, while there is no significant difference in allocation of offices to swing counties and core Republican areas. Romney, however, avoided core Democratic areas, but allocated field offices essentially equally between core Republican and swing counties. It seems unlikely that this was due to resource constraints, as each campaign and its affiliated groups spent similar amounts of money. Obama’s superior data operation (see Issenberg, 2012) may have enabled his campaign to locate potential Democratic voters that would otherwise be “hidden” in some Republican counties (Demissie, 2012). This finding may also be due to the differential geography of core Democratic and Republican areas. Core Republican counties are (on average) more exurban and rural, whereas core Democratic counties are more urban/suburban in most parts of the country. It may simply be more efficient for Democrats to mobilize their core voters relative to Republicans, though more data from future elections will be needed to conclude this definitively.
These results allow us to test our first two hypotheses, but not our third: that campaigns will be more likely to match their opponent’s placement in swing counties (but not in core ones). Models 5 and 6 let us test these effects. First, consistent with our results, we show that campaigns do not match in core areas: when Romney went in to core Republican areas, Obama did not follow. The results in swing counties tell a much more interesting story. If Obama went into a swing county, Romney was more likely to open an office there. However, if Romney went into a swing county, Obama did not—in fact, Obama was less likely to go there. This may reflect the fact that Obama invested more heavily in his core areas (relative to Romney), or may demonstrate different opinions between the campaigns about where critical voters could be found. Again, because we only have data from one election, the results here are necessarily limited. That said, they are consistent with our theoretical expectations about campaigns’ logic, and they will provide an important baseline for future work in this area. 6
Do Field Offices Matter?
The results above tell us where campaigns locate their field offices, but they do not tell us how they affect turnout or vote share. The strategic behavior of campaigns complicates our statistical analysis of this question. Of course, field offices are not allocated randomly; campaigns place field offices where they expect them to have a larger impact (see Table 1). As such, we must attempt to correct for this selection process, or our estimates of effect will not be identified (consistently estimated).
We take the 2004, 2008, and 2012 data on Democratic field offices and estimate the effect of having a Democratic field office on county-level vote share. To do so, we estimate the following equation:

where yit is either (a) the turnout in county i in election t, or (b) the Democrat’s vote share in county i at election t, FOit is in an indicator for whether county i has one or more field office(s) at election t,
7
As we discussed above, campaigns behave strategically when allocating field offices, and this complicates our analysis of the effects of field offices. To control for this we included two different types of fixed effects in Equation 2, each of which removes a different sort of unobserved heterogeneity. The county-level fixed effects control for county-level characteristics, most importantly the partisan composition of the county (the county-level “normal vote”; see Levendusky, Pope, & Jackman, 2008). In addition, the state-year fixed effects remove common shocks across counties within each state that might result from the presence of another statewide contest, or more general effects of being targeted as a battleground state. Given this, we do not include the standard panel of “control” variables in our model; instead, we rely on these fixed effects to remove this sort of between-county variation in our specification.
We acknowledge that our data limit us in three ways. First, though we lack data from before 2004, this is not a serious limitation, given that 2004 marked a sea change in how campaigns organized in-person contact operations (Panagopoulos & Wielhouwer, 2008). Data from before 2004, then, would be unlikely to be particularly informative about the current period.
Second, we only have data on Democratic field office placement, given that such Republican data are not available for 2004 or 2008. 9 Given this, our results can only speak to the effects of Democratic offices, and we leave corresponding analysis of Republican effects (and questions about the relative effectiveness of these efforts between parties) for future work. In the online appendix we have analyzed the data from 2012, when we have data from both campaigns, and our findings from that year are quite consistent with the findings we report below (see also Masket et al., 2013).
Third, we lack specific micro-level data on the particular voters targeted by a field office. This has two important implications for our analysis. First, because field offices target specific neighborhoods and addresses while ignoring others (D’Aprile, 2013), our estimates recover an imprecise average effect of field office activity. Second, we assume throughout that the effects of a field office in county
Effects of Democratic Field Offices on Turnout & Vote Share, 2004-2012.
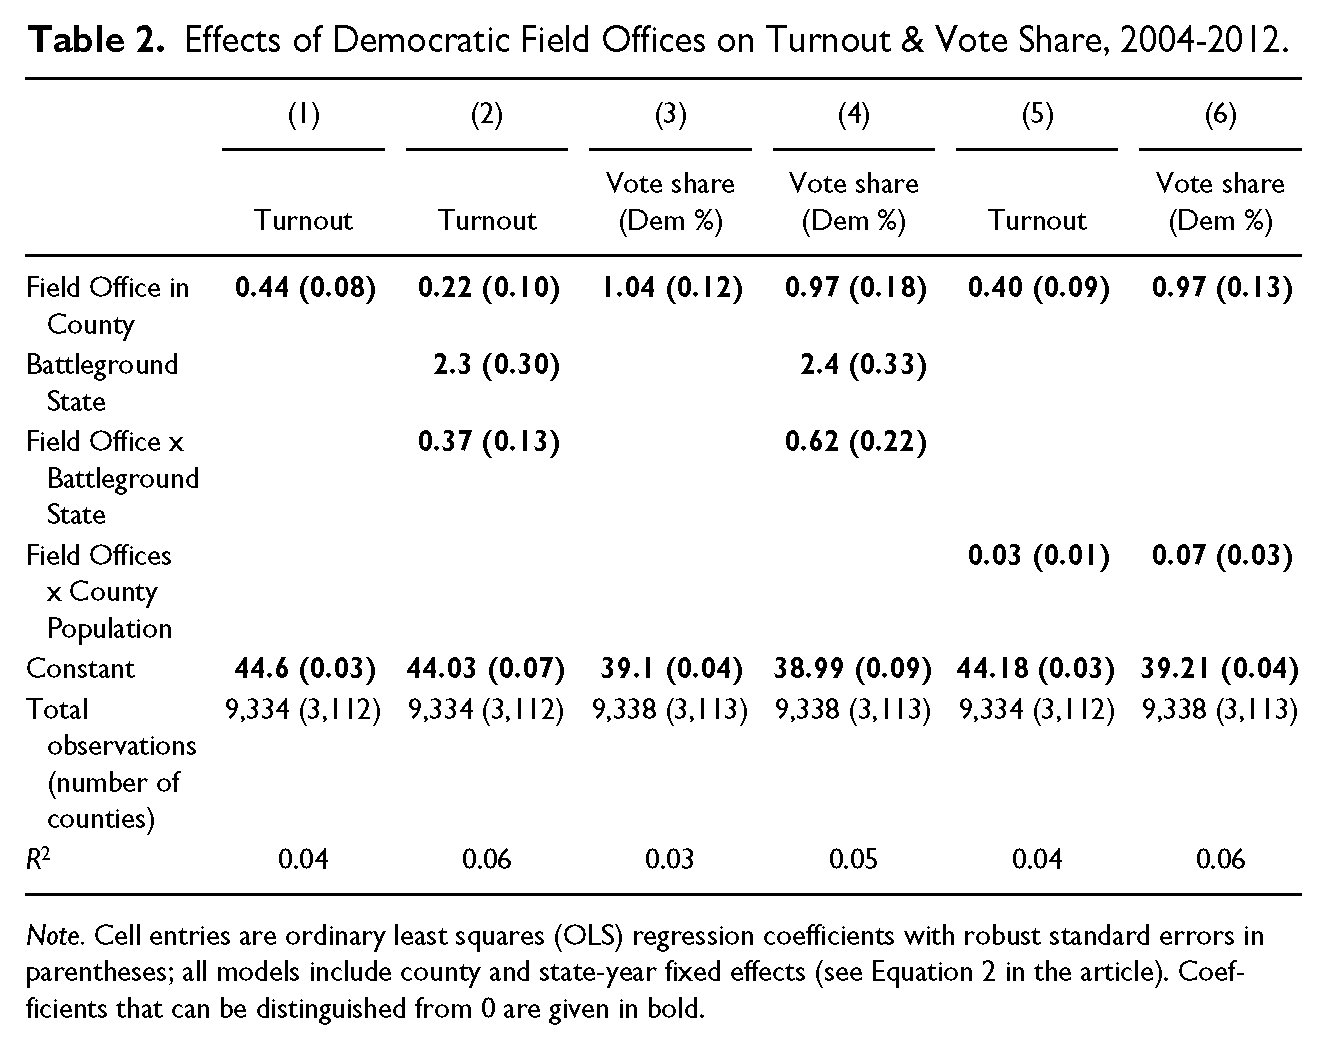
Note. Cell entries are ordinary least squares (OLS) regression coefficients with robust standard errors in parentheses; all models include county and state-year fixed effects (see Equation 2 in the article). Coefficients that can be distinguished from 0 are given in bold.
Table 2 has a clear message: field offices increase turnout and Democratic vote share. Take column 1 first, which considers the effect of field offices on turnout. The constant term tells us that, in the average county, approximately 44% of the population turns out to vote. 12 Our estimate of the field office effect, however, suggests that having at least one field office increases turnout by approximately 0.4%, all else equal. This suggests a small but real electoral effect of campaign field presence in a given county.
We see a similar story in column 3 when examining the effects on vote choice. The Democratic candidate does about 1.04% better in counties with field offices, all else equal (again, from a baseline of approximately 40% in the average county). Note that the effect on vote choice is somewhat larger than the corresponding effect on turnout (about 2.3 times larger), which is consistent with the idea that these offices focus on mobilizing core supporters. 13
One might be tempted to dismiss the turnout and vote share effects as unimportant given their size. It is worth reiterating that these are aggregate (county-level) shifts in vote share estimated with fixed effects removing the between-county variation. Given that county-level vote is quite stable over this period—the average standard deviation of 2004-2012 vote is 3%—our effects are not so miniscule. A 1% change in vote share, while not massive, is a modest but important shift in electoral outcomes.
This is also consistent with the campaign’s analysis of these effects: Obama’s campaign manager David Plouffe called the field operation a “field goal unit,” suggesting that they should be expected to matter mostly at the margin (Tumulty, 2008). But just as a field goal can be decisive in a close football game, a small effect on vote share can tip the balance between winning and losing in a close election, as we show below. A 0.5% shift in key counties in Ohio, Wisconsin, New Mexico, Florida, or other key states in 2000 or 2004 could have changed the winner of the election. It is an interesting side note that some suggest that Kerry’s 2004 Ohio loss was generated (at least in part) by a shift away from this sort of base mobilization style activities, exactly what our evidence suggests field offices provide (Bai, 2004). Though modest, these effects can prove to be quite important under certain circumstances, as we explore more fully below.
Given the focus on battleground states, we might also ask whether these field offices are more effective in battleground states. We examine this possibility in columns 2 and 4. While turnout and Democratic vote share are generally higher in battleground states (i.e., the main effect of battleground state is positive and significant), our results show that field offices were more effective in battleground states (i.e., the interaction is positive and statistically significant)—the effect is almost twice as large for turnout and Democratic vote share in battleground states. Unfortunately, we cannot rule out that this is due to other factors correlated with field office activity, but it does suggest that future work should try to disaggregate what field offices in battleground versus other states do to see if there are differences in their effectiveness across locales.
Finally, we address one additional concern: the effect of field offices might be systematically different in large versus small counties. In a dense urban county, the effect of a field office might be quite different than a small, rural county. 14 To test for such a possibility, we explore an interaction between county population and field office presence in columns 5 and 6 of Table 2. 15 We find a positive and significant main effect of having a field office—in a county with the average population, having a field office increases turnout by 0.4% and boots Democratic vote share by slightly less than 1% (0.97%). The positive and significant interaction effects indicate that the effect is very slightly larger in more populous counties: in a county with an additional 10,000 residents, field office presence increases vote share by an additional 0.07% (and turnout by 0.03%). We note, however, that this result should be taken with a large grain of salt. As illustrated in Table 1, more populous counties also attract more field offices, making this result difficult to interpret. Furthermore, field offices in populous counties—nearly all of which are urban and inner-ring suburban counties—almost certainly function quite differently than counties in more sparsely populated rural counties with smaller populations. We note this as an interesting finding here, but much more on the specific functions of field offices will be needed to fully parse how these effects differ by county size.
To help put our results into context, we can derive two additional ways of estimating the effectiveness of field offices. First, we can estimate of the number of additional votes gained for a candidate by having field offices—how much better did Obama do in 2008 as a result of having his network of field offices? The data in Table 2 provide an answer. If field offices increase county-level vote share by 1.04%, with roughly 41,000 voters in the typical county in 2008, this implies that a field office generated 425 additional voters per county. With 642 counties having field offices in 2008, this suggests that Obama gained an additional 275,000 votes in 2008 as a result of his network of field offices (for similar estimates, see Masket 2009; Masket et al. 2013).
While these effects may not have been decisive nationally, they may have had a larger effect in particular states. Table 3 highlights the role of field offices on the 2008 outcome in the battleground states.
Counterfactual Effects of Field Offices, 2008 Election.
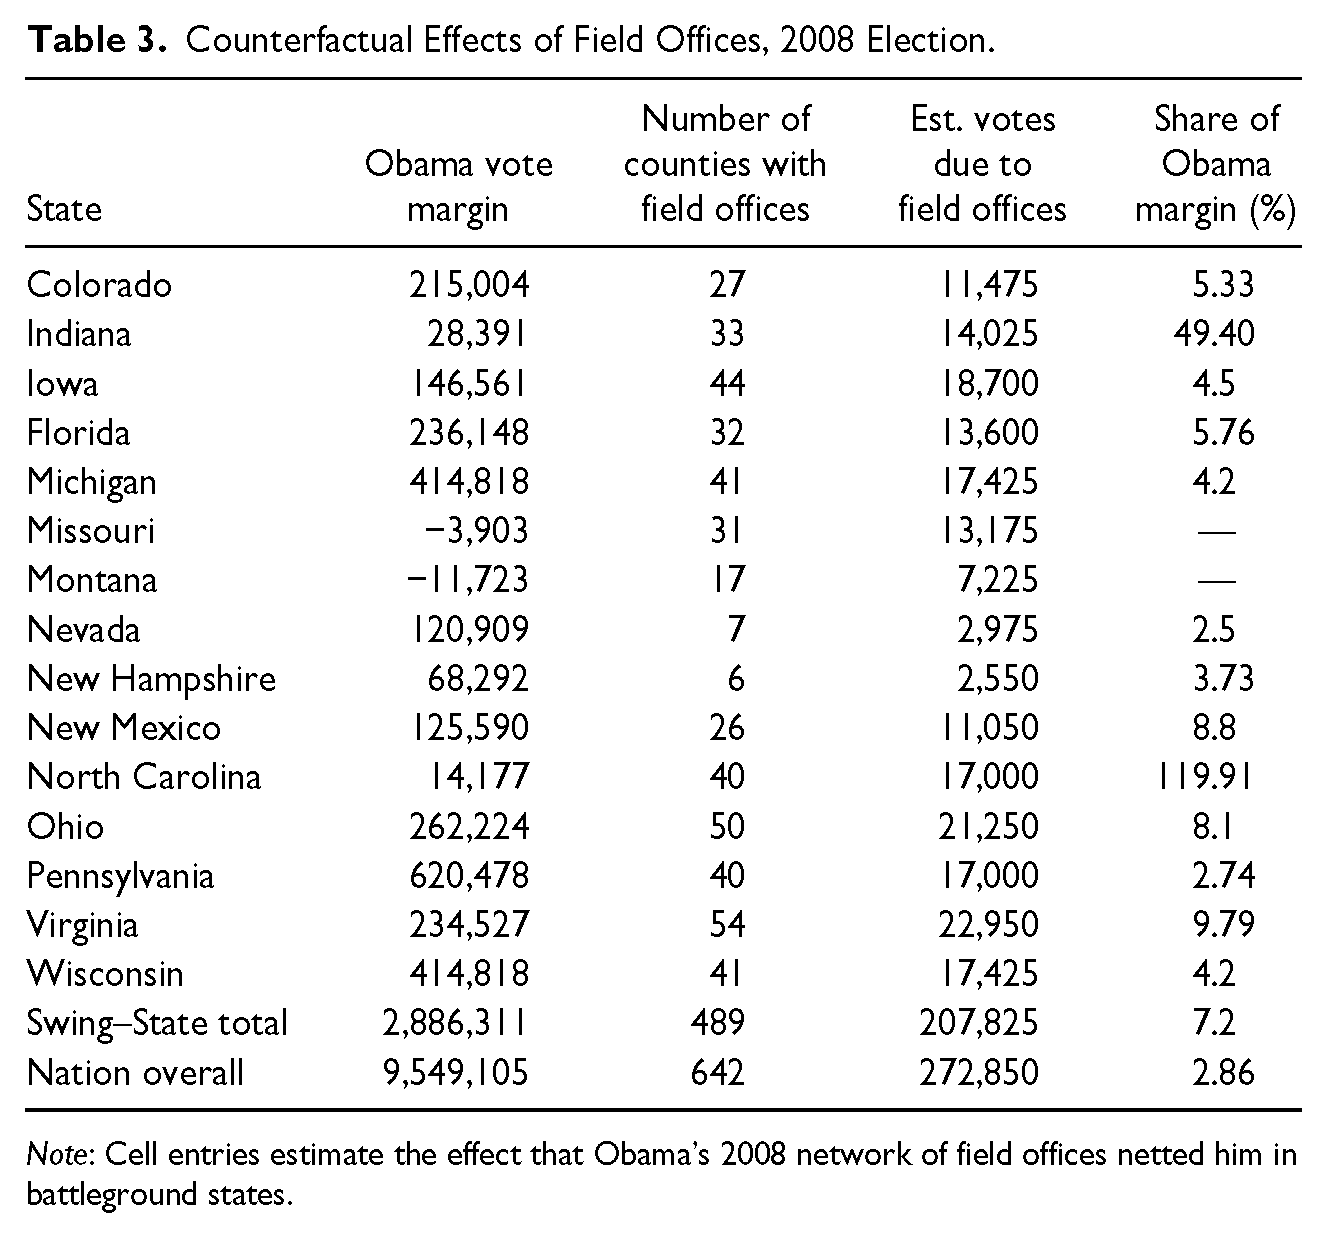
Note: Cell entries estimate the effect that Obama’s 2008 network of field offices netted him in battleground states.
Across the battleground states, Obama’s network of field offices netted him approximately 200,000 votes (or about 7% of his margin in these states). The effect was modest nationally (winning Obama only about 3% of his margin over McCain), but in certain key states, it made a much more pronounced difference. In most battleground states, Obama’s field office operation had a minor effect, accounting for about 4% of his margin of victory in states like Iowa, Michigan, and Wisconsin. But in other states, the effect was more pronounced. For example, we estimate that field offices accounted for nearly 10% of Obama’s margin in Virginia and New Mexico, and absent field offices, Obama would have lost Missouri and Montana by nearly 20,000 votes each (instead of fewer than 4,000 and 12,000, respectively). In Indiana, field offices account for nearly 50% of Obama’s margin, and we estimate that Obama would have lost North Carolina but for the mobilization provided by his network of field offices (on a related point, see Masket, 2009). Field offices may not determine the outcome in any election except for the tightest of races, but they can aid a candidate on the margin in key states.
Second, we can calculate the cost per vote gained through field presence (Gerber & Green, 2000). While we can only give an approximation of this cost (given difficulties in obtaining specific data on the cost of leasing space, equipment, etc. across the country), data from recent years suggest that a field office costs approximately US$21,000 to run for the election season. 16 If the average field office nets approximately 425 additional votes per county (see above), the cost per additional vote is approximately US$49.40. This estimate suggests an important corrective to previous cost estimates for in-person canvassing. Gerber and Green (2000) report that in-person canvassing costs approximately US$8 per vote, but assume paid canvassers with little organizational structure. This may well be how some interest groups conduct GOTV drives, but it is not how they are conducted by actual campaigns. 17 Election campaigns conduct in-person mobilization through field offices, which require a fixed investment of staff, space, and supplies. For example, the 2008 Obama campaign directed local staff reach out to interested volunteers, test their capabilities, train them to use campaign software, and appoint them as “neighborhood team leaders” (Exley, 2008). Such efforts are especially crucial given that local, neighborhood-based turnout operations are the most effective type (Sinclair et al., 2013). Field offices can generate successful GOTV efforts, but they also require an investment in infrastructure, one which has not been captured by earlier studies that judge the cost-per-vote of in-person contacts. In-person canvassing, while no doubt effective (as a number of previous studies attest), is actually far more expensive on the margin than earlier estimates would lead one to believe—even when canvassers are unpaid volunteers.
That said, in the era of billion-dollar campaigns, even our more expensive estimates for in-person canvassing are minor expenses. In comparison with expenses like campaign advertising—which number into the hundreds of millions of dollars for each campaign, with millions more spent by allied interest groups—field operations are a minor part of the budget. Given its relatively low cost, ability to microtarget specific homes and neighborhoods, and the significant returns on this investment found by our study, in-person mobilization seems like one of the more effective expenditures a campaign can make with their limited resources.
Conclusion
This article explores the effects and placement of campaign field offices in presidential campaigns. Despite the fact that campaigns and candidates devote considerable attention to ground operations, including field offices, little is systematically known about their effects in presidential elections. We show that field offices serve as mechanisms for coordinating voter contact, especially in-person voter contact, and that campaigns strategically locate offices in areas of strength for the campaign. We also show that these field offices increase turnout and vote share for the candidate that established them.
These empirical findings have several implications for the study of campaigns. Our findings show that the local campaign matters: while the national campaign receives the lion’s share of attention, the decisions and investments “on the ground” around the nation can also make a difference. While we are not the first to recognize this (for a review and discussion, see Campbell, 2008), our findings add to that literature by suggesting that it matters where campaigns choose to locate field offices. There is not only a national campaign but a local one as well.
At a broader level, the types of activities engendered by field offices are especially normatively important. An earlier generation of scholars decried the death of party-based mobilization, claiming it led to decreasing political involvement and participation (Rosenstone & Hansen, 1993). Our results show that in recent elections, mobilization has returned to the fore, with important aggregate and individual-level consequences (see also Panagopoulos & Wielhouwer, 2008). Campaign field offices convert volunteer enthusiasm into field activities that not only increase voting, but impart other civic skills as well. Face-to-face, community-centered outreach, focused on the recruitment and deployment of volunteers, is effective at moving aggregate vote share and leaves a local legacy of volunteers with politically valuable skills (Verba et al., 1995). Field offices—and the mobilization they facilitate—generate legacies beyond a particular campaign, and in that sense, help foster broader engagement in politics (Fung, 2003). These volunteers can be expected to continue participating in the future at higher rates than if they were not initially targeted. Given the Obama campaign’s decision to use its 2012 voter contact operation to continue to lobby for the president’s policies (Zeleny, 2013b), this type of engagement should only increase in the future. Direct, unmediated, community-centered campaign contact and volunteer mobilization is normatively preferable to passive, mediated engagement through advertisements. Even if the effects in any one campaign are modest, there may be more important downstream consequences in the future.
Footnotes
Acknowledgements
We thank John Geer, Seth Masket, Marc Meredith, Neil Malhotra, and especially Luke Keele for helpful comments. We also thank seminar participants at the Penn American Politics Working Group, The Penn-Temple American Politics Conference, and MPSA 2012 for their thoughts. Any remaining errors are our own.
Declaration of Conflicting Interests
The author(s) declared no potential conflicts of interest with respect to the research, authorship, and/or publication of this article.
Funding
The author(s) received no financial support for the research, authorship, and/or publication of this article.
Notes
Author Biography
References
Supplementary Material
Please find the following supplemental material available below.
For Open Access articles published under a Creative Commons License, all supplemental material carries the same license as the article it is associated with.
For non-Open Access articles published, all supplemental material carries a non-exclusive license, and permission requests for re-use of supplemental material or any part of supplemental material shall be sent directly to the copyright owner as specified in the copyright notice associated with the article.