
Abstract
Scholars of redistricting often discuss “communities of interest” as a guideline for drawing districts, but scholarship offers little guidance on how citizens construe communities and interests in the context of representation. In this article, we seek to better understand how citizens’ perceptions of people and places affect preferences regarding representation. Using an original survey conducted in 15 Massachusetts communities, we explore whether citizens have meaningful preferences about the communities with whom they share the same representative. To the extent they do, we test whether these preferences are driven by geographic considerations or other factors such as partisanship, race, and socioeconomic status. Our findings not only offer the opportunity to refine the concept of “communities of interest” to account for voter preferences but also more broadly speak to the literature on the increasingly political nature of residential preferences and their impact on political attitudes, participation, and voting behavior.
I want to describe to you a city. It’s a city of about 44,000 people. It has a long-standing manufacturing pedigree. It has a big GE plant. The average household income is about $50,000 and it’s in the process of finding its way into the new economy. Now, you might think “Andrea’s from Pittsfield, that’s gotta be the city of Pittsfield.” Turns out that’s Fitchburg too. And if you took out GE and put in a different manufacturer, you could say the same about Leominster, or Westfield, or Williamstown or some of the other small cities that are in the First Congressional District. So what I would urge you to do is to really consider that notion that comes from a series of federal court rulings that we should put communities of common interest together in a district.
There is a fundamentally asymmetric relationship between representatives and constituents in most democratic systems: A constituent has only one representative, but a representative represents many constituents. Territorial-based constituencies, then, not only determine who a citizen’s representative will be but also with whom that citizen will share that representative. Little attention, however, has been paid to the citizen’s perspective on the notion of shared representation.
Scholars of both normative accounts of representation (Pitkin, 1967) and empirical accounts of the behavior of representatives (Miler, 2010) have noted the neglect of concerns related to shared representation, in their own contexts. For example, classic work that formulates policy congruity as an ideal of representation (Erikson, 1978; Miller & Stokes, 1963) begs the question of how representatives could or should be responsive to the policy demands of heterogeneous constituencies. Likewise, empirical and normative work that focuses on the canonical trustee–delegate distinction must pose similar questions in defining what it means to be a delegate.
The asymmetry of representation is also highly relevant to studies that consider the quality of representation from the citizen’s perspective. Indeed, recent work has begun to delve deeper into questions about mass preferences regarding representation. For example, individuals appear to differ significantly in terms of their preferences regarding what representatives do (Davidson, 1970) and voter evaluations are in fact responsive to satisfying these preferences (Grant & Rudolph, 2004). Griffin and Flavin (2010) find significant demographic variation in these preferences, whereas Harden (2011) finds a link between these preferences and views about the role of government. Similarly, more attention has been paid to mass preferences regarding how representatives act. For example, evidence suggests that voter preferences regarding representative decision making are structured by contextual factors, particularly minority status (Carman, 2007) and political culture (Barker & Carman, 2009), and that citizens’ preferences are tempered by an understanding of the incentives facing representatives (Doherty, 2013) and the procedural context (Doherty, 2014).
Still, these studies focus mostly on the “act” of representing and not the “fact” of representing; that is, none of these works addresses the question of how citizens come to share representation in the first place. The process of redistricting, while infamous for its partisan gamesmanship and its effects on legislative balances of power, also has the effect of determining which citizens will share the same representative. In some places, like Massachusetts, hearings like the one quoted in the epigraph attract citizens and interest groups who have strongly held beliefs about which communities can or should share representation. Yet, we have little systematic knowledge of the ways in which citizens think about this topic.
In this article, we attempt to provide the citizen’s perspective on shared representation. Using an original survey conducted in 15 Massachusetts communities, we seek to better understand citizens’ perceptions of people and places and how these perceptions affect their preferences regarding representation. First, we ask whether citizens have meaningful preferences about the communities with whom their community shares representation. Second, to the extent that they do, are these preferences driven by geography or other factors such as partisanship, socioeconomic status (SES), race, and ethnicity?
Ultimately, we find that citizens do have meaningful preferences as to which of their neighboring communities they would prefer to share representation with. In both closed-ended and open-ended formats, the roots of these preferences are similar: Respondents care about socioeconomic and demographic similarity, as well as more generalized notions of shared community interests. Conversely, political considerations play a small role, if any, in shaping these preferences. We conclude by discussing the results and their implications regarding both the redistricting process specifically and normative themes in representation more generally.
Redistricting and Voter Preferences
Decisions regarding which communities will share representation are made during redistricting, a process known more for its partisan machinations than for its positive potential to improve the quality of representation. Although some evidence suggests that Americans have little desire for a more direct role in the policymaking process (Hibbing & Theiss-Morse, 2002), they may have more meaningful preferences regarding the design of institutions, particularly when it comes to representation and the structure of representative institutions. When it comes to districts and redistricting in particular, public opinion has traditionally been ignored (Gaines & Kuklinski, 2011), but recent studies have examined preferences regarding the size of U.S House constituencies (Frederick, 2008), the value of electoral competition (Brunell & Clarke, 2012), and the practice of majority–minority districting (Glaser, 2003; Tate, 2003).
Even to the extent that redistricting is a low salience issue to most citizens, individuals appear more than capable of expressing attitudes regarding their communities and regions, attitudes that are often counterintuitive and do not match political boundaries (Wong, Bowers, Williams, & Drake, 2012). In an increasing number of states, citizens have the opportunity to express these preferences in public redistricting hearings, and conflict in these hearings often revolve around “communities of interest,” (COI) which at its heart is a discussion about whether communities have enough in common for the same representative to effectively represent them all. This concept of communities of interest plays a major role in the literature on redistricting, either in describing what districts should look like, or in criticizing the disregard of such principles in blatant partisan gerrymanders. The term, however, suffers from a great deal of ambiguity (Arrington, 2010; Malone, 1997), only roughly denoting certain considerations pertaining to geography and intuitions about places that “belong together” in districts. Often, the term is simply taken to mean that districting plans should not split cities, counties, and other political subdivisions.
What is lacking, however, is attention to the question of how people define their communities and their interests. Would citizens prefer to share a district with a dissimilar neighboring community or a kindred community 50 miles away? Are common interests still structured by traditionally salient geographic features or have newer social factors become more salient? Although a few studies have devised strategies for identifying COI (Makse, 2012; Thompson, 2002) or the extent to which districting schemes respect COI (Stephanopoulos, 2012), none have relied on direct measures of public opinion.
Shedding light on voter preferences regarding shared representation has implications for other important debates regarding redistricting. In particular, the decision of drawing districts according to specific dimensions is normatively meaningful. Chambers (2007) argues that this decision—the choice of dimensions—can be just as much a form of “gerrymandering” as the manipulative distribution of citizens according to any one single dimension. The choice of dimensions subsumes questions pertaining to partisanship and race. For example, one important question is whether districts should be homogeneous in partisan terms (Brunell, 2008; Buchler, 2005) or whether competitive districts are preferable (Issacharoff, 2002; Pildes, 2006). Likewise, a healthy debate exists over both the desirability of majority–minority districting (Parker, 1990; Thernstrom, 1987) and its most efficient implementation (Cameron, Epstein, & O’Halloran, 1996). However, partisanship and race are but two dimensions according to which districts might be drawn, and citizens might, in fact, prefer that neither play a major role in the design of districting plans. Just as Brunell and Clarke (2012) and Tate (2003) shed light on voter preferences regarding districting along these two dimensions, we hope to elucidate voter preferences on the more foundational question of which dimensions should structure district creation in the first place. In other words, when combining individuals into districts, what dimensions or characteristics of communities do citizens believe should be most important?
Exploring Preferences Regarding Communities and Representation
To explore citizens’ preferences regarding shared representation, we proceed by asking two types of questions. First, we reduce the idea of shared representation to its simplest form and ask respondents to evaluate the suitability of a single person representing a pair of communities, one of which is their own. Second, we ask respondents to make more cognitively demanding evaluations of hypothetical district maps that include their own community; these maps allow us to mimic the complex trade-offs involved in redistricting while keeping respondents focused on the central question of shared representation.
Asking respondents to evaluate whether two communities can suitably share representation allows us to understand both the preferences and priorities that emerge when they are asked to think about their community and surrounding communities in an explicitly political context. A growing literature suggests that citizens successfully, if unconsciously, select communities that match their political preferences (Bishop & Cushing, 2008; Cho, Gimpel, & Hui, 2013; McDonald, 2011; but see Abrams & Fiorina, 2012), even if they express preferences for politically diverse communities (Taylor & Morin, 2008). Although the precise reasons for political self-selection are the subject of much debate (Williamson, 2008), theory has long predicted that citizens will sort themselves based on preferences for government outputs (Tiebout, 1956), and recent evidence has shown that local governments are responsive to constituency preferences on both spending and taxation (Einstein & Kogan, 2012).
At the same time, few would argue that citizen preferences regarding communities are purely or even primarily political. Characteristics of “desirable” neighborhoods often include quality schools, low crime, environmental quality, and a lack of poverty (Clark, Deurloo, & Dieleman, 2006; Parkes, Kearns, & Atkinson, 2002). A large body of literature also finds that the racial composition of neighborhoods matters, even after controlling for other factors (Emerson, Chai, & Yancey, 2001; Zubrinsky & Bobo, 1996).
By asking respondents to evaluate the suitability of shared representation, then, we can evaluate the ties between community preferences and preferences pertaining to representation. Insofar as the question of shared representation is an abstract “process” issue subject to little public discussion, we assume that such preferences will be latent. We do believe, however, that such queries will elicit meaningful and structured preferences among all but the least knowledgeable citizens. From such questions, we can understand which characteristics of communities are most salient in structuring these preferences.
However, while making these types of pairwise evaluations of communities is in some sense a building block for evaluating districts, the realities of redistricting are considerably more complex and multidimensional. By asking respondents to evaluate hypothetical district maps, we can better understand what is more or less salient when citizens think about their community, the surrounding communities, and the controversies over redistricting.
First, we build on the analysis of pairwise community evaluations by seeing whether they extend to district evaluations. If respondents prioritize socioeconomic similarity in evaluating the suitability of shared representation, does it follow that respondents will evaluate districts based on their socioeconomic homogeneity? Moreover, what types of positive and negative features of districts are most salient? One might be troubled by a particularly dissimilar community (either because of its size or because of the sheer degree of dissimilarity) or by the prevalence of many dissimilar communities.
Second, we can analyze the relative importance of these community evaluations with “traditional redistricting principles” and the realities of the redistricting process. How dissatisfied are voters with non-compact districts when the district contains a homogeneous swath of communities? How sensitive are respondents to district maps that cross “invisible lines” or fail to keep communities of interest intact? Moreover, as redistricting inevitably produces that some communities get the short end of the stick, how cognizant are citizens when a community (whether their own or another one) does not fit well in a district? By asking respondents to evaluate district maps that include their home and surrounding communities, then, we gain a more complete understanding of what types of districts elicit the most positive and negative reactions, and why.
Research Design
The data for this study come from an original survey of 340 Massachusetts residents conducted during the summer of 2012. Respondents were selected from a sampling frame of 2,820 Massachusetts residents using a clustered random sample of 15 zip codes throughout the state. The survey combined address-based sampling and an online survey (see also Messer & Dillman, 2011) to reach a sample of the general public. 1 Respondents were then invited, by mail, to participate in on an online survey regarding “living in Massachusetts.” Survey recipients were contacted a total of 3 times (an initial postcard followed by two recruitment letters). The total response rate for the survey was 12.0%, which resembles the typical rates for Internet-based surveys (Manfreda, Bosnjak, Berzelak, Haas, & Vehovar, 2008). The median completion time for the survey was 19 min.
The state of Massachusetts was selected for the study in part because it is effectively a one-party state with an entirely Democratic Congressional delegation. As many of our questions focused on the quality of representation, we sought to minimize the extent to which partisan preferences were a confounding factor in thinking about districts and representatives. Other studies (e.g., Doherty, 2013) have sought to separate attitudes toward specific representatives from the experimental task by removing the representative’s name or other information. However, insofar as our interest was in overall attitudes toward representation, and not merely evaluating representatives or their decisions, removing partisanship as a confounder was an even higher priority. Although this raises some concerns over the generalizability of the findings, we argue that internal validity is in this case the more important consideration. In some instances (e.g., conclusions regarding differences across partisans and/or independents), however, this design reduces our ability to draw strong conclusions.
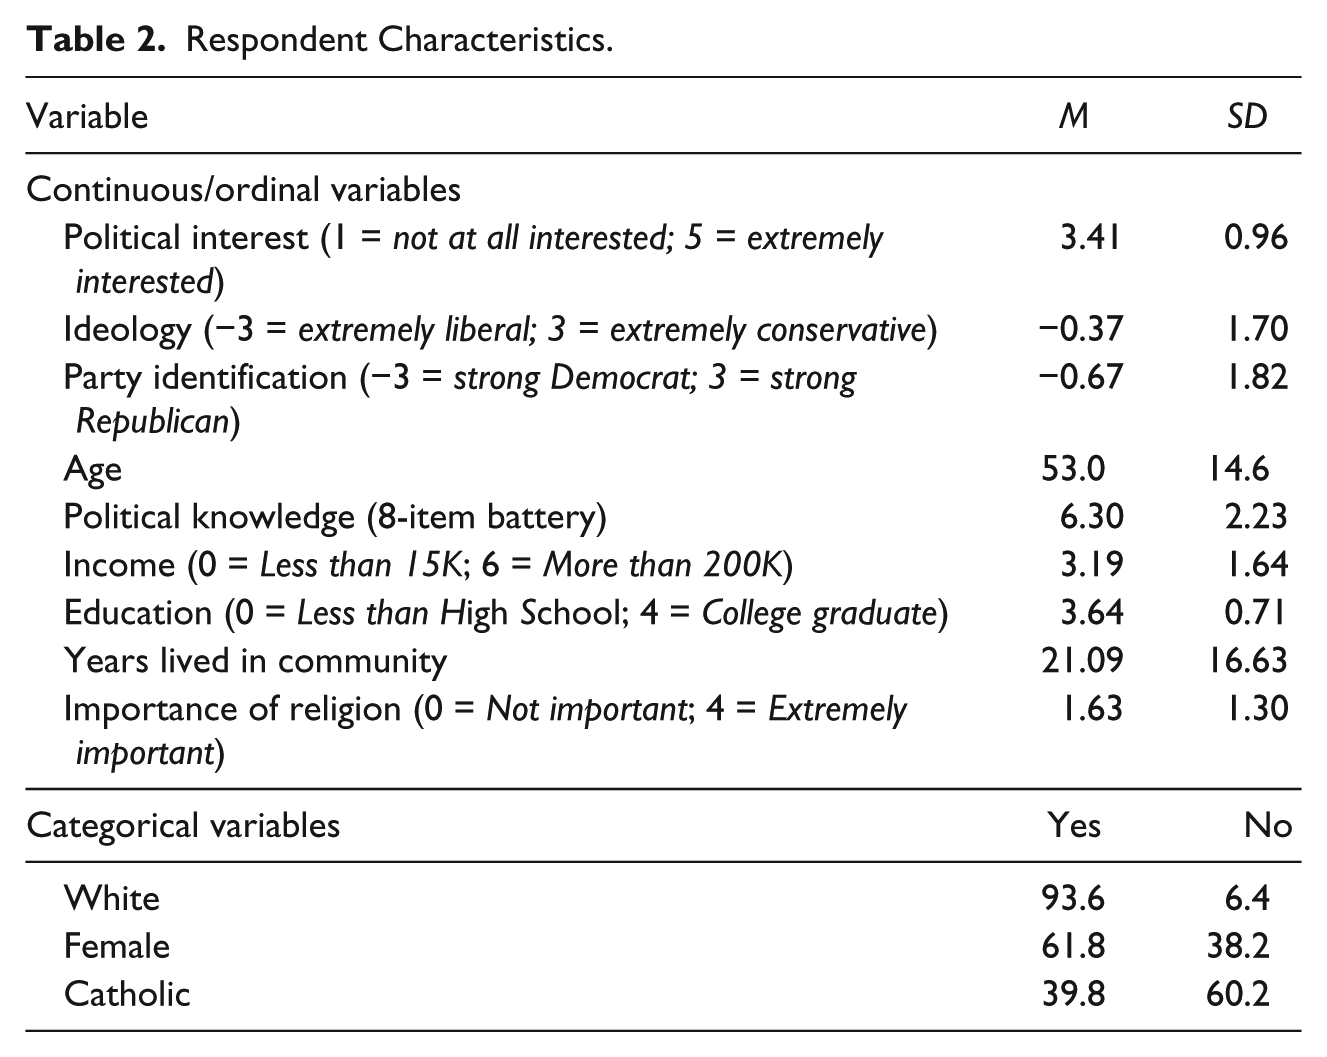
We determined the community in which each zip code was located, using the city or town, except in the cases of Boston and Springfield. Due to these cities’ sizes, we treated the neighborhood (based on city planning designations) as the community to ensure more homogeneity of community size. 2 Figure 1 is a map of the communities’ locations. The 15 communities, descriptions of which can be found in Table 1, mirror the geographic and demographic diversity of the state well, and include communities from 9 of the 10 Congressional districts in use for the 2002 to 2010 elections. Some basic characteristics of the sample can be found in Table 2. Although the survey clearly skews toward White, highly educated and less religious individuals, the sample is more representative in terms of income, political interest, ideology, and partisanship.
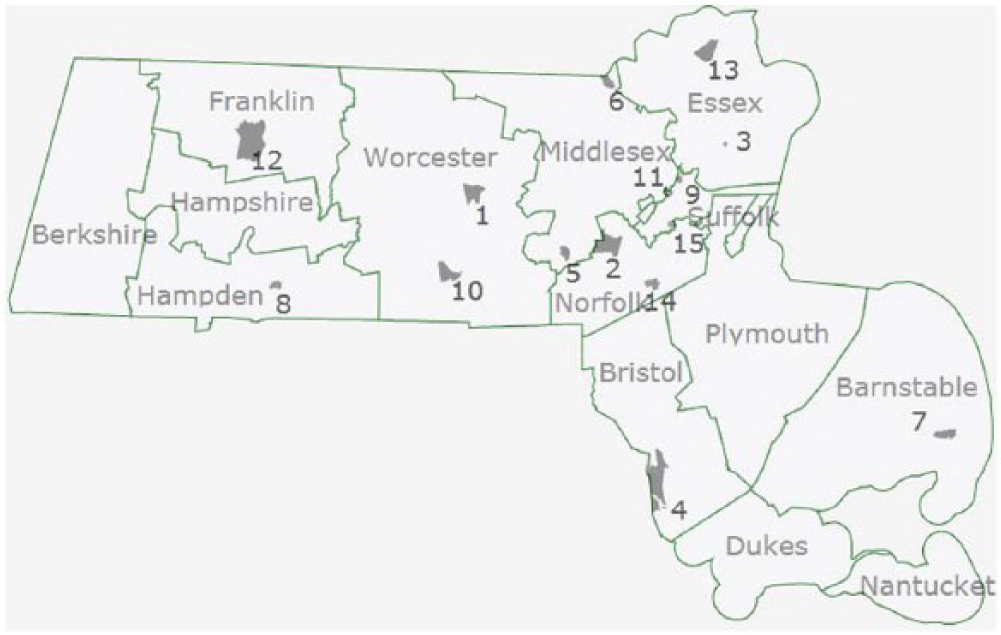
Location of communities in sample.
Massachusetts Communities in Sample.
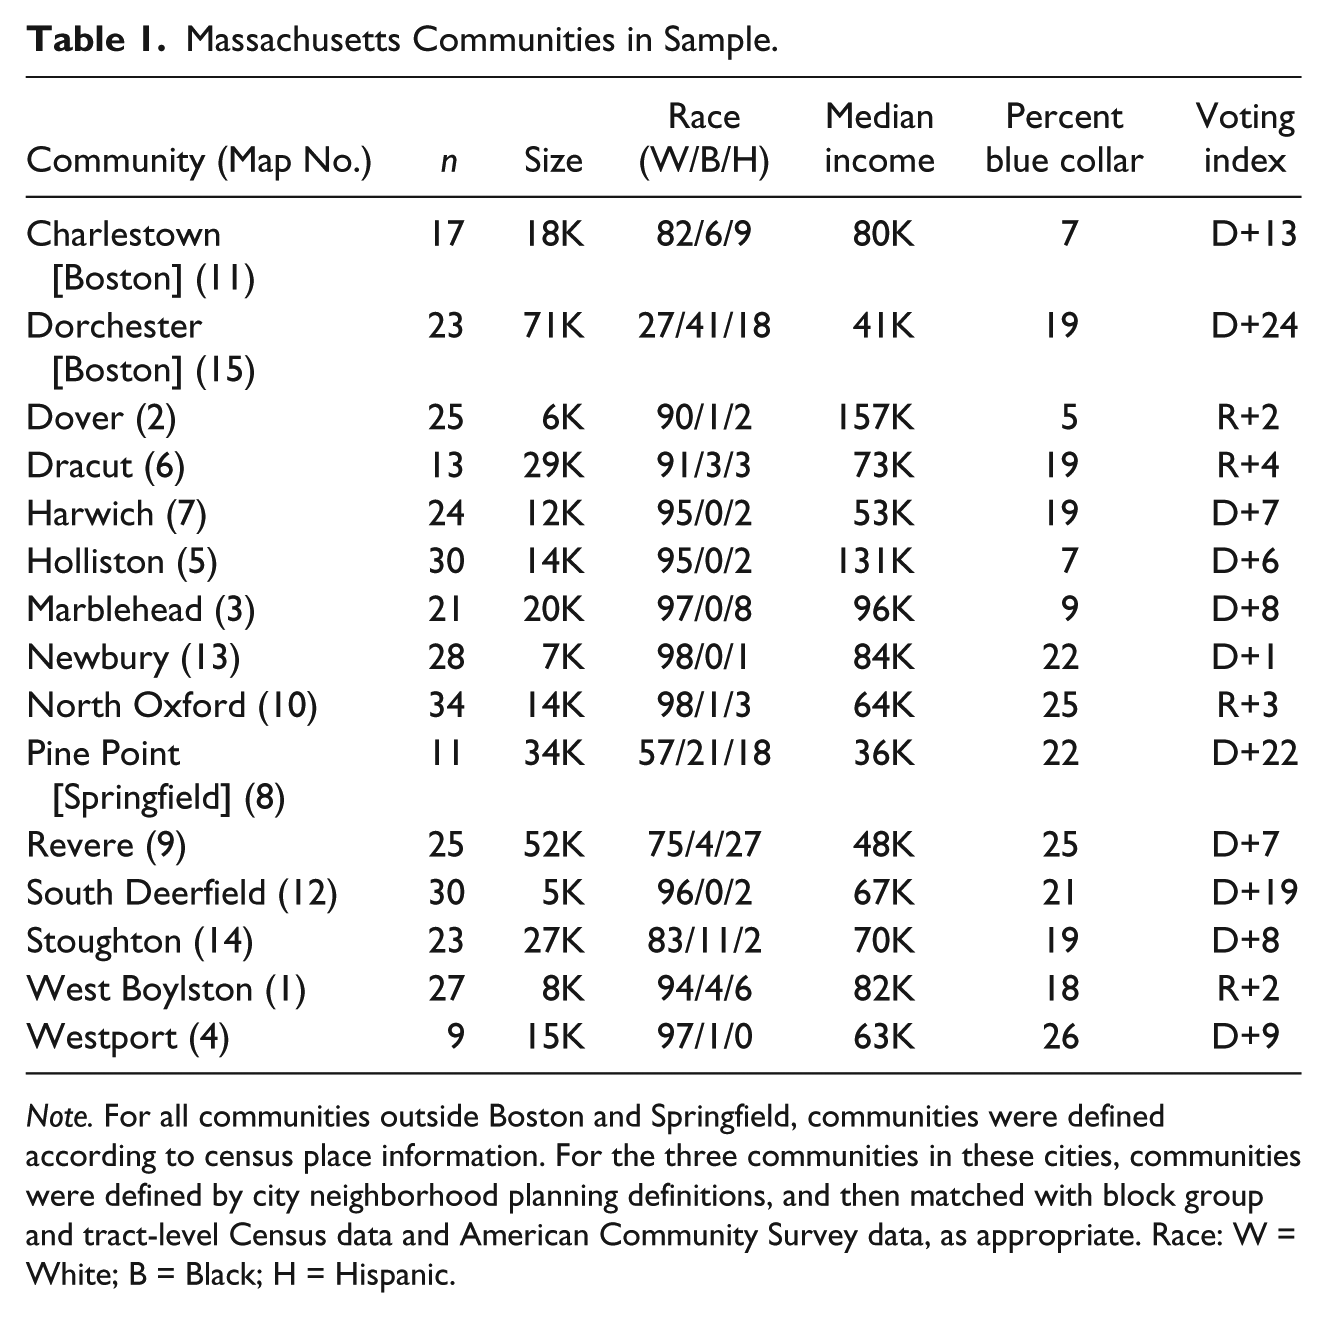
Note. For all communities outside Boston and Springfield, communities were defined according to census place information. For the three communities in these cities, communities were defined by city neighborhood planning definitions, and then matched with block group and tract-level Census data and American Community Survey data, as appropriate. Race: W = White; B = Black; H = Hispanic.
Respondent Characteristics.
The primary benefit of the clustered sample is that it permits the paired community questions and hypothetical maps to be specifically tailored to respondents in each community. Due to the time-intensive nature of these customizations and the need to prepare them prior to the survey going in the field, a simple random sample (or a sample with many distinct locations) would not have been feasible.
We also made the decision to present respondents with factual, familiar information about their actual communities in the experimental prompts. This results in heterogeneity of treatments, and the results discussed below acknowledge as much. Fictional or hypothetical information would have allowed us to produce more homogeneous treatments, but at the cost of external validity, in a context where we already have concerns about information accessibility and meaningfulness of the tasks. 3 By conducting the survey online, respondents were able to view the map stimuli in high-quality, color images.
Attitudes on Shared Representation
To understand attitudes regarding shared representation, we make use of two batteries of survey questions: The first asks respondents to judge the characteristics of five other communities, and the second asks respondents about sharing representation with each of those five communities. For each of 15 communities from which respondents were sampled, 4 adjacent or nearby communities (within a 10-mile radius) were deliberately selected to provide contrasts along certain dimensions (specifically: size, politics, racial composition, and SES), with the respondent’s community. One community was also included that closely matched the respondent’s community across all dimensions. Respondents were queried about these five communities one at a time, asking whether each community is similar to their own in terms of (a) wealth, (b) racial diversity, 4 (c) quality of schools, (d) amount of crime, (e) economic concerns, (f) politics, and (g) occupations and jobs. Although some respondents chose not to evaluate some individual communities (presumably due to lack of familiarity), 89.6% of the evaluations were completed, producing a total of 1,524 community evaluations.
After evaluating these communities, respondents were asked about sharing representation with each of these communities. Specifically, they were asked,
Thinking about each of the same five communities on the previous pages, imagine that a single politician represented both [YOUR COMMUNITY] and the following community in Congress. Without knowing anything else about the politician, how confident are you that the congressperson would be able to represent both communities well?
Overall, respondents were quite mixed in their levels of confidence regarding shared representation (M = 3.10, SD = 1.08 on a 5-point scale). Only 9.6% of respondent-community response pairs elicited a “very confident” response, with that number dropping to 7.4% outside of the very closely matched communities.
To more closely examine the sources of confidence in shared representation, we model it as a function of the seven perceived community similarity questions from the prior battery. We ask which dimensions of similarity or difference are most likely to affect an individual’s confidence in shared representation by including the respondent’s perception of similarity on each dimension as a separate predictor. We also control for a small number of demographic characteristics, including gender, the three characteristics that were least representative in the sample (race, education, and religiosity), as well as ideology and party identification. 5
The results of this model can be found in Model 1 of Table 3. Of the seven community characteristics, three have a statistically significant impact on confidence in shared representation: wealth, racial diversity, and occupations/jobs. 6 Similarities in partisanship, economic concerns, crime, and school quality have no independent impact. 7 Among the demographic variables, only gender and ideology have an impact, with women and more conservative individuals less likely to have confidence in shared representation.
Ordered Logit Estimates of Shared Representation Preferences.
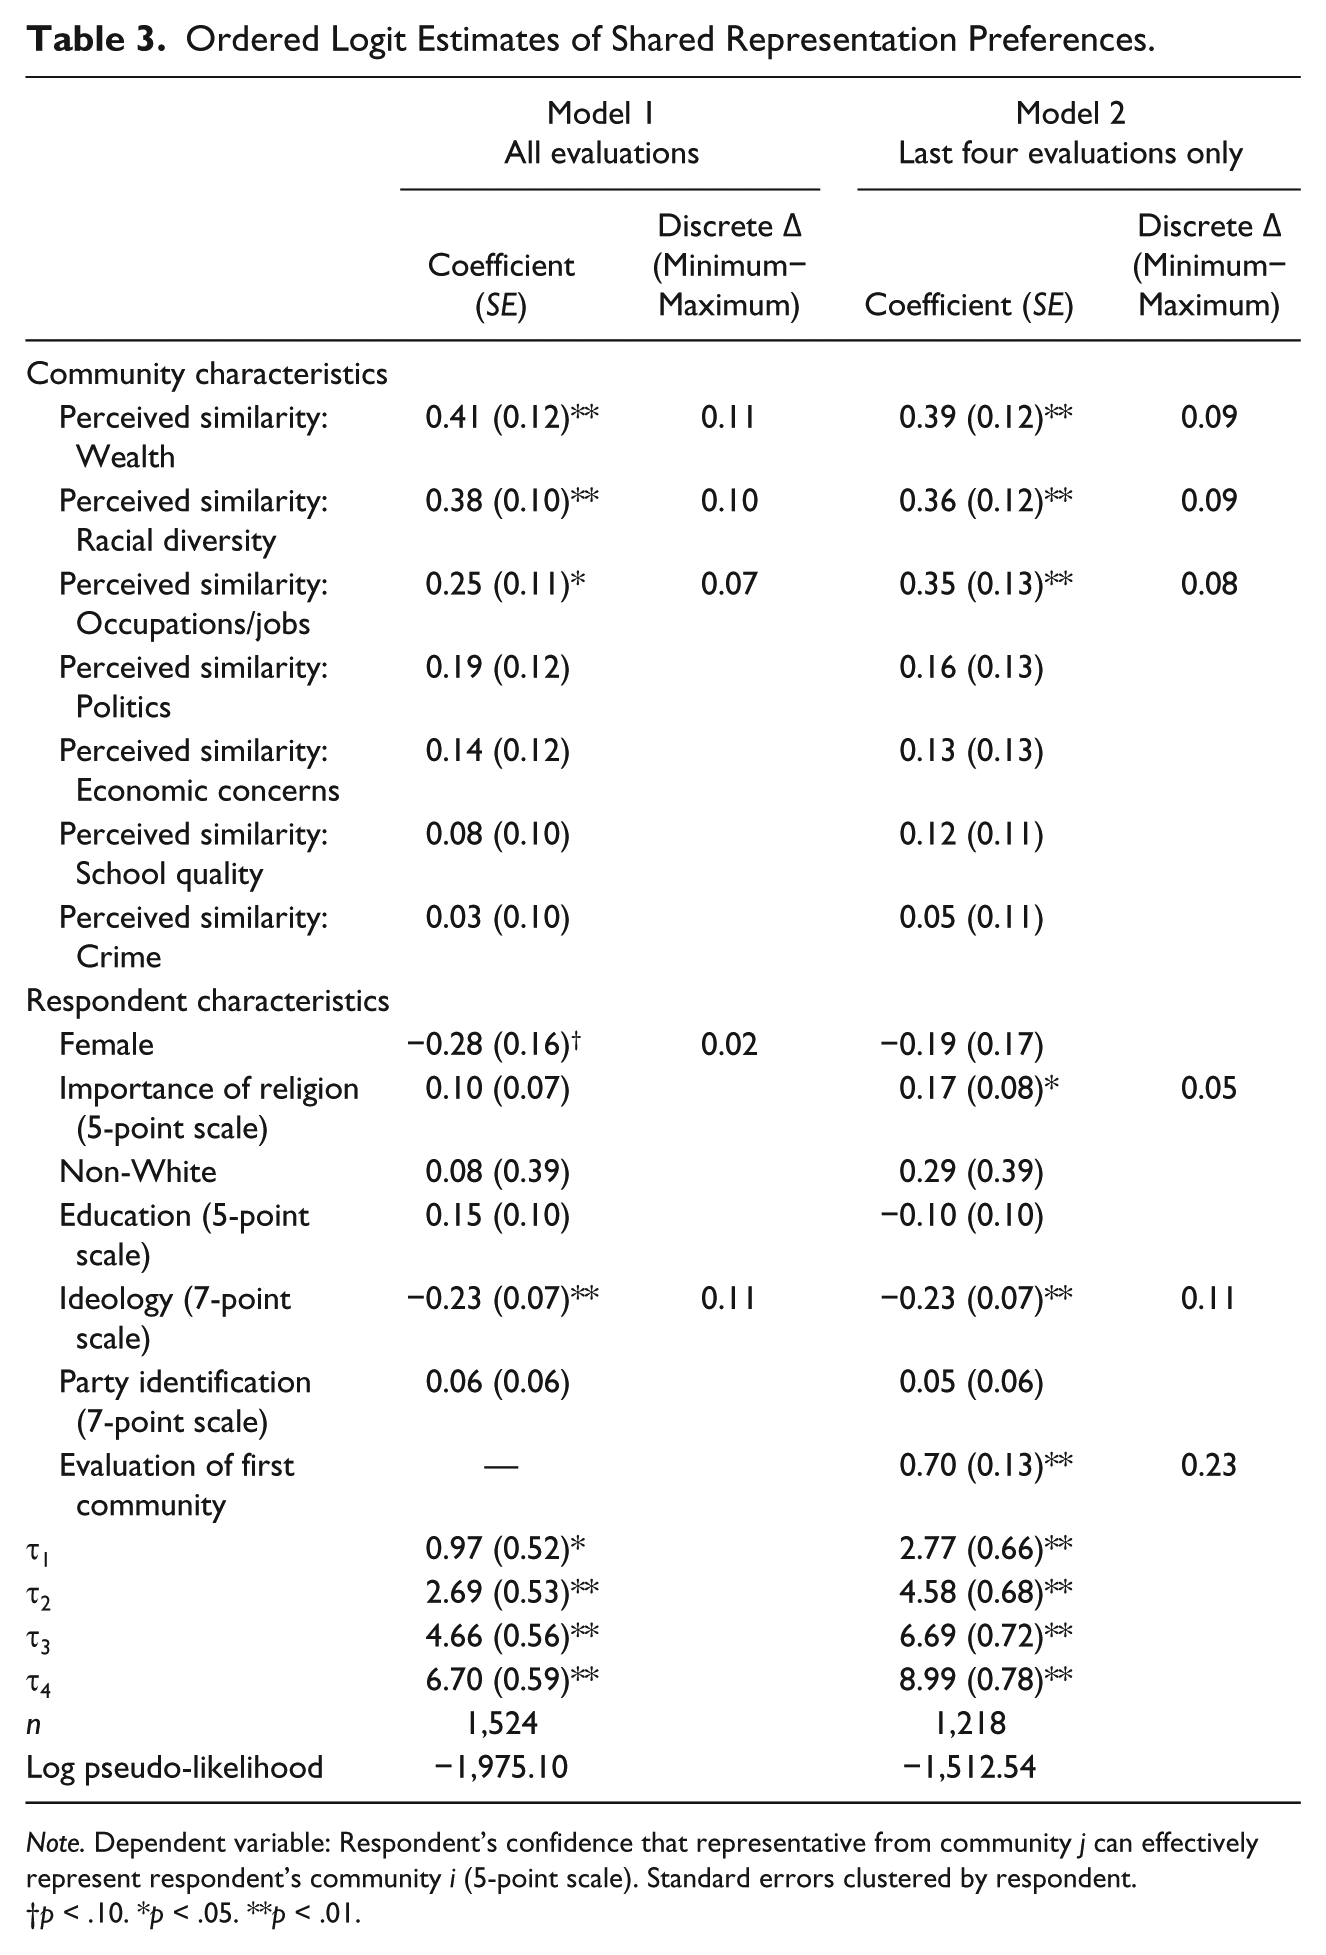
Note. Dependent variable: Respondent’s confidence that representative from community j can effectively represent respondent’s community i (5-point scale). Standard errors clustered by respondent.
p < .10. *p < .05. **p < .01.
To further describe the substantive impact of these variables, we compute the discrete change statistics for each of the significant coefficients. 8 Changing the comparison community from the least similar in terms of wealth to the most similar produces an average change in the probability of a higher response choice by .11; that is, the chance of greater confidence in shared representation would be about 11% higher on average for those who had their comparison community changed accordingly. For racial similarity and occupations/jobs similarity, the equivalent effect sizes are 10% and 7%, respectively.
As each respondent was asked to judge five communities, we account for the possibility that the models suffer from a positivity bias or satisficing behavior if the respondent’s first rating influences their rating of the four subsequent communities. The results of Model 2 in Table 3 examine only the evaluations of the second through fifth communities in the battery, including the respondent’s evaluation of the first community as an additional covariate. Although we do see evidence that earlier responses are correlated with later responses, the statistical and substantive conclusions remain consistent across the two models.
Given the explicitly political nature of the question, the fact that political similarity ranks as only the fourth most important community characteristic (and does not have a statistically significant effect) might be regarded as somewhat surprising. One possibility is that because of the one-party nature of Massachusetts politics, respondents are apt to prioritize other considerations. 9 If this were the case, we might expect that respondents in more competitive areas of the state would prioritize political similarity, whereas voters in solidly Democratic areas would prioritize other factors. However, even if we limit the sample to the more competitive parts of the state (D+10 or closer), political similarity runs a distant third behind wealth and racial similarity as predictors of confidence, so evidence of this pattern is extremely weak at best.
A second possibility is that partisans do prioritize political considerations but that independents do not, suppressing the overall impact of political similarity. Again, the evidence for this claim is scant. If we limit the sample only to partisans, respondents are more strongly driven by political similarity, but again, politics still ranks only third behind wealth and racial similarity.
Evaluating Hypothetical Districts
We next examine results from a survey experiment that asked respondents to evaluate similar concerns regarding representation, albeit in a more indirect manner. Respondents in each community were shown two maps of hypothetical State Senate district
10
maps that included their community and some number of surrounding communities.
11
After viewing each map, annotated with names of communities and their population sizes (see the online appendix for examples), respondents were asked,
We would like to show you some images of two hypothetical districts in which your community might be included. In the image below, the area shaded in yellow would be your district. Next to the map, you will find a list of some of the communities included in this district, and the number of people living in those communities. Please tell us whether you approve or disapprove of living in a district drawn in that manner.
In addition to this summative evaluation, respondents were asked to provide open-ended comments on why the proposed district would or would not make sense for their community. Although we might have concerns that these hypotheticals would produce non-attitudes, respondents were generally willing to express opinions. Overall, 85.0% of respondents offered a positive or negative evaluation (as opposed to “neutral”) of at least one of the two hypothetical districts, 12 whereas 74.5% of respondents made at least one open-ended comment regarding the hypothetical districts (the remainder left the question blank or wrote “no comment” or something similar).
The maps presented to each respondent were not only tailored to the respondent’s community, but were designed according to four conditions, each of which emphasized different trade-offs in districting, including compactness, respect for geographic boundaries, and the maintenance of “communities of interest.” These conditions were chosen both to more realistically mimic the realities of redistricting and to explore which map features respondents would find salient. Each respondent was randomly assigned maps from two of the four conditions. A fuller description of the creation of maps can be found in the online appendix.
In designing maps that satisfied each condition, we were constrained by the communities in question and the communities surrounding them; the priority was external validity and thus we presented respondents with realistic choices and avoided scenarios that were outlandish, unfamiliar, or completely lacking credibility. From an experimental design standpoint, the implication is that not all individuals in the same condition group received identical treatments. Insofar as features of the maps, such as compactness and community size heterogeneity, could not be recreated identically across communities, respondents in different communities may have been making somewhat different choices. Moreover, certain features of the maps could not be manipulated without violating the realism of the maps: Residents of the Berkshires, for example, had no opportunity to choose between maps that featured differing levels of urbanization or racial diversity. Although this hampers our ability to estimate quantities such as average treatment effects, in the context of this research question, we argue that the more important consideration is that people are making substantively meaningful and relatable choices.
The first experimental condition, which is treated as the baseline in the models that follow, is the respondent outlier condition, in which the respondent’s community was placed in a district mostly comprised of communities from another county. Although counties are widely viewed as inconsequential political units in Massachusetts politics, we expected that maps in this condition would elicit the most negative responses, insofar as county boundaries probably proxy for other “invisible lines” that are more politically meaningful.
In the second condition, the dominant community condition, one community in the district (other than the respondent’s) constituted more than half of the total population of the district, a fact made conspicuous by the annotation accompanying the map. Once again, we expected maps in this condition to elicit largely negative comments.
The third condition, the homogeneity first condition, presented respondents with a sometimes severe trade-off between community homogeneity and district compactness. Maps in this condition were either sprawling or oddly shaped, avoiding communities that differed significantly from the respondent’s community. Our expectations for this condition were mixed: Respondents might embrace the homogeneity or reject the proposed map as a clear gerrymander.
Finally, in the fourth condition, the other outlier condition, maps were designed to be highly homogeneous with the exception of one conspicuous outlier, which was different in terms of racial composition, SES, politics, or some combination thereof. Our expectation was that respondents would evaluate maps in this category most favorably, but that the conspicuous presence of an outlier community might elicit negative comments in the open-ended section. The four conditions were found to have well-balanced samples in terms of gender, racial composition, partisanship, ideology, education, and religiosity. Nonetheless, to remain consistent with the previous models, we present the following models with these demographic factors as controls.
In Model 3 of Table 4, we find that support for the hypothetical maps varies systematically across the four conditions: The first two conditions elicit considerably less support than the final two conditions, with the baseline (respondent outlier
Ordered Logit Estimates of Hypothetical Map Approval.
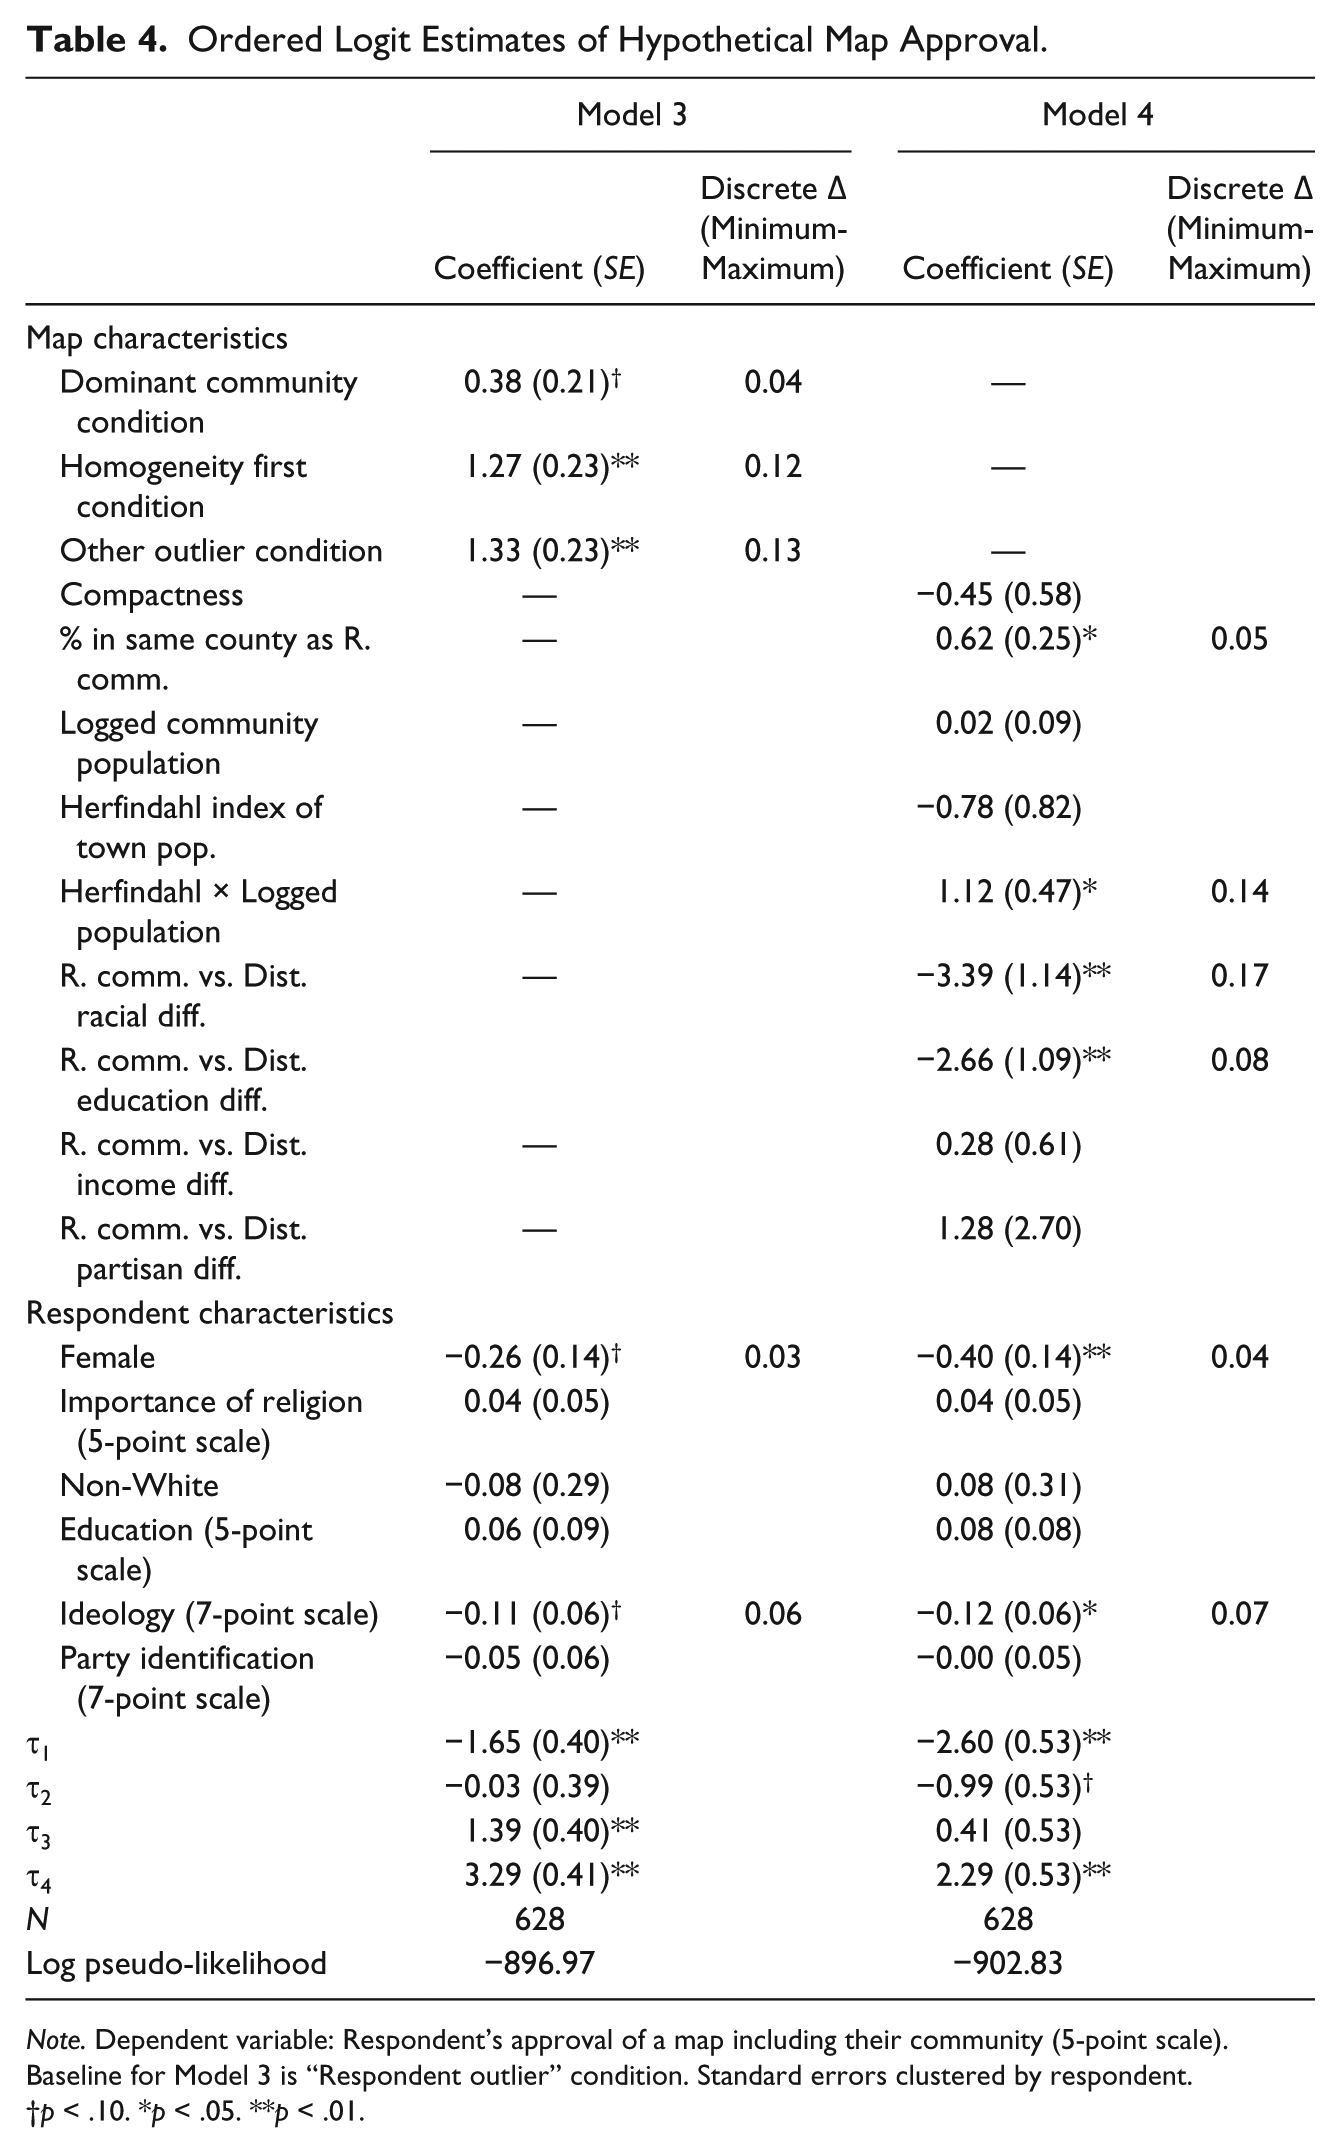
Note. Dependent variable: Respondent’s approval of a map including their community (5-point scale). Baseline for Model 3 is “Respondent outlier” condition. Standard errors clustered by respondent.
p < .10. *p < .05. **p < .01.
However, as previously noted, these four conditions mask considerable heterogeneity in the maps, we can be more precise about the impact of various map characteristics on respondent approval of the district by creating continuous measures that capture some of the characteristics that vary across treatments: district compactness, county boundaries, population concentration, and differences between the respondent’s community and the remainder of the district.
First, we examine the impact of district compactness on respondent approval. At first glance, it would seem that respondents are not overly bothered by oddly shaped districts, given the generally strong support for districts in the homogeneity first condition. However, we can be considerably more precise by creating a continuous measure of district compactness; specifically, we examine the isoperimetric quotient, a common measure of compactness (see, for example, Polsby & Popper, 1991) that compares the perimeter of the district shape with the perimeter of a circle with the same area. 15 Higher values indicate more compact districts; as intended, districts in the homogeneity first condition are less compact by this measure (M = 0.22, SD = 0.11) than districts under other conditions (M = 0.32, SD = 0.12).
Second, as the respondent outlier condition is constructed based on county boundaries, we calculate a continuous measure of the percentage of residents in the same county as the respondent—we expect that this measure will be positively associated with map approval. Districts in the respondent outlier condition have far fewer people in the same county (M = 0.36, SD = 0.26) compared with other conditions (M = 0.84, SD = 0.32).
Third, we consider the relative size of communities as this is relevant to the dominant community condition, and as all respondents were provided this information alongside each hypothetical map. Although the size of the respondent’s community is inexorably tied to their position in the district—smaller communities are, by definition, more likely to find themselves in a district with larger communities—we expect that the logged community population of the respondent’s town will be positively associated with evaluations of all maps.
However, the relative size of other communities in the district may matter too: Residents of smaller communities may prefer that the population be dispersed across other smaller communities rather than concentrated in one dominant community. To capture this intuition, we create a Herfindahl index of towns’ “market share” of population within the district. Higher values indicate higher levels of concentration in one or more large communities, whereas smaller values indicate the population is dispersed evenly across many communities. In the dominant community condition, the average Herfindahl index score is significantly larger (M = 0.49, SD = 0.20) than in other conditions (M = 0.24, SD = 0.11). We expect respondents to generally prefer dispersion, particularly in smaller communities—thus, we expect a negative impact of the Herfindahl index on district approval, and a positive interactive effect, with community size attenuating the main effect.
Finally, we include measures pertaining to district homogeneity across the dimensions discussed in the prior section. We calculate the similarity between the respondent’s community and the rest of the hypothetical district on four dimensions: income (logged median family income), education (percent of residents with college degrees), racial diversity (percent non-White), and politics (percent voting Democratic). 16
In Model 4 of Table 4, we examine the impact of these district characteristics on evaluations of the hypothetical districts. 17 First, we can see that district compactness has little impact on district evaluations. Respondents do, however, view districts more favorably when a larger percentage of the district is in the same county as the respondent’s community. Across the range of the dependent variable, the difference between a district entirely in the respondent’s county is associated with an average of a 5% change in the more favorable direction, compared with a district where the entire remainder is in a separate county.
Neither community size nor the Herfindahl index of population concentration has an effect on approval when each quantity is held at its mean. However, the positive coefficient on the interaction indicates that population concentration is judged more positively as the community size increases. Or perhaps, more meaningfully, concentration is seen as a negative district attribute by respondents in small communities. At the mean value of logged community size (population 15,800), the negative marginal effect of the Herfindahl index is not statistically significant. The point at which the marginal effect becomes significant is roughly when the population size is smaller than 12,000.
Turning to the measures of respondent community-district similarity, only racial similarity and educational similarity emerge as predictors of district approval 18 ; even though respondents voiced the importance of political and wealth similarity in the shared representation questions discussed above, we find no evidence that they (implicitly) factor in such information in evaluating districts. The substantive effect of racial and education similarity, however, are substantial. The maximum racial difference, for example, produces a 17% average change in the predicted probability of approval, averaged across the range of the dependent variable, compared with a district with the minimum racial difference. For educational differences, the corresponding number is 8%.
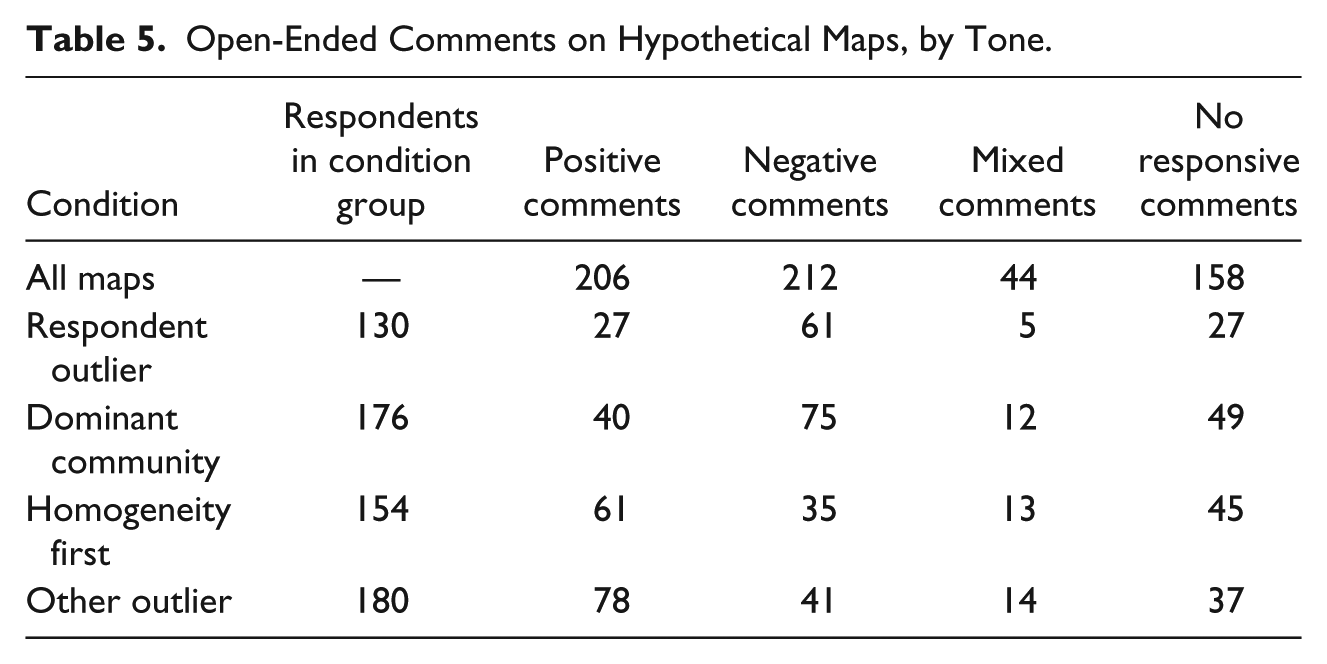
Turning to the open-ended response comments, we performed a content analysis of these responses to the hypothetical district maps. Comments were classified according to their tone (positive, negative, or mixed) and categorized according to the ideas referenced (e.g., comments regarding various types of similarities/differences, comments regarding shape, and generically positive/negative comments). 19 A small number of comments (approximately 8%) were classified as unresponsive. 20 Patterns regarding the tone of open-ended comments were similar to the scale measure examined in the previous analyses. As illustrated in Table 5, maps in the respondent outlier and dominant community conditions received many more negative comments, whereas maps in the homogeneity first and other outlier conditions received generally more positive comments.
Open-Ended Comments on Hypothetical Maps, by Tone.
In Table 6, we illustrate patterns in the substance of the open-ended comments. The largest number of comments pertains to regionalism within the state, and the extent to which hypothetical districts respect or divide such regions. In some cases, respondents made reference to counties, but far more frequently these comments referenced “invisible lines” (e.g., “The South Shore” or “Metrowest”). The second most common category was comments that pertained to issues and policy concerns (e.g., education, tourism) specific to one or more communities. Comments pertaining to SES were the third largest category, whereas comments regarding racial diversity were relatively rare. This pattern, which is the opposite of what we saw in the summative evaluations, may be due to a social desirability effect: Respondents may be commenting on SES similarities and differences when they really are thinking about differences in race and ethnicity.
Classification of Open-Ended Comments on Hypothetical Maps.
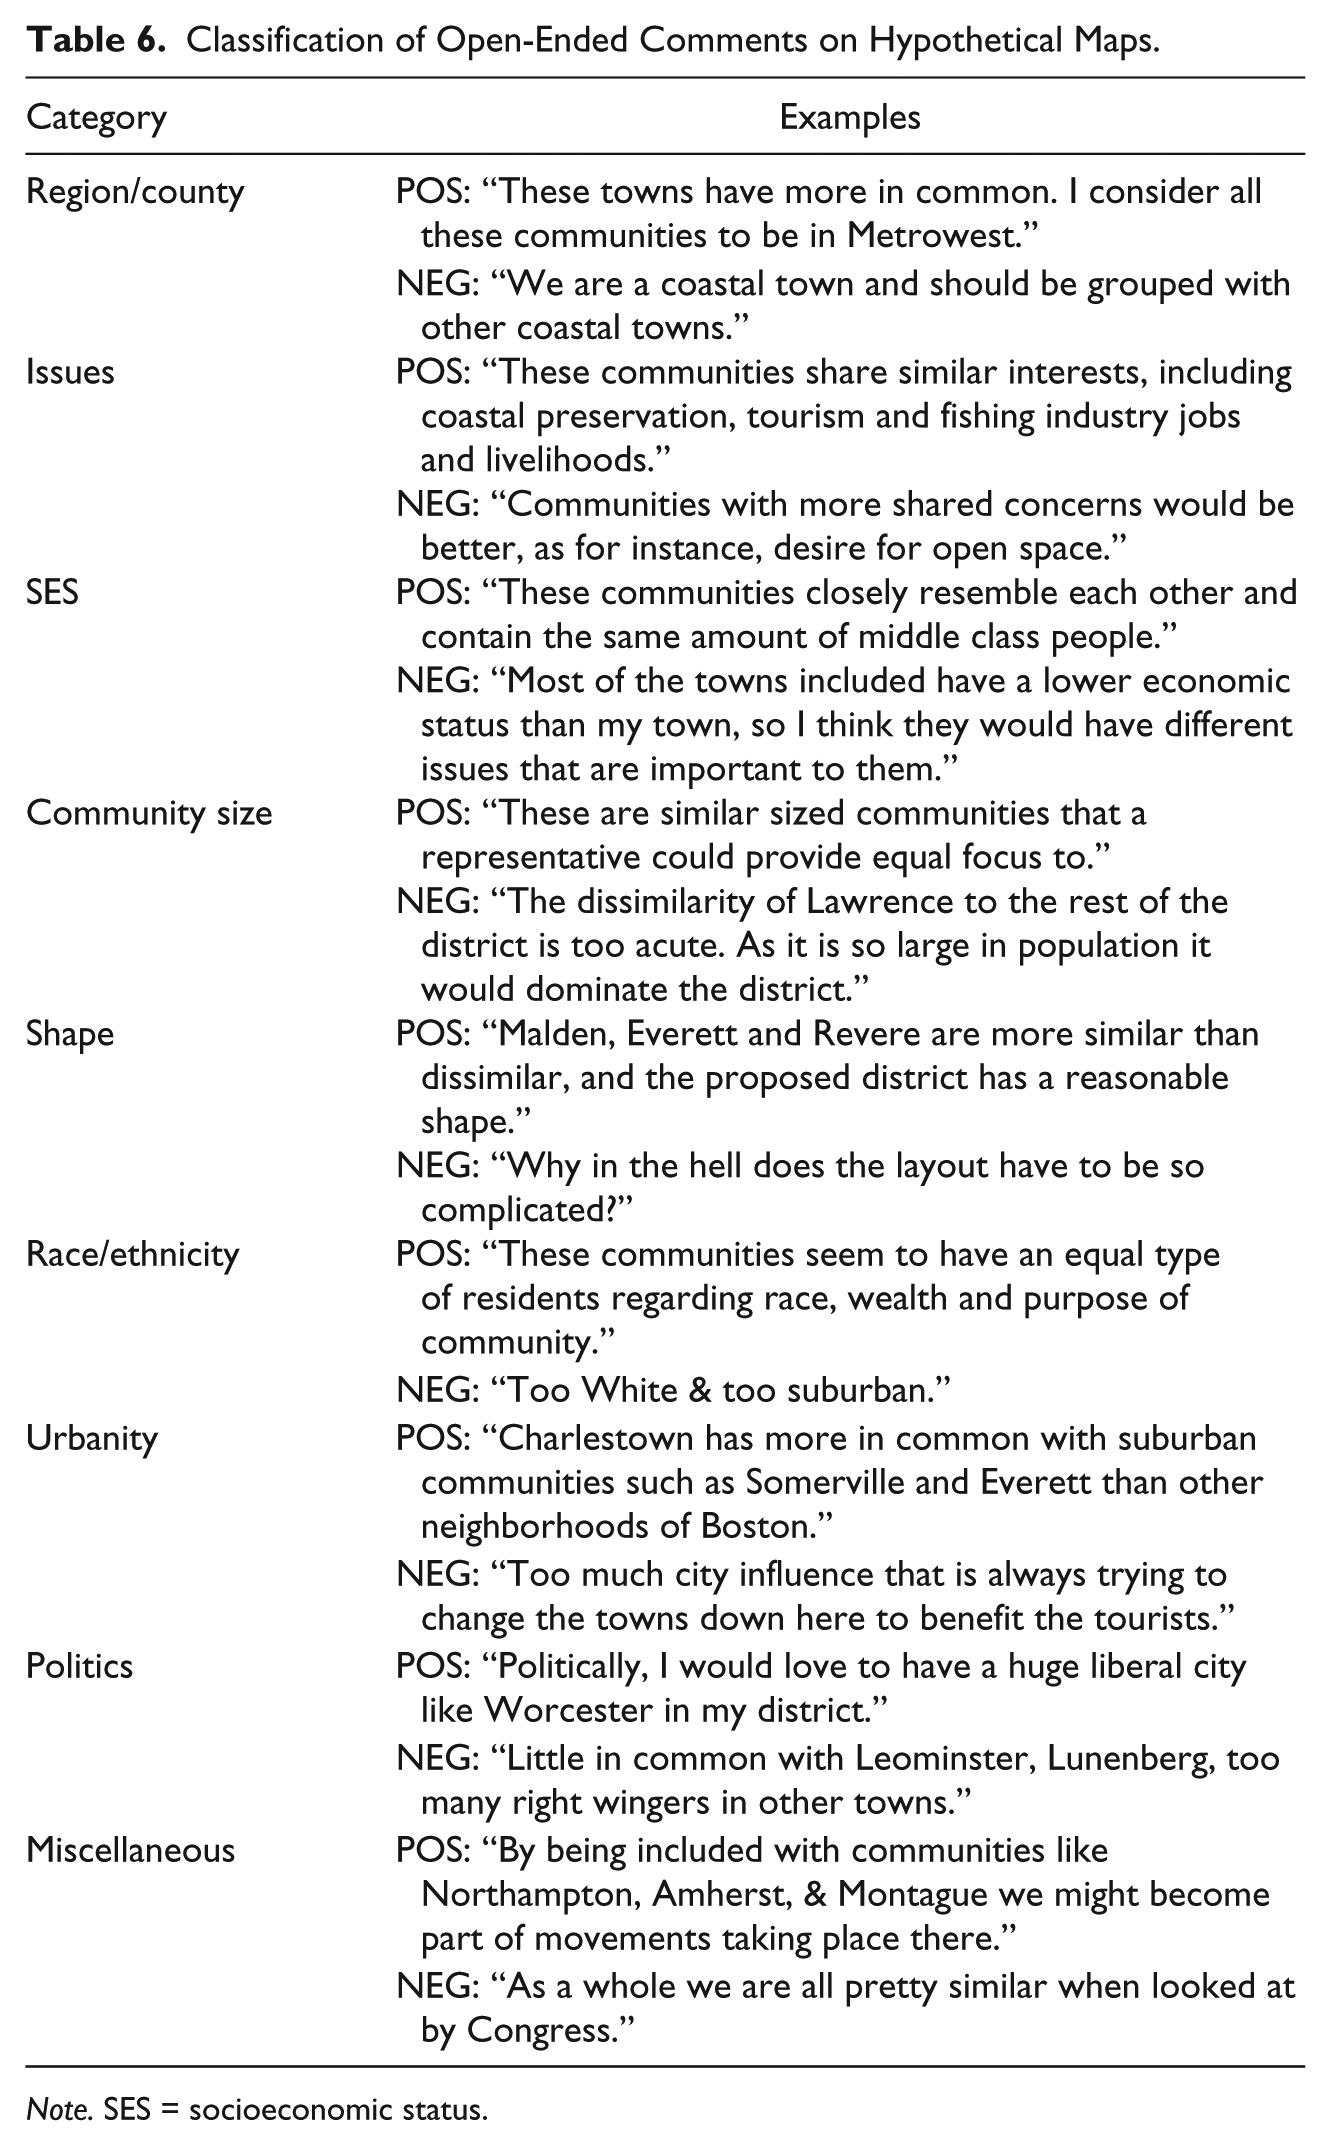
Note. SES = socioeconomic status.
Consistent with the quantitative analyses, very few comments made reference to partisan politics or ideology (and many of those that did were framed in terms of the respondent’s personal preferences, not the respondent’s community). Finally, as we found in the closed-ended response patterns, respondents were much more concerned with the relative size of communities in the district than they were with the shape of the district.
The substance and tone of the open-ended comments also varies predictably across the four conditions, as illustrated in both Tables 7 and 8. Comments regarding regionalism, mostly negative, were considerably more prevalent under the respondent outlier condition. Maps in the dominant community condition elicited many comments, usually negative, regarding community size and SES (because the larger community was usually a lower-income area, e.g., Worcester, Lawrence). Comments in the remaining two conditions more closely tracked the overall patterns.
Open-Ended Comments on Hypothetical Maps, by Category.
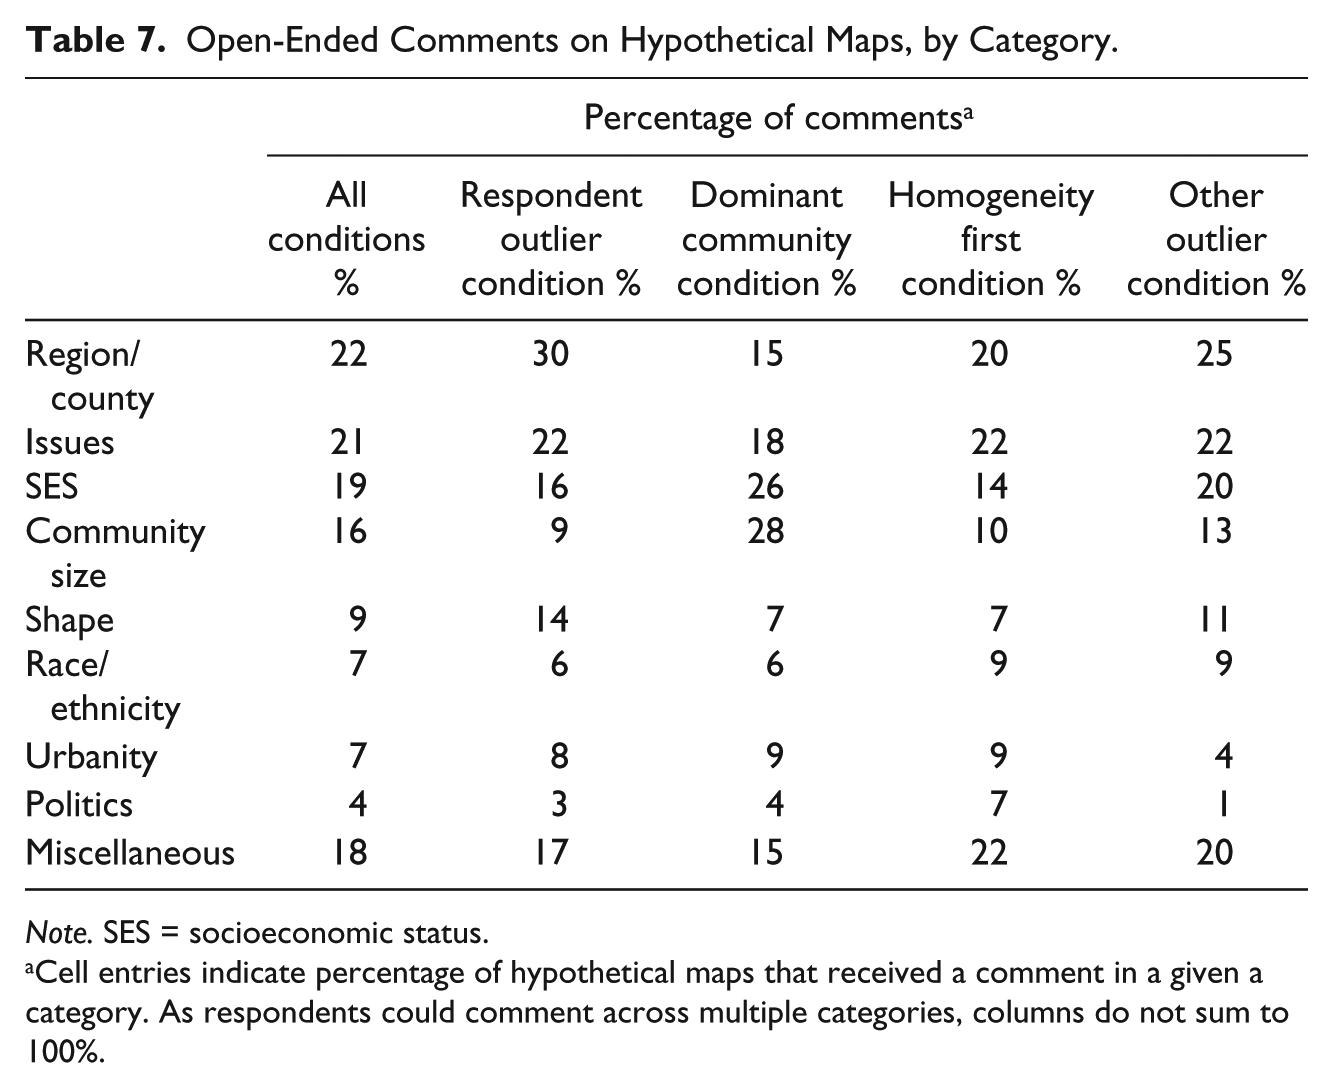
Note. SES = socioeconomic status.
Cell entries indicate percentage of hypothetical maps that received a comment in a given a category. As respondents could comment across multiple categories, columns do not sum to 100%.
Open-Ended Comments on Hypothetical Maps, by Category and Tone.
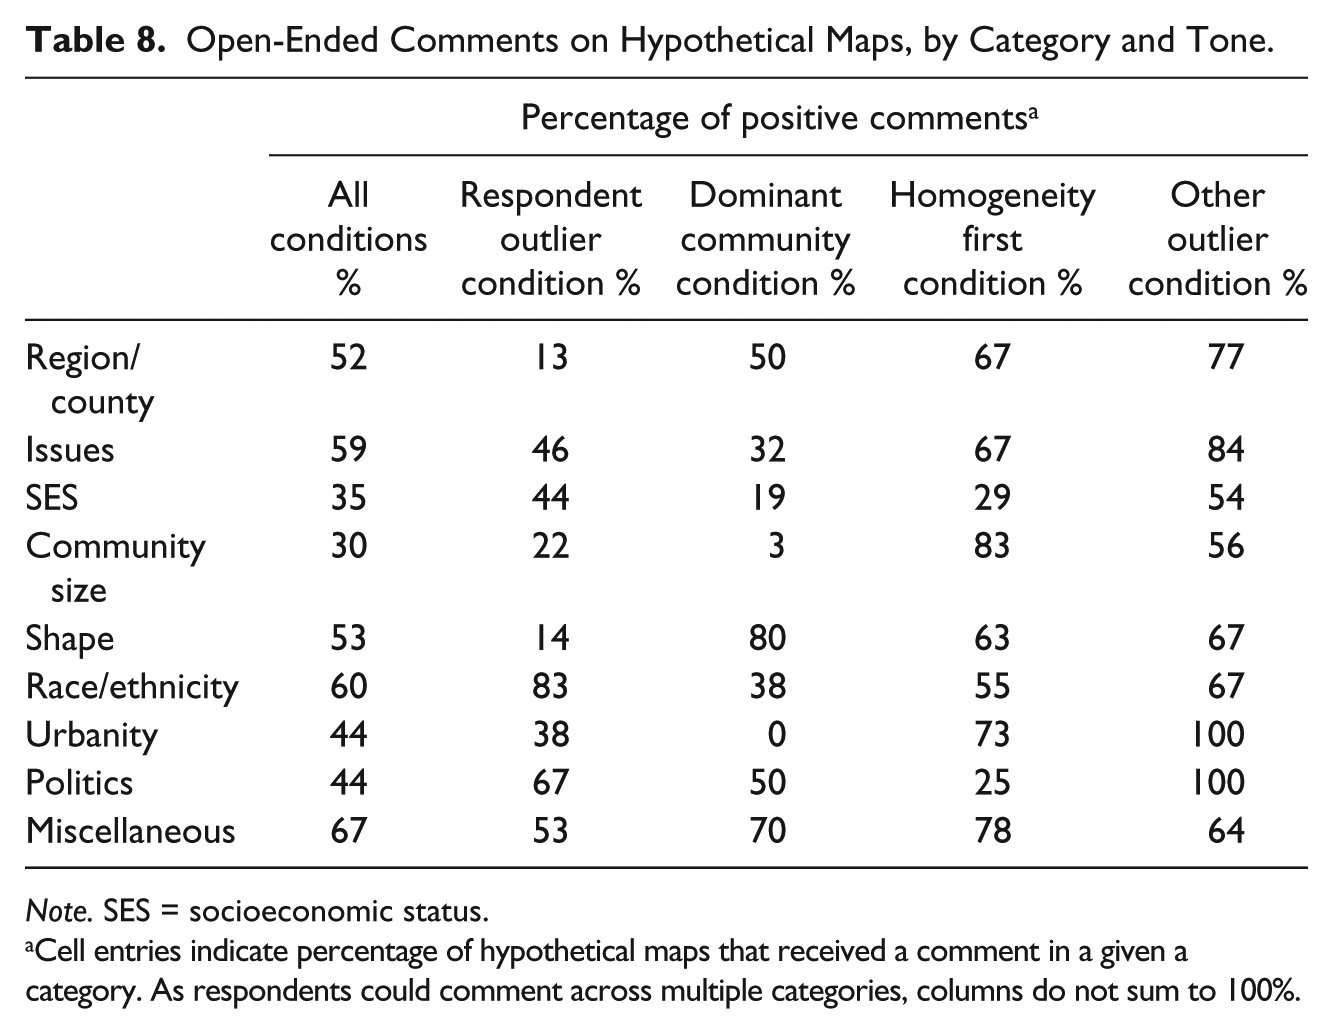
Note. SES = socioeconomic status.
Cell entries indicate percentage of hypothetical maps that received a comment in a given a category. As respondents could comment across multiple categories, columns do not sum to 100%.
Conclusion
In this article, we have attempted to understand how people view the issues surrounding redistricting and how they weigh various considerations such as homogeneity (of various forms), district composition, and political geography. Through our clustered sample and community-specific research design, we were able to confront individuals with highly customized questions and realistic hypotheticals, allowing for an expression of preferences that helps overcome the inherently abstract and technical questions pertaining to redistricting and representation. We find that the concept of shared representation does have a certain resonance with citizens and that people’s opinions about their community and the communities surrounding them affect whether they believe they should share the same representative.
These findings resonate with a burgeoning literature (e.g., Enos & Wise, 2012; Wong, 2007; Wong et al., 2012) which contends that understanding “spatial awareness” is both an important area of public opinion research in and of itself and a useful tool for understanding complex issues such as racial attitudes. In the particular case of redistricting, the spatial dimension is even more inexorably linked to the substantive subject matter. As redistricting is highly technical or poorly understood by many citizens, it is not surprising that some of the attitudes encountered in our study were underdeveloped, or that a significant minority of respondents, even in this relatively educated and politically knowledgeable sample, offered no opinions. Future work should continue to explore the interplay between spatial awareness, community preferences, and preferences regarding political institutions, particularly if patterns of residential sorting (whether intentional or unintentional) continue unabated.
To a certain extent, our findings call into question whether the proposals advanced by redistricting reformers reflect mass preferences regarding districting and shared representation. Citizens appear to value districts that respect “invisible lines” and in which communities share issue priorities. The socioeconomic and demographic homogeneity of districts is also highly valued, although there is some ambiguity, perhaps fueled by social desirability effects, as to the precise nature of these preferences. Finally, respondents are sensitive to community size, voicing concerns that their community’s voice will be heard and represented. In many ways, these results are consistent with anecdotal evidence from public redistricting hearings, in which many attendees often advance intuitive and issue-oriented conceptions about which communities belong together and which districts capture true communities of interest.
Conversely, individuals seem to care relatively little about the shape and political composition of districts. Even in the birthplace of Elbridge Gerry’s salamander, respondents rarely complained about the shape of proposed districts. Perhaps this reflects an understanding that odd district shapes, while often indicating the presence of a gerrymander, are not injurious to representation per se, particularly when other districting goals are at stake. Likewise, few respondents commented on the partisan or political composition of districts, and not a single respondent commented on competitiveness or the value thereof. It is possible that Massachusetts’ one-party politics suppresses such considerations, but it seems unlikely that these considerations would be absent in Massachusetts and highly important elsewhere. Although a lack of public concern with debates over partisan fairness and competition does not negate the normative stakes of these debates, the results herein do suggest that the public has a different set of concerns.
Footnotes
Acknowledgements
The authors thank Katherine Levine Einstein, Clayton Nall, and four anonymous reviewers for helpful comments on previous drafts of this article as well as Graham Wilson for related conversations.
Declaration of Conflicting Interests
The author(s) declared no potential conflicts of interest with respect to the research, authorship, and/or publication of this article.
Funding
The author(s) received no financial support for the research, authorship, and/or publication of this article.
Notes
Author Biographies
References
Supplementary Material
Please find the following supplemental material available below.
For Open Access articles published under a Creative Commons License, all supplemental material carries the same license as the article it is associated with.
For non-Open Access articles published, all supplemental material carries a non-exclusive license, and permission requests for re-use of supplemental material or any part of supplemental material shall be sent directly to the copyright owner as specified in the copyright notice associated with the article.