
Abstract
The Consumer Financial Protection Bureau (CFPB) came into being in response to the housing and debt crisis that accompanied the Great Recession. Created as a means for aggrieved consumers to bring problems to the attention of federal regulators empowered to fine banking and finance companies, the inflow of complaints began late in 2010 and has steadily risen in the years since. This research examines the variable emergence of complaints across 5 years, asking what types of constituencies are most likely to register grievances with the CFPB. The filing of complaints is mostly responsive to the presence of middle and upper income populations with mortgages, though contacts are also high from African American neighborhoods. Government contacting among lower income populations is facilitated by the presence of counseling and consultative services at the grassroots. Notably, legal aid services often present in lower and moderate income neighborhoods are associated with higher complaint frequency for several financial products. Through street-level consultative organizations, the gap in government service provision separating the affluent, who complain on their own, and less privileged, who do not know where to express their grievances, can be reduced.
Citizen interaction with government agencies is ideally a regular feature of democratic government (Gormley & Balla, 2012; Soss & Keiser, 2006; Zuckerman & West, 1985). Political participation is more than involvement in episodic elections. Citizen contacting of government is a means by which political and potentially insular bureaucratic institutions learn what people want from their leadership (Bimber, 1999; Peters, 2010; Verba et al., 1995; Rosenstone & Hansen, 1993; Verba & Nie, 1972). But from where, and from whom, do contacts with government agencies originate? Experts agree that insularity from public demands heightens the risk of undemocratic governance by bureaucracy. Bureaucracy is not generally thought to be especially responsive to the elected executives in charge of them, much less to petitions bubbling up from the grassroots (Kennedy, 2015). Even when accessible voice mechanisms are established to connect citizens to agencies, contact may originate only from select populations. If an agency only responds to demands channeled through a particular medium, but only a few citizens are aware that this voice mechanism exists, service will be directed only toward those few (Minkoff, 2016; Sharp, 1984). The demand for service may not reflect the need for service, pointing up the difference between needs, and needs that are voiced, potentially magnifying inequalities already present.
Citizen contact with public officials is known to be quite uneven across the population (Jones et al., 1977; Sharp, 1984; Thomas, 1982; Peterson, 1988; Zuckerman & West, 1985). The tendency for awareness to be a greater influence on contacting than need suggests that bureaucratic response may create greater political inequalities as the affluent and well-educated have the wherewithal to make demands, while the poor and less informed do not (Fountain, 2001; Hastings et al., 2014; Hero, 1986; Matthews & Hastings, 2013; Sharp, 1982, 1984). Over time, as awareness of contact processes increases, there may be more voicing of grievance as agency familiarity grows, but also contingent upon changing need. As the need for assistance increases, the search for avenues for redress is also likely to intensify, yielding a greater volume of contacts.
An important compensatory force for those with needs but less awareness lies in the mechanism of voice by referral of third parties. These are often consultative agents at the street-level, implanted in other governmental organizations, in non-profits, on the staffs of elected officials, or among private parties that find themselves in a consultative role (Jones, 1981; Scholz et al., 1991; Weissert, 1994). Staffs of state legislators and members of Congress are known to receive many complaints that they then refer on to other government agencies. Consumer organizations are also known to intercede between citizens and government and to act as a referral service for complaints. Non-profit agencies house expertise in the operation of government programs, and commonly depend upon government grants for their livelihood (Lipsky & Smith, 1989; Soss, 2002). Their understanding of policies and programs is beneficial to individuals seeking help with claims for government benefits, and channeling questions and complaints to the appropriate authorities.
One of the signal policy outcomes emerging from the Great Recession was the creation of the Consumer Financial Protection Bureau (CFPB). As part of the Dodd-Frank Wall Street Reform and Consumer Protection Act, it passed into law in 2010 following highly partisan votes in both chambers of Congress. The impetus for the creation of this independent agency was to protect consumers from abusive and predatory lending practices, not just by subprime lenders, but by mainstream financial institutions offering standard loan products. Momentum behind passage was greatly furthered by the home mortgage crisis that began in 2007, and continued for several years as foreclosure rates soared in parts of the country where housing prices had surged in the preceding years.
As a critical part of its legislative mandate, the CFPB instituted a consumer complaint procedure as a means of addressing problems and issues associated with a range of financial services: mortgages, credit cards, consumer loans, payday loans, debt collection practices, and credit reporting. The complaints are recorded in a publicly available database beginning in 2011. Each complaint record contains details about its geographic origin (by zip code), and the substantive concern of the complaint, usually identifying the firm against whom the grievance was reported, along with information about whether the complaint was resolved. This CFPB resource therefore offers an excellent opportunity to advance the research on citizen involvement with government, especially engagement with newly created regulatory agencies about which little is known.
From where are the complaints to the CFPB emerging, and how do these complaints vary across the nation? Are they reflective of measures of need, or do they instead reflect the uneven distribution of socioeconomic status? Although there is a lack of individual-specific information about individual complainants, available information does make it possible to examine a quite granular geography in order to draw inferences about who requests government service. This is among the first social science papers to merge zip code level contacting data to zip level socioeconomic information to study the factors associated with complaint flow across the entire nation (but see: Ayres et al., 2013; Littwin, 2014). Thorough examination of this information may facilitate understanding of complaint sources that are other than need based, as government services have often been found to be most responsive to the organized, or described as captured by those of higher socioeconomic status (Nivola, 1978). Here, the locations of counseling and advice-giving intermediaries are hypothesized to be an important font of complaints flowing upward. Net of measures of need and information, the presence of consultative and intercessory organizations such as legal aid offices, and housing counseling grantees, may be associated with larger local volumes of financially-related grievances.
Housing Finance, the Great Recession and the CFPB
Home ownership requires long-term debt finance for the vast majority of Americans. Since the 1930s, home purchase in the United States has been encouraged through a number of important policies enacted by the federal government, many of them operating through the mortgage finance system. Of primary importance, mortgage financing is stimulated by loan guarantees provided by a number of federal agencies, (e.g., USDA, VA, FHA, HUD). Under these arrangements, the risk of default on a loan is transferred, in large part, or entirely, to the U.S. government (Sellon, 1990; Weiss & Jones, 2017). Government sponsored enterprises (GSE’s) such as Fannie Mae (FNMA), Freddie Mac (FHLMC) and Ginnie Mae (GNMA) offer additional stimulus by providing guarantees in the secondary housing market for certain mortgage backed securities. The present mortgage finance system has unquestionably made homeownership a reality for many who could not otherwise afford it. Given the high cost of housing compared to other consumer purchases, government programs, taken together, have generated a much higher level of homeownership than the market would have provided otherwise.
New mortgage products introduced since banking deregulation in the 1980s have further extended housing investment to populations that would otherwise not be able to qualify for mortgages. 1 In the period running up to the Great Recession, lenders and borrowers sought increasing flexibility in mortgage finance options, advancing sub-prime loans to those with weak credit histories, and/or to those with little documentation (of past employment and income). These nonconventional instruments included adjustable rate mortgages with low introductory interest rates, zero downpayment loans, interest only loans, negative amortizing loans, and some others. Quite crucially, these lending innovations all carry substantially more risk of default than a conventional loan with a fixed interest rate, over a fixed term. Mortgagors start out with low equity and very high debt, and accumulate equity very slowly over the typical 30-year repayment term (Ryan et al., 2011). Payments are commonly burdensome relative to the homeowner’s monthly income (Green, 2008). By 2006, subprime loans amounted to more than 20% of all new mortgage originations, substantially exceeding 20% in some high growth locations in California, Florida, Nevada, Arizona and the Washington, DC and New York City metro areas (Acolin et al., 2017; Bostic & Lee, 2008; Ryan et al., 2011; Sanders, 2008, p. 257).
The episodic policy initiatives to extend credit to minority and lower income communities, and otherwise ensure their fair consideration in lending, were, in part, a compensatory action for the decades-old practice of redlining—a procedure in which banks would designate entire minority neighborhoods as unworthy of a range of financial services. Relying upon color-coded maps, banks and other lenders would restrict access to residential mortgage and other forms of credit based on the ethnic and racial composition of a locale (Hillier, 2003, 2005; Small & Pager, 2020, p. 56; Trounstine, 2018). Such practices have been faulted for denying racial minority populations access to the wealth accumulation through homeownership and small business creation that has benefitted so many non-minority families across generations (Blanchard et al., 2008; Krivo & Kaufman, 2004; Robb & Fairlie, 2007).
With the passage of the Community Reinvestment Act (CRA) in 1977, and amended in a 1994 follow-up, lenders have been required to expand loan offerings in the communities in which they operate, including low- and moderate-income neighborhoods (Ludwig et al., 2009). Under the mandate of the CRA, it is not enough for banks to simply open new branches in poor and minority neighborhoods. This measure imposes an affirmative obligation on banks to proactively serve these communities. New regulations issued by the Clinton Administration in 1995 required banks to extend credit even if applicants were of precarious means. Regulators, in turn, now monitor lending activity under the CRA to assess whether lenders are making appropriate effort. If they are not, a negative rating could adversely affect regulatory approval to expand branch operations, merge with another bank, or offer new services. CRA ratings are also made public by the FDIC. Understandably, the prospect of reputational damage or regulatory restriction from a negative rating serves to promote more lending activity in the underserved areas. The extension of lending to populations thought to have marginal borrowing capacity came with a substantial shift in risk to those borrowers, in the form of costly subprime credit products, some of them considered predatory (Hacker, 2019).
Notably, office-holders in both parties promoted steps to extend nonconventional mortgage lending into poor and minority neighborhoods (Shlay, 2006). Throughout his first term, George W. Bush urged the creation of an “ownership” society that would close the gap in homeownership rates separating minorities and non-minorities (Becker et al., 2008; Washington Times, 2004). With the bursting of the housing bubble in 2008, critics were quick to pin the blame on the Republican effort to promote home buying. For their part, Republicans and their allies blamed government’s excessive involvement in the housing market, including the CRA (Wallison & Pinto, 2012).
In spite of the substantial government role in shaping home purchase decisions, U.S. housing prices remain sensitive to market forces, surging in fast-growing areas where supply struggles to meet demand, remaining low or dropping in quiescent locations, where populations are stable or declining. This meant that the foreclosure crisis was not national, but regional. Locations that never experienced a boom, including broad swaths of the Midwest and Great Plains, did not see a foreclosure crisis. They may have suffered from other economic difficulties, such as the declining value of retirement and investment savings, but they were not overly-leveraged mortgagors. Similarly, the geographic distribution of subprime mortgages was quite uneven, reflecting the areas where housing prices soared in the presence of low and moderate income buyers. Nontraditional mortgage lending was also more concentrated in locations with higher percentages of black and Latino households (Acolin et al., 2017, pp. 398–402; Calem et al., 2004; Hwang et al., 2014; Hall et al., 2015).
The Consumer Financial Protection Bureau moved forward into law largely on the argument that it would provide a means for voicing complaints about unfair mortgage lending and foreclosure practices (Warren, 2008). On this basis we would expect that a large share of complaints to the CFPB would be from mortgage applicants and borrowers, though not all problems with consumer finance can be placed at the doorstep of mortgage banking. The widespread use of other financial and loan products across a broad spectrum of the population ensures that other complaints are sure to arise.
Other Financial Products and the CFPB
State governments regulate state-chartered banks, typically smaller “community” banks with fewer assets than the megabanks that dominate the market. Even so, if a bank wants to be part of the Federal Reserve System, or desires its deposits to be guaranteed by the FDIC, it must comply with federal regulations. Mortgage loans originating from state banks may be limited in certain ways, but there isn’t broad variation across states in lending rules. 2 Much wider variation exists in financial services over which state government is the main regulator. States have the sole authority to license and credential non-bank financial services providers, a powerful tool given that licenses to operate can be revoked. Each non-bank institution is required to obtain a certificate of authority from the state government prior to engaging in business. In this venue of activity, state governments regulate interest rates, the availability of subprime financial services (e.g., auto title loans, payday loans, pawn brokers), repayment terms, check cashing services, and the fees that can be charged to users of these services.
A never-ending challenge for financial services regulators is that the companies offering these products have proved to be quite adept at dodging state level regulations by creating loopholes and shrewd alternatives to locally prohibited practices. Interest charges are often disguised by the use of subterfuges to evade state usury laws. Sometimes the trickery is so complicated and technical that the usual borrower of small sums is defenseless even if (s)he is aware of the usurious nature of the transaction. In response, there have been persistent calls for a more aggressive federal role in monitoring and controlling non-bank financial services. The 2010 Dodd-Frank Act awarded the CFPB limited authority over the payday lending market, specifically to prohibit unfair, deceptive or abusive acts or practices. In 2016 it proposed restrictive new industry-wide rules to govern fringe finance. Meanwhile, the CFPB includes in its database complaints that go to credit card services, small consumer loans, short-term loans provided by payday and auto-title lenders, and debt collection and credit reporting practices.
Until the creation of the CFPB, responsibility for addressing consumer complaints about financial products fell to the Federal Trade Commission (FTC), created in 1938. The Dodd-Frank act requires that the two agencies work together on enforcement and rulemaking. With both agencies in place, questions are being raised about overlapping missions and duplication of effort. In practice, the difference seems to be that the FTC has a much broader mandate as a more general regulator of trade practices outside the area of financial services and consumer credit. The FTC’s expertise and jurisdiction is not limited to a single industry in its mission to protect consumers from fraud and deception. Nevertheless, the two agencies share jurisdiction over financial services and have worked out agreements for joint enforcement activity and rulemaking. Unquestionably, a large share of consumer complaints about abusive banking and credit practices will flow to the FTC rather than the CFPB until the latter builds a more visible regulatory profile, and a broader swath of the public comes to know of its existence.
The Role of Credit Counseling and Legal Aid
A significant burden on low and moderate income citizens, quite aside from their low earning power, is their low level of financial literacy. Their weak grasp of concepts relating to loan finance and repayment, coupled with their desperation, can easily bury them in debt. For instance, it is increasingly common to find poor households whose credit card balances exceed a year of household income (Bird et al., 1999). Whether these debts consist of unsecured credit card balances and small consumer loans, or secured debt in the form of high interest rate subprime mortgages, these balances can be impossible to pay off as they accumulate. The problem in these communities is not simply greater debt burdens, but the amounts involved relative to income. The level of debt becomes impossible or nearly impossible to service. The results are predictable in destroyed credit, the greater occurrence of personal bankruptcy and foreclosure, car repossession, collection lawsuits and harassment by debt collection agencies, to say nothing of the health problems and emotional distress brought on by poor money management (Drentea & Lavrakas, 2000; Loonin & Renuart, 2007, pp. 168–169; Taylor et al., 2007).
The psychological and social problems associated with personal indebtedness are many and well-recognized. In response, private entities, governments and non-profit organizations have long supported credit counseling, housing counseling and legal aid offices accessible to low and moderate income citizens. As a form of credit counseling, mortgage default counseling is widely believed to have helped homeowners at all income levels navigate their way through troubled times, counseling them on how they should prioritize payments, access other public benefits and communicate with lenders (Collins & Schmeiser, 2013). Free and low cost counseling services are especially important for lower income householders whose employers may offer few benefits, and little advice on how to save and plan. Though programs vary widely, there is a body of academic literature concluding that these services can make a positive difference in financial well-being for many participants even after controlling for self-selection into counseling programs at the start (Elliehausen et al., 2007; Hembre et al., 2020; Hirad & Zorn, 2001; Li et al., 2016; Mayer & Temkin, 2016; Russell et al., 2014; U.S. Financial Literacy and Education Commission, 2006). More to the point of this research, counselors often take action on behalf of clients, including registering complaints with government agencies. They also give specific instruction to clients on how they can access websites and forms for filing complaints, asking questions, and seeking corrective actions. This know-how may not amount to a large substantive gain in financial literacy, but it could still prove to be helpful to resolving a tangible debt or credit problem, thereby providing relief.
Certainly a longstanding source of legal counsel for low and moderate income communities are local legal aid offices served by pro bono hours donated by lawyers and local law firms and also garnering funding from the Legal Services Corporation, created by Congress in 1974. 3 Though greatly understaffed and underfunded relative to their caseload, legal aid offices perform an important service not just in criminal cases, but also in myriad types of routine civil cases (Lawrence, 2014). Routine difficulties arise daily that require legal consultation, including employment; benefits and wages; school; tenant eviction cases; consumer complaints; insurance; government benefits; personal finance; and child care and custody arrangements (Sandefur, 2015). Most of these situations will never find their way to a courtroom, and some may not strictly require an attorney’s advice, but legal aid does provide a measure of qualified legal access and representation for the select cases that are addressed. Hard choices are made, however, about what cases are taken up, and controversy surrounds the allocation of scarce resources. Though beset by political opposition since its creation, the Legal Services Corporation now seems well-entrenched part of the welfare bureaucracy. On account of longevity and habits of outreach, low-income minority populations have also come to know of the existence of legal aid offices as a means for obtaining counsel.
Data and Research Hypotheses
CFPB Complaints
The dependent variable in this research is the number of complaints flowing to the CFPB by zip code and year and subject of the complaint. The data base organizes complaints by financial product (e.g., mortgage loan, consumer loan), subproduct (e.g., adjustable rate mortgage, installment loan) and subissue (e.g., billing dispute, foreclosure, debt repayment) The years covered by the data are 2012 to 2016. Because complaints remain so few on some subjects within regulatory jurisdiction, we focus on complaints that arise with high frequency in the data: those pertaining to mortgage lending; those that concern debt collection and debt collectors; questions about credit reporting; and complaints arising about consumer loans and credit cards. There are several other product categories that the CFPB has added through the first few years: student loans, payday loans, money transfers, and prepaid money cards, but at this point these groupings contain fewer complaints and generate little cross-sectional variation when observed at the zip code level. A frequency count of the major complaint categories appears in Table 1 for the years of data collection (for descriptive statistics, see also Appendix Table A1).
Frequency of Complaints to the CFPB by Product and Year, 2012–2016.
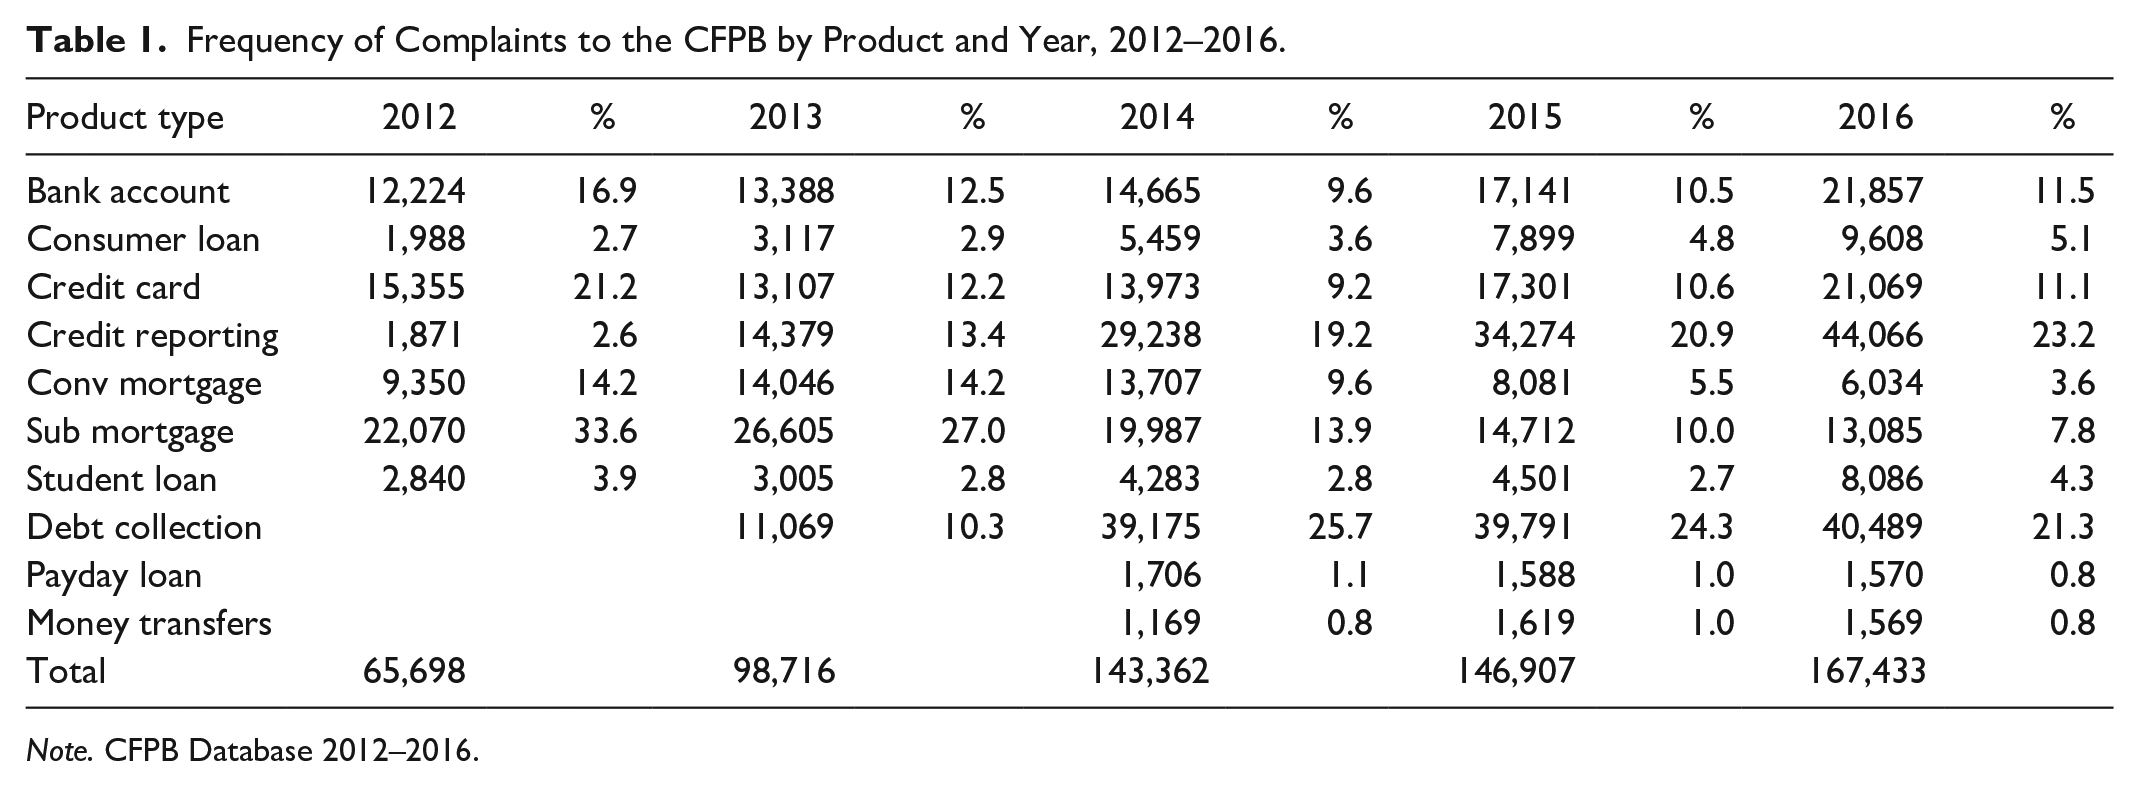
Note. CFPB Database 2012–2016.
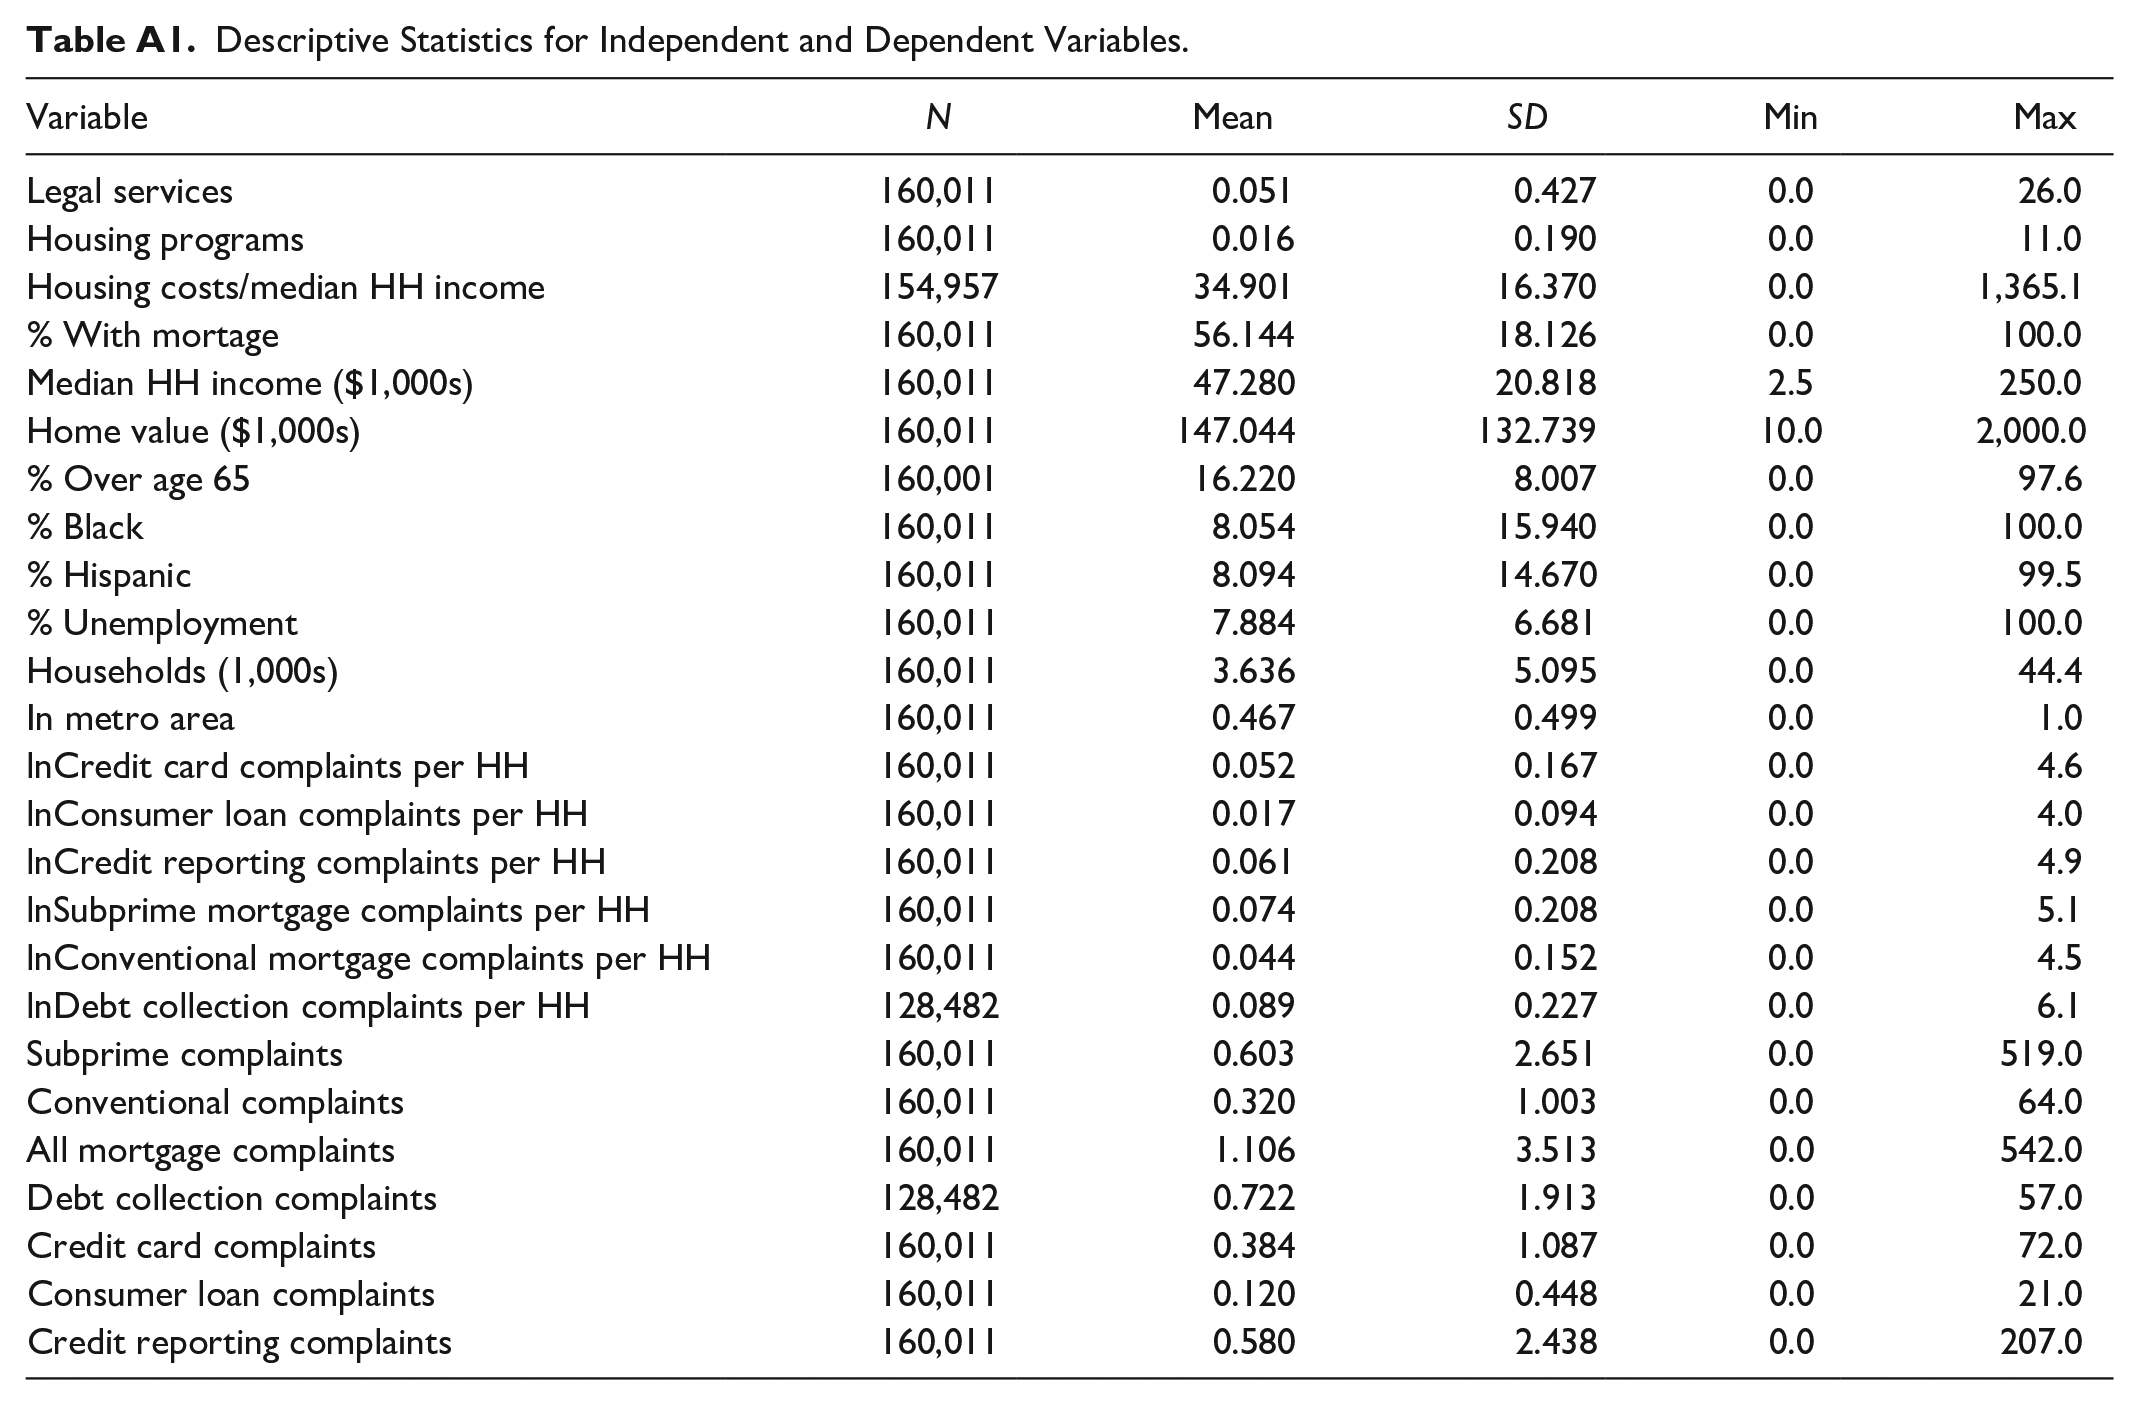
Descriptive Statistics for Independent and Dependent Variables.
Mortgages, Credit Reporting and Debt Collection are the largest complaint categories by volume, with Credit Cards and Bank Accounts close behind. Conventional mortgages have become a smaller percentage of the total complaints, however, dropping from 14.2 in 2012 to 3.6 by 2016. The largest share of the mortgage complaints concerned the threat of foreclosure. For debt collection, beginning in 2013, the modal complaint was about repeated harassment by collections agencies for debts that the complainant disputed owing. For credit cards, the major complaint was about billing, but closing credit card accounts was also a frequent issue as lenders resist efforts to close out accounts that have been regularly utilized. As for credit reporting, predictably, the modal complaint was about faulty information listed on consumers’ credit reports, with more than 70 of complaints going to this issue. For consumer loans, which include auto loans and leasing, the most frequent issue is managing the loan or lease, and making the payments. Standard bank accounts are problematic for consumers with respect to basic account operation; that is, opening and closing, and the age old problem of insufficient funds and associated penalties. Complaints about student loans inevitably concerned inability to pay as well as difficulties dealing with the lender/servicer—most likely about payments.
Notably, there were few complaints about obtaining a loan, or securing credit—this is easy, probably to no one’s surprise. The consumer disputes arise upon repayment and the quality of service provided by the lender to the consumer once a loan is obtained. In summary, after a few years, the CFPB data seem to approximately reflect the kinds of problems consumers are having with the financial system, just as Warren (2008) predicted. As the economy improved, total mortgage complaints (conventional and subprime) diminished as a percentage of the total, but debt collection complaints soared. Credit reporting issues also increased steeply, according to Table 1.
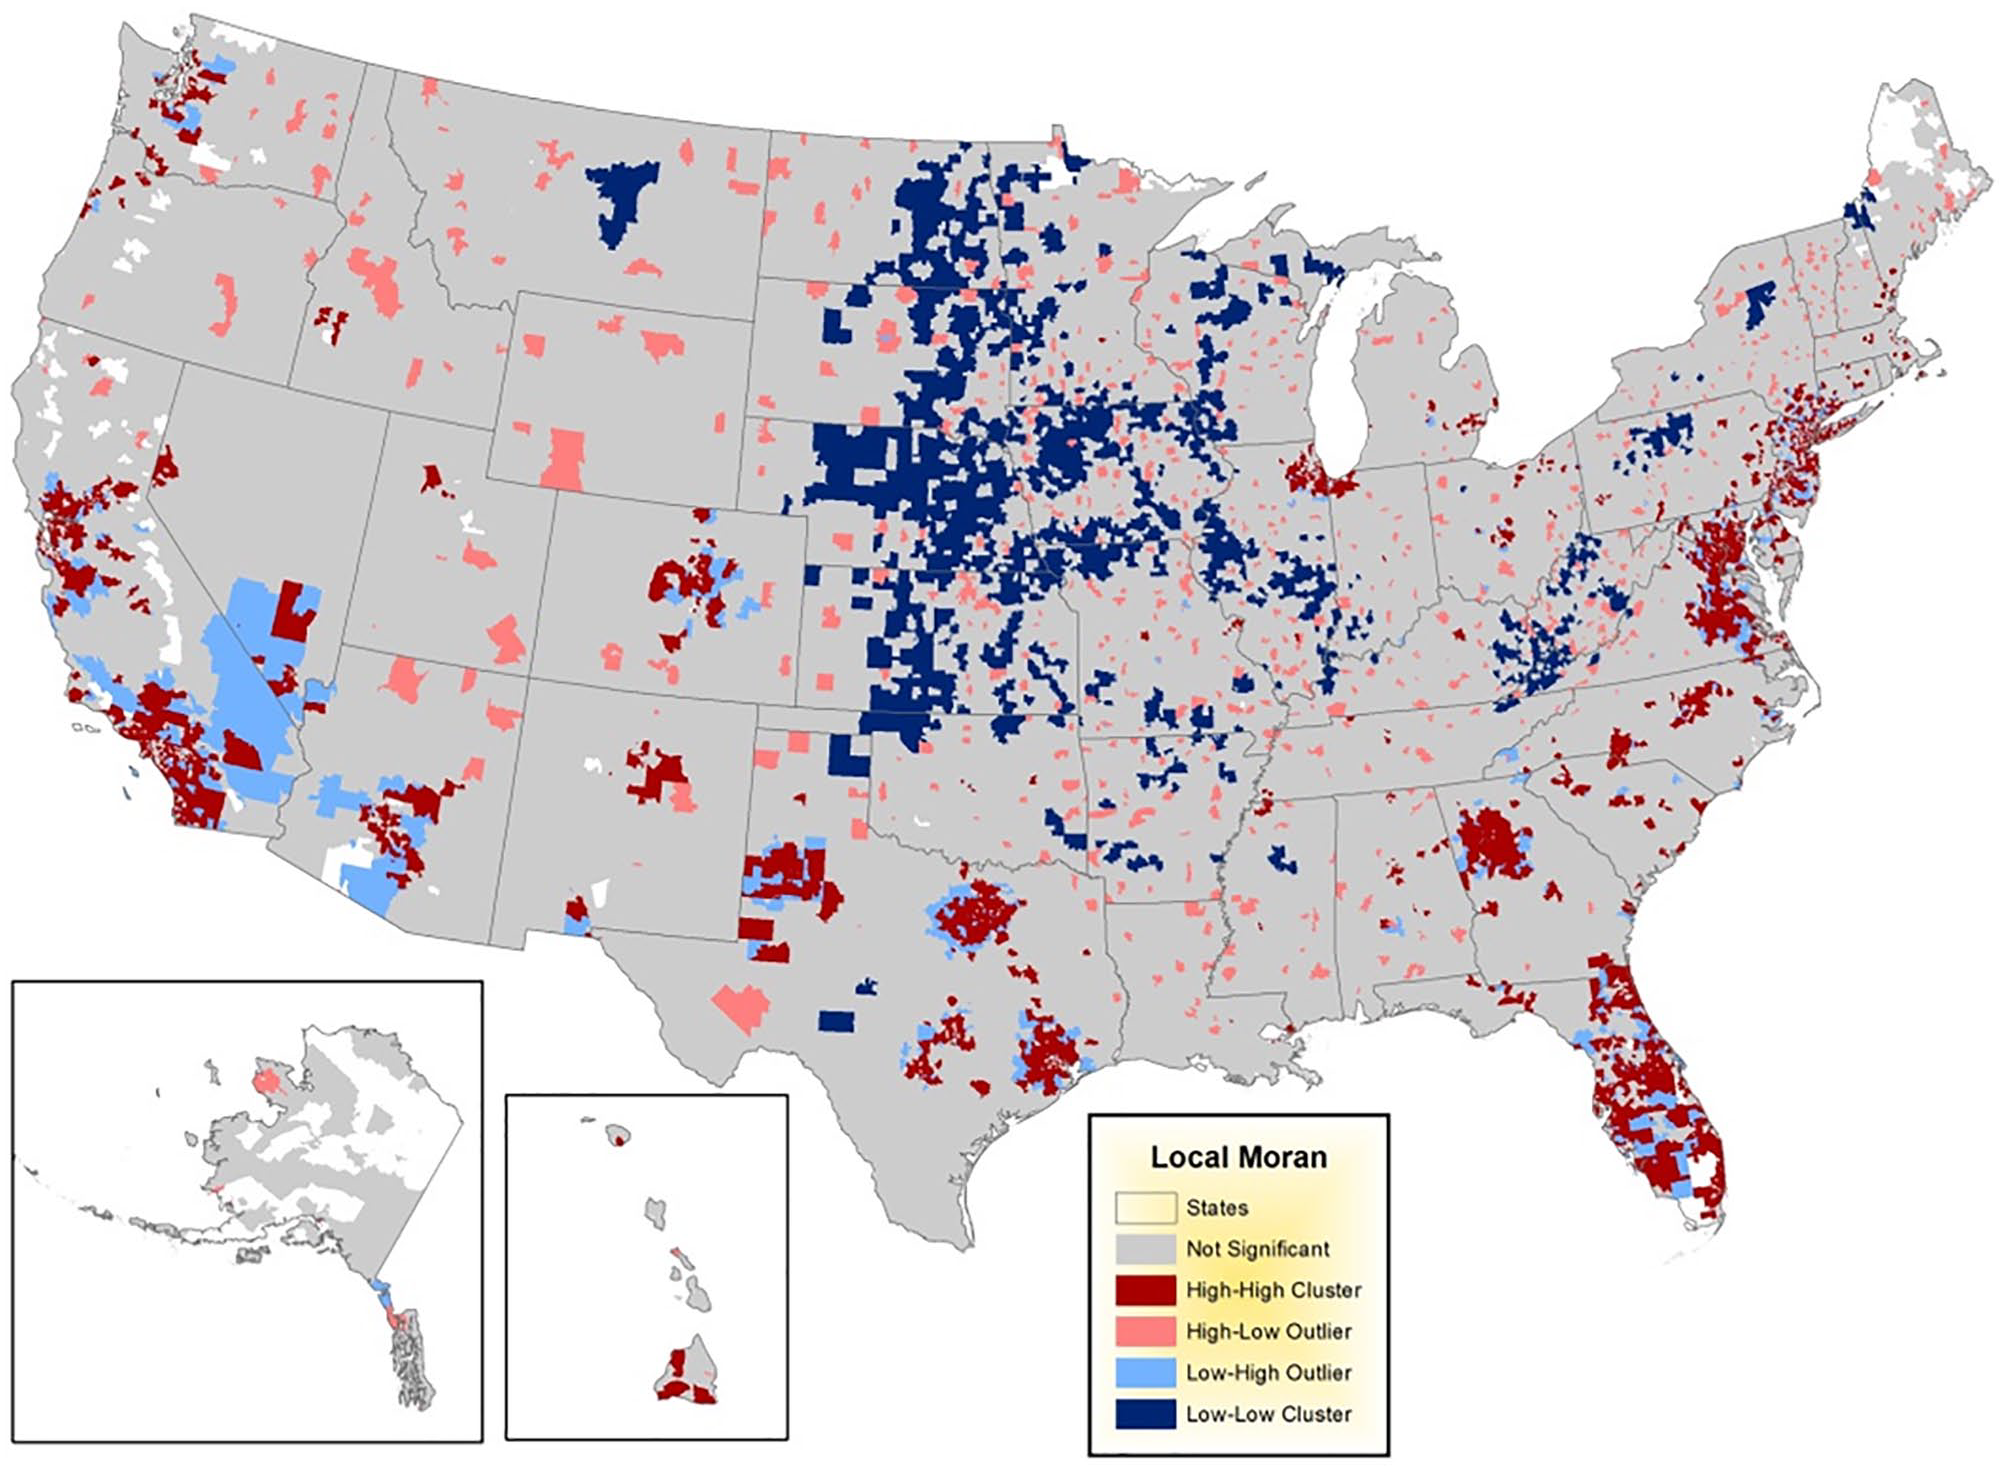
As for variability across the nation in the frequency of complaints, Figures 1 to 4 illustrate the spatial clustering or concentration of conventional mortgage, debt collection, credit reporting and consumer loan complaints across this period displayed at the zip code level. The quantity displayed in the map is the local Moran statistic (LISA—for local indicator of spatial association 4 ) comparing the complaints per household in individual zips to the same quantity in neighboring zip codes (Anselin, 1995; 1998; for applications see: Darmofal, 2006; Tam Cho & Nicley, 2008; Walker, 2013). Values in the map legends shown in dark red indicating High-High are places with a larger number of complaints per household and where neighboring zip codes also exhibit a similarly high number. Low-Low values, shown in blue at the other extreme, display those locations with low numbers of complaints per household and where neighboring zip codes also register few if any complaints. High-Low observations signify those places that have a high complaint level when their neighboring locations do not. Low-High is the converse arrangement.
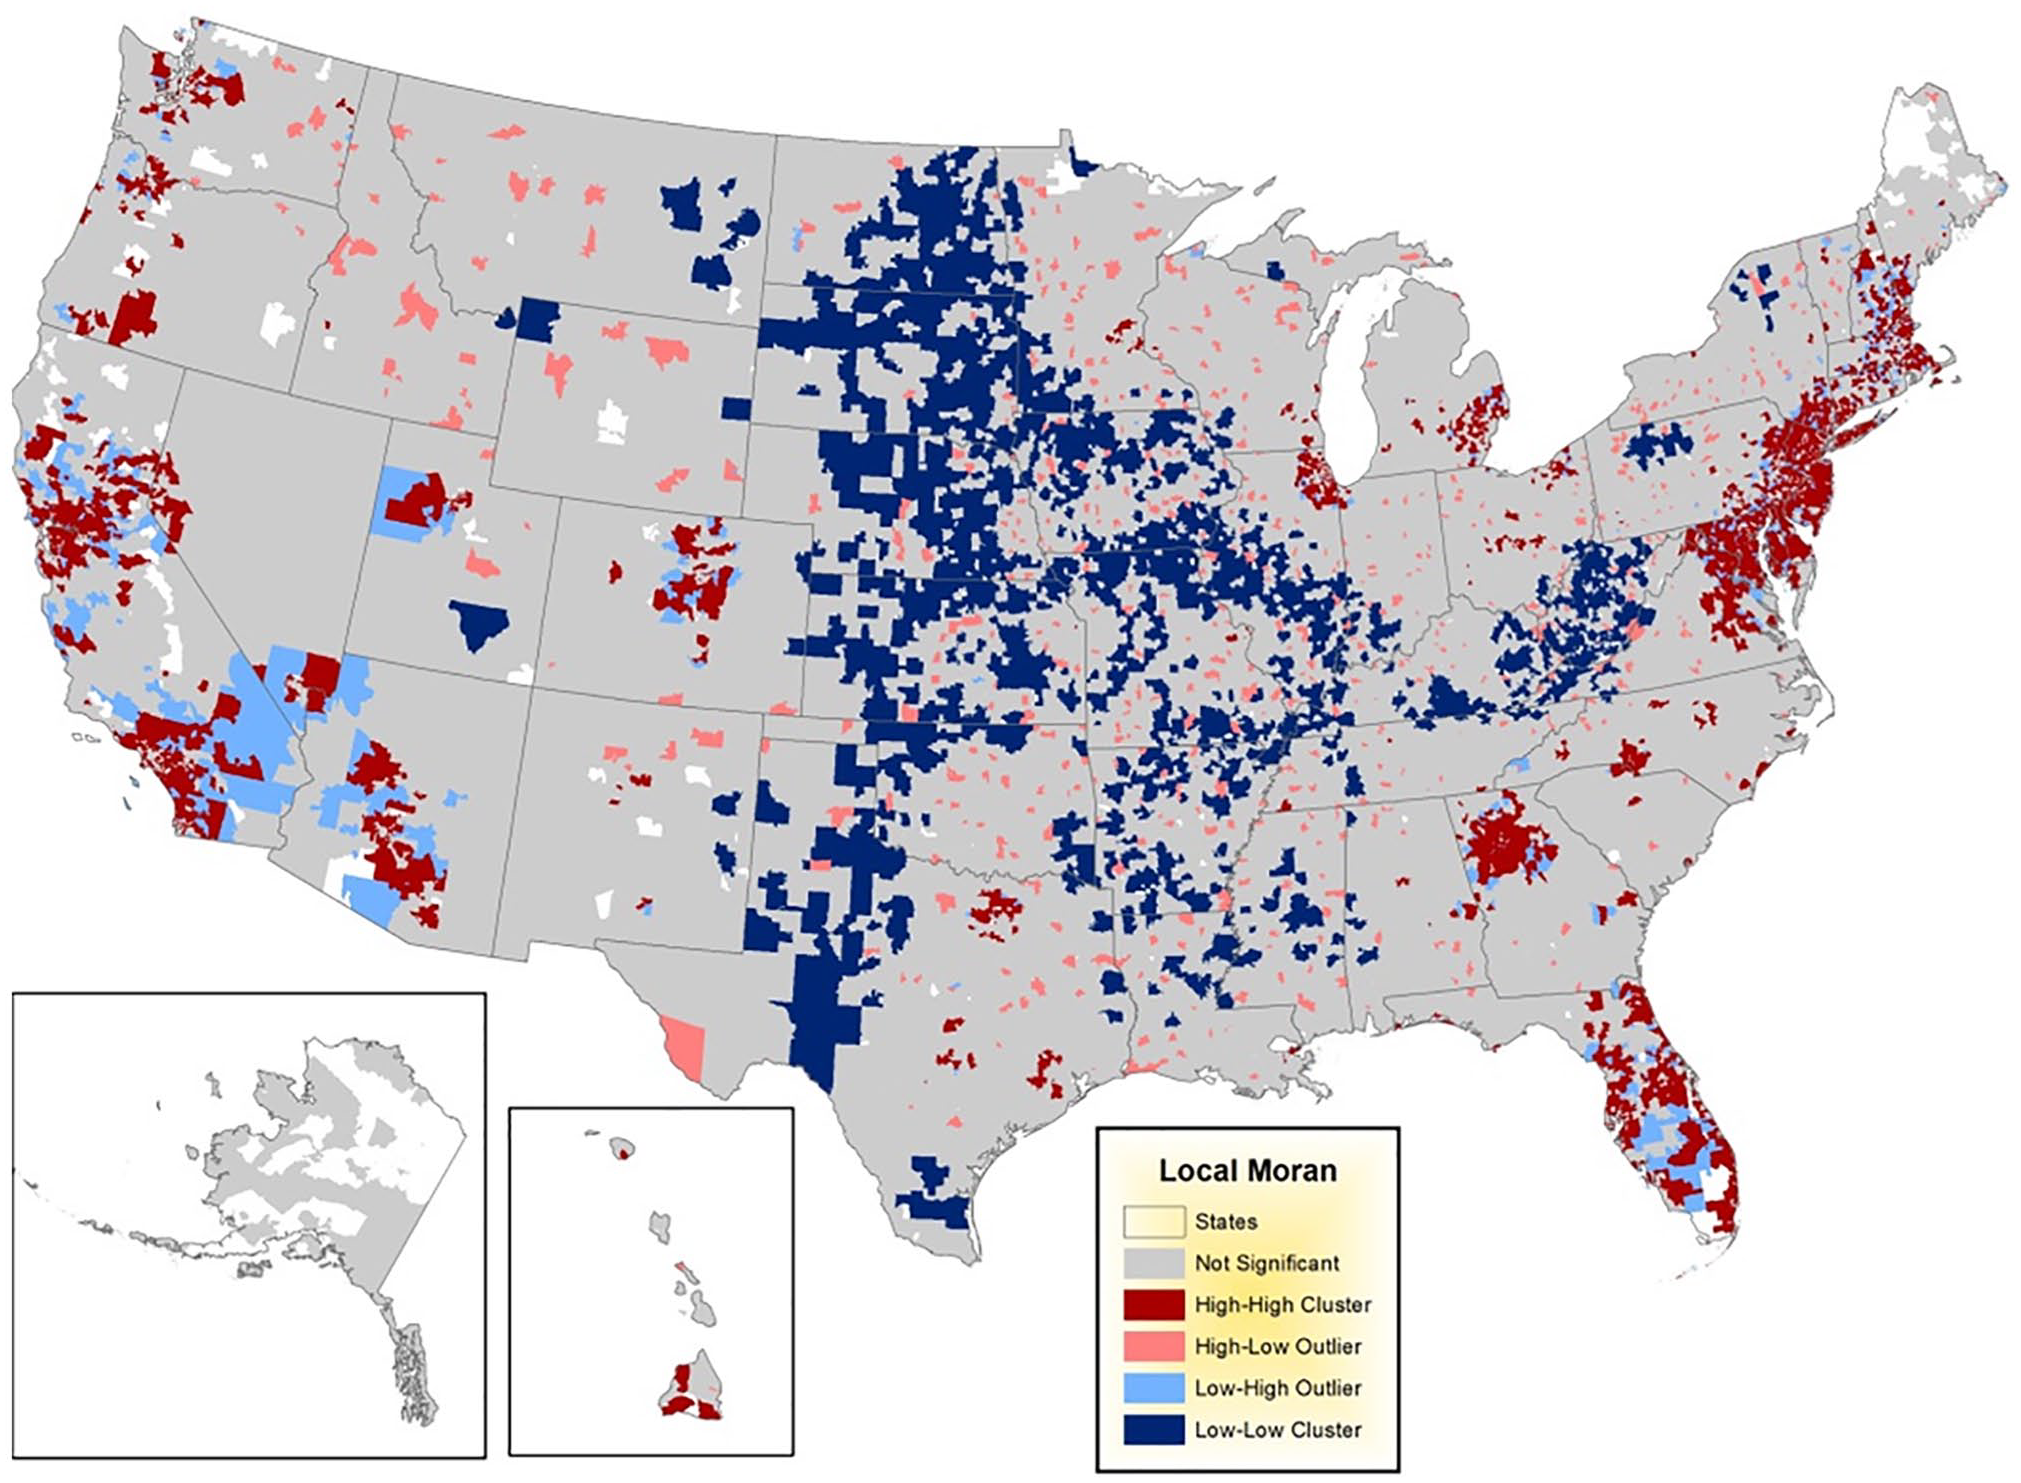
Origin of conventional mortgage complaints to the CFPB, 2012–2016, by zip code.
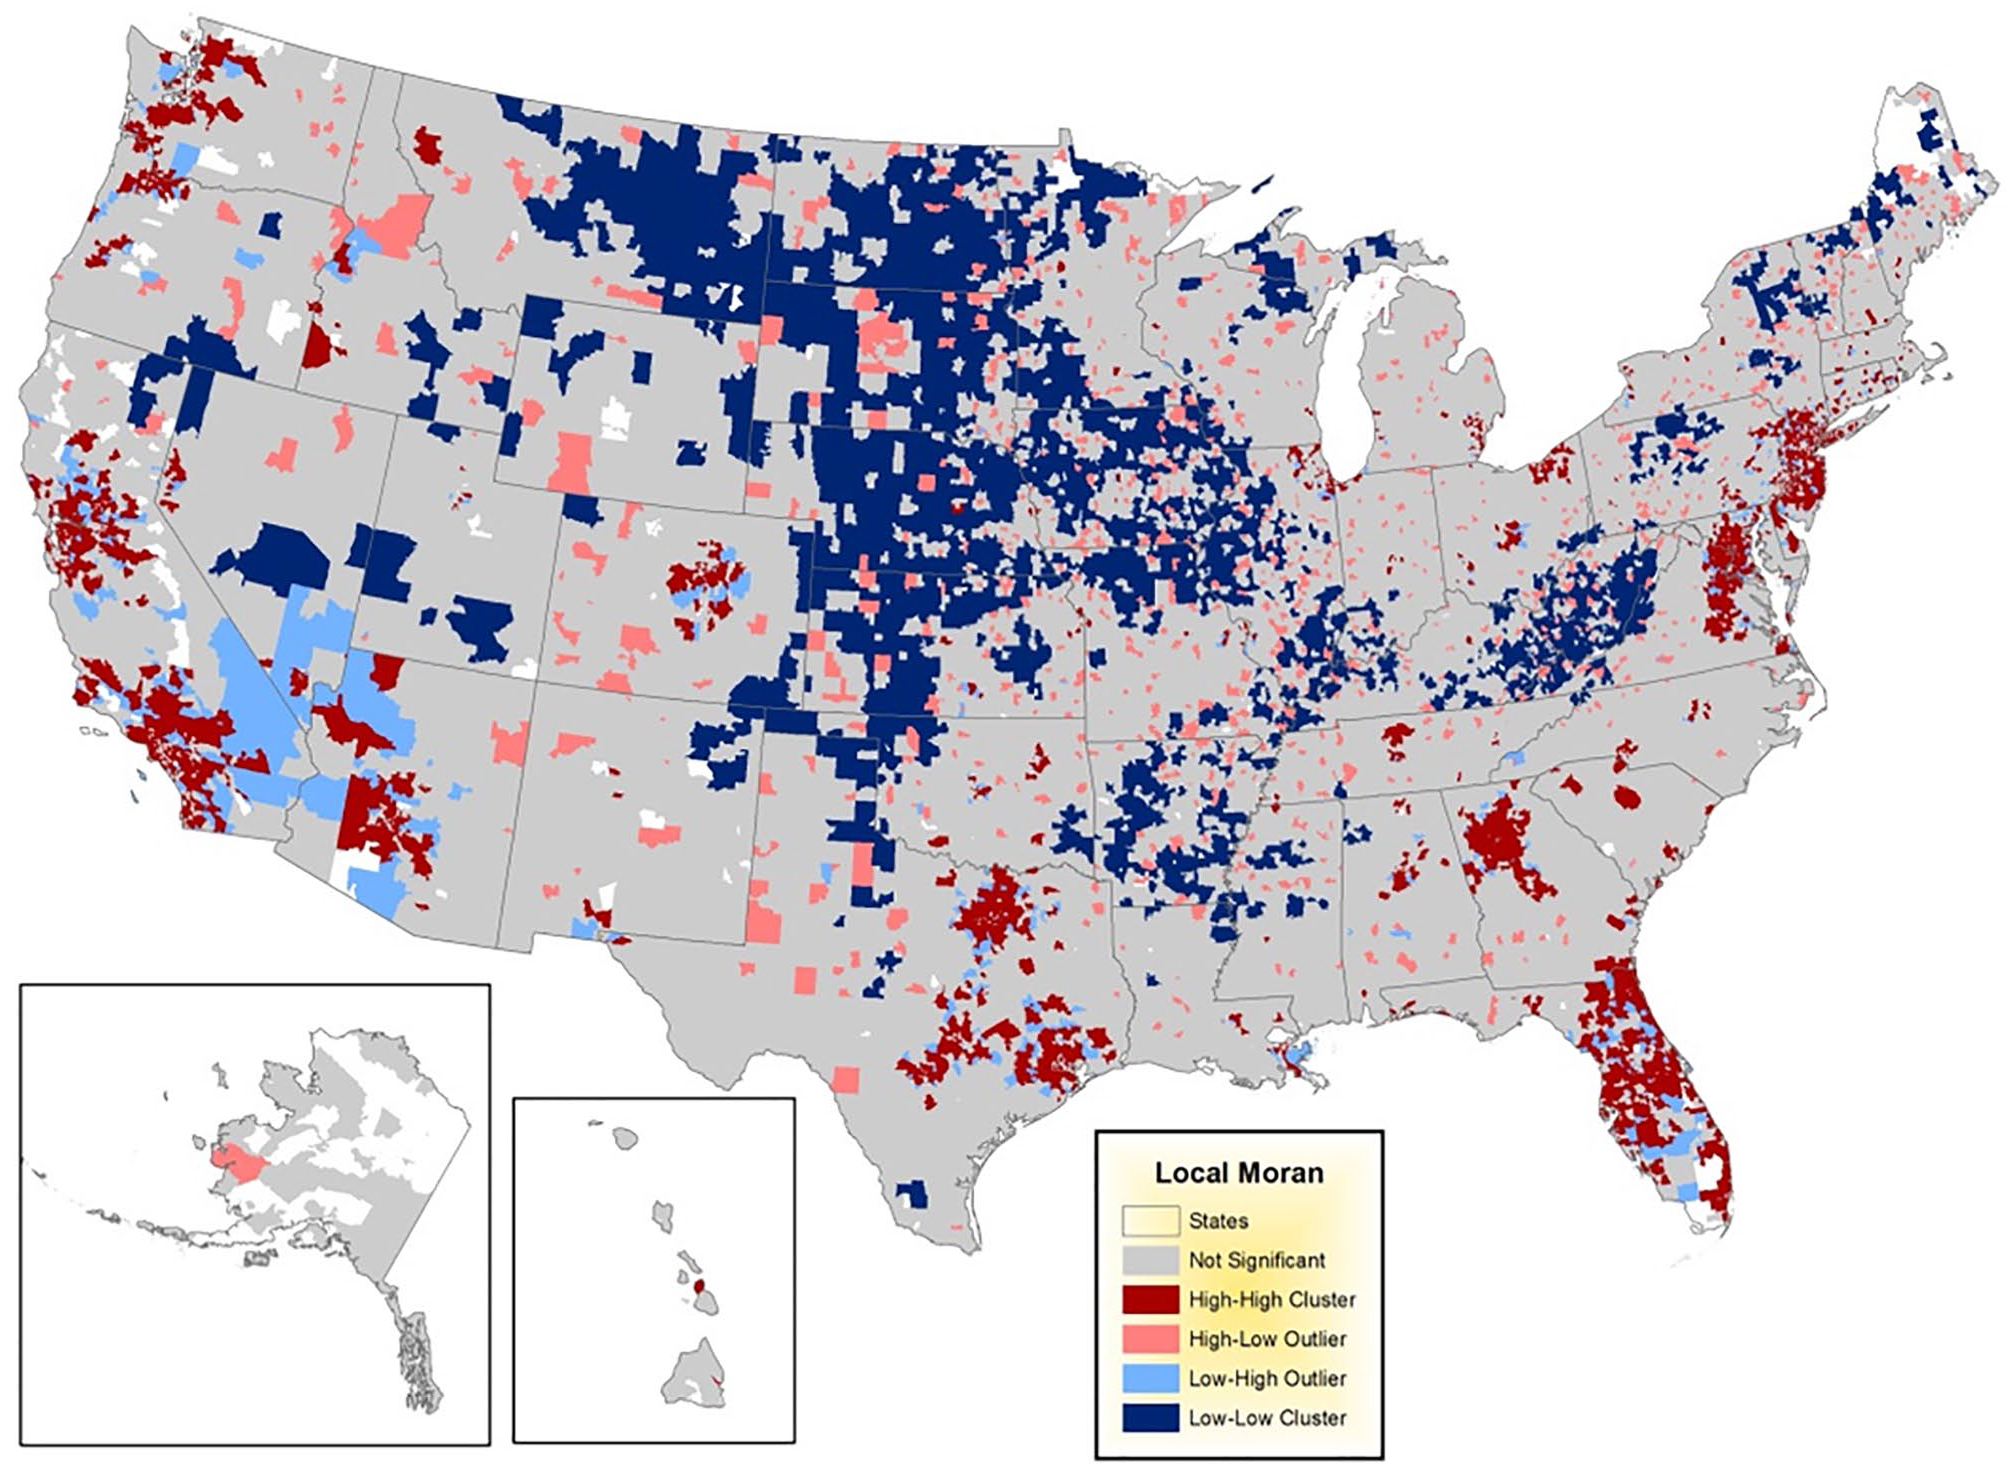
Origin of debt collection complaints to the CFPB, 2012–2016, by zip code.
Origin of credit reporting complaints to the CFPB, 2012–2016, by zip code.
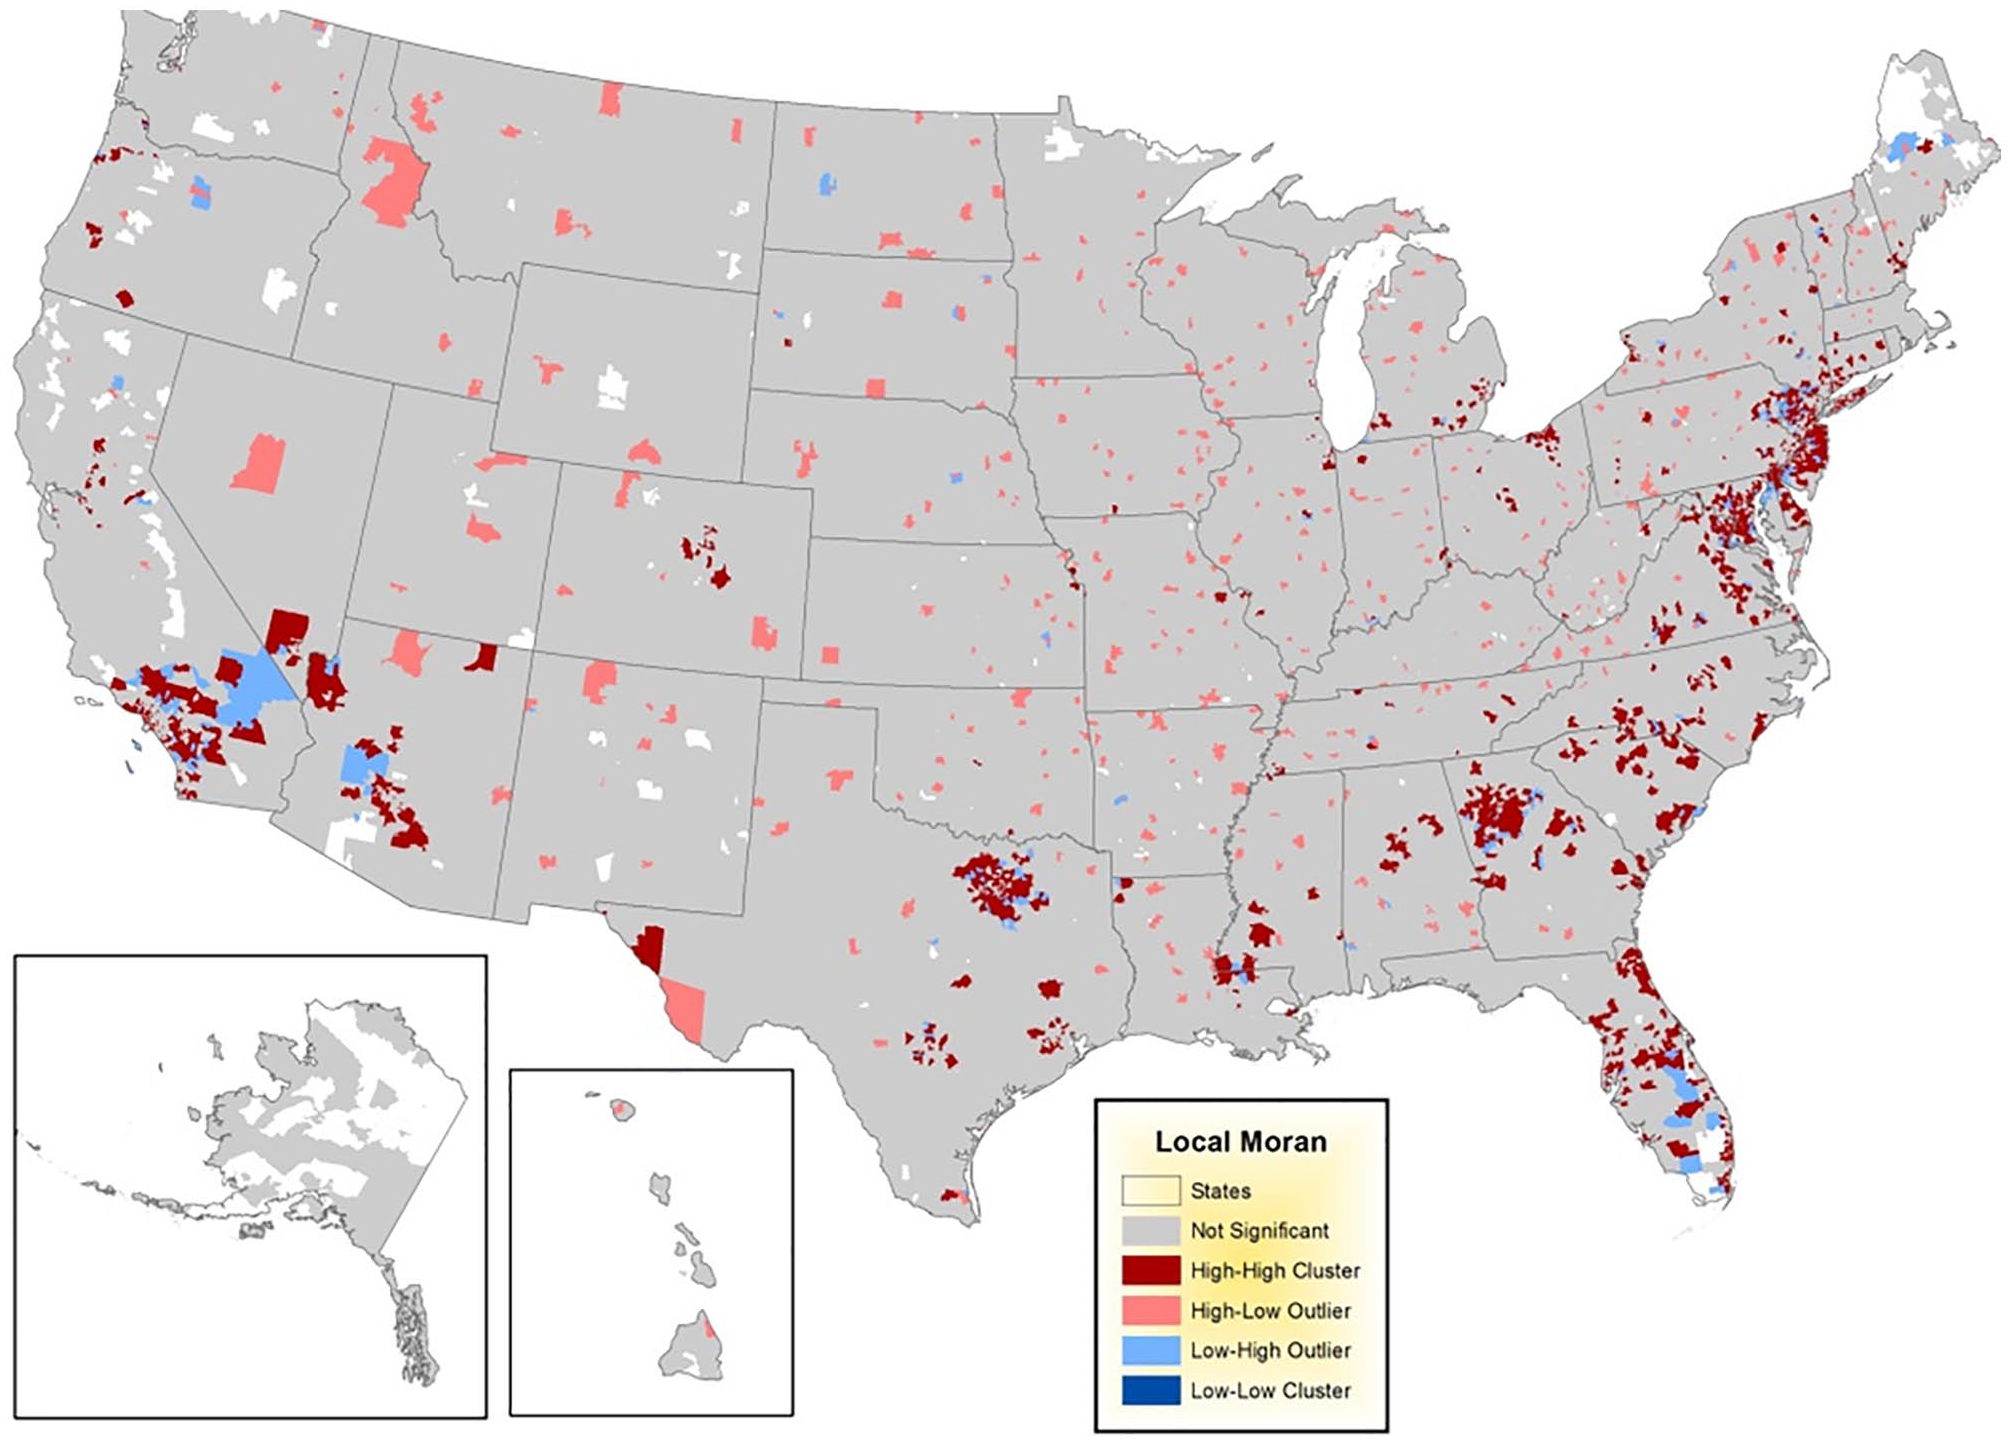
Origin of consumer loan complaints to the CFPB, 2012–2016, by zip code.
Briefly, what Figures 1 to 4 show is that patterns of complaint activity are far from evenly distributed across the nation even when accounting for population distribution. For Figures 1 to 3 clustering appears in specific metro areas where housing prices boomed between the 1990s and 2007, including the I-95 corridor running from Richmond to New York; Atlanta metro; much of the Florida peninsula; the major metropolitan areas in Texas; Phoenix; much of California; Portland and Seattle; the Denver metro area, and scattered parts of other metropolitan areas such as Salt Lake, Charlotte, Chicago, and Detroit. Figures 1 to 3 also show distinctive (dark blue) areas that are remarkable for their relative absence of complaint activity. Mostly these are suggestive of where there was no population boom associated with rapidly rising housing prices; West Virginia and Southern Ohio; and many of the smaller cities and villages of the Midwest and Great Plains. In between are scattered mid-sized cities where there was some experience of the housing crisis, but without it being locally widespread.
Figure 4, exhibiting the origins of consumer loan complaints, shows some intersection with the other maps. Hot-spots of consumer loan grievance appear in places where consumers ran up unsecured debt, often in addition to their mortgages and other debts. There are also important differences from the other data. For instance, there are hardly any regions of significantly low consumer complaint activity, suggesting that these complaints sometimes arise even in less populated areas of slow growth, just not in especially high frequency. Consumer loans are often for modest amounts, for automobiles, home furnishings, and small purchases, and may not add to a household’s financial pressure unless they are heaped on top of other types of debt. Calls to restructure consumer loans are therefore less likely to arise than efforts to understand and manage home foreclosure options.
Given the regional nature of the housing crisis it makes sense that the complaints to the CFPB originate from large and growing metropolitan areas such as Atlanta, Washington, DC, much of Florida, and California. Where there was no housing boom and bust, far fewer complaints arise. Considered together, the intersection of complaint geography across the various financial products shows that household economic problems grow and feed off one another. Struggling consumers not only face the imposition of higher interest rates and penalties, but also the debt spiral in which new debt forms repay and replace older debts. Borrowers commonly use credit for multiple purposes, to the point where so much of their income is going to service debt that they cannot keep up with daily expenses. At that point, they might resort to credit cards to pay utility bills and groceries. High interest rates on credit cards further restrict liquidity eventually leading to damaged credit and even bankruptcy. Certainly not everyone falls into this debt entrapment, but the patterns on the map suggest that where one type of financial problem is pervasive, others are usually present too. Holders of upside down mortgages may well be taking out consumer loans and using credit cards in an effort to stave off foreclosure. In this sense, the characteristics associated with housing complaints are probably going to be associated with other kinds of complaints. The maps are not sufficiently informative to offer guidance on the precise sources of variation in CFPB contacting. Further inquiry through other statistical methods will be necessary to determine what accounts for the spatial peaks and troughs in complaint activity in the devastating wake of the Great Recession.
Borrower Characteristics
Mention has already been made of the focus of mortgage lending being steered toward areas of minority population settlement in both Republican and Democratic administrations leading up to the Great Recession. Accordingly, economists documented the increasing concentration of subprime mortgages in neighborhoods where households struggled to meet prime market underwriting standards (Calem et al., 2004). The costs of borrowing are high in these locations as lending is thought to be riskier. Differential treatment, or discrimination against minority borrowers, is frequently suspected in the pricing of loans (Rugh & Massey, 2010). The accumulation of evidence about subprime lending suggests that we should expect greater numbers of CFPB complaints arising in areas with larger black and Latino populations where difficult borrowing experiences across a variety of financial products have been regularly reported (Rugh, 2014; Hall et al., 2015).
The CFPB was not created to address only the problems of low income and minority residents who struggled to make the payments on their subprime loans. Warren (2008), the CFPB’s creator and first chief, emphasized that the CFPB’s jurisdiction would cover all consumer financial products, not just the riskier, subprime loans that proved so dangerous during the Great Recession. She repeatedly pointed out that even well-educated consumers can fall prey to the various tricks and obfuscations of banks and finance companies. In addition, several researchers have how shown that much of the mortgage foreclosure crisis was concentrated among middle income families who used conventional loan instruments rather than the exotic and higher interest options frequently pushed on riskier loan applicants (Adelino et al., 2016; Green, 2008, p. 266; Li & Gao, 2012). These considerations lead to the hypothesis that CFPB complaints about consumer financial products be high even in middle and upper income locations, where the housing market was booming in 2007 and 2008 (Foohey, 2017; Littwin, 2014). Reflecting their superior knowledge, though not their greater need, higher income households will likely complain at a greater rate than those of low and moderate income.
Street-Level Institutions
A leading hypothesis in this research goes to the role of street-level consultative institutions as having an important role to play in the consumer complaint process. The presence of an LSC supported legal aid office in an area is expected to be associated with a higher count of complaints flowing to the CFPB than one might find in a similar neighborhood without such an office. This hypothesis is consistent with the more general theory about how mediating institutions, sometimes located in a different subdivision of government bureaucracy, function to heighten citizen awareness and public interaction with agencies elsewhere. Similarly, data have been collected on the location of HUD sponsored housing counseling programs as a source of information for those with consumer complaints about financial products. Where there is a larger number of housing counseling grantees, whether non-profits or local government agencies, one might anticipate a higher complaint flow to the CFPB. This is a reflection of how government agencies develop collaborative relationships with each other both horizontally within the same level of government, as well as vertically across the federal layer cake.
Data and Model Estimation
To estimate the impact of a variety of likely influences on complaints to the CFPB, we use regression models that capture the impact of zip code socioeconomic and government grantee location information on the dependent variable, defined as the logged number of complaints per household. Controlling for socioeconomic characteristics is especially important if there is to be a convincing test of the impact of housing counseling and legal services advising. Quite possibly these complaints arise entirely on their own based on public awareness stimulated by having a troubling experience with a lender or debt collector, quite without the guidance of a local debt counselor. The models we estimate are for the pooled complaints filed during the years 2012, 2013, 2014, 2015, and 2016, except for debt collection complaints which have been collected only since 2013.
The zip code is a level of granularity preferable to the county level for observing government contacting because it is a much smaller unit, superior for measuring the ecological variability of behavior. Zip codes are more homogeneous than counties in population size, and they offer greater variation given their numerosity. Deleted zip codes include those that contained no households; for example, the zips that represent singular business addresses, office buildings, or zones with no residential addresses, such as national parks.
In addition to the design providing the granularity of cross-zip code variation, estimated models include fixed effects for states in acknowledgement of the variability of state laws governing financial services and debt. Many kinds of financial services are subject to state regulation of fees and interest charges, duration of loan term, and maximum amounts. These rules can have direct and indirect effects on the financial pressures consumers face when struggling with debt repayment. Precise identification of how each state’s financial regulatory framework may promote or discourage complaints to the CFPB is beyond the scope of this paper, but it is prudent to include 1,0 categorical indicators as a modest step in the direction of statistically accounting for these influences.
Because zip code level complaint outcomes are shown to be clustered, that is, spatially related in Figures 1 to 4, standard OLS models were tested for spatial dependency in the residuals, a violation of the classic regression assumption of independence. The results indicated that the inclusion of explanatory variables mostly eliminated spatial autocorrelation, or reduced it to very low levels of magnitude, suggesting that it was not a major source of bias in the other regression coefficients. This all-clear sign permitted the forthright estimation of a standard pooled cross-section across the 5 years, controlling with fixed effects for years to gauge changes in the number of complaints as the existence of the CFPB’s complaint system became more widely known.
Among the explanatory variables are measures of the number of HUD provided housing programs and the presence of legal services agencies within a zip code based on the expectation that guidance from local advisers should increase the number of complaints even after controlling for socioeconomic variables predicting greater complaint frequency. The housing grantee data originate from the U.S. Department of Housing and Urban Development website, and legal aid grantees are listed on the website of the Legal Services Corporation, and supplemented by legal aid directory listings for individual states.
Included are such demand associated factors as the cost of housing measured by placing monthly housing costs over monthly median household income, both provided by the American Community Survey (5-year estimate for zip code data). 5 The expectation is that as monthly housing costs increase, the number of complaints is expected to rise because higher costs are more burdensome on households, independently or as a share of household income. Similarly, we expect an increase in the number of complaints when there are a large percentage of mortgage debtors in the local population. Concentrations of mortgage debtors will likely increase complaints about other financial products and services since owing money on a home is commonly paired with other debt obligations, such as home equity lines of credit, credit cards, and consumer loans on automobiles or home goods. The percentage of homes with mortgages is also provided among the housing related questions on the American Community Survey. Other zip level variables included on the ACS are median household income; median home value; the percent over age 65; the percentage black; the percentage Hispanic; and the percentage unemployed. The rationale behind including these covariates is that they will be positively associated with the number of complaints flowing to the CFPB. Finally, the zip code’s size is included on the expectation that complaints are expected to be higher in denser neighborhoods where the demand for housing is high, and also where population growth trends exert financial pressure on households. A final indicator variable for whether the zip code lies in a metro area is also expected to heighten the number of CFPB complaints since metro areas, not simply populated neighborhoods, were hardest hit by the Great Recession’s devastating impact on housing values, income and retirement savings.
The dependent variable is the sum of the number of CFPB complaints about a particular financial product in each year for each zip code. Given that the distributions of the dependent variables are right-skewed, with most zip codes tallying no contacts to the CFPB, we use the natural log of total contacts to elicit a more normal distribution of values (Gelman & Hill, 2007, pp. 60–61). Coefficients can then be expressed as percentage changes in the dependent variable resulting from a one unit increase (decrease) in the explanatory variable. The following expression captures the principal features of estimation:
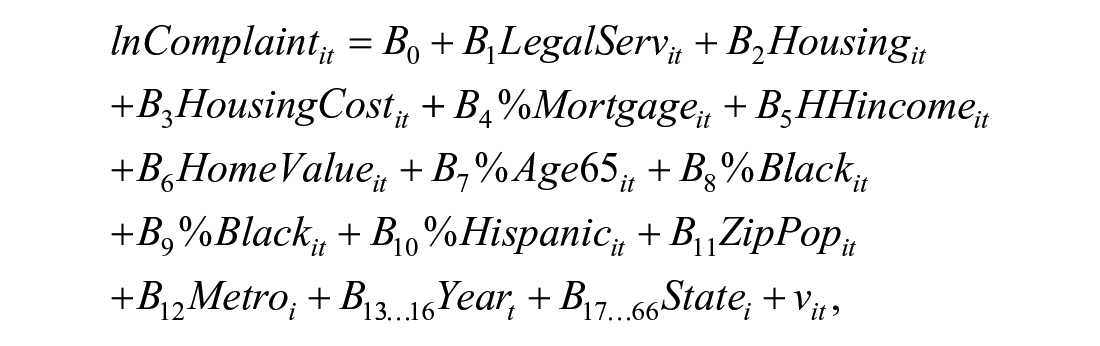

The subscript i indexes cross-section (zip code) and t indexes year. The variable, LegalServ represents the presence of a legal aid organization in the zip code; Housing represents the presence of a HUD supported housing grantee in the zip code; HousingCost is the monthly cost of housing as a share of monthly median household income; %Mortgage is the percentage of homes in the zip code with mortgage debt; HHincome is the annual median household income; HomeValue is the median value of a home; %Age65 is the percentage of the population age 65 or older; %Black is the percentage of the population that is African American; %Hispanic is the percentage of the population of Hispanic ancestry; %Unemp is the annual unemployment rate; ZipPop is the number of households; Metro is a time invariant dummy variable indicating whether the zip code lies within a major metropolitan area (SMSA); Year is a location invariant indicator for year; State is a time invariant indicator for the State in which each zip code is located, and v is the error term with mean of zero and exhibiting a normal distribution, containing cross-sectional and time wise components. 6
Results of Estimation
Impact of Legal Aid and Counseling
The results for the impact of legal aid clinics and housing programs are presented in the first two rows of Table 2, with the particular types of complaints indicated across the columns. What the data show is remarkable from the standpoint of third-party intermediaries between consumers and the CFPB. Both HUD housing programs and legal aid clinics are associated with a greater complaint flow about conventional housing loans, but there is no impact of these entities on complaints about subprime mortgages. Specifically, a presence of a HUD-sponsored housing program in a zip code is associated with a 0.8 (p ≤ .01) percent increase in the number of complaints across zip codes. Legal aid offices are associated with a smaller but still significant 0.4 (p ≤ .05) percent increase in conventional loan complaints. Reviewing the results across the rows, the local presence of legal aid has a statistically significant impact on the flow of credit card and debt collection complaints. Housing programs are only important in connection with the voicing of grievances about conventional mortgages, but not other financial products or services.
Origin of Complaints to the Consumer Financial Protection Bureau, 2012–2016.
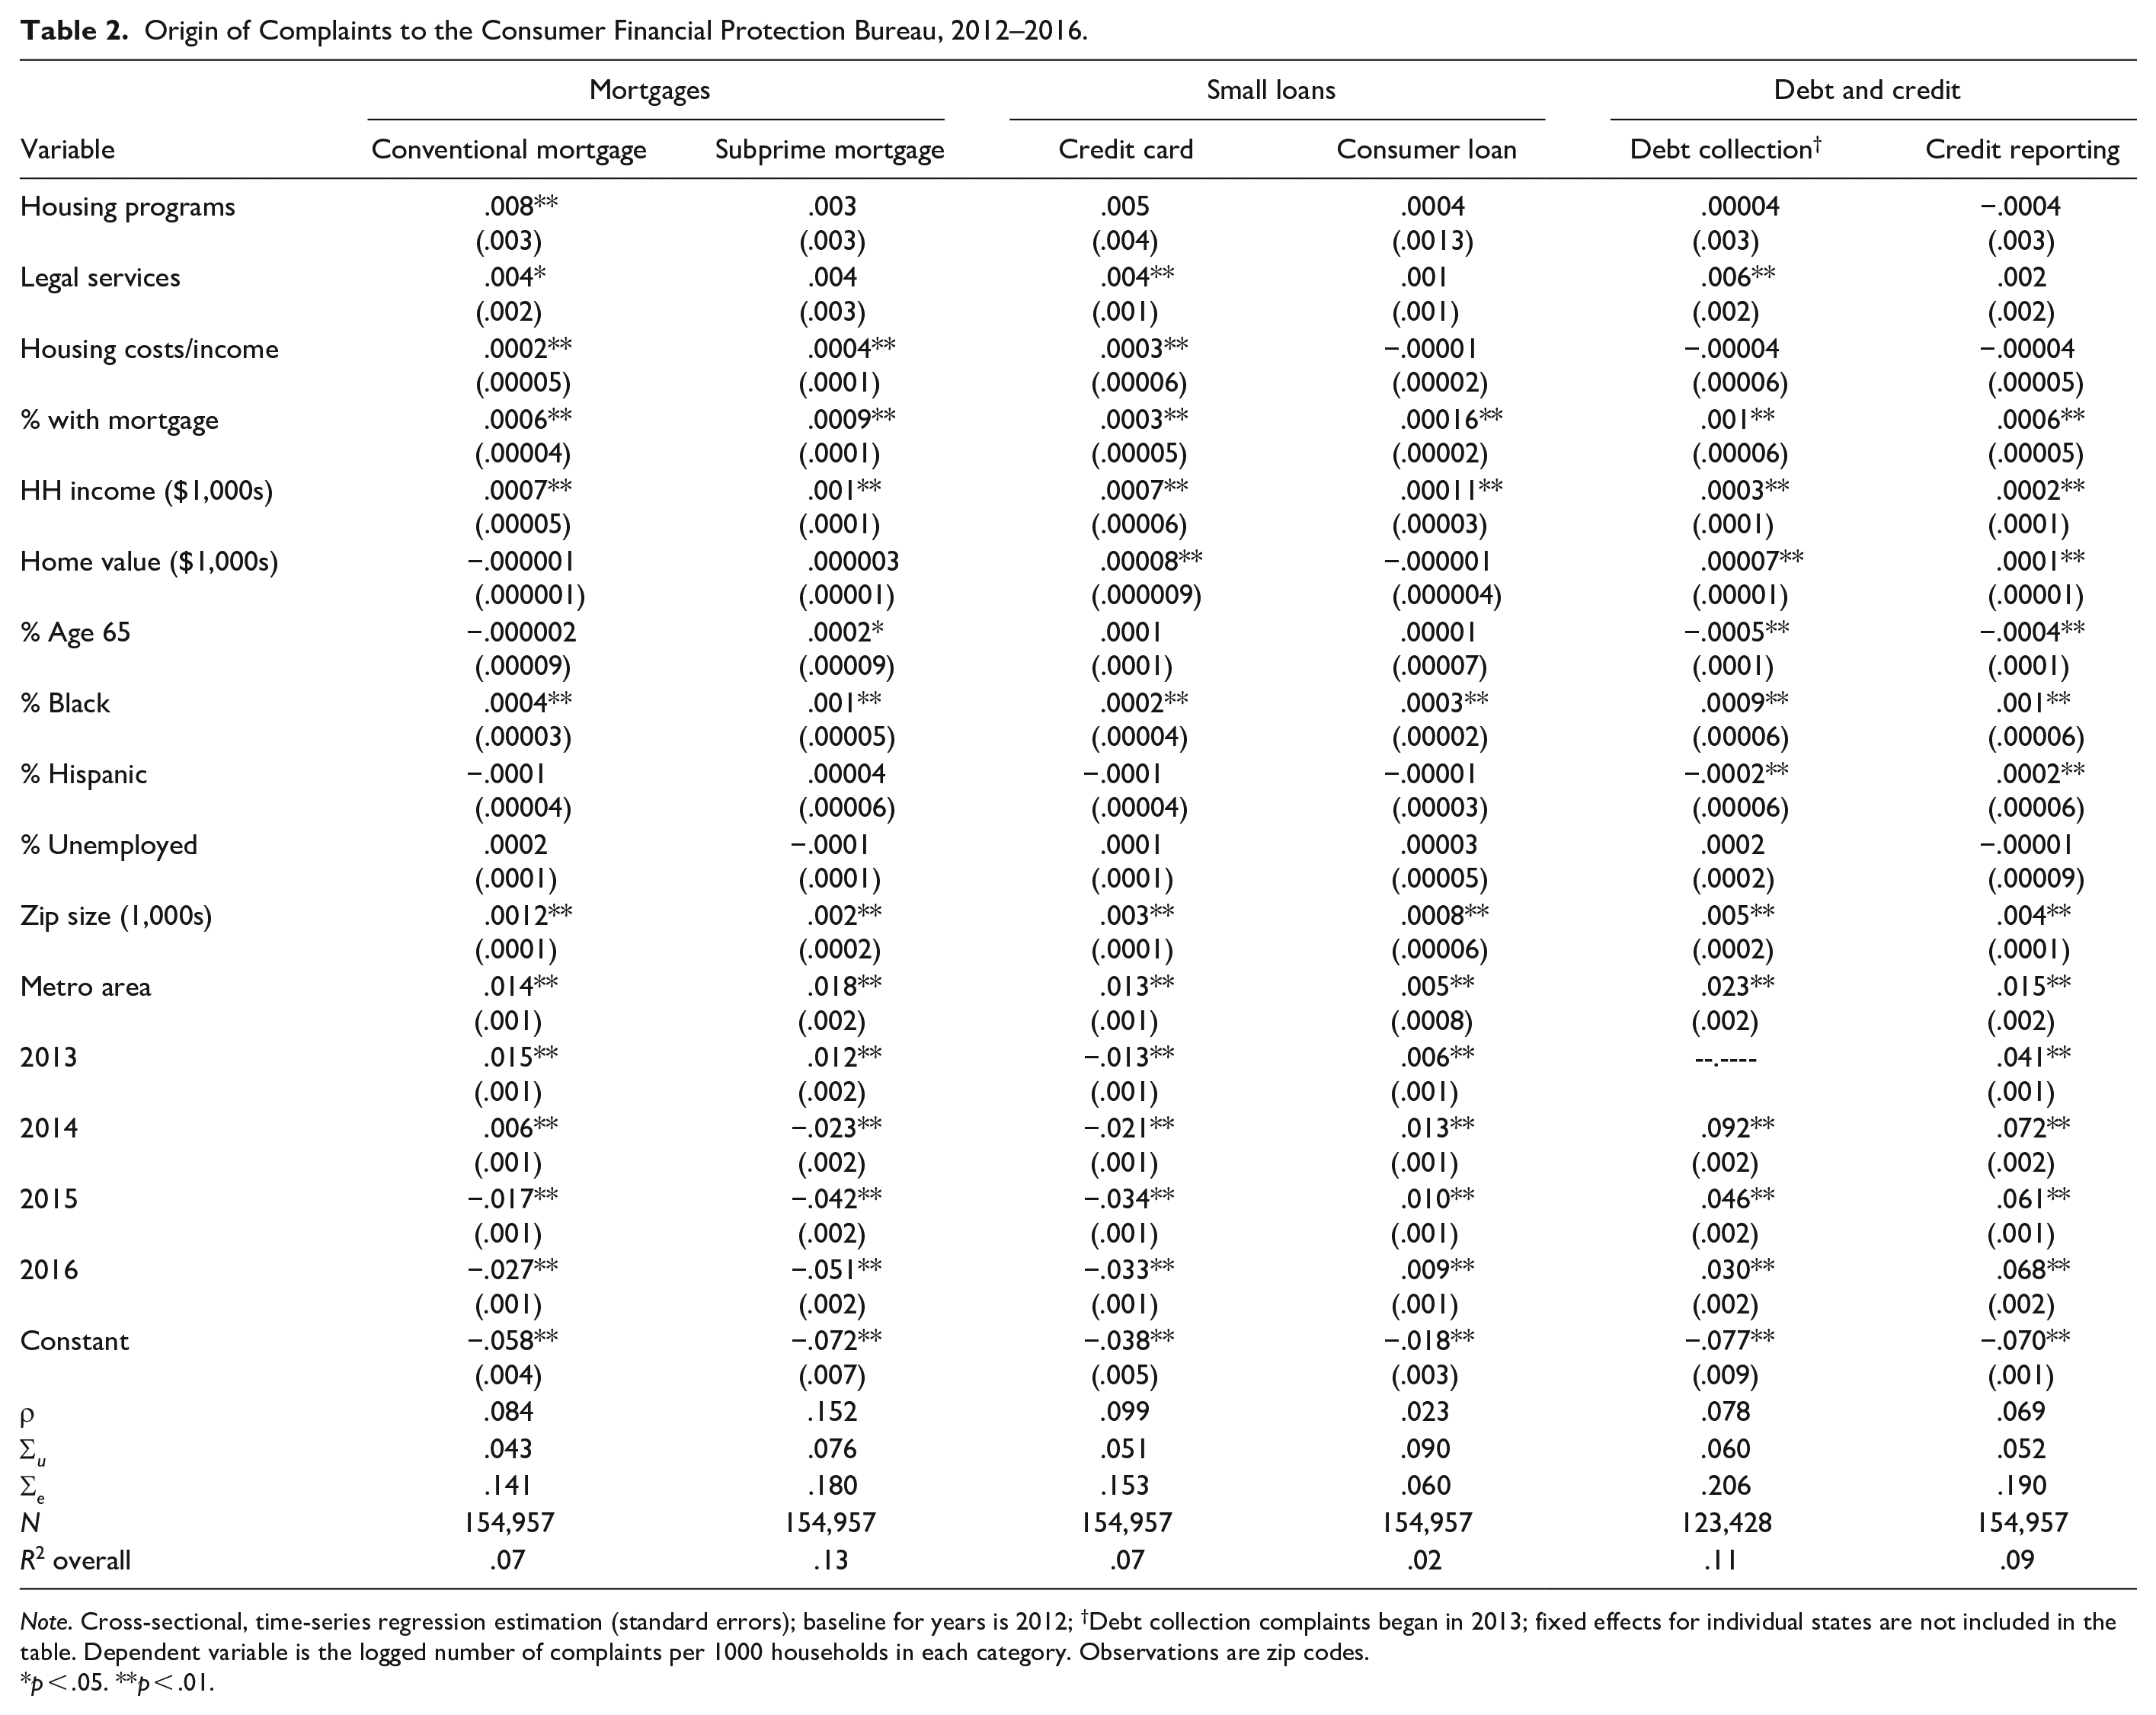
Note. Cross-sectional, time-series regression estimation (standard errors); baseline for years is 2012; †Debt collection complaints began in 2013; fixed effects for individual states are not included in the table. Dependent variable is the logged number of complaints per 1000 households in each category. Observations are zip codes.
p < .05. **p < .01.
Housing Costs and Existing Mortgage Debt
As for local housing costs and mortgage finance, the results show that as housing costs rise as a share of monthly median income, complaints rise for both types of mortgages, and for credit cards. A single standard deviation increase in monthly housing costs increases complaints about conventional mortgages by 0.3%, subprime mortgages by 0.7% and credit cards by 0.5%. The extent of mortgage financing prevalent in an area also pushes up contacting across all financial product categories, having the greatest impact on debt collection complaints (1.7% increase for each additional standard deviation), then on complaints about conventional mortgages (1.5%) followed by credit reporting (1.0%).
Income and Home Value
Income is an especially revealing covariate because it shows that locations with higher incomes sought more assistance for all financial products, including, notably, subprime mortgages. A single standard deviation increase in median household income is associated with a 2.5% (p ≤ .01) jump in complaint volume about subprime mortgages, compared with 1.5% (p ≤ .01) increase for conventional mortgages and a 1.4% (p ≤ .01) increase in credit card complaints. Higher income also sent consumer loan and debt collection complaints up by 0.2% and 0.6%, respectively, and credit reporting complaints up by 0.3%. These effects are independent of the costs of housing or the pervasiveness of mortgage lending, suggesting that higher income populations are more likely to voice grievances regardless of need.
Higher home values were expected to drive up the number of CFPB contacts, but they only do so for credit cards, debt collection and credit reporting. Specifically, for credit reporting, complaints rise 1.5% for each standard deviation increase in home value. This may well be the result of the higher credit qualification requirements for underwriting mortgages in the most affluent neighborhoods, where even slightly blemished credit can result in the denial of a loan application.
Age and Race
Though we expected concentrations of retirees to be associated with higher complaint frequency, this is only true for subprime mortgages. Elderly concentrations significantly diminish the frequency of requests for assistance about debt collection and credit reporting
The African American population, on the other hand, is associated with higher contacting frequency across all financial services, probably reflecting this population’s vulnerability during the Great Recession. Complaints about subprime mortgages flowed directly from these neighborhoods, as a one standard deviation increase in the percentage black increased CFPB contact by 1.5% (p ≤ .01). Correspondingly, grievances about debt collection and credit reporting were also much higher in areas of black concentration, pushing up complaints by 1.5% (p ≤ .01) and 1.8% (p ≤ .01), respectively. Clearly the CFPB has found a vocal constituency within black neighborhoods around the country. Having said that, these data are still ecological, and do not constitute direct evidence that the aggrieved are themselves African Americans. With that same caveat in mind, there is much less evidence that Hispanic concentration has the same impact. Indeed, only in the case of credit reporting do we find a modest jump of 0.3% (p ≤ .01) in CFPB complaints in areas of Latino concentration.
Population Density and Geography
The housing crisis and its ugly offshoots have been an urban problem. Consequently, complaints surged from areas that were metropolitan and highly urbanized. Lying in a metropolitan area increased the percentage of conventional mortgage complaints per household by 1.8% (p ≤ .01) and subprime complaints by 1.4% (p ≤ .01). Debt collection grievances per household were 2.3% (p ≤ .01) higher in metro areas than outside of them. Credit card and credit reporting problems were also a metro area crisis viewed from the standpoint of complaint frequency. This is perhaps the best evidence that the economic aftermath of the Great Recession was prolonged in the fast-growing metropolitan areas associated with the housing crisis. In turn, the damage associated with the financial crunch was most vigorously expressed in the form of CFPB complaints in the more densely populated (Central City) parts of these metropolitan areas, not in the less populated periphery. The more crowded neighborhoods were under the most housing pressure from a supply stand point, but also were home to minorities with marginal credit histories. Not surprisingly, contacts about subprime mortgages rose 1.1% (p ≤ .01) for every additional standard deviation in the number of households in a zip code (in 1,000s) while debt collection complaints were 2.7% (p ≤ .01) higher. These same neighborhoods are rife with credit card and credit reporting difficulties, which they also voice in high frequency to the CFPB.
Discussion and Conclusion
Two of the most striking differences in the origin of CFPB contacts are shown in Figure 5. The columns exhibit the magnitude of increase in complaints for every single standard deviation rise in median income or percentage black across zip codes and time. What is most remarkable, perhaps, are the large numbers of mortgage complaints coming from higher income areas. Also notable are the complaints streaming in from black neighborhoods, but not higher income areas, about debt collection and credit reporting. Though we might expect an increase in subprime mortgage complaints in areas of minority concentration, we would not necessarily expect these to be of high frequency in areas of affluence. These complaints may well originate from high cost borrowers who were leveraged far beyond their means seeking to reside in localities they could not afford. But evidence from related research also suggests that investors and higher income populations engaged in housing price speculation also numbered heavily among mortgage delinquencies throughout the period (Green, 2008; Li & Gao, 2012). Contacts from these sources appear to be reflected in the estimates for the impact of high income.
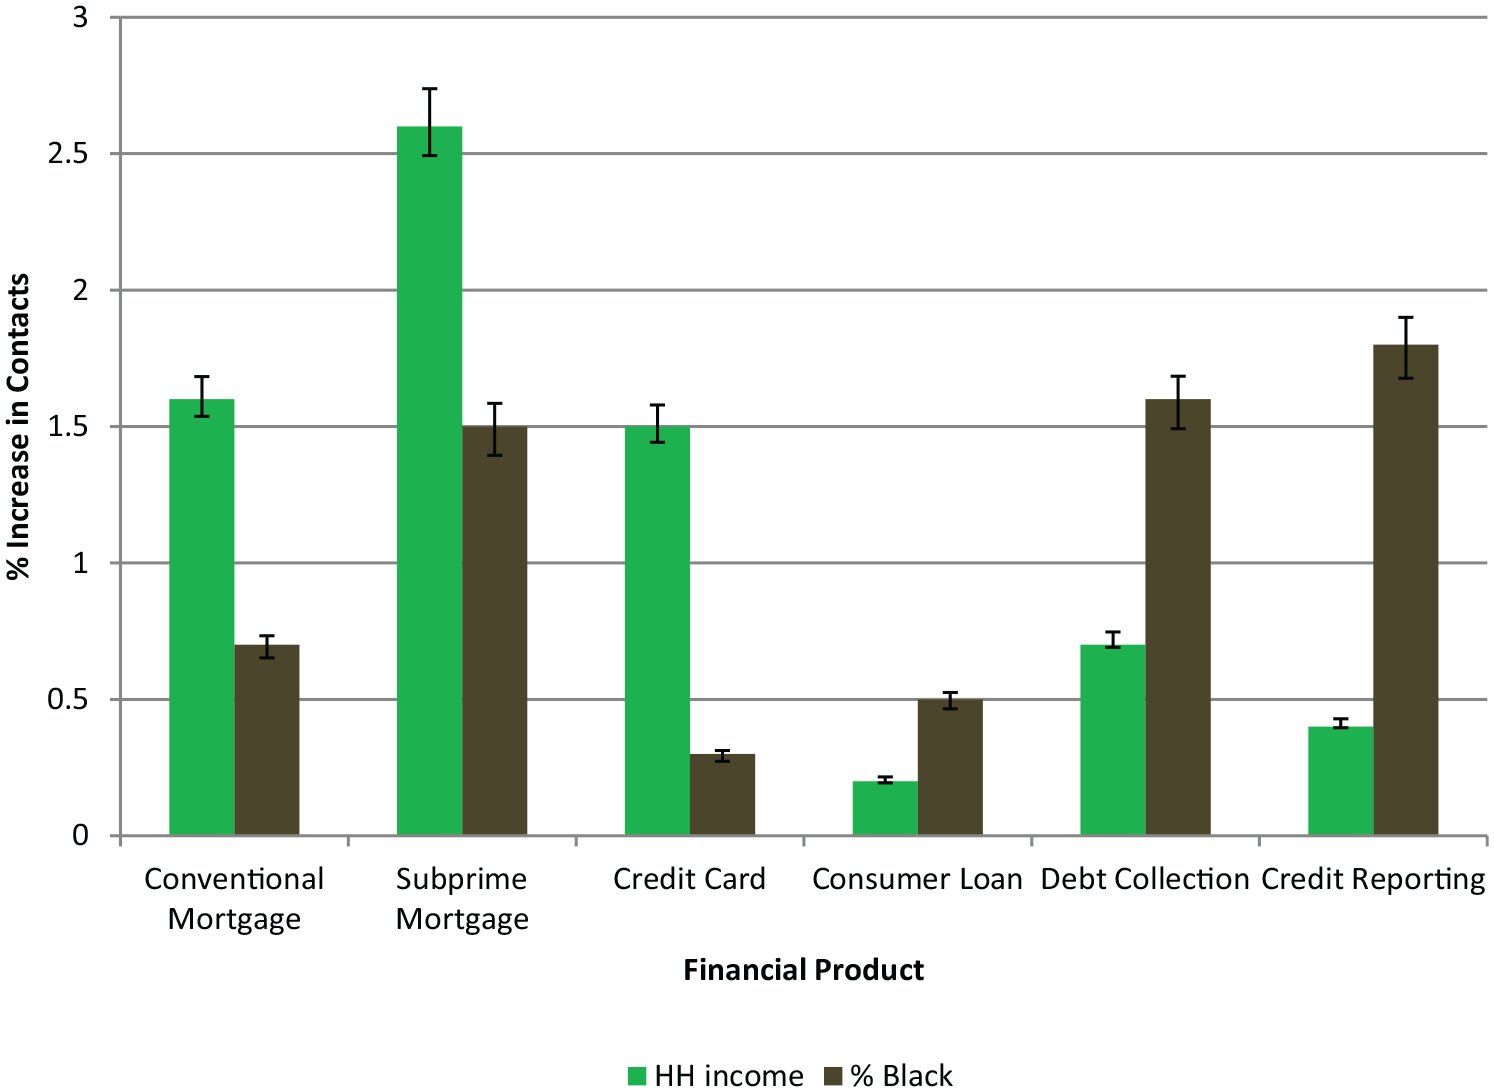
Impact of household income and percentage black across zip codes in elevating the number of complaints per household to the CFPB, controlling for other factors, 2012–2016 (estimates derived from results in Table 2).
Certainly there is evidence in these data that locations that faced financial problems as severe as foreclosure and bankruptcy also experienced difficulty paying credit cards, auto and other consumer loans, and reported more complaints about debt collectors and credit reporting agencies. We cannot say how many households had multiple issues to bring before the CFPB, but the geographic patterns do underscore the regional nature of the Great Recession and its attendant impact. Having said that, the absence of complaints from many areas is not always a sign that economic times remain robust, but that populations may differ in their propensity to complain, for reasons other than lack of awareness. Some are more likely to request assistance than others out of culturally-rooted beliefs about the role of government. The geographic patterns of non-contact shown in Figures 1 to 4 may be traceable, in part, to such non-economic factors.
Other results that stand out by way of summary include the apparent impact of legal aid offices (and housing counseling) on the flow of conventional mortgage, credit card and debt collection complaints. Though it is true that the locations of these consultative agencies are not random, and might just happen to be situated in areas at high risk for financial difficulty, controls in the model for income, housing costs, population density and racial composition also mitigate the possibility that legal aid and housing programs are only spuriously related to complaint frequency. Also noteworthy is the fact that the CFPB’s website explicitly directs those experiencing financial hardship to consult with legal aid counselors and provides a directory of those services searchable by location. The efficacy of legal aid in registering the grievances of low and moderate income clients undergoing financial hardship is well worth a follow-up study given these suggestive findings. Certainly one upshot is that through street-level organizations the gap in government service provision separating the affluent, who complain on their own, and the poor, who do not know where to express their grievance, might be closed.
By taking up research on citizen complaints and grievances, scholars are able to evaluate how responsive the bureaucracy is to the public that participates as well as the broader one that does not (Balla, 2000; Kelleher & Yackee, 2009; Krislov & Rosenbloom, 1981). Moreover, the public’s trust and confidence in government has been found to be conditional on responsiveness to attempts at contact (Peters, 2010; Tolbert & Mossberger, 2006; Welch et al., 2005; West, 2004; Yackee & Lowery, 2005). Negative views of government could be traceable to the fact that so much of government is hidden, and not subject to public contact (Mettler, 2011). The CFPB’s accessible complaint process is a step in the direction of making regulatory bureaucracy less hidden. As it now stands, the CFPB data likely underrepresent the problems faced by underbanked households and lower socioeconomic status groups. Moreover, additional evidence I do not have space to present here shows that relief flows more satisfactorily toward upper income locations rather than lower income ones. Black populations are also slightly more likely to receive untimely responses to their queries, according to my preliminary estimates.
Clearly there are signs for the potential of middle and upper income capture of government services in this case just as in others (Minkoff, 2016; Sharp, 1982). Even so, there is room for optimism. Though like other agencies, this one will probably always be more hidden from the poor than it is to those of higher status, the present online contacting format does come with an ease and directness that has been absent from other government voice mechanisms. The CFPB’s example does offer the potential to restore some confidence that government is effective, and that participation can improve the quality of public services (Sjoberg et al., 2017). Whether the CFPB can maintain a public orientation is a question answerable only through the difficult politics involved in shaping agency activity and priorities over the next decade of economic volatility.
Footnotes
Declaration of Conflicting Interests
The author(s) declared no potential conflicts of interest with respect to the research, authorship, and/or publication of this article.
Funding
The author(s) received no financial support for the research, authorship, and/or publication of this article.