
Abstract
Little is known about how legislature size affects the political mobilization of societal interests. I propose that legislative downsizing events increase the cost of campaigns, and thereby spur additional lobbying by organized interests that corral monetary resources efficiently. I examine how numbers of organizations with registered lobbyists changed in response to legislative downsizing events in three states. Using synthetic control analyses, I find that downsizing did not affect organization totals in Massachusetts or Rhode Island, but that Illinois’ Cutback Amendment precipitated a 25-percent increase in organized interests. Further tests disconfirm that monetary-based interests were most likely to mobilize anew after the Amendment’s implementation. In general, these mixed findings imply that changes in legislature size alone are insufficient for affecting interest mobilization but that other kinds of legislative reforms, such as the transition from cumulative to plurality voting that accompanied Illinois’ downsizing, may affect mobilization rates.
Introduction
For decades, social scientists have lamented the lack of economic diversity among organized interest groups in America. Broadly construed, interest groups are said to represent the upper class more often than other classes (Schattschneider, 1960; Schlozman et al., 2012). Indeed, among groups that lobby, business firms and professional associations typically outnumber labor unions and cause-based groups. Concurrently, social scientists have limited knowledge about the effects of legislative institutions on the political mobilization and influence of various organized interests. Such institutions, however, are the primary venues in which interests lobby to influence public policy. If legislatures may be reformed in ways that induce more or less lobbying by organized interests in general, or sets of interests in particular, then such reforms have implications for the relative influence that various interests exercise over policy and, by extension, the alignment of policy with public opinion.
In recent decades, social scientists have begun to explore the numbers and kinds of organizations that mobilize politically or lobby. Lowery and Gray (1995) proposed that, while numbers of organized interests are the result of group-level decisions to lobby, the political context in which interests operate also matters for mobilization. For example, some political systems are crowded with numerous interest groups and, as a result, individual groups more often stop lobbying or dissolve altogether. Gray and Lowery (1996) first began to explore interest populations because a previous narrative (Olson, 1982) linking group-level mobilization with the large-scale effects of organized interests on policy lacked empirical support. Throughout a series of subsequent publications, they and other scholars began to explore the diversity of organized interests and the implications of such diversity for traditional accounts of biased mobilization. The present analysis extends this work by examining how one aspect of political environments—legislature size—affects the mobilization of interest groups.
Legislatures vary in membership size across time and borders in significant ways. In the United States, colonial assemblies typically contained between a dozen and forty members (Squire, 2012, p. 13). Over time, American legislatures grew in size. Today, Congress contains more than 500 members and the largest state legislature has more than 400 members. Among the 44 state legislatures that existed in 1900, 34 experienced a size change at some point before 2012 (Squire, 2012, p. 267). Assemblies beyond the United States vary even more widely with some chambers containing multiple thousands of members and others having only several dozen.
Yet, while legislatures vary widely in size, social scientists know little about the effects of size on interest mobilization. Most research on legislature size examines effects on government spending (Chen & Malhotra, 2007; Hankins, 2020) or legislator collaboration (Kirkland, 2014). Building on the work of Powell (2012) and McCormick and Tollison (1981), I propose that changes in legislature size affect numbers of interest groups that lobby. Campaign finance helps explain the link between legislature size and interest groups. Candidates seeking election in larger districts tend to raise and spend more money for their campaign efforts. The creation of larger (smaller) districts leads to more (less) expensive campaigns and, given the role of donations in facilitating lobby access, more (less) mobilization by organized interests that traditionally donate as a means of achieving access. In other words, smaller legislatures are proposed to be more exclusive domains that exacerbate the effects of upper-class bias among organized interests.
To test my expectations, I conduct synthetic control analyses using data from three legislatures in the United States. Numerous studies of interest populations have turned to the American states since those governments were the first democracies to require that lobbyists register (Opheim, 1991). The availability of reliable lobby data from the states, combined with temporal variation in legislature sizes, allows for causal inference. Voters in Massachusetts, Illinois, and Rhode Island all chose to reduce their legislatures by a third or fourth. While the three states had different average constituency sizes prior to the reforms, none of them experienced drastic changes in overall populations that would otherwise offset the enlarging effects of legislative downsizing on constituency size or campaign spending. Importantly, the downsizing reforms did not occur concurrently with court-ordered reapportionment since districts within (not across) these states were all roughly equal in population prior to the reforms. With synthetic control analyses, I generate estimates for how many interest groups would have lobbied legislators in each of the three states had none of them experienced downsizing events.
The results indicate that changes in legislature size alone do not precipitate changes in interest mobilization, but that related changes may affect mobilization. Only the downsizing event in Illinois (i.e., the Cutback Amendment) precipitated an increase in lobbying, and this event was accompanied by the legislature transitioning from multi-member districts elected with cumulative voting to single-member districts and plurality voting. Additional analyses reveal that these changes did not discernibly affect the mix of interests active in the Illinois legislature. In general, while some legislative characteristics may affect the overall number of interests that lobby, membership size is not one of them.
These findings have implications for both historical and contemporary debates over legislature size. In the 1960s, reductions in legislature size were heralded as means to improve representation and further professionalize state legislatures: “…a legislature should be large enough to represent and reflect the diverse elements of its constituency and small enough to get things done” (CCSL, 1971, p. 66).
Legislature Size and Interest Mobilization
I propose that a legislature’s size matters for the political mobilization of interest groups because size is linked to campaign finance activities, and organized interests often use campaign donations to acquire access to incumbent legislators. Legislature size affects the value of campaign donations since members serving in smaller assemblies seek more donations on average than members serving in larger assembles, ceteris paribus. The proposed link between size and lobbying occurs as follows: more interests give donations to legislators serving in small (large) assemblies and therefore expect more (less) access in return. As a result, interests are more or less likely to lobby depending on how much access they expect to achieve, with the link between donations and access being more certain in small assemblies. Not all interests rely on campaign donations to the same extent, so legislature size especially affects the mobilization of interests that traditionally rely on donations as a means of achieving access. This implies that legislature size has important implications for representation: depending on size, some legislatures are more suitable venues for wealthy or poor interests.
Critics of American legislatures allege that monetarily wealthy interests make campaign donations to incumbent legislators so as to acquire access and (ultimately) policy influence, and that such activities are undemocratic (see Lowery et al., 2015). Hall and Wayman (1990) provide a brief review of these various critical accounts and question what achieving access might entail. To them, campaign donations buy legislator attention. More specifically: donations lead to members of Congress being more active during committee markup on issues of interest to donor groups. More recent studies have examined the relationship between donations and access further, and their results reaffirm the importance of money for achieving access. Ansolabehere et al. (2002) find that the organizations that spend the most on lobbying members of Congress also donate the most dollars to campaigns. Within the states, Lowery et al. (2008) find that political action committees with affiliated lobbyists make more campaign donations than those with no affiliated lobbyists. While these findings merely suggest that money helps lobbyists to acquire access and possibly influence, an experimental study found that members of Congress grant access more readily to those who claim to have donated to their campaigns than to those who do not mention any kind of donation (Kalla & Broockman, 2016). Once lobbyists have begun to make donations and build relationships with members of Congress, they continue donating to their campaigns even when the members transition to new committees (Bertrand et al., 2014). Legislative critics express concerns about how such transactions involving donations and access benefit monetarily wealthy groups more than other kinds of interests (e.g., Schlozman et al. 2012, pp. 96–114).
While historical data on campaign donations in state legislative races is sporadic, political scientists have collected enough of it to be able to make generalizable claims. Campaign expenditures tend to be greater in legislative chambers with larger constituencies or districts (Hogan & Hamm, 1998; Powell, 2012, p. 42). These trends are visible within states as candidates for senate seats tend to spend more than house candidates, in general (Gierzynski & Breaux, 1991). This pattern can also be found among candidates for the U.S. Senate: those running for election in larger states tend to raise and spend more money than those running in smaller states (Herrnson, 2008). The connection between district size and campaign spending persists even when one controls for factors such as legislator characteristics (e.g., leadership status), electoral competition, and campaign finance laws (Hogan, 2000; Powell, 2012, p. 164). Relatedly, legislators from multi-member districts where constituencies or donor pools overlap are found to compete more for donations. While these legislators each raise less money on average than those serving in single-member districts, they raise money from more diverse sources (Curry et al., 2013). All these studies link district size with campaign finance activity and imply that, if one holds state population constant, campaign expenditures are greater in smaller legislatures since there are more constituents and donors in the larger districts.
Given that lobbyists contribute to campaigns to achieve access and that campaigns are more expensive in larger districts, several social scientists propose that lobbyists are more valuable to lawmakers elected from larger districts than to those serving smaller districts. These accounts rely on an investment-based perspective of donations. According to Powell (2012), legislators solicit campaign contributions for reelection or to help their parties and therefore be promoted to leadership posts. The more money a legislator raises, the more weight he gives to the interests of his donors (131). In larger districts, legislators spend more time raising money and are stronger allies of organized interests (97). 2 Powell (115) argues that, while numbers of organized interests are path dependent in part, more interests press their demands upon legislators when they perceive that their donations more effectively lead to influence: legislators who are “more open to the influence of campaign contributions” are subjected to more lobbying by groups. McCormick and Tollison (1981, pp. 33-34) also expect that legislators serve as allies to different sets of donor interests. In their formal models, organized interests decide how much to spend (i.e., donate to campaigns) in buying access. In larger assemblies, there are more legislators and access costs less. While interests enjoy more access in larger assemblies, the legislators each have less proportional influence over voting outcomes. Hence, the size of the assembly is inversely related to the cost of access and, McCormick and Tollison argue, interests achieve more influence in small assemblies than in large ones. 3
There is yet another possible linkage between legislature size and lobbying by interest groups, and it also involves informal exchanges. McCormick and Tollison (1981) and Kunicová and Rose-Ackerman (2005) all argue that voters can police corruption more easily when legislators are elected from smaller districts. The latter two authors provide the more detailed account. In their narrative, voters provide oversight of incumbent officials and, in response to corruption or the granting of particularistic benefits (rents) to organized interests, penalize officials electorally. This is more easily accomplished in smaller districts where there are fewer voters since monitoring and penalizing officials require voters to overcome the problem of free-riding. In this view, the public serves to sever the connection somewhat between legislators and influence-seeking interests, but with varying degrees of success depending on district size.
How, then, might changes in legislature size be related to interest populations? Holding a state’s population constant and assuming that each district elects a single winner, changing the size of a legislature also changes the average size of each member’s district or constituency. Such changes in constituency size effect the campaign budgets of legislators and, according to Powell (2012) and McCormick and Tollison (1981), make legislators stronger or weaker allies of organized interests. The link to interest populations remains unclear, however, unless one accepts that the kinds of interests that benefit the most from making donations are those that most effectively overcome issues of collective action and organize. Olson (1965) argues that various interests in society never organize and sponsor lobbyists since the interests are too dispersed (shared among too many people) and potential group members have incentives to free-ride on others’ efforts. As a result, the organizations active in legislative assemblies are those that overcome issues of collective action most efficiently, which happen to be groups that seek concentrated, particularistic benefits: business institutions, especially. Labor unions and cause-based groups certainly do lobby but are fewer in number. Gerber (1999, pp. 59-75) applies the logic of collective (in)action to group resources: among groups that organize successfully, those with organizational members (i.e., businesses, associations of businesses, and professional associations) more efficiently corral monetary resources such as donations to achieve influence than those whose members are autonomous individuals (e.g., professional associations, labor unions, cause-based groups). The latter kind of organizations more efficiently corral personnel resources to achieve influence. 4 The connection between legislature size and interest populations may thus be summarized: since members of smaller legislatures are stronger allies to donor interests given the greater size of average campaign budgets, and since the interests in society that specialize in corralling donations more easily organize and lobby than others, smaller legislatures give rise to more lobbying by interests in general and more lobbying by monetary-based interests in particular. In other words, smaller legislatures are more exclusive domains that exacerbate the effects of upper-class bias among organized interests. 5 To test this proposition, I turn to three legislative downsizing events in the American states.
Three Cases of Legislative Downsizing
Squire and Hamm (2005) argue that scholars interested in estimating the effects of legislature size should look to the American states. State legislatures tend to be smaller than Congress but they vary drastically in size across borders and time. Whereas Congress has not changed size since 1959 when Alaska and Hawaii were admitted as states, 34 state legislatures have adjusted membership totals since then (Squire & Hamm, 2005, p. 47). Some legislatures experienced drastic changes. Moreover, the states are also ideal for testing the effects of institutional change on interest mobilization because of data availability. While campaign finance data from the states are too limited to verify if changes in legislature size affect spending totals, reliable lobby registration data are plentiful. The states were the first democracies in the world to require that lobbyists register on a consistent basis (Opheim, 1991). Massachusetts was the first state to adopt registration, in 1891. Similar lobby laws were then adopted in states throughout the Northeast and Midwest (Strickland, 2020a). Early lobbyist records from the states can be found in state archives and libraries, and contain the names of registered lobbyists and their employers.
Among state legislatures, those in Massachusetts, Illinois, and Rhode Island experienced three of the most drastic changes in membership sizes during the twentieth century. These changes were not directly related to federal litigation over redistricting. In 1979, seats in the Massachusetts House were reduced by a third. Four years later, seats in the Illinois House were reduced by a third. Rhode Island’s transition occurred more recently: seats in both the house and senate were reduced by a fourth in 2003. The reforms in all three states followed lengthy grassroots campaigns and were approved by voters. The reforms continue to attract criticism but it remains unknown how they affected lobbying.
The reforms in Massachusetts, Illinois, and Rhode Island present opportunities to examine how changes in legislature size affect lobbying by interest organizations. For years both before and after each reform, these states required lobbyists to register and disclose the names of their clients. Importantly, other states began to implement improved lobby laws as part of a legislative professionalization movement or in response to the Watergate scandal (Greenwald, 1974; Opheim, 1991). Observations of lobby organizations from control states (which did not experience changes in legislature size, or experienced minor changes) provide insight into how lobbying might have evolved in Massachusetts, Illinois, and Rhode Island had their legislatures each remained unchanged. 6 While a few states not included in this study experienced equally or more drastic changes in legislature size, those changes either occurred over multiple years (as in Connecticut) or before lobbyist laws were improved during the 1960s (as in Nebraska or Vermont).
The selection of Massachusetts, Illinois, and Rhode Island, in particular, yields insights into other institutional effects on lobbying. If legislative downsizing affects levels of interest in government as expected, then I expect to see increases in organization numbers in all three states. Differences between the reforms can provide more insight, however. The reforms in Massachusetts and Illinois were confined entirely to those legislatures’ lower chambers, but Illinois’ reform was accompanied by a transition from multi-member districts (MMDs) with cumulative voting to single-member districts (SMDs) with plurality voting. Finding an effect only in Massachusetts would suggest that downsizing affects lobbying, but that Illinois’ other institutional changes counteracted downsizing effects in that state. Alternatively, an effect found only in Illinois would suggest that those other changes, and not downsizing itself, affected lobbying. McCormick and Tollison (1981, pp. 36-42) also suggest that the ratio of house members to senators affects the potential value of legislators to organized interests. Rhode Island’s reform provides insight into this question. In that state, the upper and lower chambers were reduced concurrently by a fourth. The change preserved the ratio of representatives to senators but nevertheless reduced the overall size of the legislature. Finding an effect only in Rhode Island would suggest that size adjustments in both chambers within a bicameral legislature are necessary for interest in government to change. I first describe the method I apply to data from each state before describing each downsizing event and presenting results.
Three Synthetic Control Analyses
To determine if any of the three downsizing events affected numbers of organizations that lobbied legislators, I conduct three synthetic control analyses. For the analyses, I gathered lists of registered lobbyists and their clients from my reformed states and other, control states for time periods that include each reform’s implementation. 7 Based on the lists, I calculate how many organizations lobbied legislators during every legislative session in each state. 8 The organizations include individual institutions such as businesses and hospitals, associations of institutions such as chambers of commerce and manufacturers associations, and membership-based groups such as professional and trade associations, labor unions and cause-based groups (e.g., American Civil Liberties Union, Sierra Club).
Using organization totals from control or donor states that did not reform their legislatures or that saw negligible changes, I generate estimates of how many organizations would have lobbied in Massachusetts, Illinois, and Rhode Island had reforms in those states not been implemented. To generate the estimates, I construct synthetic versions of each state based on organization totals from control states. 9 For constructing a synthetic Massachusetts, for instance, observations from donor states that are more similar to the actual Massachusetts are weighted more heavily. Some donor states are given weights of zero depending on how dissimilar they are from the treated state. In general, synthetic control analyses allow researchers to make causal inferences with relatively small sample sizes (Abadie et al., 2015). The approach is ideal for the American states given that few states changed their legislatures so drastically. 10
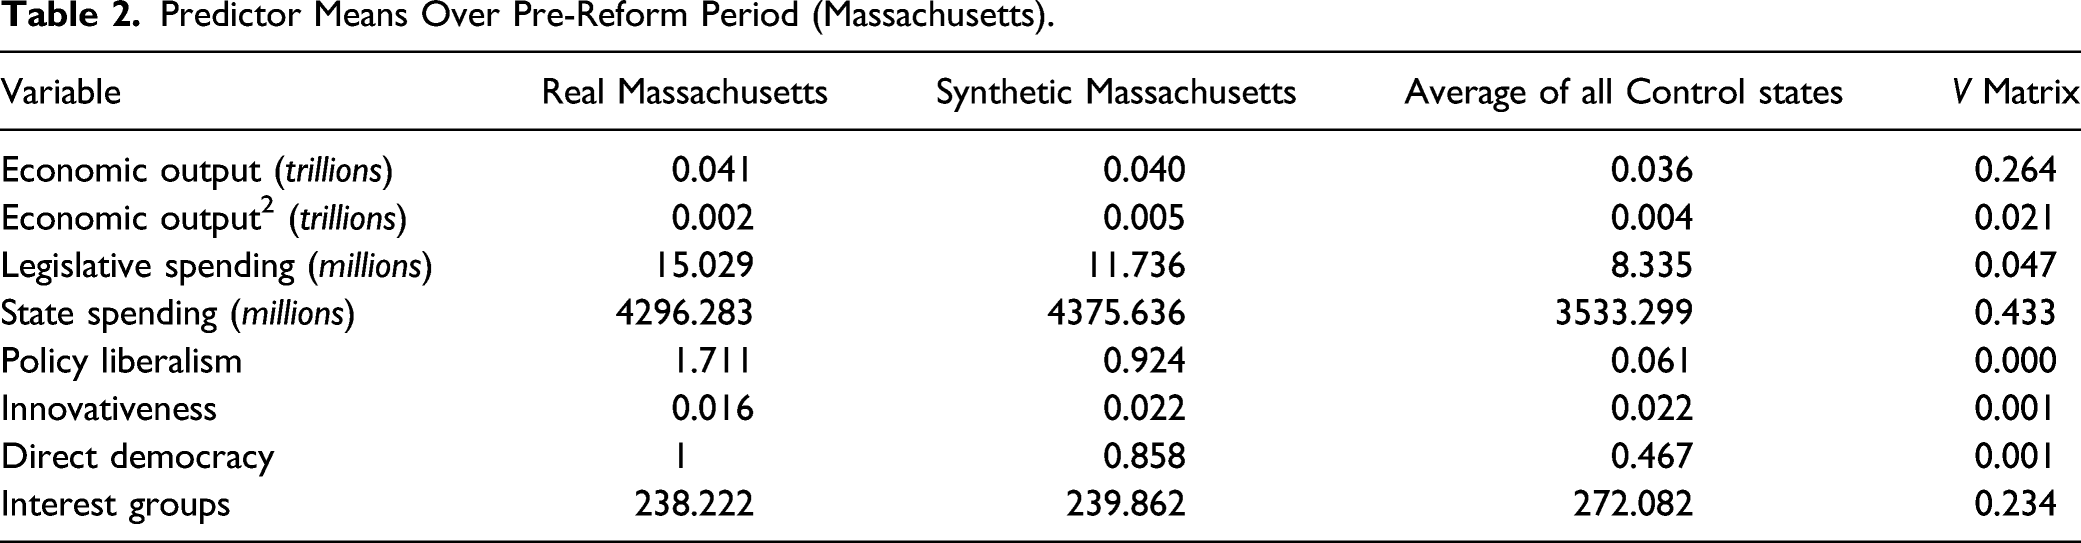
To generate synthetic observations of organization totals for Massachusetts, Illinois, and Rhode Island, I employ a series of variables that are shown to predict actual totals. Chief among these is state economic output and squared values. Gray and Lowery (1996) use output to predict totals of lobby organizations because many interests are not membership-based but instead consist of businesses and institutions. Also, there is a curvilinear relationship between output and lobby organizations (Lowery & Gray, 1995), so squared values of output are used as well. I include a measure of overall spending on the legislature since Berkman (2001) finds that there are fewer interests in states with more resource-rich assemblies. I use a measure of overall government spending in real dollars since Strickland (2020b) finds a discernible correlation between spending and lobbying. I include measures of overall policy liberalism (from Caughey & Warshaw, 2015) and innovativeness (from Boehmke & Skinner, 2012) since these measures might predict organization totals in post-1970s years. Since states with direct democracy also have more interests with lobbyists, I include a dichotomous indicator for whether referenda or initiatives may occur (Boehmke, 2005). Nearly all of these measurements are provided by the Correlates of State Policy Project (Jordan & Grossmann, 2020), a compendium of data on state politics and policy. To improve the predictive utility of my analyses, and following Abadie et al. (2015) and Hankins (2020), among others, I also include as a predictor the average number of registered lobby organizations (the outcome variable) within each state from before its reform or treatment. I now turn to each of the three reformed states. I provide a brief history of each reform before reporting the results of each synthetic control analysis.
Massachusetts’ House Cut Amendment
The initial push for legislative downsizing in Massachusetts came during a time of widespread legislative professionalization and reapportionment. State legislatures began to professionalize throughout the 1960s and, for historical reasons, the Massachusetts House was quite large relative to assemblies in other states (Squire, 2012, pp. 297–301). Federal litigation called into question legislative apportionment schemes that did not allocate seats on the basis of population. Since seats in Massachusetts’ House were traditionally allocated based on local governments or counties, reapportionment was required. A group of state representatives formed the Committee for a Modern Legislature and, with the help of the League of Women Voters and other groups, began to advocate for reapportionment and a membership reduction in the house. In 1967, the Committee circulated a petition to cut the size of the house from 240 to 160 members and transfer redistricting responsibilities to an independent commission. Although the Committee gathered the requisite number of signatures, the legislature rejected the measure in February 1970. The Committee and other groups continued their advocacy efforts to downsize the legislature, despite reapportionment already having occurred. Whereas the Governor and citizens’ groups favored the proposed House Cut Amendment, the Speaker and labor unions opposed it (Parker, 1985). In 1971, a modified version of the amendment was introduced in the legislature. The amendment received approval from two legislative sessions, meeting as constitutional conventions, as required. The modified amendment reduced the size of the House from 240 to 160 members but left the size of the 40-member Senate unchanged. The legislature retained its right to redraw district boundaries. The amendment was approved by 79 percent of voters in November 1974, and the reform took effect with the 1978 elections.
Control State Weights for Constructing Synthetic States.
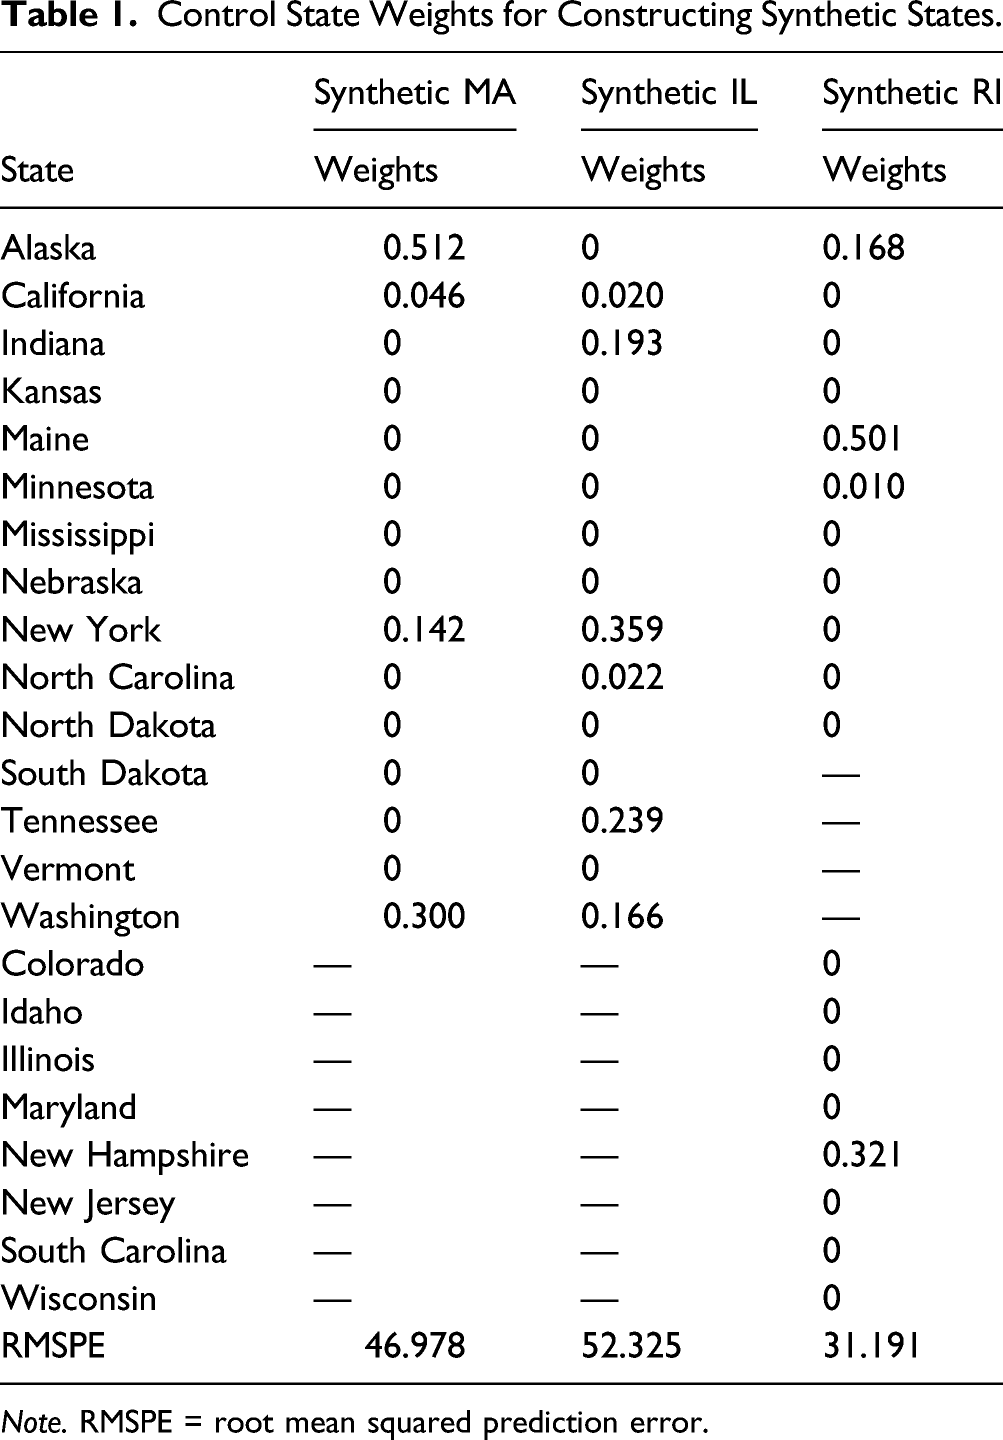
Note. RMSPE = root mean squared prediction error.
Predictor Means Over Pre-Reform Period (Massachusetts).
Using the control states, observations for synthetic Massachusetts generally mirror those of actual Massachusetts. The observations are presented in Figure 1. A vertical line indicates the year when the House Cut Amendment was first implemented, in 1979. While there was a small burst in lobbying activity in that year, it does not persist beyond the next legislative session. Importantly, the number of lobby organizations that registered to lobby in Massachusetts never deviates too far from the numbers generated for synthetic Massachusetts, and synthetic observations do not display a consistent relationship with actual organization totals. This suggests that the House Cut Amendment in that state neither discouraged nor encouraged interests to lobby. In other words, the growth in groups that occurred after 1979 reflects growth that occurred in other, control states that did not experience major legislative reforms. Organized interests in actual and synthetic Massachusetts.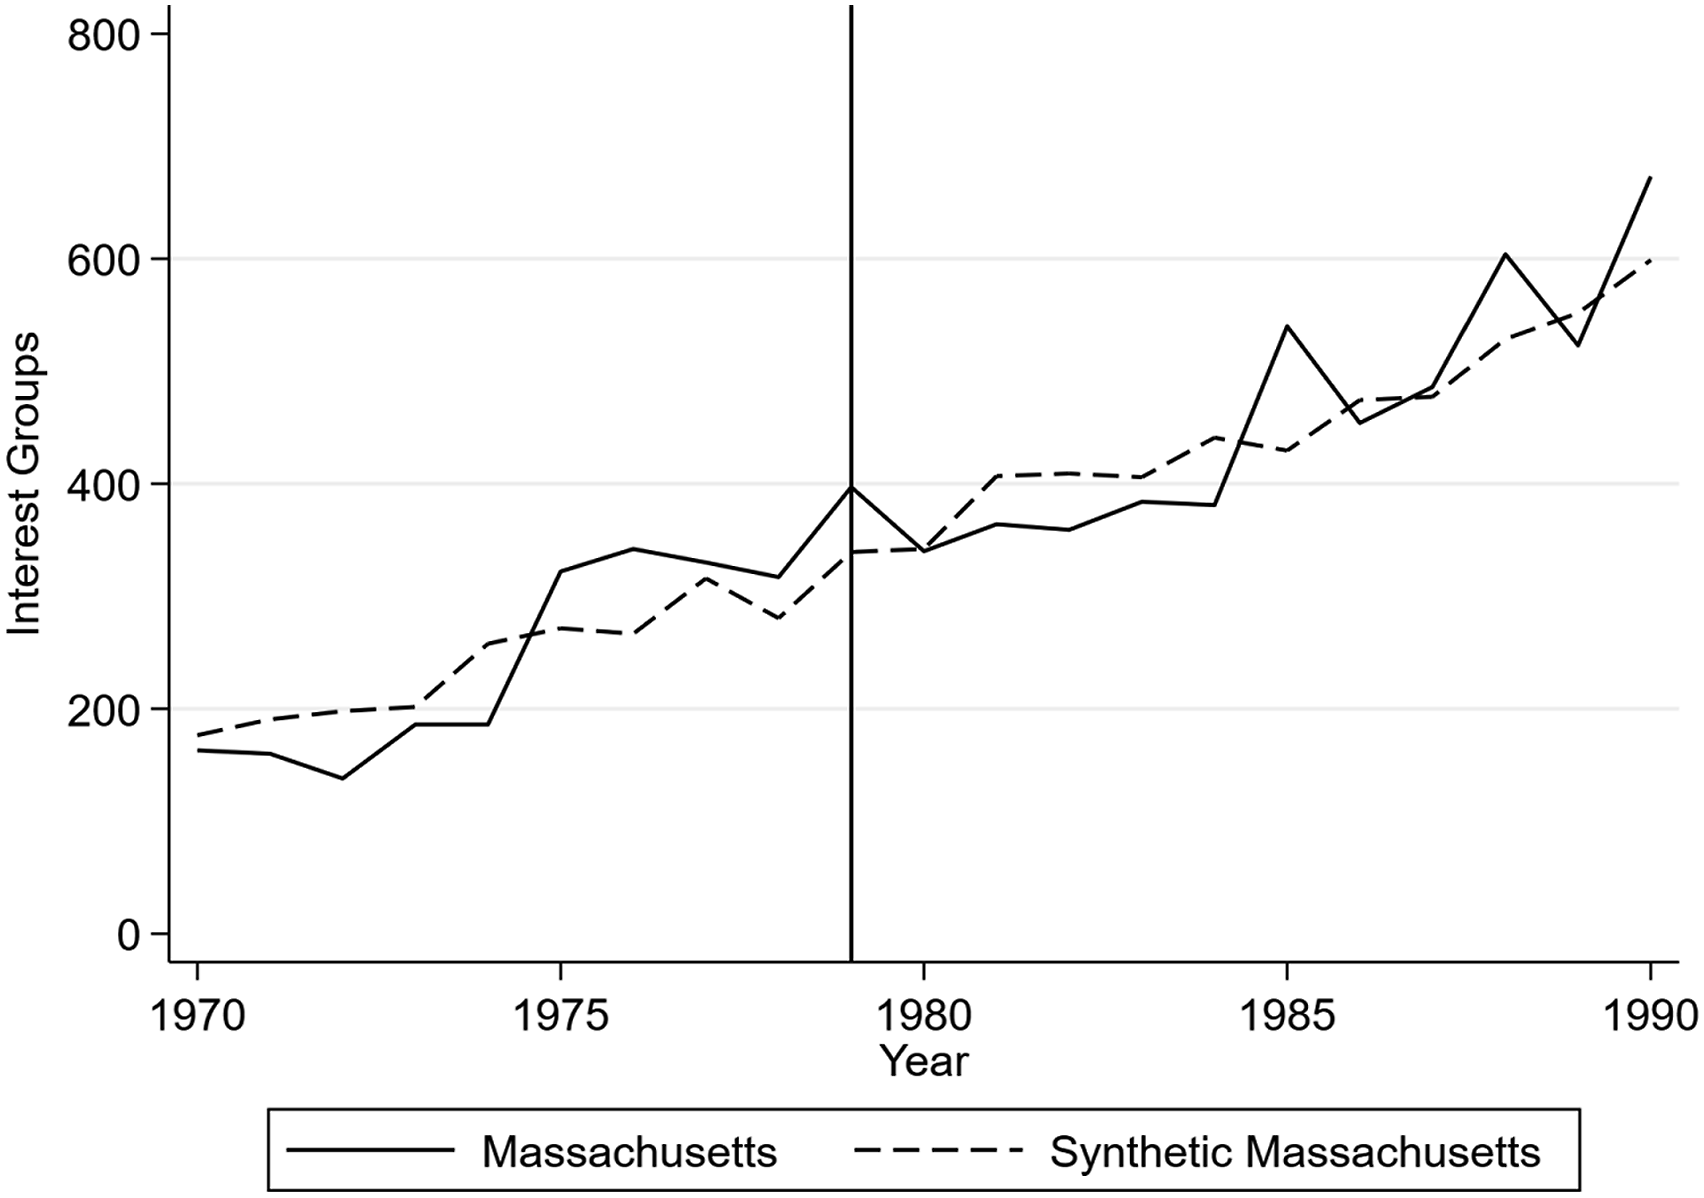
Since more organized interests may have begun to lobby when the Committee for a Modern Legislature first circulated a petition for a downsizing referendum in 1967, I present a longer series of observations from Massachusetts in the Online Appendix. Given the expected role of campaign finance in linking legislature size with interest mobilization, any surge in mobilization more than one election cycle before an actual downsizing event would challenge my narrative. No surge in interest populations occurred in Massachusetts prior to 1970, so it is unlikely that the trends presented in Figure 1 already reflect the effects of a possible downsizing event.
Illinois’ Cutback Amendment
The legislative downsizing event in Illinois came about due to anti-establishment sentiment. In 1978, a lame-duck legislature approved a 40-percent raise in personal pay. This made Illinois legislators the best-paid legislators in the country (DePue, 2017). Riding a wave of anti-establishment sentiment, activist (and later governor) Pat Quinn began to champion an amendment reforming Illinois’ House. Quinn (2001) advocated a “Cutback Amendment” that would reduce the size of the House and exchange MMDs with cumulative voting to SMDs with plurality voting. Quinn emphasized that cutting the size of the House would save money. The AARP and League of Women Voters helped Quinn to gather signatures and encourage Illinois voters to approve the measure. Other groups, and lobbyists generally, opposed the measure (DePue, 2017). The opponents pointed to Massachusetts’ recent House Cut Amendment. In that state, legislative staffing expenses increased. Opponents also claimed that SMD elections would lead to one-party domination of the Illinois legislature. Nevertheless, after receiving the requisite number of signatures, Quinn’s amendment appeared on the November 1980 ballot. Many voters favored dismissing politicians and looked past the transition to SMDs (Lousin, 2010). Sixty-nine percent of them approved the Cutback Amendment. The amendment reduced the number of legislators serving in the House from 177 to 118 and implemented SMDs, thereby doubling the number of districts. The changes became effective with the 1982 legislative elections.
Predictor Means Over Pre-Reform Period (Illinois).
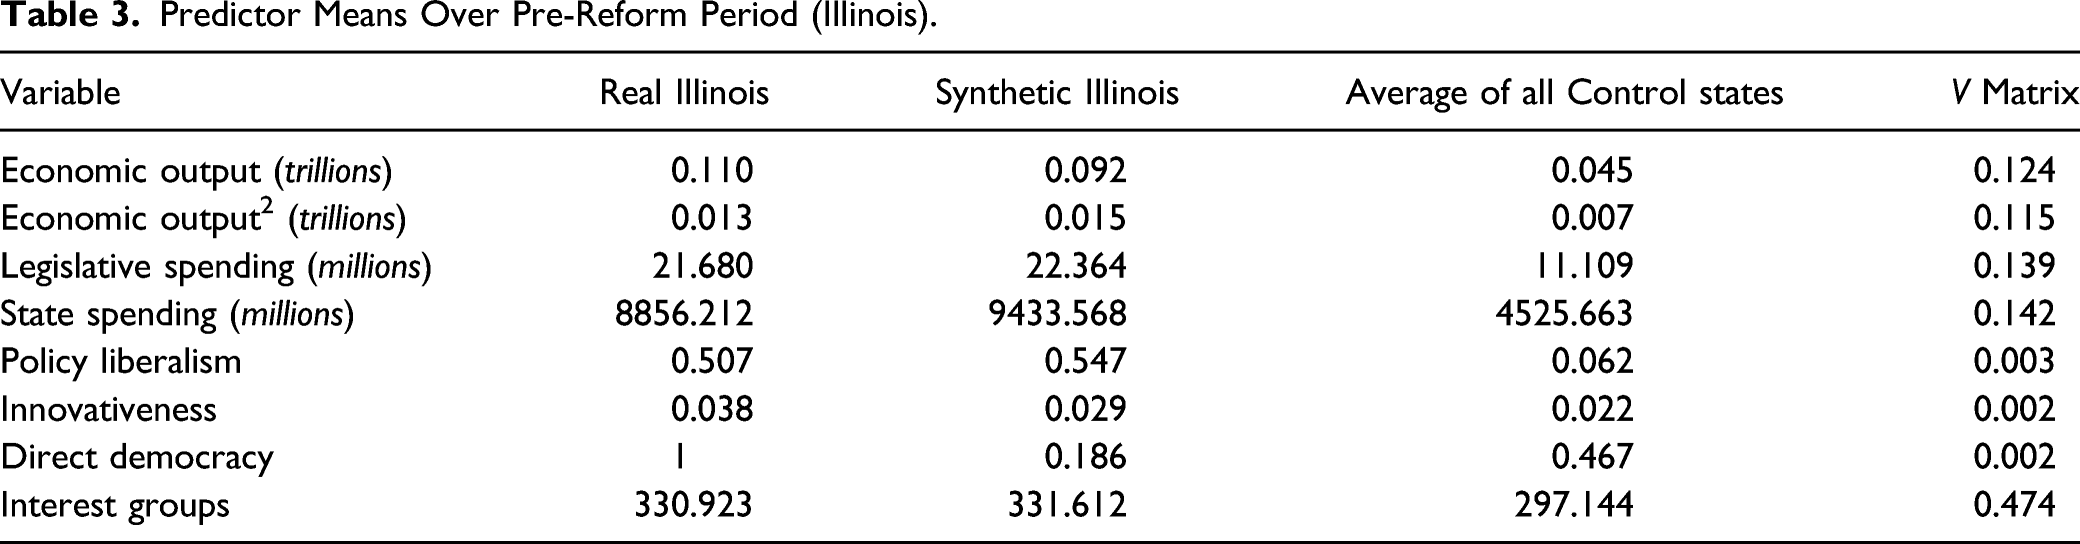
Figure 2 presents the annual organization totals for Illinois and those for synthetic Illinois. A vertical line demarcates the year when the Cutback Amendment was first implemented, in 1983. Two trends are notable from the figure. First, organization totals from synthetic Illinois generally mirror those from actual Illinois prior to the Amendment’s implementation. The fit is substantially better than the fit between actual Illinois and average totals taken from the control states, as shown in the Supplementary Appendix. In 1980, 424 organizations registered to lobby in Illinois. Synthetic Illinois contained 443 organizations. Second, there is a discernible and consistent post-reform difference between observations from Illinois and those from the synthetic Illinois: actual organization totals are consistently higher than synthetic ones. The difference begins with the 1981 legislative session. The difference between actual and synthetic Illinois is greatest in 1985. In that year, actual Illinois contained 253 more organizations than its synthetic version. This difference narrowed somewhat to 191 organizations by 1990. Organized interests in actual and synthetic Illinois.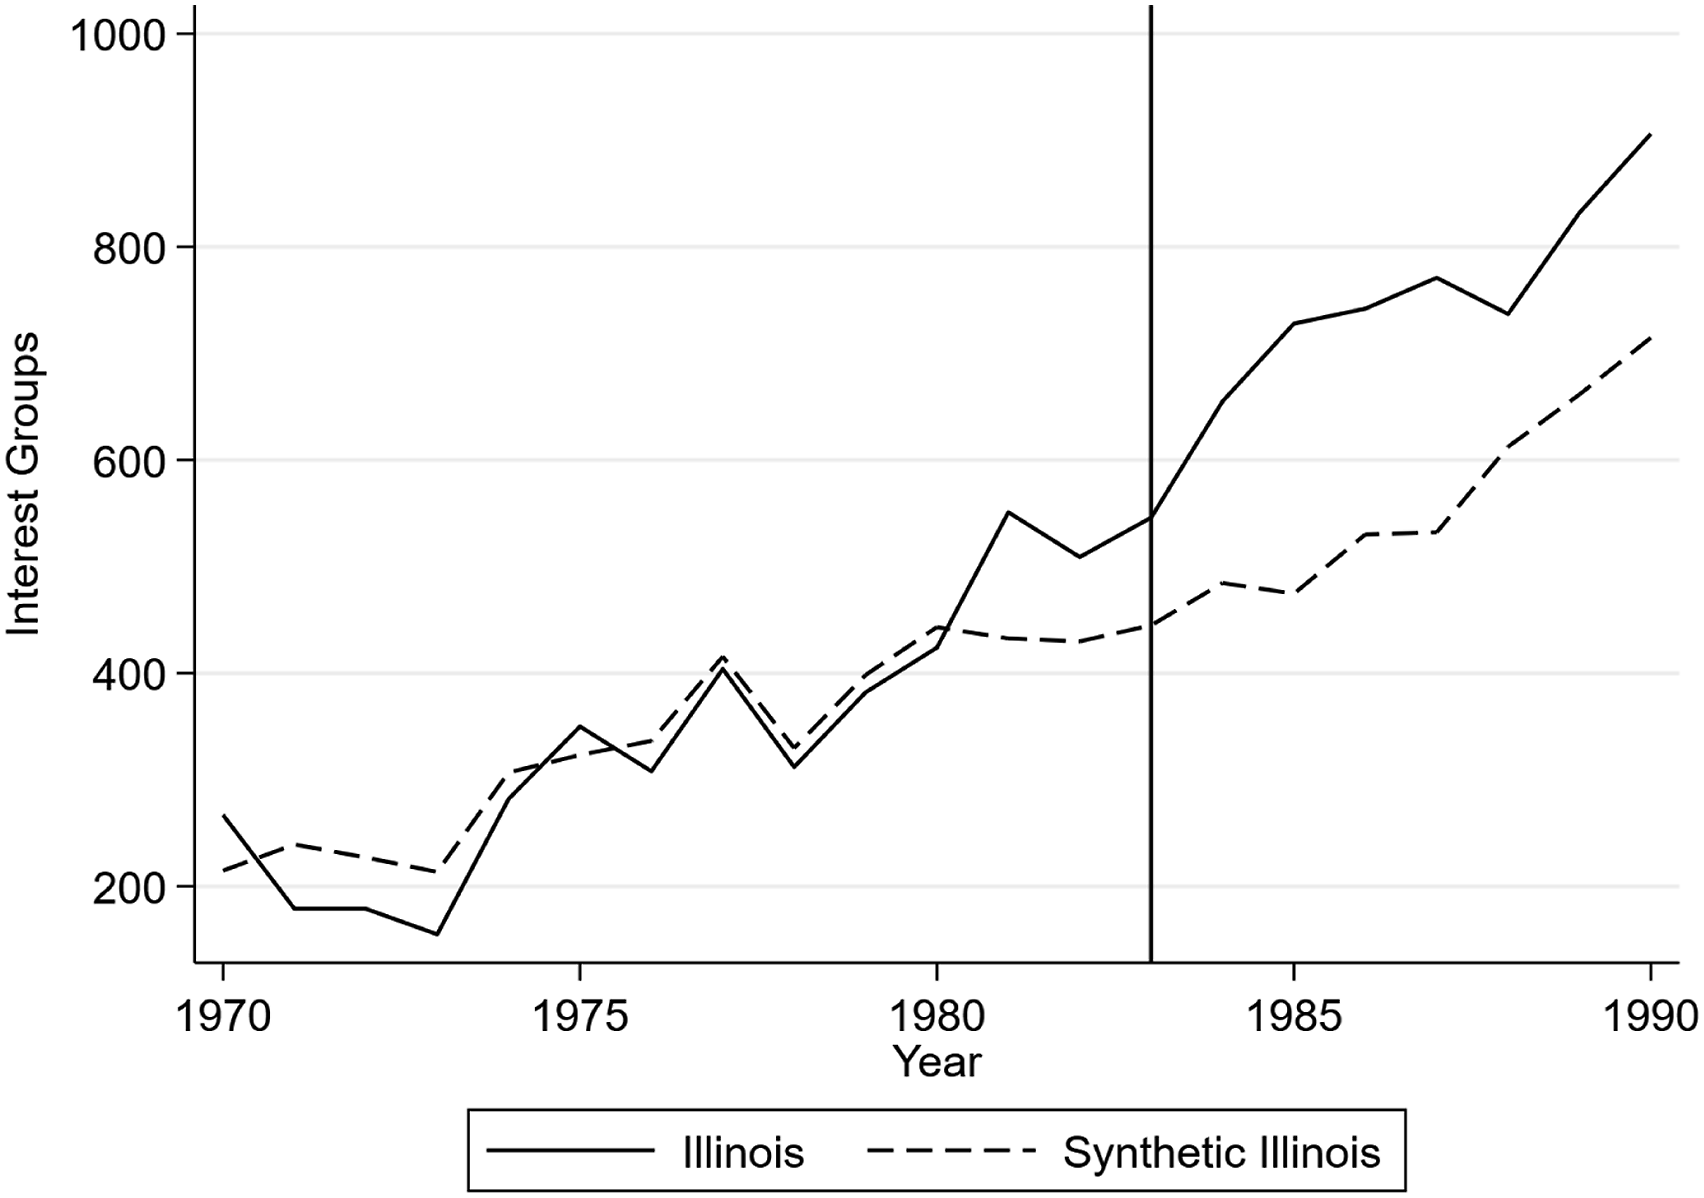
To determine if treatment effects are truly discernible from trends seen in other states, Abadie et al. (2010) prescribe placebo tests. The first test, also implemented by Hankins (2020) in the context of the American states, compares the gap between actual and synthetic observations in the treated state with gaps between control-state observations and their synthetic versions. In other words, every state is modeled as if its legislature was similarly reformed in 1983. If the truly treated state (Illinois) displays a discernibly larger gap than those in control states, then the treatment is said to have had an effect in that state. Figure 3 compares the Illinois gap (in black) to those of other states. Only three other states display comparably-sized or bigger gaps: California, Minnesota, and New York. However, the pre-reform gaps for these three states are significantly larger than the pre-reform gap for Illinois, indicating that the synthetic control method did not predict pre-reform totals in those three states efficiently.
14
Placebo tests for all states.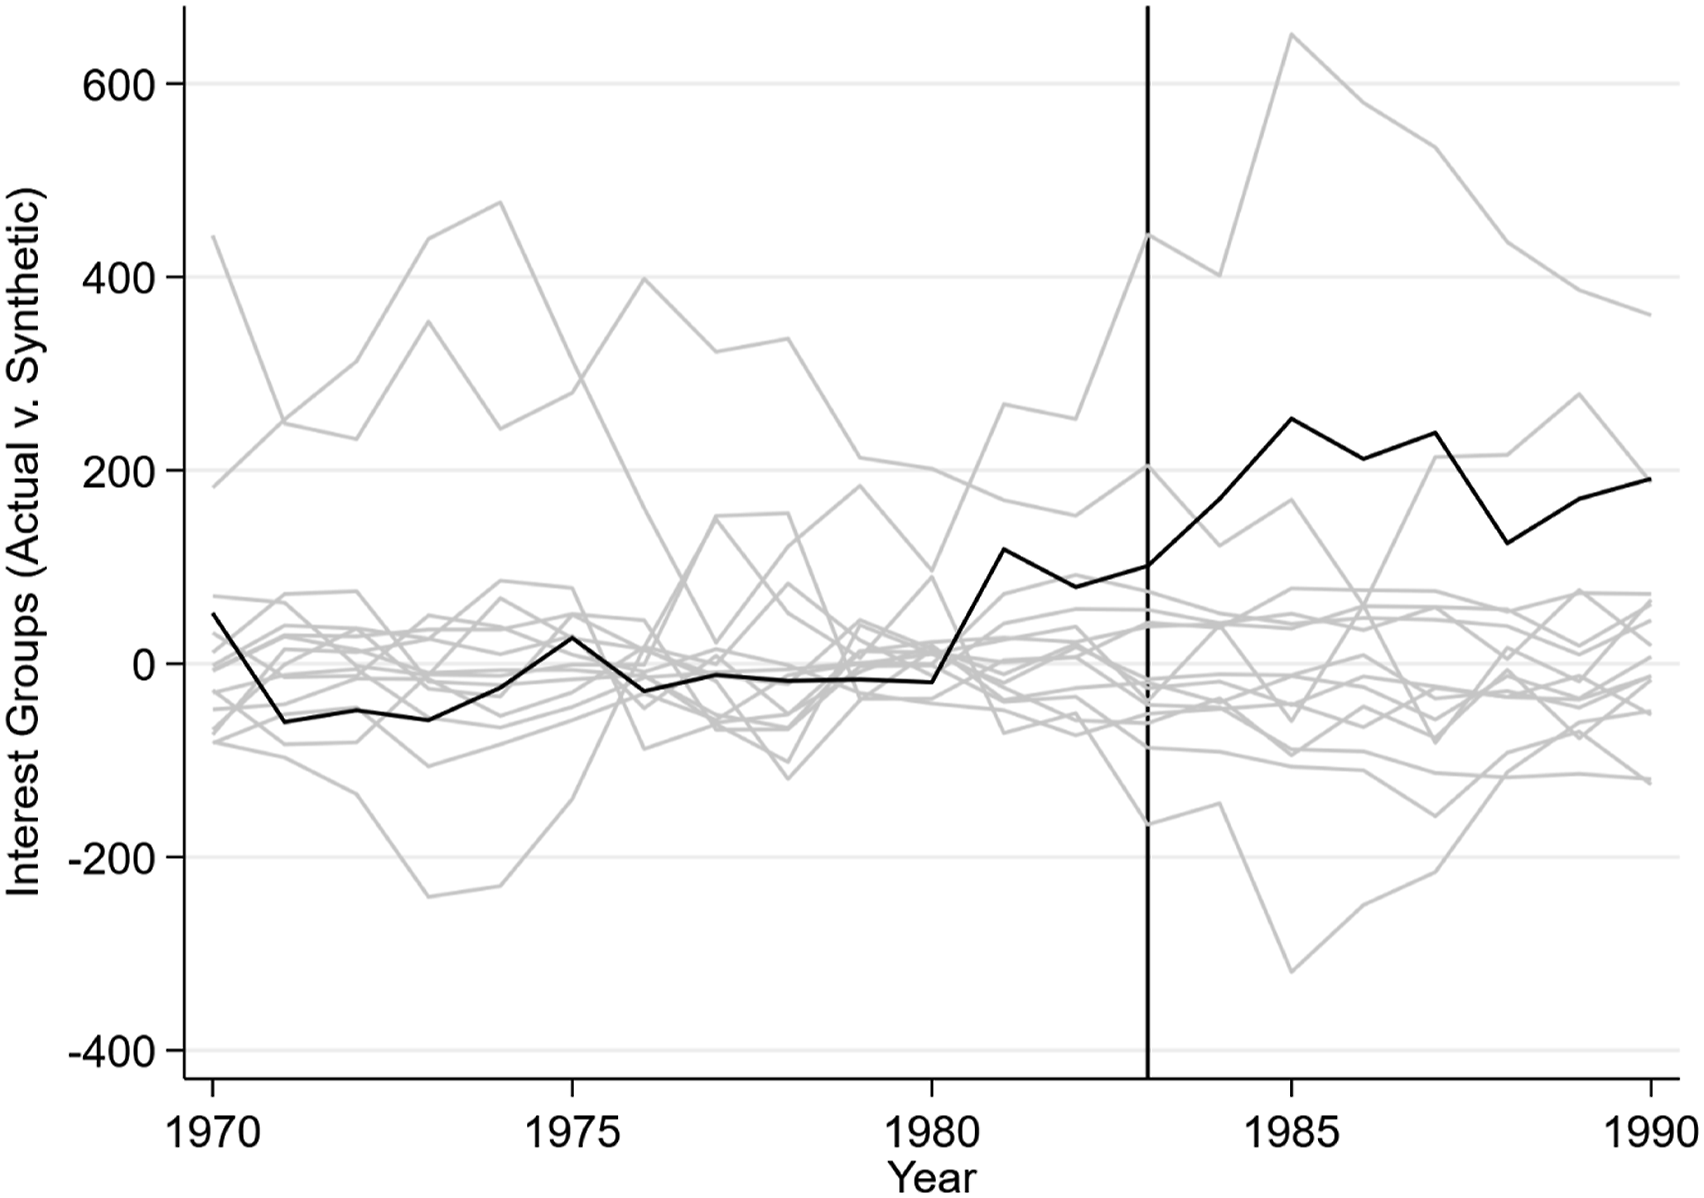
To confirm further if Illinois’s legislative reform actually spurred more organizations to lobby, Figure 4 displays the ratio of post-to pre-reform gaps across the sixteen states in my sample, including the treated state. In Illinois, the post-reform gap is around 3.42 times the pre-reform gap. Smaller differences occur in all other states, and no other state’s ratio approaches Illinois’. (The gap in Illinois would be even larger if one assumed the reform’s effects occurred as early as 1981.) By randomly assigning the treatment, one cannot acquire a gap the size of Illinois’: if one were the pick a state from my sample at random, the chances of choosing a state with a ratio as great as Illinois’ would be 1/16 or 6.25 percent. Post-/pre-treatment RMSPE comparison.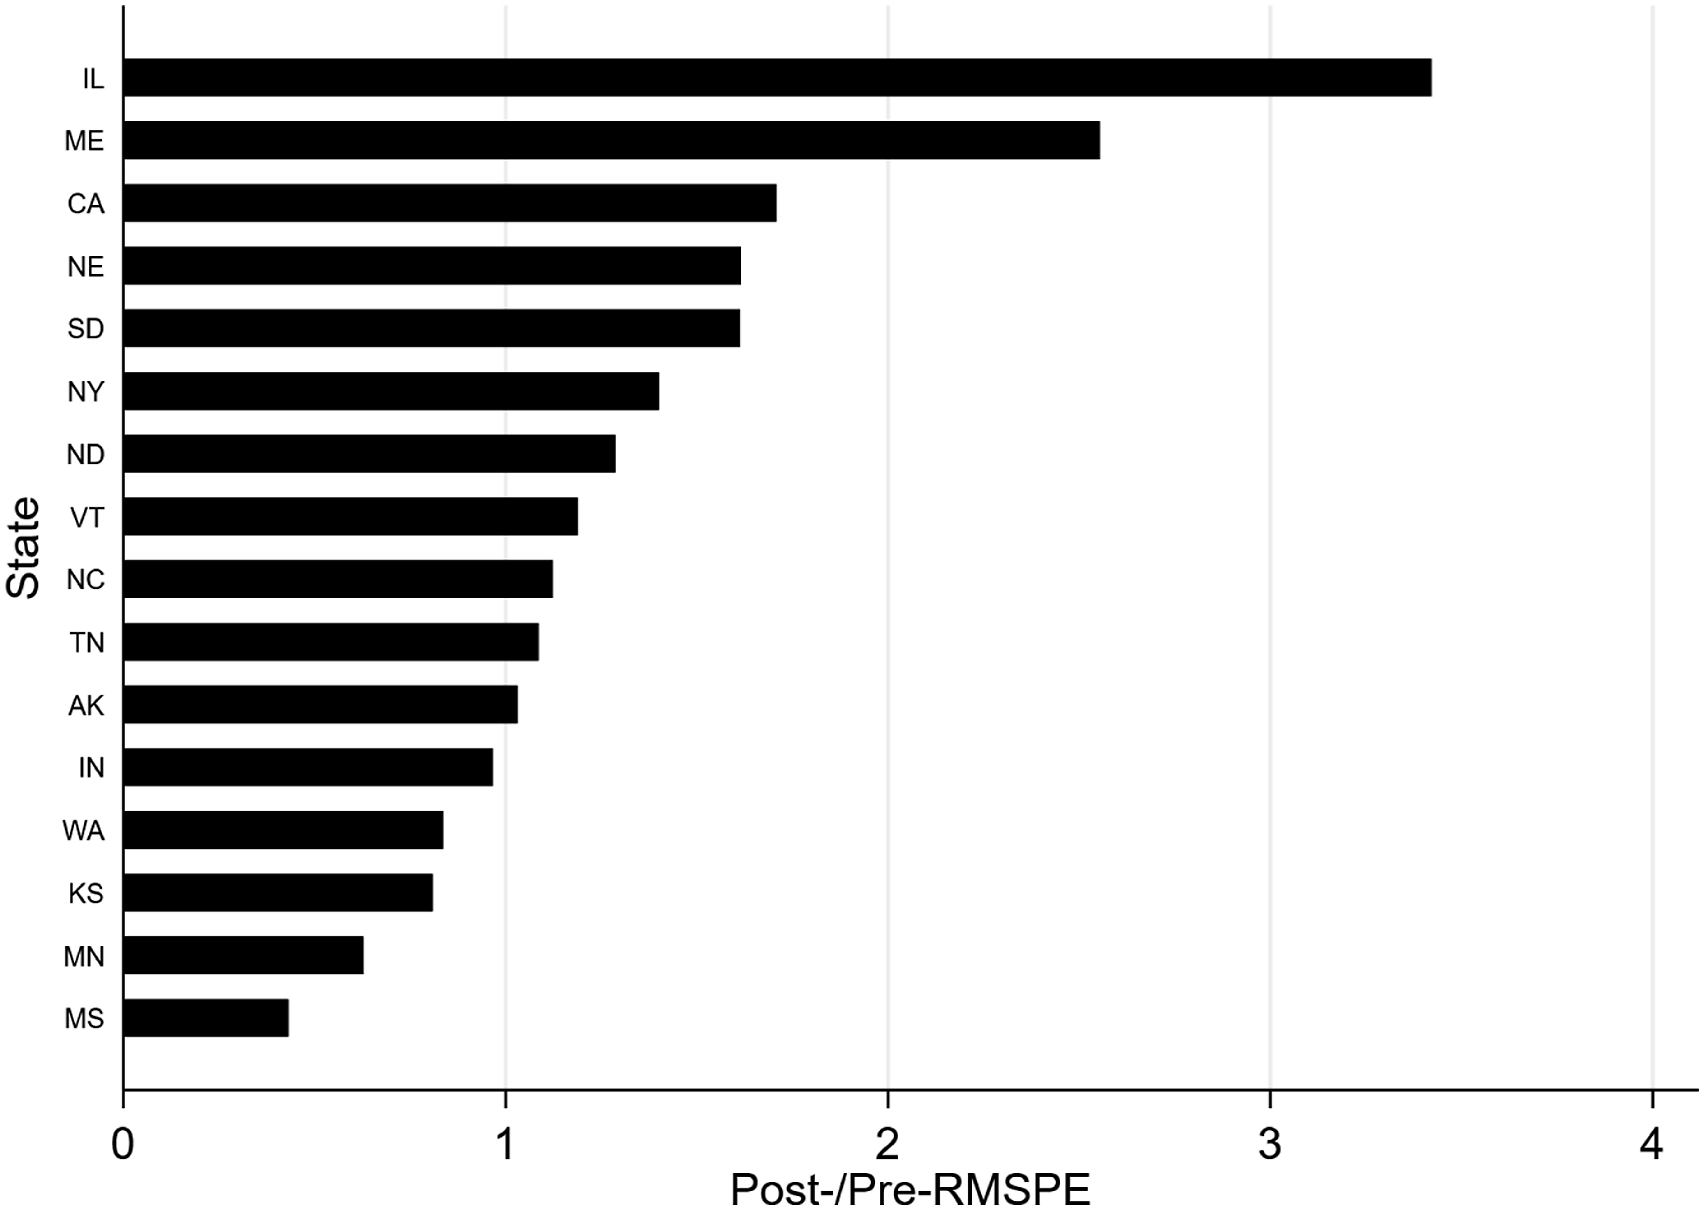
The results presented in Figures 2–4 show that Illinois’s Cutback Amendment resulted in more organizations registering to lobby, and that this was a lasting effect. The 1981 session was the first to occur after the amendment’s approval, and the first to see a discernible increase in lobby organizations. This implies that organizations began to anticipate the effects of the amendment before its actual implementation. The 1981 and 1982 sessions together were a liminal period. Assuming that organized interests could identify which legislators were likely not to be reelected (as Schaller, 1980 argues), the findings provide evidence that additional organizations lobbied legislators. 15
Rhode Island’s Downsizing Amendment
Rhode Island’s legislative downsizing event stems from a banking crisis. In 1991, a bank run caused the failure of the Rhode Island Share and Deposit Indemnity Corporation, a private entity that ensured various banks and credit unions in the state. In response, the governor closed 45 banks and credit unions. The closures affected roughly 300,000 accounts containing roughly $1.7 billion (Bradsher, 1991). The governor’s staff helped organize the Depositors Economic Protection Corporation to sell bonds and repay depositors. The state increased its sales tax to help fund the Corporation (Quint, 1992). Despite these efforts, compensating depositors was a slow process. Some experienced home foreclosures, and the legislature attracted protests (Miller, 1991). In light of this public anger and unrelated corruption scandals, the House Speaker and Senate Majority Leader formed the Blue Ribbon Commission on the General Assembly in September 1992. The commission recommended a smaller, better-paid legislature to curtail political corruption and enhance accountability (Fitzgerald, 2002). The legislature chose to place three of the Commission’s recommendations before voters as a single constitutional amendment (West, 2014). As part of the Downsizing Amendment, the house and senate would both be downsized by 25 percent, legislator pay would be increased to $10,000, and new legislators would no longer qualify for pension benefits. In November 1994, 52 percent of voters in Rhode Island approved the amendment. The amendment’s changes took effect with the 2002 elections: 12 seats were cut from the senate and 25 seats were cut from the house.
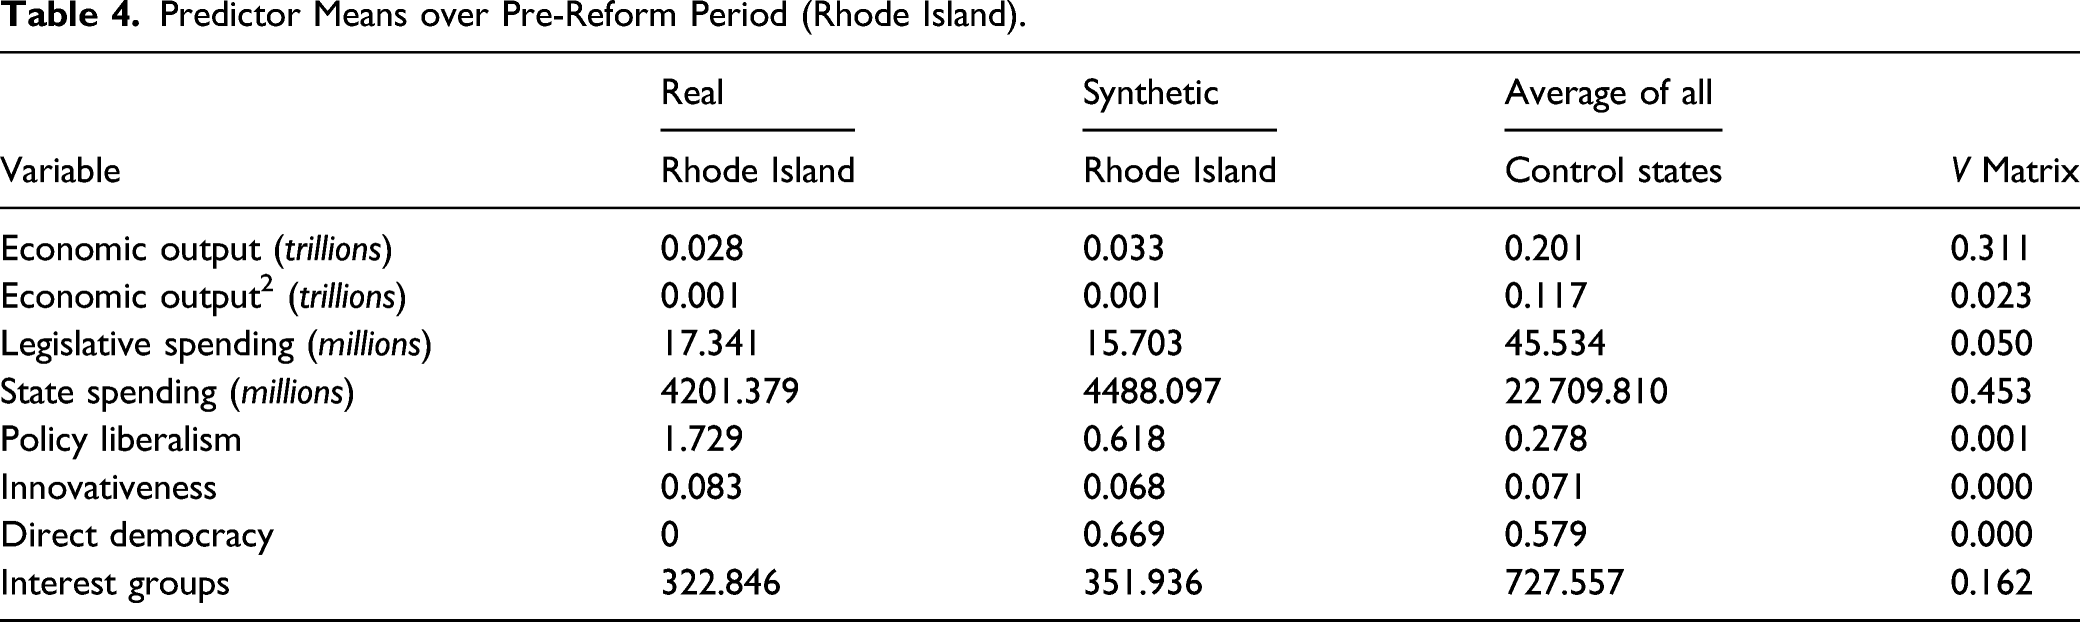
Predictor Means over Pre-Reform Period (Rhode Island).
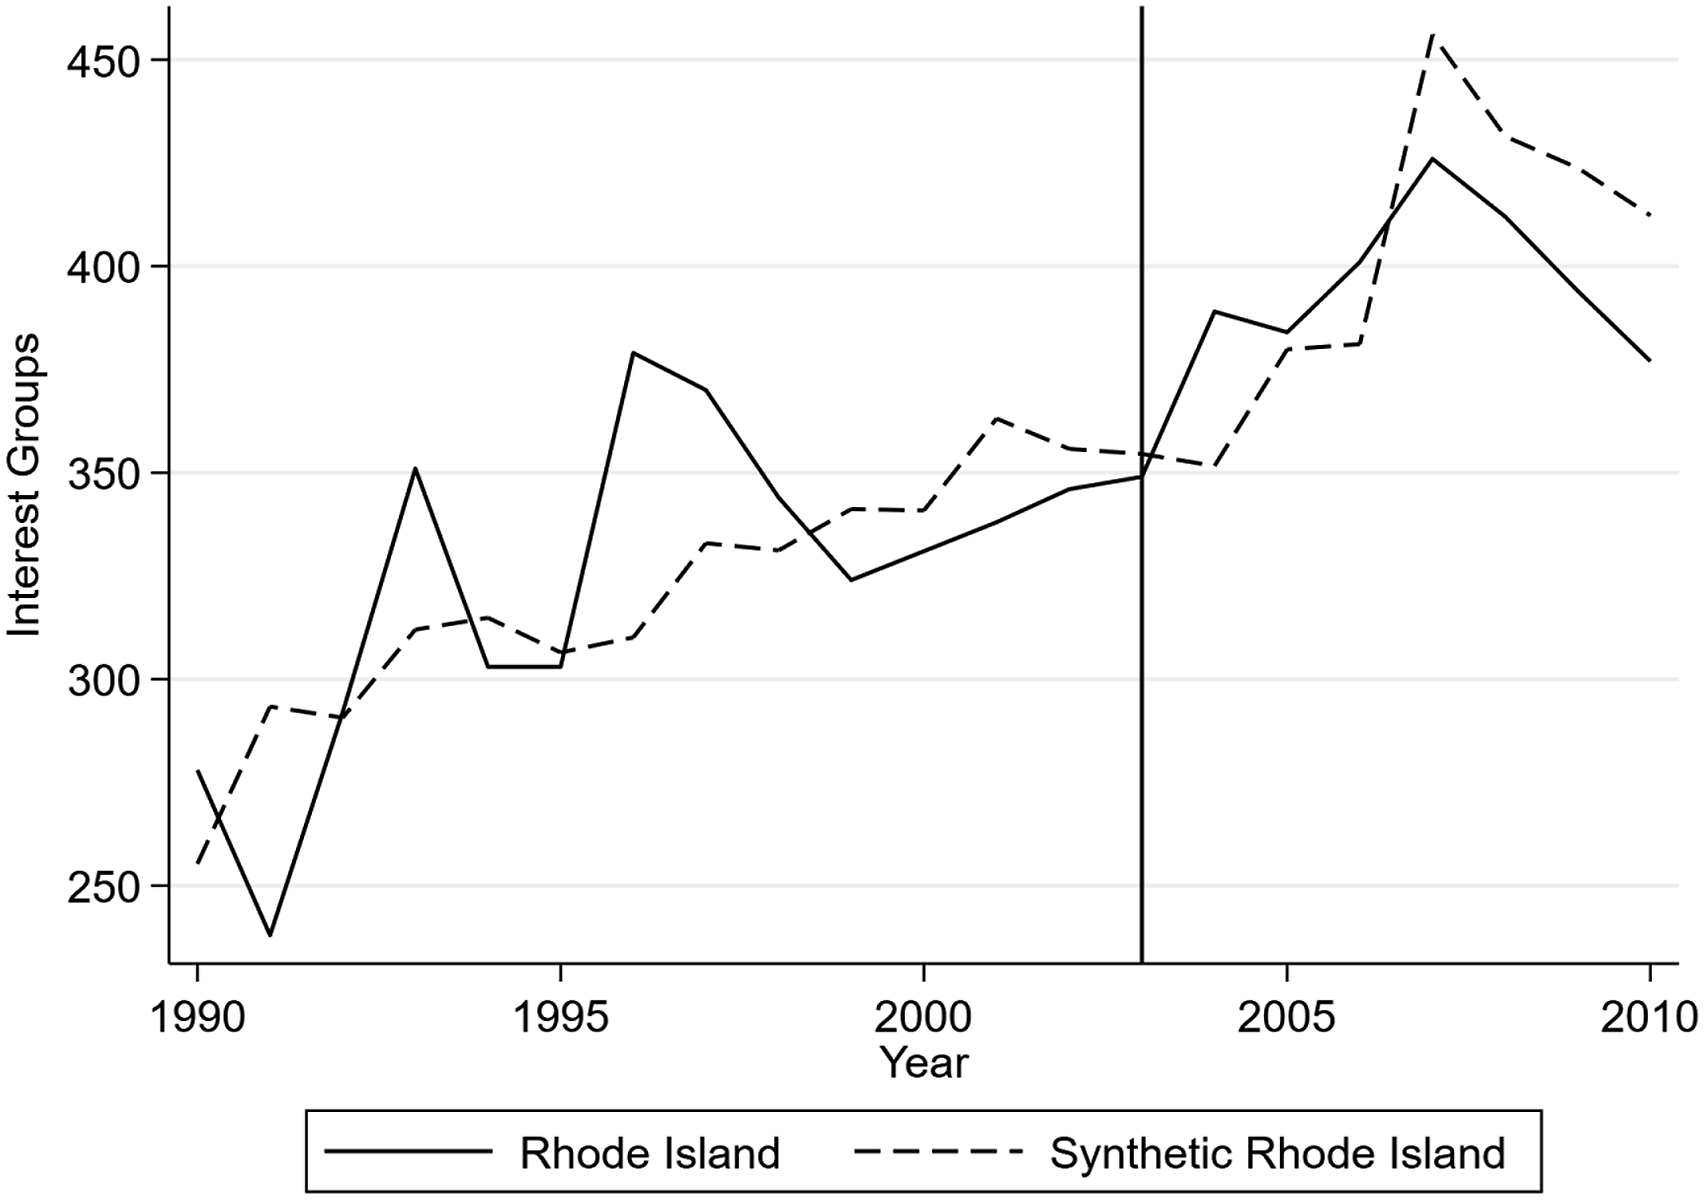
Interest groups in actual and synthetic Rhode Island.
Alternative Explanations for Illinois Lobbying
The results of the synthetic control analyses suggest that legislative downsizing events are not reliable predictors of changes in overall interest populations. Although more organized interests began to lobby Illinois lawmakers, there were no discernible changes in organization totals in Massachusetts or Rhode Island. In this section, I consider alternative explanations for the growth of lobbying in Illinois. The surge in lobbying may be due to reforms other than legislative downsizing. In addition to reducing the House by one third, the Cutback Amendment transitioned the assembly from MMDs with cumulative voting (CV) to SMDs with plurality voting (PV). The elimination of CV and MMDs together may have affected the mobilization of organized interests by changing legislative priorities and the distribution of power within the Illinois House.
Originally, I proposed that changes in legislative assembly sizes could affect interest populations by changing the average cost of campaigns. In particular, when legislatures are made smaller and districts are enlarged, campaigns become more expensive and legislators come to rely more often on lobbyists for campaign donations. This process was presumed to increase overall interest populations by encouraging the political mobilization of interests that can corral monetary resources most efficiently (i.e., businesses, associations of businesses, and professional associations), as in Gerber (1999). This narrative implied that legislative downsizing events lead to more expensive campaigns and increase the upper-class bias of communities of organized interests. While interest populations did increase in Illinois after the implementation of the Cutback Amendment, in the Online Appendix I examine the interests that mobilized anew and find no evidence that monetary-based interests mobilized in higher numbers than other kinds of interests. What factors other than changes in sheer legislature size might explain the sudden, broad-based increase Illinois lobbying?
The history of Illinois’ Cutback Amendment is related to cumulative voting in that state, which has received significantly more scholarly attention than the Amendment itself. The combination of CV and MMDs worked as intended by giving representation to partisan minorities. Beginning in 1870, Illinois house districts each elected three representatives. Each voter cast up to three votes and could vote multiple times for individual candidates. Under the system in most districts, it was best for each party to nominate only two candidates for office. Nominating three candidates threatened to dilute a majority party’s support, and thereby possibly allow a minority party to win two seats (Sawyer & MacRae, 1962). Only in lopsided districts did majority parties have enough voter support to nominate three winning candidates (Goldburg, 1994).
Besides the legislative downsizing, there are two reasons why the Cutback Amendment may have spurred additional organizations into lobbying. Both reasons are related to party politics within the House. Cox (1990, pp. 919-27) argues that CV promotes greater ideological variance among candidates for office than PV. This was the case in the Illinois House: it was commonplace for liberal Republicans from Chicago and conservative Democrats from downstate, rural Illinois to be elected (Santucci, 2006). These legislators represented the minority party in each district, operated more independently of their party caucuses than others, and often prioritized different issues. With the House’s transition to SMDs with PV, however, these minority-party, independent legislators were no longer electable (Schaller, 1980). Ideological variance within both parties of the House (but not the Senate, which had employed SMDs with PV all along) decreased as party outsiders (e.g., liberal Republicans and conservative Democrats) lost or did not seek reelection (Adams, 1996).
Partly in accordance with Kunicová and Rose-Ackerman’s (2005) account, the elimination of minority-party legislators within each district may have reduced accountability and allowed organized interests seeking particularistic benefits to achieve more influence. Schaller (1980) provides more detail on this point. He found that the legislators least likely to be reelected in the post-Cutback House were those who received moderate ideological ratings from various interest groups, particularly the Illinois Chamber of Commerce, Manufacturers’ Association, AFL-CIO, and Federation of Teachers (so, the independent legislators were not particularly strong allies of organized interests). Many of them were labeled “good-government” reformers (i.e., favored environmentalism, governmental reform, education, and civil liberties) by the League of Women Voters. As a result of the downsizing, however, these legislators were removed from office so that there were fewer good-government advocates within the House who could campaign against corruption when seeking reelection (including within constituencies that overlapped with those of special-interest allies). 18 Lauber (1980) argues that the independent lawmakers the Cutback removed often opposed “pet bills” (i.e., particularistic legislation) introduced by members of party machines. It may be the case that, with the Cutback Amendment’s implementation and the removal of good-government advocates from the legislature, more organized interests recognized opportunities for influence and likewise hired lobbyists.
Greater party homogeneity in the House might have also encouraged lobbying by concentrating power in the hands of chamber leadership. With the removal of independent legislators and increase in party unity, partisan leaders in the House found it easier to corral votes and campaign resources (Carden, 2009; DePue, 2017; Kuklinski et al., 2001). As campaigns became more expensive, legislators also needed to rely more on legislative leaders for fundraising support (Man, 2000). For these reasons, Rose (2010) argues that the Cutback Amendment increased corruption in Illinois. Whereas lobbyists formerly solicited a variety of lawmakers, they focused much more often on House leaders after the amendment’s implementation (Kuklinski et al., 2001, p. 60). It may be the case that more organizations suspected that party unity in the House, in combination with strong leadership, had potential to affect their interests. Likewise, lobbying and building relationships with legislative allies may have served as a form of insurance against potential policy losses.
While this study does not pinpoint the source of Illinois’ lobby growth, the results of my synthetic control analyses clearly suggest that legislative downsizing alone does not affect numbers of organizations that lobby lawmakers. Other factors likely precipitated the growth of lobbying in Illinois. The legislatures in Massachusetts and Rhode Island did not experience electoral changes similar to those in Illinois. Among state legislatures, Illinois’ is the only one to have ever used CV to elect legislators (Rishel, 1997). Also, Massachusetts and Rhode Island eliminated MMDs years before their legislatures were downsized (Niemi et al., 1985). 19
Discussion
For decades, social scientists have lamented that organized interests (i.e., those that have overcome the free-rider problem and organized for political action) tend to reflect the upper class of American society (Olson, 1965; Schattschneider, 1960; Schlozman et al., 2012). Writing partly in response to this body of research, other scholars have examined the demographic or institutional contexts that allow for more or less lobbying by organized interests, and the resulting effects on interest diversity. For example, there are more interests with registered lobbyists in larger states (Lowery & Gray, 1995) with citizen legislatures (Berkman, 2001), direct democracy (Boehmke, 2005), and more state spending (Strickland, 2020b). Direct democracy spurs more citizen interests in particular into mobilizing. This study asked a related question: does legislature size affect numbers of organized interests? I proposed that there are more monetary-based interests active in legislatures with larger districts where members raise more money for reelection efforts. I conducted synthetic control analyses using data from the American states and, based on the results, concluded that downsizing events do not generally precede increases in interest populations. While legislature size is unrelated to organization numbers, institutions designed to induce intraparty diversity may discourage lobbying by organized interests.
The absence of findings is surprising given that previous studies found a discernible correlation between campaign costs and district size, and that campaign finance and lobby activities are intimately related. While legislature size and lobbying may not be related, there may be other circumstances in which a link may be found. It may be the case that the changes in district size in Massachusetts, Illinois, and Rhode Island were insufficiently large enough to induce an effect in interest populations. Political scientists have collected enough campaign finance data to determine that spending is higher in larger districts, but few studies have estimated a “size effect” using regression analysis: as in, how many additional dollars are spent, on average, in large versus small districts. Most studies (e.g., Hogan, 2000; Hogan & Hamm, 1998) predict campaign spending on a per voter basis, thereby disregarding entirely the relationship between district or constituency size and total spending. Powell (2012, p. 42), however, provides a rough impression of the relationship between district size and campaign spending and, according to her findings, while there are significant differences in average fundraising across states based on district sizes, the linear relationship is somewhat flat: major adjustments in district size would be needed within a state to affect campaign fundraising even slightly. Based on this trend, even if legislative downsizing events in Massachusetts, Illinois, and Rhode Island affected campaign finance and, by extension, interest populations, the substantive effect may have been too small to be detected.
Numerous questions related to legislature size and political influence remain unexamined and unanswered. It remains to be seen if organized interests in Massachusetts, Illinois, or Rhode Island donated more or fewer dollars or lobbied more or less intensely in response to legislature size adjustments. Such activities may also be indicative of interests perceiving greater opportunities for influence. It also remains unknown if the changes in legislature size affected the nature (particularistic vs. collective) of proposals introduced and enacted. Campaign donations tend to influence legislative agendas (Powell, 2012). Regardless, even if my findings do not provide support for existing accounts of legislative size and lobbying, they at least imply that institutions may be structured in a manner that discourages organized interests from lobbying.
Supplemental Material
sj-pdf-1-apr-10.1177_1532673X211063214 – Supplemental Material for Legislature Size and Interest Mobilization: The Effects of Institutional Change
Supplemental Material, sj-pdf-1-apr-10.1177_1532673X211063214 for Legislature Size and Interest Mobilization: The Effects of Institutional Change by James M. Strickland in American Politics Research
Footnotes
Declaration of Conflicting Interests
The author(s) declared no potential conflicts of interest with respect to the research, authorship, and/or publication of this article.
Funding
The author(s) received no financial support for the research, authorship, and/or publication of this article.
Supplemental Material
Supplemental material for this article is available online.
Notes
Author Biography
References
Supplementary Material
Please find the following supplemental material available below.
For Open Access articles published under a Creative Commons License, all supplemental material carries the same license as the article it is associated with.
For non-Open Access articles published, all supplemental material carries a non-exclusive license, and permission requests for re-use of supplemental material or any part of supplemental material shall be sent directly to the copyright owner as specified in the copyright notice associated with the article.