
Abstract
Why do some members of Congress vote more on the extremes of their party than others? I argue that lawmakers representing more homogeneously white districts have greater electoral incentive to moderate their voting records, since the two parties compete more for support of white voters than for the support of minority voters. I provide evidence using roll-call votes from the U.S. House and Senate. I find members representing more homogeneously white districts have more moderate voting records, a finding that holds for Democrats and Republicans. I explore two potential mechanisms: legislator responsiveness and electoral punishment. While legislators do not seem to adjust their voting behavior in response to short-term changes in district racial composition, more homogeneously white districts are found to assess larger vote share penalties on more extreme candidates in general elections. The findings have implications for our understanding of race, representation, and electoral accountability.
What leads some members of Congress to vote more on the extremes of their parties than others? The two parties have polarized, with lawmakers holding voting records that are more extreme on average and more homogeneous within party caucuses than lawmakers in prior decades (e.g., Lee, 2009; McCarty et al., 2006). However, important variation in the extremity of individual lawmakers’ records remains to be explained. In particular, constituencies can serve as a moderating influence on members’ votes. Electoral considerations at home strongly influence lawmakers’ decisions (Fenno, 1977; Kingdon, 1977; Mayhew, 1974) and constituencies often prefer more moderate representation than their partisan representatives provide (Bafumi & Herron, 2010; Masket & Noel, 2012; though see Ahler & Broockman, 2018). Scholars consistently find that voters penalize lawmakers who vote farther to the extremes of their parties (Ansolabehere et al., 2001; Canes-Wrone et al., 2002; Carson et al., 2010; Erikson, 1971). This literature, grounded in spatial theories of representation (Downs, 1957), focuses narrowly on voter and lawmaker ideology.
However, social group ties also inform the actions of both voters (Achen & Bartels, 2016; Berelson et al., 1954; Campbell et al., 1960) and lawmakers (Bratton & Haynie, 1999; Broockman, 2013). Group attachments to party coalitions can allow lawmakers to engage in more ideologically extreme representation of their districts, even if that representation is out of step with constituency preferences (Glazer et al., 1998). This dynamic becomes evident examining the role of race in U.S. elections. The two parties’ coalitions have increasingly sorted along racial lines (Hajnal & Lee, 2011; Mason, 2018). When voters are committed to one party on the basis of racial group ties, legislators in both parties have greater latitude to vote on the extremes in office. Voters in uncompetitive or “captured” groups are unlikely to punish extreme in-party incumbents by supporting out-party challengers, particularly if they lack information about the ideological distance between them and their representatives (Frymer, 1999; Griffin & Flavin, 2007). Likewise, out-party incumbents have little incentive to moderate their own records to appeal to captured voters, since moderating is unlikely to win their votes. However, to a greater extent than other groups, whites remain split between the two parties’ coalitions. As a consequence, more homogeneously white constituencies should be more likely to vacillate in supporting candidates of both parties, all else equal. Legislators representing such districts should be more constrained to hold moderate voting records. If they do not, they risk homogeneously white constituencies shifting their support to out-party challengers.
I provide evidence using data summarizing individual lawmakers’ roll-call votes from the 112th and 113th House and Senate. The evidence suggests that representatives of more homogeneously white constituencies hold more moderate voting records, even when controlling for key variables like district ideology and electoral competitiveness. I explore two mechanisms that might explain this association: incumbent responsiveness and electoral punishment. Using a simple redistricting design to test the incumbent responsiveness mechanism, I find that members of the U.S. House who came to represent more white voters after the 2012 round of redistricting did not subsequently moderate their roll-call votes. A test of the electoral punishment mechanism using DIME data (Bonica, 2014) yields mixed results. I find that in more homogeneously white constituencies, extremists suffer larger penalties in vote shares than in more racially diverse districts. However, the findings do not show that extreme candidates are more likely to lose their elections as the share of white constituents increases. The results suggest eliminating incumbent responsiveness as a potential mechanism, but leave open the possibility that electoral punishment of extreme candidates by white constituents contributes to lawmaker moderation.
Though primarily descriptive, the results contribute to our understanding of the relationship between legislative voting and race. It is well-established that issues of race have helped to divide the two parties over the last half century (Carmines & Stimson, 1989; Miller & Schofield, 2003). While studies often examine how district racial composition affects votes on key issues important to a minority group (e.g., Canon, 1999; Casellas & Leal, 2013), few connect district racial composition to overall voting records. The findings suggest that studies of electoral responsiveness should more thoroughly consider how racial coalitions of party support shape lawmakers’ behavior beyond racial and racialized issues.
Constituent Ideology, Social Groups, and Legislative Voting
The early 21st Century finds Democrats and Republicans in Congress historically polarized. Lawmakers cast more party-line votes, resulting in voting records that on average appear more extreme and more homogeneous within parties than in prior eras (Aldrich et al., 2014; Lee, 2009). Pressure to cast more extreme votes comes regularly from intense in-party policy demanders (Layman et al., 2010), ideological donors (Barber et al., 2017), and party caucus leaders (Harden & Carsey, 2012). In reaction to these polarizing dynamics, potential candidates’ personal considerations of the costs and benefits of serving in office lead moderates to decline to run for office while ideologues fill their seats (Hall, 2019; Thomsen, 2017). The result is a Congress with few dedicated moderates and many strong partisans.
Even as the parties polarize in the aggregate, individual legislators may face electoral penalties for extreme voting behavior. Constituencies often prefer more moderate representation than lawmakers voting on party extremes provide (Bafumi & Herron, 2010; Masket & Noel, 2012; though see Ahler & Broockman, 2018). As a result, lawmakers may suffer electoral penalties for voting out of line with constituency preferences. Incumbents who vote too often on the extremes face a higher risk of losing reelection (Ansolabehere et al., 2001; Canes-Wrone et al., 2002; Carson et al., 2010; Erikson, 1971) or drawing challengers (Birkhead, 2015; Hogan, 2008). Likewise, moderate candidates tend to win larger vote shares in general elections and win office at a higher rate than their more extreme rivals from primary elections (Hall, 2015). For many lawmakers, electoral pressures in their home districts provide a compelling motive for moderation.
Constituencies will vary in their propensity to punish extreme voting behavior from their representatives. Districts in which average constituency opinion is extremely liberal would be less likely to punish extremely liberal representatives than a more moderate constituency; the same logic would apply to conservatives. Studies of constituency representation consistently show a strong association between district ideology and the voting behavior of its representative (e.g., Clinton, 2006; Tausanovitch & Warshaw, 2013). Ideologically heterogeneous districts also create electoral conditions that allow more extreme legislators to hold office (Fiorina, 1974; Levendusky & Pope, 2010) and give legislators leeway to vote with party leaders (Harden & Carsey, 2012).
In addition to constitutent ideology, the representation of social groups factors in to lawmakers’ decisions about roll-call voting (Bailey & Brady, 1998; Bishin, 2009; Miler, 2010). By social group, I mean a set of people who share a common identity that has some relevance to politics. Social groups may hold similar policy preferences, but need not hold uniform ones (Karol, 2009).
A prominent line of thinking holds that parties function as coalitions of social groups that create potential popular majorities, enabling those groups to be represented within government institutions (Bawn et al., 2012). Voters who identify with party-aligned social groups tend to vote in majorities, though not uniformly, for their party’s candidates. Social group attachments shape voter behavior in addition to, but independently from, voter ideology as group identity and consciousness come to bear in vote choice (Berelson et al., 1954; Conover, 1988). The group’s electoral support may be premised on a small set of issues important to the group (Miller et al., 1981). Group voters may also weigh considerations beyond issues, like group norms (White et al., 2014) or feelings of exclusion (Kuo et al., 2017). Given the inability of many Americans to align their issue positions in an ideologically consistent manner (Converse, 1964) and their propensity to arrive at issue positions after forming partisan attachments (Layman & Carsey, 2002), vote choice for many Americans may be more an expression of group identity or symbolic attachments than of ideological preference (Green et al., 2002; Achen & Bartels, 2016, though see Abramowitz & Saunders, 2006). Increasingly, Americans are socially sorting into parties such that their group identities more reliably predict their party identification (Mason, 2018).
As a result, legislators’ voting records should reflect in part the social group composition of their districts. While some support comes from voters with shared ideological preferences, support will also come from social groups aligned with the legislator’s party independently of ideological or policy considerations. Voters may also support candidates based on the social groups the candidate is perceived to represent (Boudreau et al., 2019; Fraga & Leal, 2004; Glazer et al., 1998; Kinder & Dale-Riddle, 2012). A voter may prefer candidates who associate themselves with or appeal to members of a voter’s ingroup. Conversely, a voter may reject candidates who represent an outgroup, particularly if the voter feels animus towards the outgroup.
Group-oriented voting could insulate more extreme candidates from electoral loss. With no group-based considerations, as in Downs’ (1957) original median voter theorem, legislators would have electoral incentives to moderate their voting behavior toward a median voter in their district. In doing so, lawmakers would increase their chances of winning over voters who may reasonably choose to support the other party’s candidate based on shared ideological preferences.
When group-based considerations enter into voters’ choices, a lawmaker's extreme voting record becomes less of an electoral liability. Group-oriented voters would remain more committed to one party’s candidates, regardless of the extremity of those candidates. Even if those voters were ideologically moderate (or inconsistently aligned on the issues—see Broockman, 2016) and the opposing party’s candidate moderated their own positions, voters in a social group committed to one party’s coalition would be unlikely to switch their support to the opposing party’s candidate. Seeing no opportunity to persuade ideologically moderate out-party voters in a committed social group, or facing no electoral penalty for extreme voting from groups aligned with their own party, incumbents could continue respond to demands from in-party activists that pull their voting records towards the extremes. Consequently, voters in party-aligned social groups may receive extreme policy representation without ever demanding it if they decline to penalize it at the ballot box.
Stated another way, when a social group votes consistently for a given party, lawmakers in both parties will encounter less electoral pressure to moderate their voting records to win that group’s votes. Conversely, if either party can win votes from a social group, lawmakers in both parties have incentive to moderate their records or face potential electoral penalties from voters in that group who are willing to support a more moderate opponent.
Whites as a Two-Party Competitive Social Group
The case of race provides a good starting point to test the argument. Racial groups are quintessential social groups and feature prominently in U.S. party politics (Kinder & Dale-Riddle, 2012). The two parties frequently divide on issues of race (Abrajano & Hajnal, 2015; Carmines & Stimson, 1989; Key, 1949). The theoretical argument holds that legislators should be more likely to vote on the extremes when representing social groups that are committed to one party’s coalition. Conversely, legislators should be more constrained from voting on the extremes when larger shares of their potential voters belong to social groups that are two-party competitive. Applied to the case of race, legislators should be more likely to moderate their votes in constituencies that contain more white voters, all else equal.
Republican and Democratic candidates compete to varying extents for support from different racial groups. Whites comprise the vast majority of the Republican coalition while Democrats rely on a coalition of whites and nonwhites (Zingher, 2018). Republicans’ attempt to attract votes from conservative whites in the South in the 1960s and 1970s led to that party’s adoption of a conservative platform on issues of race (Carmines & Stimson, 1989). Contemporaneously, African Americans swung to the Democratic Party to the point of electoral capture (Frymer, 1999). Latino and Asian American voters do not support the Democrats as strongly as African Americans, but these groups give the majorities of their votes to Democratic candidates as well (e.g., Hajnal & Lee, 2011). The extent to which Republican candidates are willing to compete for Latino and Asian votes remains questionable. Republicans made symbolic appeals in the 2000s that may have helped to soften the party’s image among Latino voters (Fraga & Leal, 2004), but the changes in Republican tone and policy under Donald Trump served to polarize Latinos and complicate their relationship with the party (see Corral & Leal, 2020). Some criticize both parties for failing to compete for Asian Americans’ votes (e.g., Kim, 2007), though many Asian Americans report feeling socially excluded from the Republican Party (Kuo et al., 2017).
Candidates in both parties actively compete for the support of white voters to a greater extent than they compete for support from other racial and ethnic groups. Because whites form a majority of the electorate, neither party can compete nationally without substantial electoral support from whites. Two-party competition is reflected in recent polling data and election returns. According to data from Pew Research Center, Donald Trump won the white vote in the 2016 presidential election by a 21-point margin, the largest share any Republican presidential nominee has won since 1984. 1 The margin was still smaller than Hispanics’ 36-point and African Americans’ 80-point margin of support for Hillary Clinton. Moreover, whites comprised a majority of self-identified Democrats in 2008 and 2012 2 and gave Hillary Clinton the majority of her votes in the 2016 presidential election. 3 A greater proportion of whites voted for Democratic candidates in the 2018 midterms, an apparent short-term reversal of whites’ gradual migration toward the Republican Party. 4 This reversing trend continued into 2020 as early exit polls showed whites as more competitive in 2020 than 2016, supporting Trump this time by only a 17-point margin. 5
There are limitations of portraying whites as a two-party competitive social group. The first is that white support has increasingly shifted towards Republicans over the last two decades (Zingher, 2019), perhaps due to attitudes on immigration (Hajnal & Rivera, 2014) or increased awareness of party differences on racial issues during the Obama Administration (Sides et al., 2018). The point here is not to contest findings that white support generally has been shifting toward the Republican Party in the long term. Rather, it is to establish that in recent election cycles, white votes have been competitive for both parties.
A second limitation is that many (but not most) whites are group-oriented in their voting behavior. Jardina (2019) demonstrates that white identity and consciousness predicted opposition to Barack Obama’s reelection in 2012 and support for Donald Trump in 2016 in both the Republican primary and the general election. If a large proportion of whites demonstrate strong white identity or consciousness and those dispositions lead them to support Republican candidates, then we should remain skeptical that white voters are more likely to consider both parties’ candidates than nonwhite voters. However, Jardina (2019) also estimates that strong white identifiers comprise a minority of whites (roughly 30–40%), a smaller proportion that exhibits strong ingroup identity than either Latinos (49–75%) or African Americans (69–85%). Finally, strong white identity is positively but only weakly correlated with Republican party identification.
Taken to its extreme logical conclusion, the argument implies that majority-minority districts should be represented by the most extreme lawmakers and homogeneously white districts should be represented by the most moderate lawmakers. Of course, that idea does not match reality; moderate lawmakers like former Rep. Will Hurd (R-TX) have represented majority-minority districts while extreme lawmakers like former Rep. Steve King (R-IA) have represented almost homogeneously white districts. Other factors, such as the overall ideology of the district, play an important role in shaping lawmakers’ voting records. However, on the margins, greater party competition for white votes should have a moderating influence on lawmakers’ votes.
Given its prominence in the literature on district racial composition and representation, it is worth explaining how the racial threat hypothesis (e.g., Avery & Fine, 2012; Key, 1949) differs from the present argument. The racial threat hypothesis holds that a larger minority population in a district should provoke a sense of threat and backlash among whites who subsequently compete with minorities for resources and power. Backlash can manifest in partisan competition that draws extreme candidates to the political arena. Applied to lawmakers’ voting records, the racial threat hypothesis would imply that extreme voting is likeliest among the representatives of those districts most evenly divided between whites and nonwhites. In contrast, the present argument holds that lawmakers are pulled toward the extremes by other political actors (e.g., activists) or personal beliefs, but that interparty competition for whites’ votes produces moderation. In other words, this argument attributes voting moderation to the dynamics of party competition for white votes at the national level rather than to local intergroup conflict. In terms of empirics, this argument predicts voting extremity to be a monotonically increasing function of percent white in the district, while the racial threat hypothesis would predict a non-monotonic relationship such that moderation is likeliest in mostly white and mostly nonwhite districts.
In the following empirical analysis, I test the expectation that lawmakers representing more homogeneously white districts should hold more moderate roll-call voting records. The expectation should apply to both Democrats and Republicans. After accounting for district ideology and other factors, electorates that are more homogeneously white should be more amenable to appeals from Republican challengers than more diverse electorates, forcing Democrats representing white districts to moderate their records to compete. Likewise, Republican legislators representing racially diverse districts also should have less incentive to moderate, since even moderate nonwhite populations would be less likely to consider supporting a Republican candidate than moderate white populations.
Evidence From Congress
As a test of the expectation that representatives of more homogeneously white districts moderate their votes, I turn to the roll-call voting records of members of the 112th and 113th Congress. These terms are chosen for the availability of contemporaneous public opinion data and for comparison to a model of legislative change over a redistricting cycle, presented later in the paper. I use members’ first-dimension DW-NOMINATE scores to capture extremity. Scholars frequently use DW-NOMINATE scores to measure the ideological preferences of members (Poole & Rosenthal, 1997), but the scores might better represent partisan divisions, particularly when the parties are polarized (Aldrich et al., 2014; Lee, 2009). Whether the scores capture ideology or partisanship, they nonetheless serve as a useful measure of voting behavior in office. To measure the racial composition of members’ districts, I use one-year estimates from the American Community Survey (ACS). The principal independent variable is the percentage of the district population self-identifying as non-Hispanic whites.
In Figure 1, I plot members’ DW-NOMINATE scores against the percent white in their districts by party for the 112th-113th Congresses. Evidence consistent with expectations would show that members’ scores converge towards zero as percent white in the district increases. The top panel of the figure shows that in the House, both Republicans and Democrats in more homogeneously white districts carry more moderate voting records. The association is substantively larger for Democrats (β = 0.22) than for Republicans (β = −0.10). Coefficient estimates within both parties are statistically significant at the .05 level of confidence. Turning to the Senate in the bottom panel, the white population of a state is negatively associated with member extremity in both parties (β = −0.15 for Republicans, β = 0.13 for Democrats), but is statistically significant only for Democrats. Roll-Call Voting and District Racial Composition in the 112
th
–113
th
Congress. Notes. Data from Voteview and the American Community Survey. Light gray markers represent Democrats. Dark gray markers markers represent Republicans. Three outlier markers indicate House Republicans with small white populations but more moderate voting records. They are Reps. Diaz-Balart, Rivera, and Ros- Lehtinen, all of whom represented South Florida districts.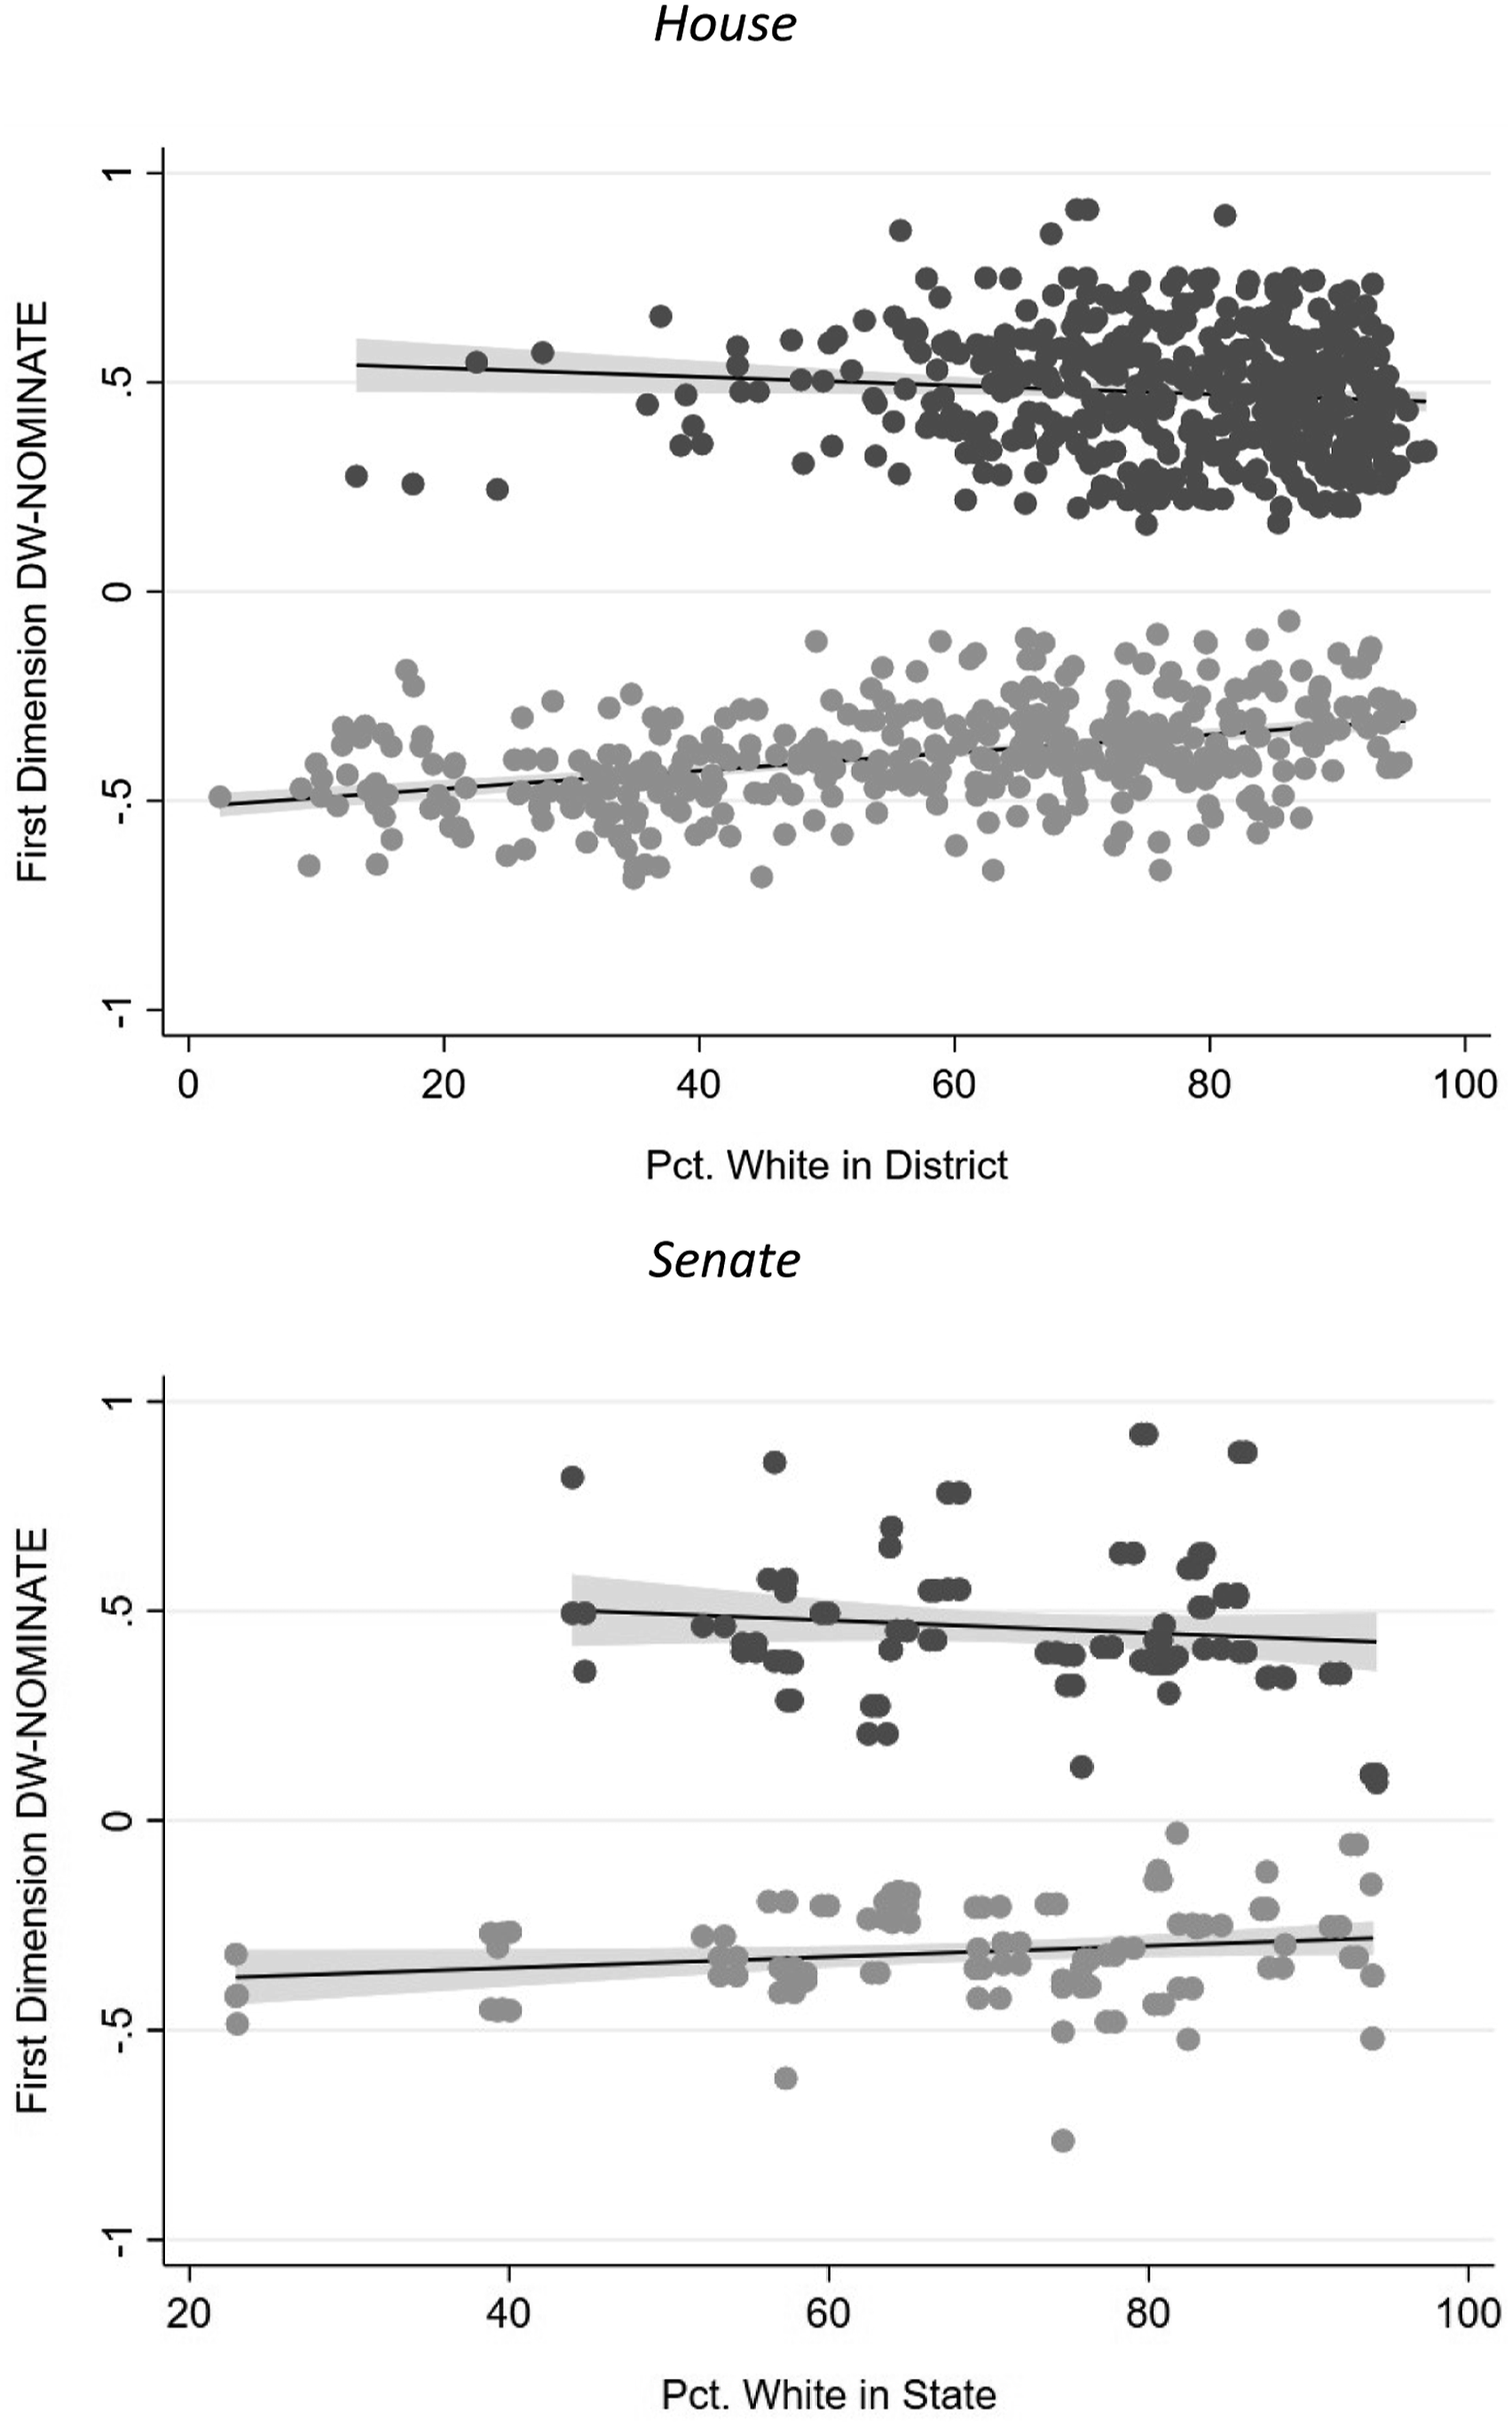
The figures alone do not constitute strong evidence of the expected relationship. The relationship could be confounded by other factors like district ideology, competitiveness, or region. To clarify the role of district racial composition, I estimate several multiple regression models. For the purpose of these models, I transform members’ DW-NOMINATE scores into a measure of Extremity by using the absolute value as the dependent variable. Higher values of this transformed variable (farther from 0 on the original scale) indicate more extreme records. As above, the principal independent variable is Pct. White, the percentage of the district population identifying as non-Hispanic whites.
District Racial Composition and Member Extremity in the 112 th -113 th House.
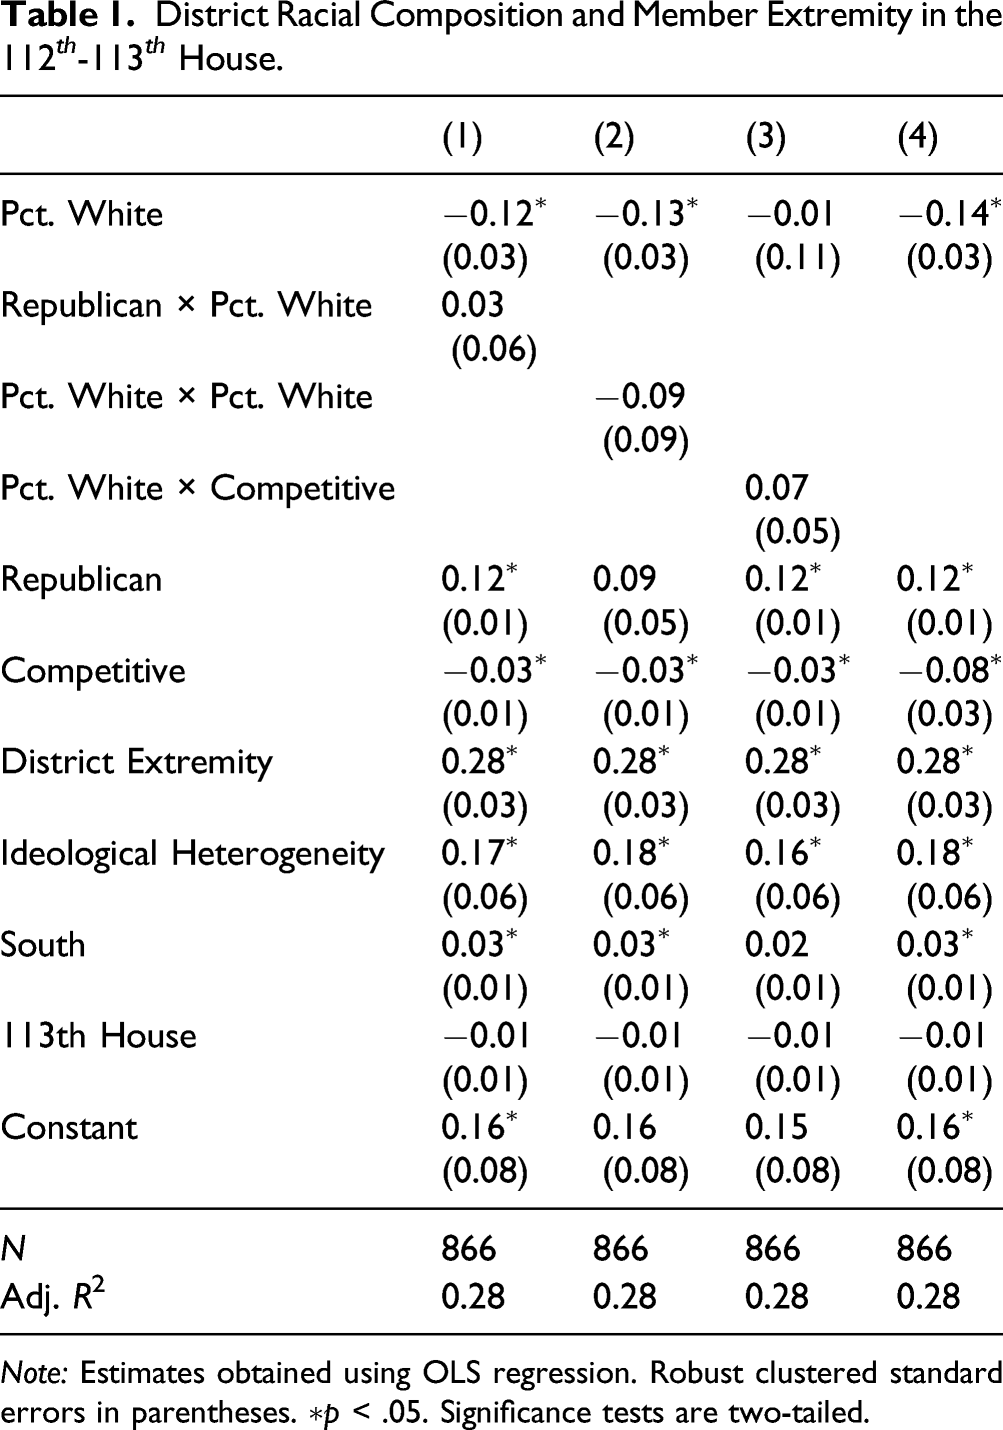
Note: Estimates obtained using OLS regression. Robust clustered standard errors in parentheses. ∗p < .05. Significance tests are two-tailed.
I conduct three further tests to rule out possible conditional relationships between district racial composition and other variables in the model. Each conditional relationship is tested separately in order to compare its results with the original model. Separate tests also sidestep issues of multicollinearity in a model testing all conditional relationships simultaneously. First, it is possible that Pct. White and Extremity are more strongly related for Democrats than Republicans given the findings in Figure 1. The model in the second column includes all controls plus an interaction between Pct. White and Republican. The coefficient estimate for the interaction term is signed positively but does not reach statistical significance, suggesting the relationship does not vary significantly by party. Second, the racial threat hypothesis would predict a non-monotonic relationship between Pct. White and Extremity, such that members are most extreme when districts are evenly split between whites and nonwhites. In the third column, I include the squared value of Pct. White. However, the coefficient estimate is not statistically significant, suggesting that racial composition has a monotonically increasing relationship with roll-call voting instead of a non-monotonic relationship. Third, it is conceivable that lawmakers moderate their votes in response to white voters more in districts that are competitive, while voting on the extremes in very liberal and very conservative districts regardless of racial composition. I interact Pct. White and Competitive in the fourth column. The expected relationship would produce a positive coefficient estimate as the marginal effect of district extremity would be greatest in largely white districts. The estimate found in the fourth column is indeed positive, but not statistically significant. Taken together, the House results point to the conclusion that representatives moderate their votes when representing more homogeneously white districts, unconditioned by members’ party, the size of the white majority in the constituency, or the district’s competitiveness.
State Racial Composition and Member Extremity in the 112 th -113 th Senate.
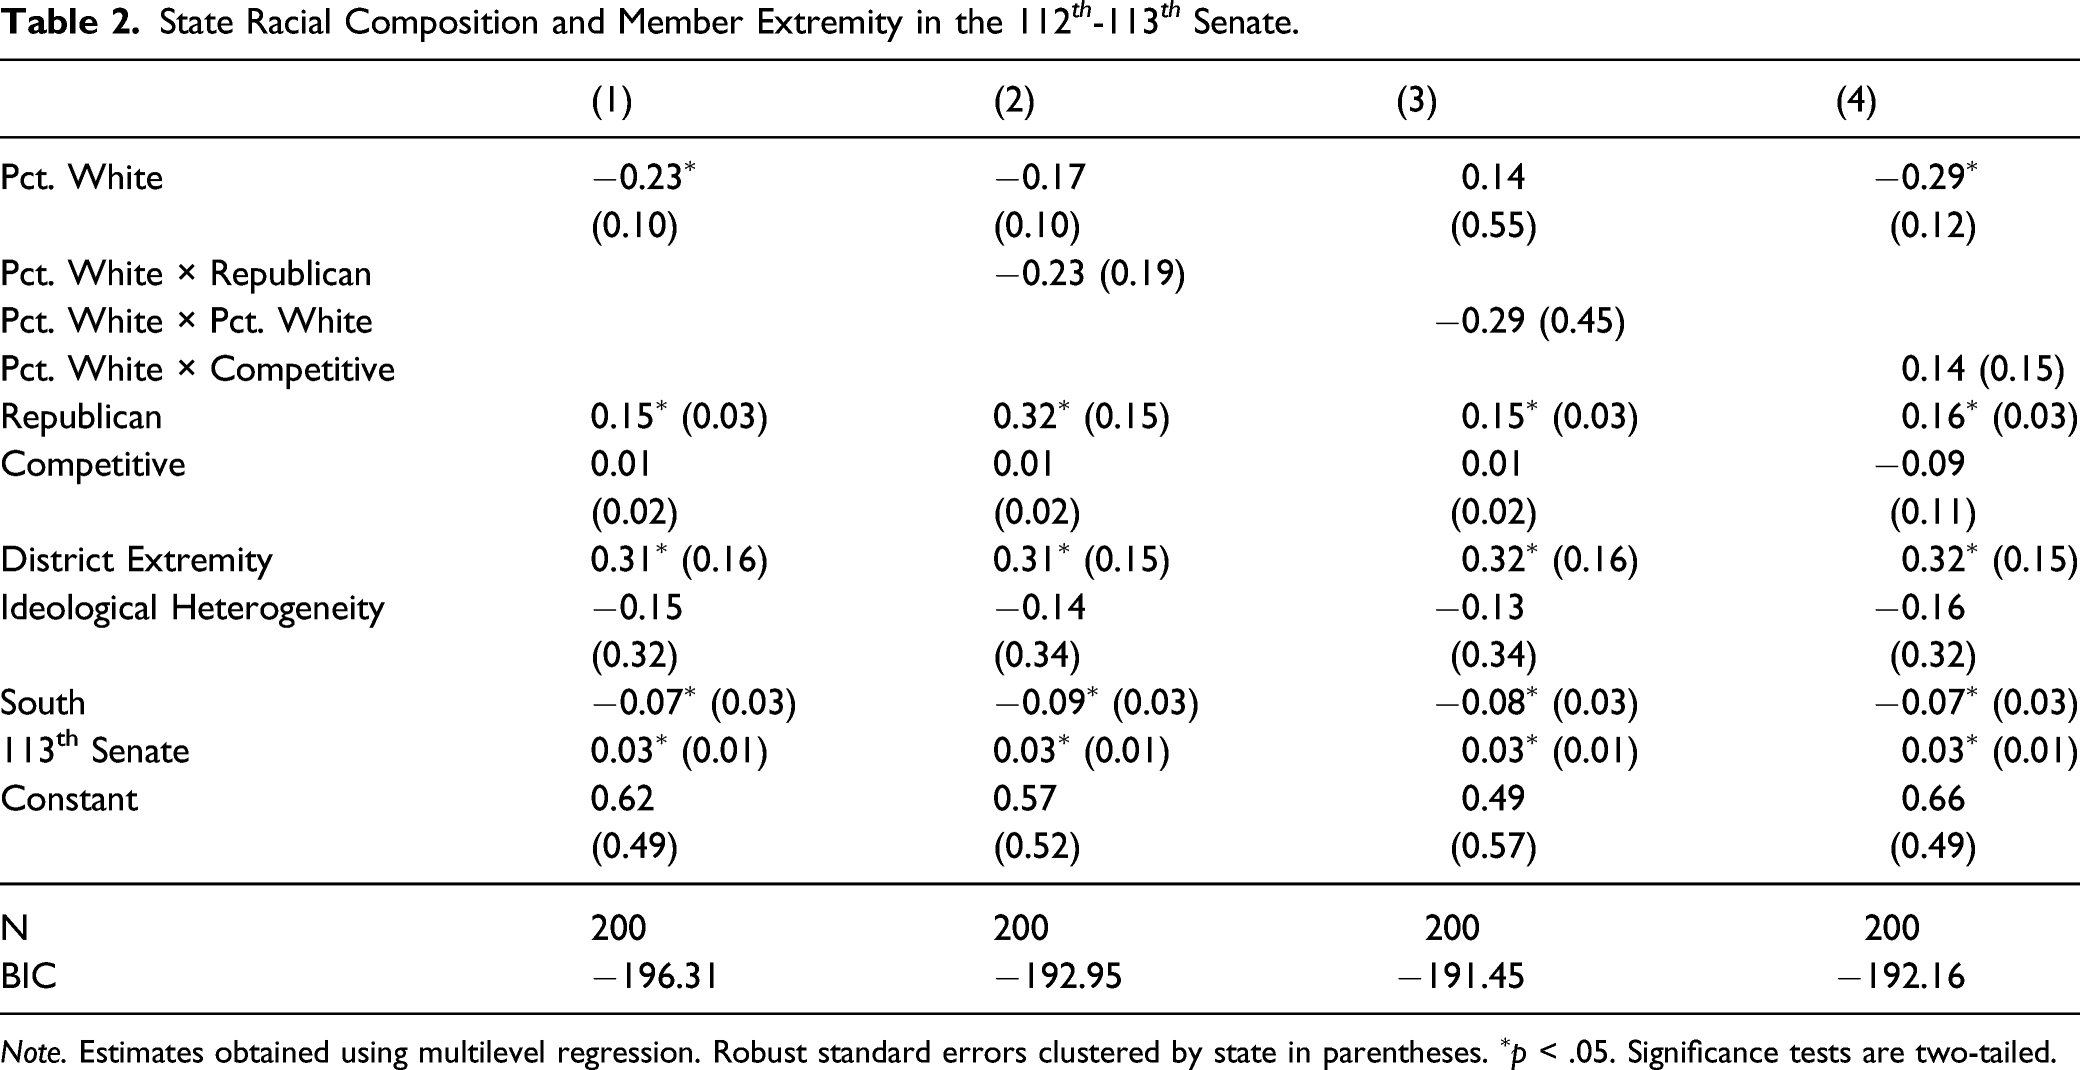
Note. Estimates obtained using multilevel regression. Robust standard errors clustered by state in parentheses. ∗p < .05. Significance tests are two-tailed.
The tests for conditional relationships in the second through fourth columns of Table 2 yield similar results to the tests with the House data. The association between state racial composition and voting extremity is not found to differ significantly by party or by the overall competitiveness of the state. The results also provide little evidence that the association is non-monotonic.
I conduct a series of robustness checks to assure that results are not attributable to measurement choices. I estimate results using an alternate measure of district competitiveness. In Tables A3 and A4 in the appendix, I estimate competitiveness using the incumbent’s share of the vote in their most recent election rather than the binary indicator used in the main results. Higher incumbent vote shares indicate less competitive races in two-party contests. Measuring competitiveness this way does not alter the main findings.
In order to measure extremity of voting behavior and extreme district opinion in the above tests, I transform the underlying data to folded scales. While this choice is plausible because extreme liberal districts are unlikely to be represented by extremely conservative representatives and vice versa, it could pose measurement problems in cases where moderately conservative members represent moderately liberal districts or vice versa. To check that the results are robust to this measurement choice, I estimate separate models by members of each party in Tables A5 and A6 in the appendix. I use untransformed first-dimension DW-NOMINATE scores and estimates of district ideology. For both variables, higher values indicated more conservative scores. The appendix results are somewhat consistent with the main results. Coefficient estimates are signed positively for House and Senate Democrats and negatively for House and Senate Republicans, in line with expectations. However, the estimates are statistically significant only for House Democrats and Senate Republicans. I cannot rule out the possibility that the hypothesized relationship is present only in these caucuses, but these results minimally suggest that the pooled results are not driven by voting dynamics within a single party.
Finally, I test whether the results might be confounded by the race of members. Work on descriptive representation comes to mixed conclusions on members’ race affects overall ideological voting patterns. Some authors find that Black and Latino legislators exhibit distinct voting patterns after controlling for important factors like the composition of districts (e.g., Casellas, 2011; Gonzalez Juenke & Preuhs, 2012) while others find that members’ race has small or no independent effects on voting patterns (e.g., Grose, 2011; Wallace, 2014). My observational data is insufficient to resolve this debate, but controlling for member race can lend some insight into whether more homogeneously white districts or white members are responsible for more moderate voting records. I add the binary indicator White Member to the main models and present the results in Tables A7 and A8 in the appendix. In both the House and Senate, I find a negative and significant association between the control and member extremity, suggesting that white members hold more moderate voting records all else equal. In the House, I continue to find that representatives of more homogeneously white districts cast more moderate votes. In the Senate, the association remains signed consistently with earlier results but is no longer statistically significant. These auxiliary findings are not inconsistent with the main findings, though the mixed results do not allow me to eliminate the possibility that member race, rather than district racial composition, is responsible for voting moderation. Likely, some combination of the two factors play a role.
On balance, the results suggest that members representing districts with more homogeneously white populations are more moderate than their colleagues who represent more racially diverse districts. The associations are modest in both chambers, as large changes in the racial composition of the district are associated with small changes in members’ voting records. Moreover, the effects are not causally identified and vulnerable to confounding. While the results are largely consistent with the district racial composition explanation, they leave open the possibility that members’ race explains member moderation instead of district racial composition. Nothing in these results should be taken as establishing that constituencies with larger white populations cause their representatives to vote more moderately. However, the fact that a similar relationship appears for both House and Senate members, who represent structurally distinct constituencies, points to a relationship between constituency racial composition and Congressional voting patterns.
Accounting for Moderation
The analysis so far points to the conclusion that legislators representing more homogeneously white constituencies hold more moderate voting records. It remains unclear why this occurs. I explore two potential mechanisms: incumbent responsiveness and electoral punishment of extremists. First, I use a redistricting design to determine whether short-term changes in the racial composition of districts result in changes to U.S. House members’ roll-call votes. Second, I observe the general election outcomes of candidates for the U.S. House between 2008–16 and test whether moderate candidates perform better in more homogeneously white districts.
Incumbent Responsiveness
One possible explanation for voting moderation in more homogeneously white districts is that, in response to changes in district composition, incumbents change their voting behavior. Incumbents wanting to remain in office should take actions to satisfy the evolving preferences of constituents and forestall electoral challenges. Lawmakers may modify their voting habits in response to changes in district opinion (Stratmann, 2000). Moreover, government policy outputs change in response to changes in public mood over time (Erikson et al., 2002; Page & Shapiro, 1983). However, there are good reasons to suspect that incumbents would not alter their voting patterns in response to demographic changes in their districts. The voting habits of incumbents tend to remain consistent over time (Poole, 2007). Members may change the issues they pay attention to as district composition changes, but tend not to change their roll-call voting patterns (Hayes et al., 2010).
If the incumbent responsiveness explanation were true, then we should expect to see that incumbents moderate their roll-calls as more white voters join their constituencies. To assess it, I turn to evidence from House redistricting. I observe whether incumbents change their behavior as the racial composition of their districts changes suddenly as district boundaries shift. I rely again upon data from the 112th and 113th House, the terms that straddled the redistricting implemented during the 2012 Congressional elections. Observations are restricted to 343 House members who served in both terms. Rather than using members’ DW-NOMINATE scores, which are static over time, I rely upon modified, term-specific NOMINATE scores produced by Nokken and Poole (2004) for the outcome variable. I expect the change in the extremity of roll-call records (Δ Member Extremity) will vary as a function of the change in percent of the district that is white (Δ Pct. White), controlling for the same set of variables used in Table 1. Time-varying controls are converted to the change in value between the two terms (Δ Competitive, Δ District Extremity, Δ Ideological Heterogeneity), while static controls (Republican, South) retain their original values.
The predicted value of the change in member extremity with the full set of controls is plotted in Figure 2, while full regression results appear in appendix Table A9. The figure plots the relationship for a non-Southern Democratic member remaining in an uncompetitive district, holding all other controls at their means. Supporting evidence would come in the form of a negative slope; members would assume less extreme records in the 113th House if their districts gained white constituents. Instead, the figure shows that the slope of the line is positive but that the predicted change in member extremity is not statistically different from zero across the entire range of values of the independent variable. Coefficient estimates for the controls indicate that members who were drawn into more competitive districts moderated their roll-call votes slightly in the 113th Congress compared to the previous term, but none of the remaining controls predicts changes in incumbent extremity. Change in District Composition and Roll-Call Voting after 2012 Redistricting. Notes. Data from Voteview and the American Community Survey.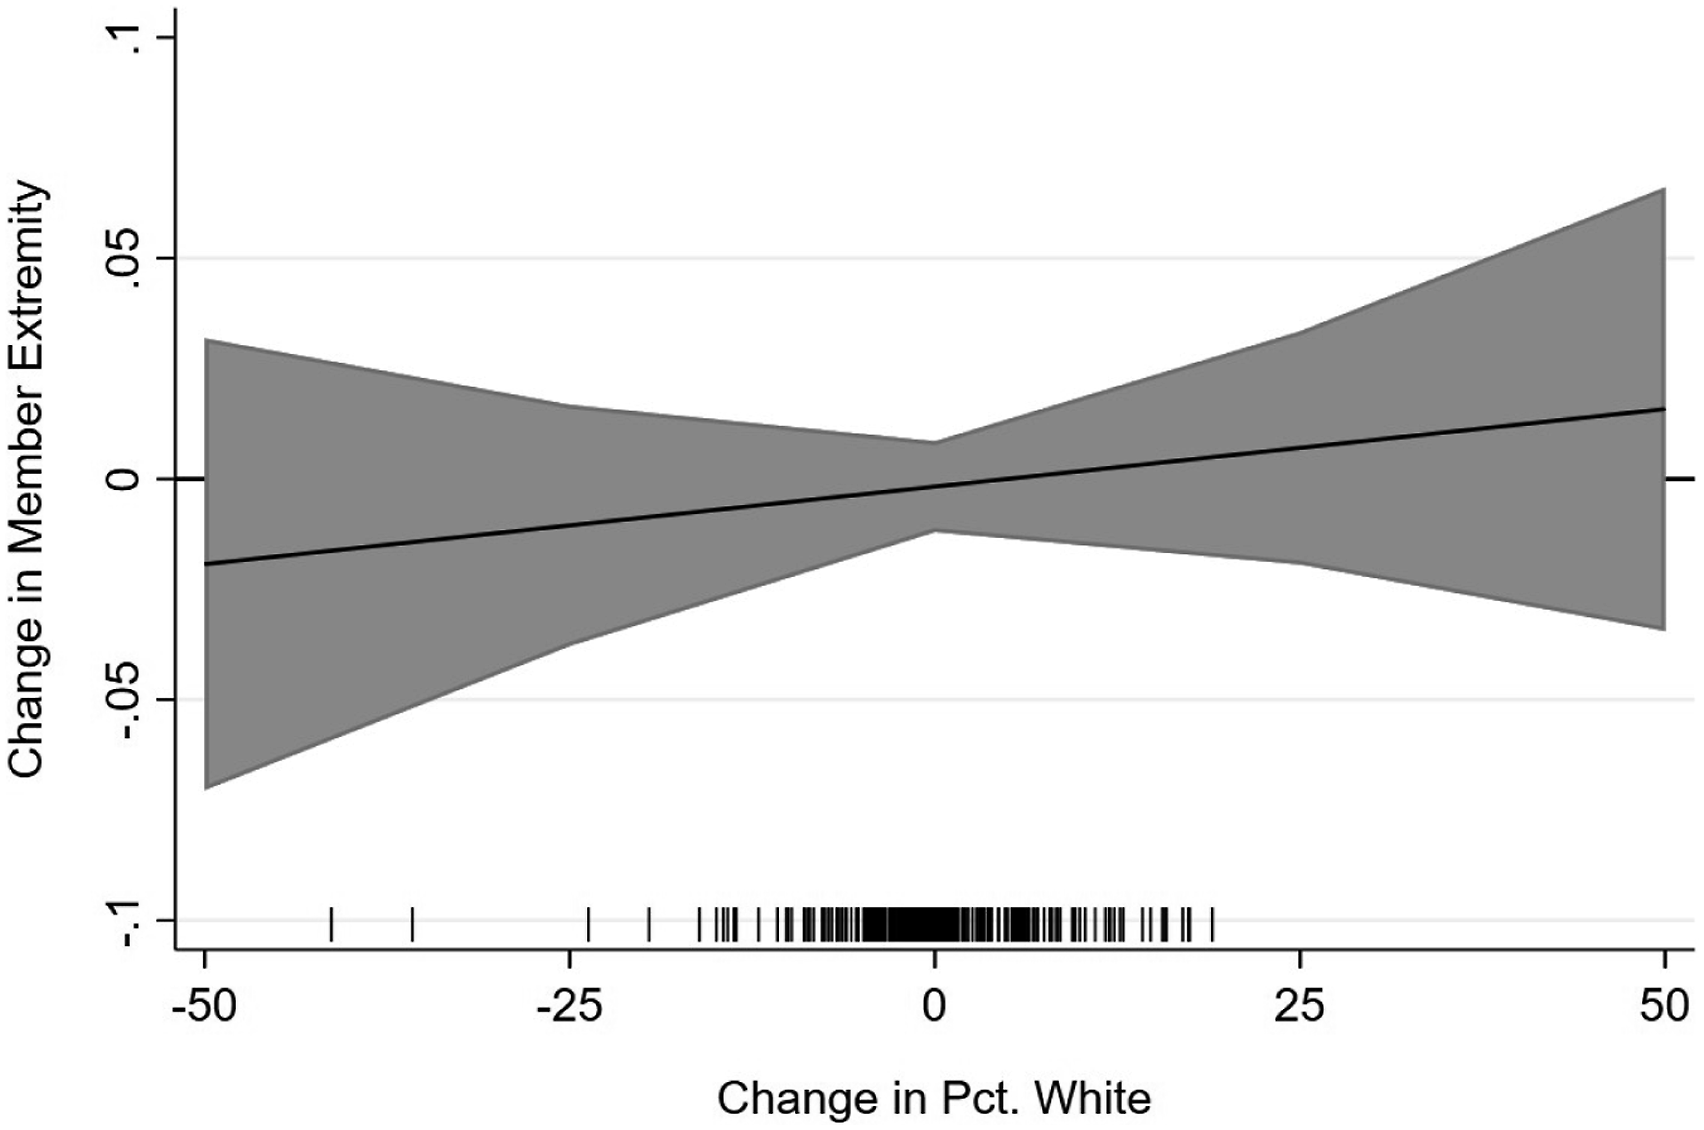
I run additional tests to determine whether these results might be confounded by primary challenges pushing reelected incumbents to cast more extreme votes in the new term. I add two variables as controls in separate models: the incumbent’s primary vote share and a binary indicator of whether the incumbent received less than 75% of the primary vote share, a threshold of competitiveness used previously by Boatright (2014) and Jewitt and Treul (2019). I present results in Table A10 in the appendix. If anything, the results suggest that primary challenges are associated with less extreme voting records among incumbents in the new term. Models including these controls continue to support the conclusion that changes in district racial composition are not associated with changes in incumbents’ voting patterns.
These results do not provide dispositive evidence of a null relationship. However, they reinforce that it is unlikely for short-term changes in district racial composition to result in changes to otherwise stable voting patterns among incumbents. Any relationship between district racial composition and member moderation likely occurs through mechanisms other than incumbent responsiveness to changes in district racial composition.
Electoral Punishment
Alternatively, electoral punishment might account for differences in members’ positions. Much of literature on lawmaker responsiveness suggests that voters remove incumbents from office when they hold extreme records (Canes-Wrone et al., 2002; Carson et al., 2010) and reward more moderate general election candidates (Hall, 2015). However, the propensity to hold representatives accountable on the basis of ideological voting might vary across racial groups. Griffin and Flavin (2007) found that white voters possessed more information about their substantive representation than Black voters and were more likely to punish more extreme legislators as a result. I explore whether this dynamic could account for representatives holding moderate voting records in more homogeneously white districts. To do so, I test whether more homogeneously white districts assess larger penalties on extreme candidates than more diverse districts.
I test whether the racial composition of the district will moderate the relationship between candidate ideology and electoral performance. Specifically, I expect that more extreme candidates will perform worse in more homogeneously white constituencies. Data come from the Database on Ideology, Money in Politics, and Elections (DIME) (Bonica, 2014). I observe the electoral outcomes of all incumbents and challengers in general elections for the U.S. House from 2008 to 2016, cycles for which complete data are available. I observe two outcomes: the candidate’s vote share and a binary indicator of whether the candidate won the election.
To measure candidate extremity, I use candidates’ CF scores, which range from −1.75 to 4.31 for Republicans and from −4.34 to 2.38 for Democrats. I multiply the scores of Democratic candidates by −1 to place candidates on the same extremity scale instead of using the absolute value because the distribution of CF scores within each party extends across the standardized mean value of zero. I merge DIME data to one-year ACS estimates of the racial composition of districts and create the variable Pct. White.
I control for several factors associated with candidate electoral performance (Canes- Wrone et al., 2002; Carson et al., 2014). I include an indicator for Incumbent candidates. District opinion estimates derived from large-N surveys are not available every election cycle, so I proxy for left-right opinion by controlling for Same-Party President Vote Share in the district from the last presidential election. I include the Logged Receipts, or the natural log of the total contributions the candidate received. Finally, given that candidates of the president’s party tend to suffer in midterm elections, I include indicators for Republican candidates and Midterm years, plus the interaction between the two. (Democrat Barack Obama held office for all midterm elections observed in this analysis.) Table A11 in the appendix presents descriptive statistics for all variables in the model.
Because candidates’ vote shares and victories are dependent on the performance of the other candidates, I employ a multilevel model and nest candidates within contests. I also include fixed effects for election cycles. Independent and third party candidates are excluded from the analysis. A test of the expectation will come in the form of an interaction between Extremity and Pct. White. If more moderate candidates perform better in more homogeneously white districts, we should expect to see a negatively signed coefficient estimate for the interaction term.
Extremity, District Racial Composition, and General Election Outcomes.
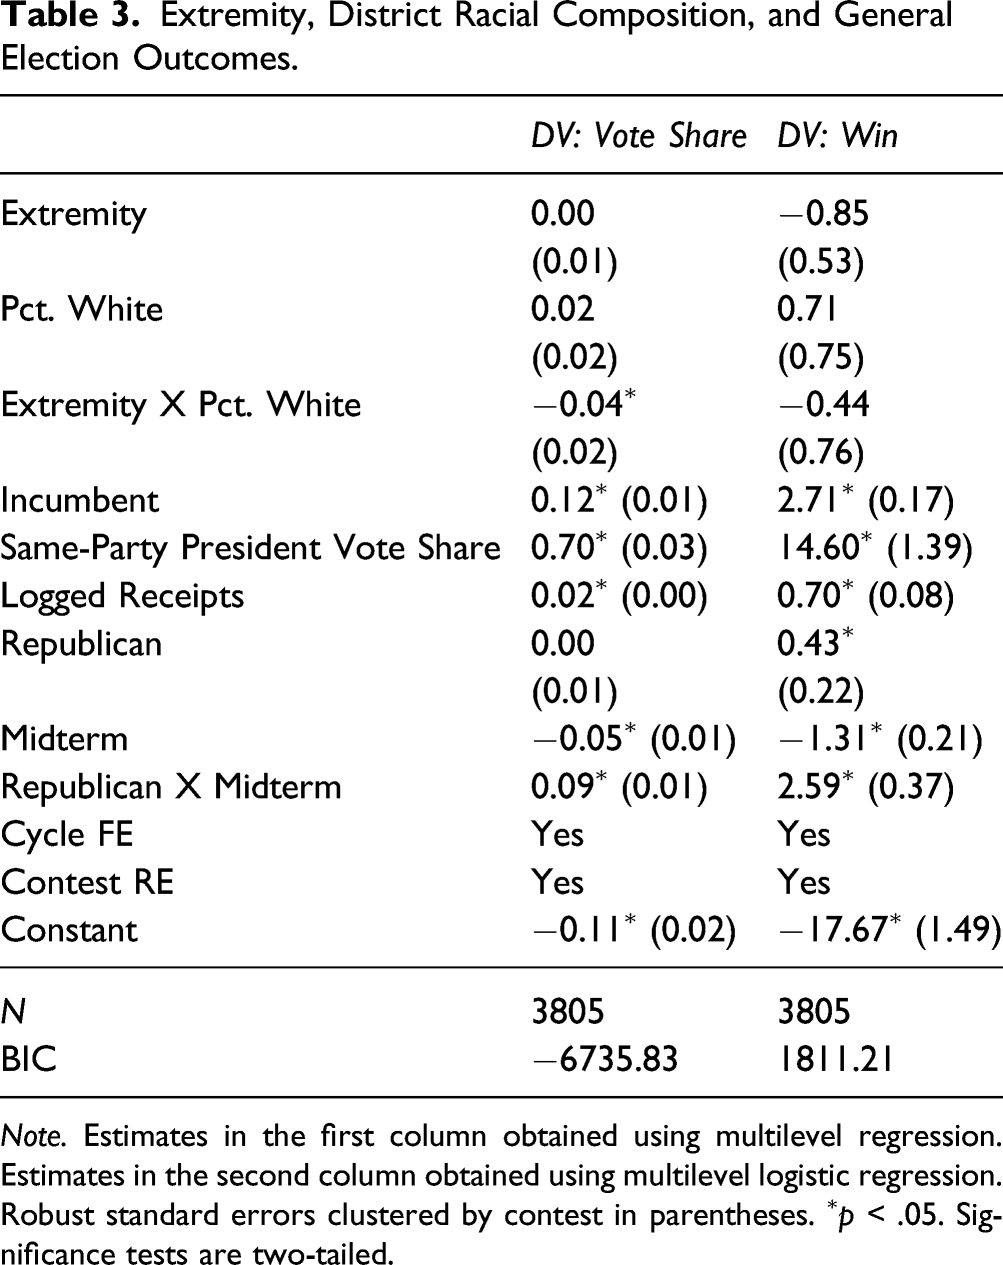
Note. Estimates in the first column obtained using multilevel regression. Estimates in the second column obtained using multilevel logistic regression. Robust standard errors clustered by contest in parentheses. ∗p < .05. Significance tests are two-tailed.
Because coefficient estimates are often difficult to interpret in their own right, I present a marginal effects plot for the main interaction term in Figure 3.
8
The figure shows that a candidate of average extremity would experience no vote share penalty in a constituency with very few white voters, but would experience a 2-percentage point penalty in a district with 50% white voters and nearly a 4-percentage point penalty in a district with nearly all white voters. The penalties are relatively modest—for most candidates, a penalty in the low single digits is not enough to make or break a victory. However, the penalty is large enough that it could cost some candidates in marginal seats their contests. Extremity, Electoral Vote Share, and District Racial Composition. Notes. Data from DIME and the American Community Survey.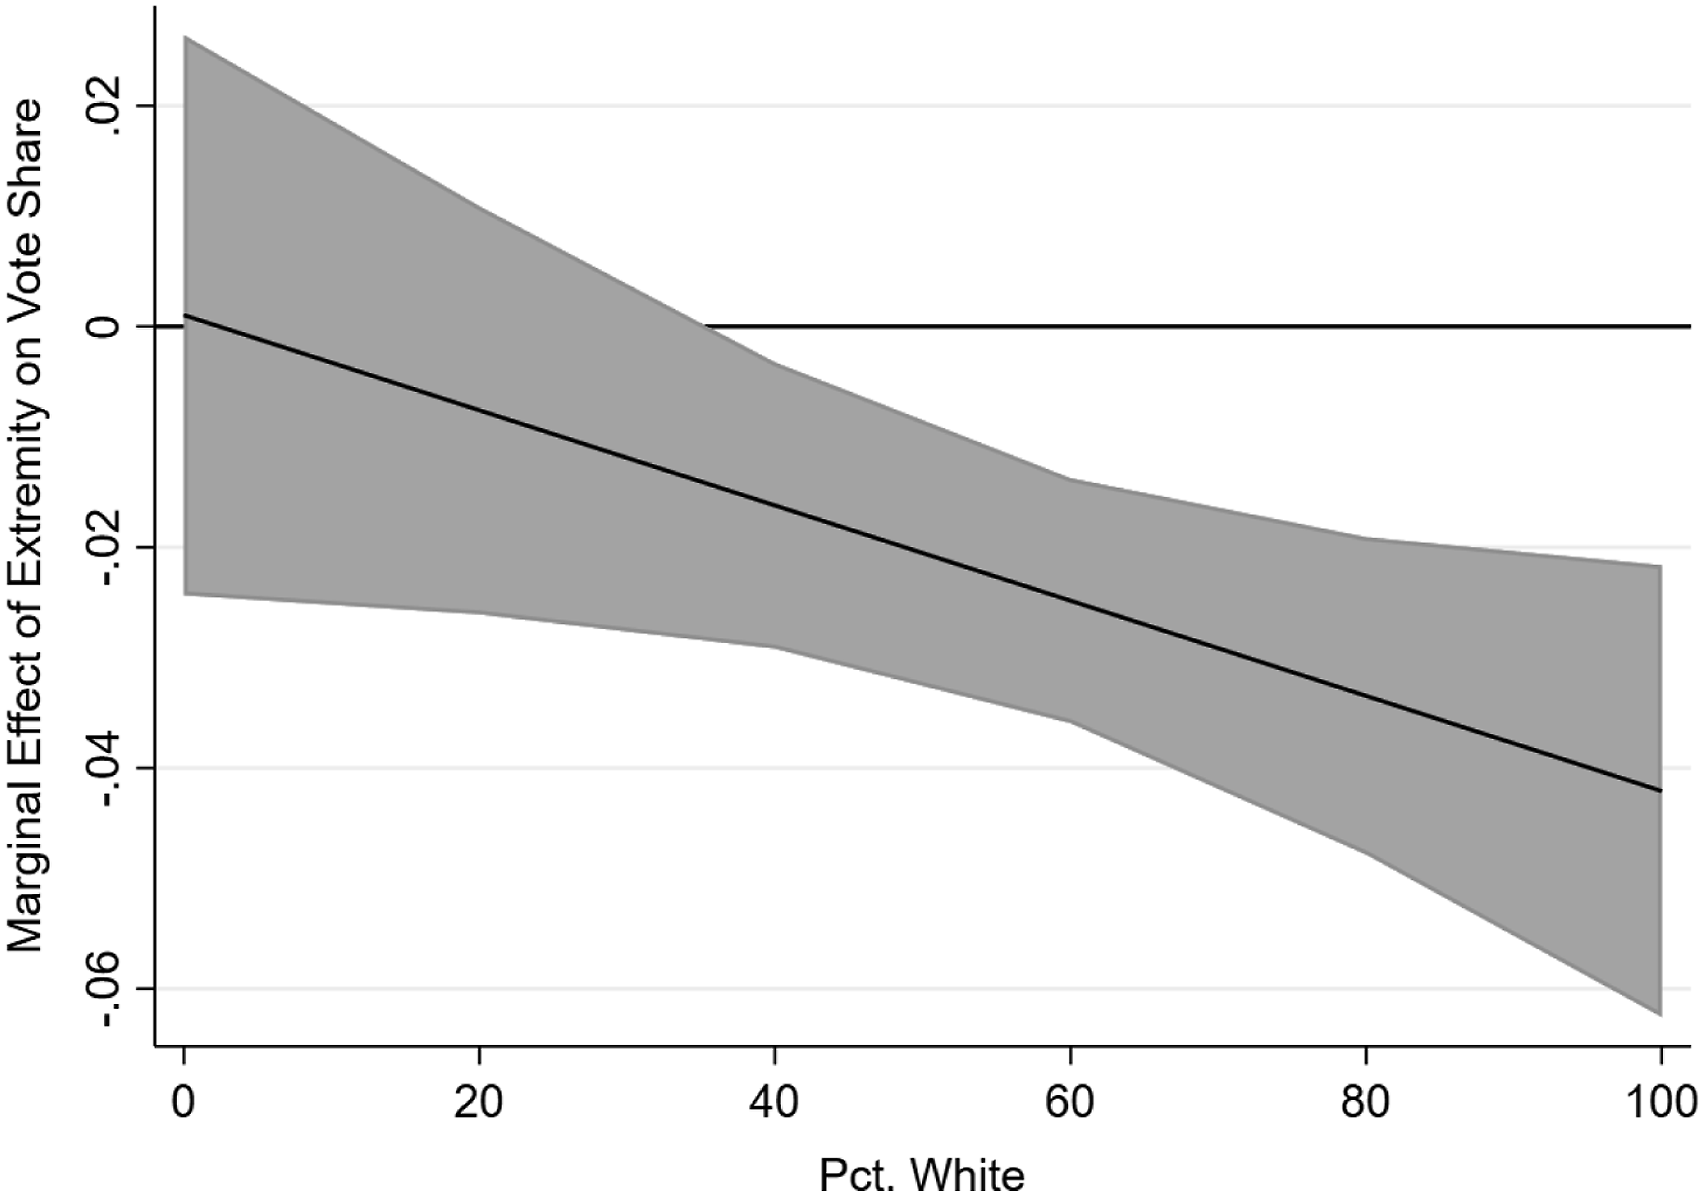
The second column of Table 3 presents estimates from multilevel logistic regression when the dependent variable is a binary indicator of whether the candidate won. All independent and control variables remain the same. Like the first column, the coefficient estimate for the interaction between Extremity and Pct. White is negatively signed. However, the estimate is not found to be statistically significant. Therefore, it cannot be concluded that more extreme candidates are ultimately more likely to lose their contests in more homogeneously white districts. Results for the controls in the second column perform as expected, mirroring those found in the first column.
As before, I test whether the race of candidates might confound the results. Given the historical tendency for districts to elect representatives of the majority race in the district, it could be the case that nonwhite candidates receive stiffer penalties for extremism than white candidates as the share of white residents increases. I add a control present the results in Table A12 in the appendix. I find little difference in the results once the control added. The size, sign, and significance of the coefficient of interest (Extremity X Pct. White) remains the same.
A potential shortcoming of the model specification in Table 3 is that it observes a candidate’s extremity relative to the national mean of all candidates rather than the extremity of their opponents. I present an alternate test accounting for extremity relative to opponents in Table A13 of the appendix. I observe all contests where at least one Democrat faced at least one Republican over the same period of 2008–2016. Candidate extremity is measured as the difference of the absolute value of major party candidates’ CF scores. The results correspond to those in Table 3. Districts that are more homogeneously white assess larger vote share penalties as a candidate becomes relatively more than extreme than their opponent, though relatively more extreme candidates are not found to be more likely to lose in white districts overall.
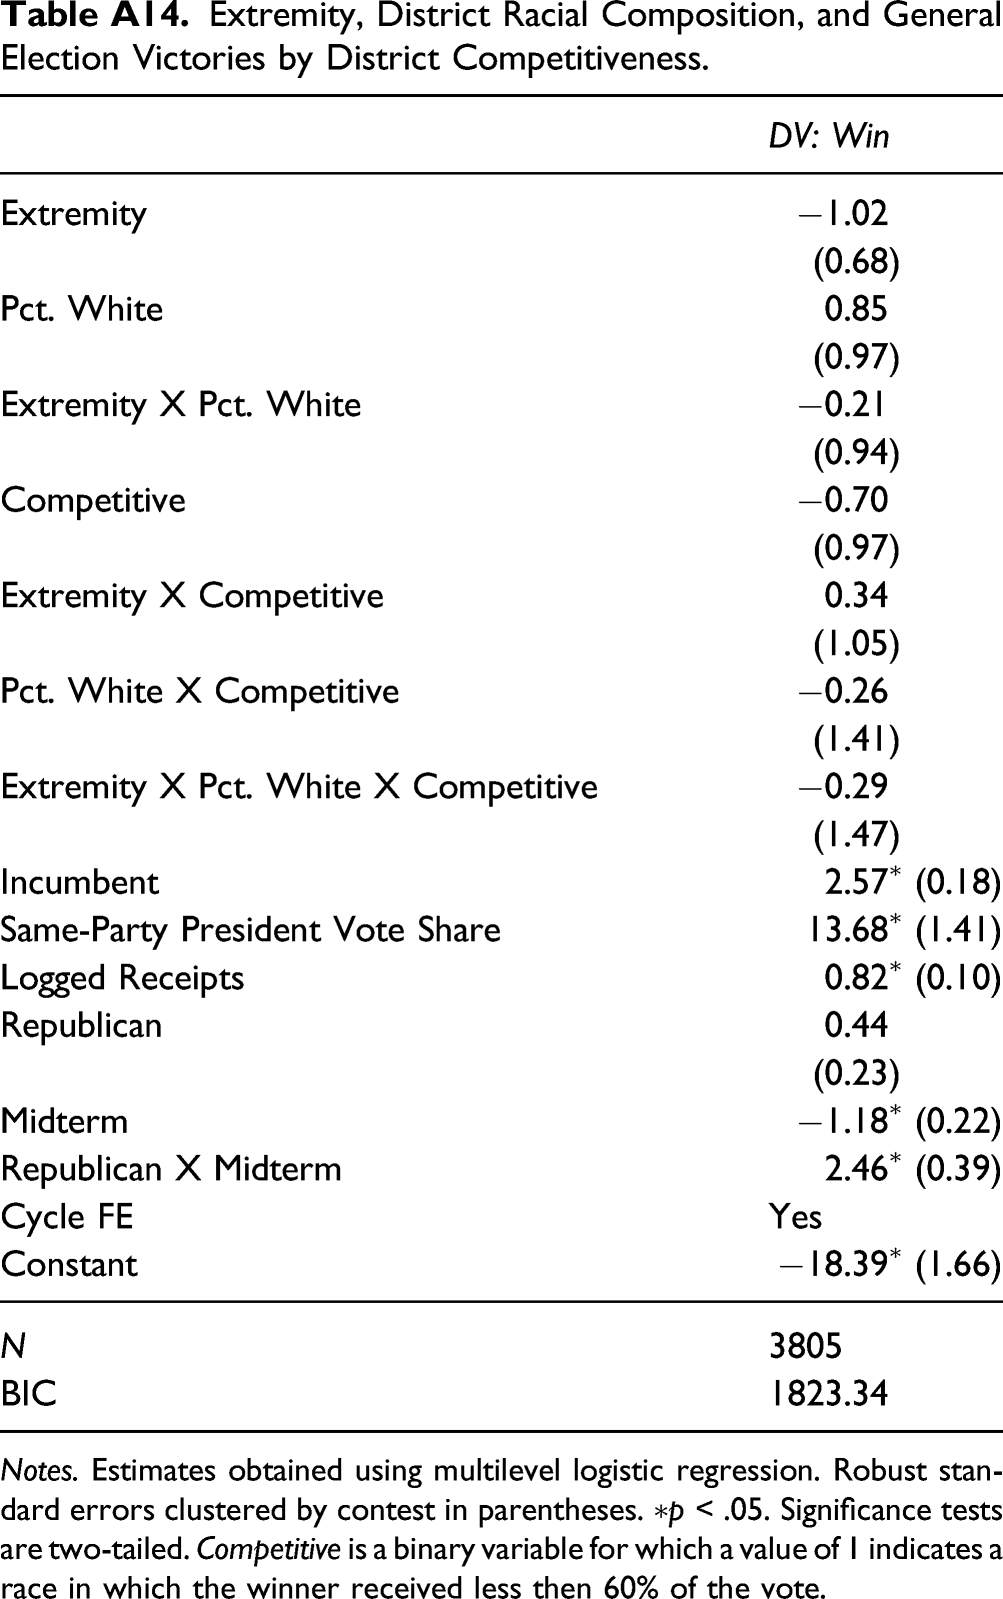
A simple explanation for the disparity in these two tests is that most candidates run in seats that are safe for one party or the other. A small vote share penalty may be enough to cost a small number of extremists in competitive white districts their elections, but most extreme candidates would not suffer a loss as a result. However, a further test in Table A14 in the appendix shows no difference between competitive or safe white districts in the likelihood of extreme candidates losing. Therefore, while districts with more white constituents seem more willing to punish extreme candidates in terms of vote share, the penalties do not appear to be large enough to elect more moderates overall. I consider other possible explanations for this disparity in the final section.
Discussion
The findings above provide evidence that the racial composition of districts are related to the extremity of lawmakers’ voting records across U.S. lawmaking bodies. The individual-level findings are fairly consistent for both Democrats and Republicans in the House and Senate. Exploratory tests of the mechanism showed it is unlikely that legislators moderate their roll-call votes in anticipation of appealing to more homogeneously white electorates. Rather, it appears that white electorates tend to assess larger electoral penalties on extreme candidates. However, these penalties do not seem to be large enough to cost extreme candidates victory even in more competitive contests.
The mixed results of the mechanism tests present a puzzle. Why would members of Congress cast more moderate roll-calls in more homogeneously white districts if neither incumbent responsiveness nor electoral replacement of extreme incumbents fully accounts for it? One possibility is that the vote share penalties regularly experienced by the candidates in more homogeneously white districts affects members’ perceptions of electoral threat. Despite being no more likely to lose, representatives of white districts may act as if their seat were on the line and so avoid extreme voting records. Another related possibility is that the vote share penalty could influence the types of candidates who compete in general election contests. The type of moderate candidates who would go on to cast more moderate votes in Congress may opt to run in a white district while an extreme candidate would decline to run in the same district. Moderate primary candidates may also be more likely to win nominations in more homogeneously white districts, with primary voters perceiving a greater threat to their party’s candidate winning with an extreme platform. These possibilities should be explored in future research.
The results above should be interpreted cautiously. None of the evidence above identifies a causal link between district racial composition and representative behavior, though identifying an association is a precursor to establishing causality. While efforts have been made to control for potential confounding factors, the possibility of a spurious relationship cannot be eliminated. Robustness tests controlling for the race of members did not eliminate it as a confounding variable. Minimally, reverse causation seems unlikely; it is doubtful white voters sort themselves into certain districts because those districts are represented by more moderate lawmakers.
The findings also call for greater scholarly attention to how the dynamics of representation for minority communities shape electoral accountability. Studies finding that more extreme lawmakers perform worse in elections typically neglect the consideration of race in electoral outcomes (e.g., Ansolabehere et al., 2001; Canes-Wrone et al., 2002; Carson et al., 2010). One implication of the present research is that this set of findings more cleanly applies to white-majority districts but less accurately describes dynamics in majority-minority districts. The implication falls in line with findings from Harden (2016) that whites tend to demand policy representation from their elected representatives while African Americans are likely to demand other types of representation, such as descriptive representation, as well (see also Griffin & Flavin, 2007). These tests leave open the possibility that lawmakers are more responsive to the policy preferences of whites than other racial and ethnic groups, as previous studies have asserted (e.g., Griffin & Newman, 2008). However, the evidence here does not speak directly to those assertions, since none of the analyses test the proposition explicitly.
It is important to reiterate that the findings in this study are time-bound. All data analyzed above were recorded between 2008 and 2016. It is possible that these findings reflect short-term dynamics brought about by the election of Barack Obama (Sides et al., 2018) rather than the long-term dynamics of demographic change. Furthermore, future changes in the structure of party coalitions could produce changes in the relationship between district-level racial composition and partisan behavior. Given the historical evolution of party coalitions in the U.S. (see Miller & Schofield, 2003), it is difficult to predict with any certainty that the relationship observed here will continue to be observed in coming decades. For example, former President Donald Trump’s improved performance among Black and Latino voters in 2020 over 2016 points toward the type of party realignment away from racial cleavages and toward class cleavages that could disrupt these dynamics, though it remains far too early to conclude that we are actually in the midst of such a realignment. Partisan realignment away from division on issues of race may serve to diminish the association between district racial composition and extreme lawmaker voting in coming decades.
Footnotes
Acknowledgments
I thank Elisa D’Amico, Connor Mautner, and Raluca Pavel for research assistance. I am grateful for valuable feedback from Nick Carnes, Chris Clark, Chris Donnelly, Virginia Gray, Mike MacKuen, Nancy Martorano Miller, Steve Rogers, Valeria Sinclair-Chapman, Sarah Treul, and the Chicago Researchers in Social Sciences (CRISS) working group. Special thanks to Tom Carsey who guided this project in its early stages. Any errors remain the responsibility of the author.
Declaration of Conflicting Interests
The author(s) declared no potential conflicts of interest with respect to the research, authorship, and/or publication of this article.
Funding
The author(s) received no financial support for the research, authorship, and/or publication of this article.
Notes
Appendix to “White Constituents and Congressional Voting”
Extremity, District Racial Composition, and General Election Victories by District Competitiveness.
| DV: Win | |
|---|---|
| Extremity | −1.02 |
| (0.68) | |
| Pct. White | 0.85 |
| (0.97) | |
| Extremity X Pct. White | −0.21 |
| (0.94) | |
| Competitive | −0.70 |
| (0.97) | |
| Extremity X Competitive | 0.34 |
| (1.05) | |
| Pct. White X Competitive | −0.26 |
| (1.41) | |
| Extremity X Pct. White X Competitive | −0.29 |
| (1.47) | |
| Incumbent | 2.57∗ (0.18) |
| Same-Party President Vote Share | 13.68∗ (1.41) |
| Logged Receipts | 0.82∗ (0.10) |
| Republican | 0.44 |
| (0.23) | |
| Midterm | −1.18∗ (0.22) |
| Republican X Midterm | 2.46∗ (0.39) |
| Cycle FE | Yes |
| Constant | −18.39∗ (1.66) |
| N | 3805 |
| BIC | 1823.34 |
Notes. Estimates obtained using multilevel logistic regression. Robust standard errors clustered by contest in parentheses. ∗p < .05. Significance tests are two-tailed. Competitive is a binary variable for which a value of 1 indicates a race in which the winner received less then 60% of the vote.