
Abstract
Out-of-state donors’ contributions represent a growing share of fundraising receipts for House candidates. This raises the question of whether out-of-state contributions simply represent more money flowing to the campaigns’ coffers or whether these monies could be worth more than their outright cash value. Using campaign finance data from the U.S. Federal Election Commission 2010-2018, I examine both the fundraising and electoral impacts of non-incumbent House candidates’ receipt of these funds using structural equation modeling, a matching analysis, and a regression analysis. I uncover evidence that out-of-state contributions are an indication of the candidate’s integration into the extended party network (EPN) finding they are closely tied to interest group support. Out-of-state contributions are also found to have a positive impact on non-incumbent House candidates’ competitiveness, which likely stems from the broader support of the EPN.
House races have increasingly become national affairs involving larger sets of outside groups and out-of-state donors seeking to influence the course of national politics. Although House incumbents receive the bulk of out-of-state monies (Baker, 2016b; Stevens & McCammond, 2018), non-incumbents are increasingly successful in raising funds from a national set of donors, as media and watchdog group accounts attest (Open Secrets, 2018; Schoen, 2018). This success is partly driven by changes in campaign finance laws allowing donors greater freedom to contribute to an unlimited number of campaigns in amounts adjusted for inflation in each election cycle (Magleby et al., 2018). National donors are poised to have more influence than ever before, which raises the question of whether their support simply amounts to more money in the campaign’s coffers or whether these monies are worth more than their cash value.
There is good reason to believe that the money stemming from national donors comes with fringe benefits. Arguably national donors constitute the nuts and bolts of what recent scholarship conceptualizes as the extended party network (EPN)—“dynamic dispersed systems of interconnected interest groups, centered on traditional formal party organizations” (Desmarais et al., 2015, p. 194; Koger et al., 2009). Without money from a set of national donors financing most of the EPN organizations’ activities, the EPN would not have much influence. Moreover, previous studies suggest a core set of national donors are enmeshed in the network through membership in multiple organizations and also have experience volunteering or working for campaigns (Francia et al., 2003)—in some sense, they tie the larger network together (Koger et al., 2009; Rhodes et al., 2018). Thus, support from national donors may be an indication that the candidate has the support of the larger network. If this is the case, then these monies should have positive impact on non-incumbent candidates’ competitiveness because the money operates as a signal to others in the network that the candidate is worth supporting and the money is associated with other types of monetary assistance, such as independent expenditures, and non-monetary support, such as endorsements.
In this paper, I investigate whether out-of-state donor contributions are related to non-incumbent House campaigns’ fundraising success with interest groups, parties, and in-state donors and whether they are related to outside spending by EPN members. Using structural equation modeling, I examine whether success in one of these fundraising areas relates to success in another fundraising area for House campaigns—of particular interest is whether PAC money and out of state donors’ contributions are related, as major PAC support has been identified as one indicator of candidate integration into the EPN (Desmarais et al., 2015). In this analysis, I also explore whether out-of-state contributions are in any way related to or influenced by independent expenditures by fellow EPN members and by the opposition’s EPN. Second, I include a matching analysis followed by an OLS regression analysis to test whether out-of-state contributions have a unique and positive impact on non-incumbent House candidates’ competitiveness in the 2010-2018 election cycles. The results suggest gaining the support of national donors pays off for non-incumbent candidates because it is a sign they are receiving support from the rest of the EPN and subsequently, they are able to make competitive gains because the money comes with a slew of additional benefits.
Support from the Extended Party Network
Extended party network (EPN) support is extremely valuable for congressional campaigns because it takes many forms. Koger et al. (2009) describe the EPN as the party coalitions writ large to include the party committees and their affiliated candidates as well as interest groups, activists, media groups, and advocacy groups. Additional examinations of the EPN have shown allied interest groups and parties supporting the same sets of candidates, with the party committees playing a central role within each coalition (Grossman & Dominguez, 2009; Herrnson & Kirkland, 2013; Herrnson, 2009; Kolodny & Dwyre, 2018; La Raja, 2014). The support that the EPN provides includes hard dollar contributions to the campaigns as well as independent expenditures in support of the candidate or against the candidate’s opponent (Dwyre & Braz, 2015; Farrar-Myers & Skinner, 2012; Herrnson, 2009; La Raja, 2014). Endorsements from EPN members are another form of support that can help non-incumbents raise more money from individual donors (Baker, 2015). Further support in the form of referrals to consultants or opposition research may also be provided by the EPN (Magleby & Goodliffe, 2019; Nyhan & Montgomery, 2015). Finally, all of these activities and especially monetary support are theorized to signal both activists and voters of the candidates’ acceptability and viability (Desmarais et al., 2015). Desmarais et al. (2015) show “challengers supported by densely interconnected partisan communities have a greater likelihood of winning compared to those with similar campaign resources and political backgrounds, but without EPN backing” (208).
Out-of-State Donors
Similar to the way interest groups and parties coalesce around particular candidates, so do donors. In part they do this at the urging of parties and interest groups as well as the candidates themselves (Brown et al., 1995; Francia et al., 2003). But they also do this because the donors themselves are networked both within parties and interest groups and apart from parties and interest groups. Habitual donors in particular tend to be seasoned political activists who are members of multiple interest groups and who have experience volunteering on multiple campaigns (Francia et al., 2003; Francia et al., 2005; Verba et al., 1995). Many donors are fundraisers and solicit other donors on behalf of candidates—69% of congressional donors in Franica et al. (2003) study reported being solicited by a personal friend or relative (89). This makes sense when one considers that a number of studies suggest donors are also part of their own local social networks, which may include other donors, as donors tend to cluster within wealthy zip codes (Cho-Tam & Gimpel, 2007; Gimpel et al., 2006; Gimpel et al., 2008). It is quite probable that campaigns and parties tap into these pre-existing networks making it more challenging to determine who is influencing whom. Additionally, donors may be networked on the basis of issues as well as geography. Crespin and Deitz (2010) show female candidates who receive support from what they dub the “female donor network” have more fundraising success.
In addition to evidence demonstrating that donors are networked both inside of and outside of their respective party coalitions, there is evidence that they are able to target their contributions to particular candidates in support of collective action goals. Barber’s (2016) survey reveals donors’ evaluative criteria for contributing include the candidate’s ideology, the opponent’s ideology, and the closeness of the race—information that is arguably needed to effectively target a contribution for greatest impact. Similarly, by evaluating the actual monies flowing to campaigns, Gimpel et al. (2008) show that the overall competitiveness of the race and the candidate’s ideology are two of the strongest predictors of out of state support. Their contribution data also indicate that donors’ support tends to converge around a particular set of candidates. Although the authors say “partisan coordination, rather than individual initiative, offers a more plausible account” for the contribution patterns they uncover, the authors do not take into account that frequent “harvesting” from a district—which they do document—might educate habitual donors overtime. Baker (2016a) study of party donors demonstrates this potential educative effect as well as donor responsiveness to collective goals. By their second election cycle of giving, the newest party donors showed observable improvements in their likelihood of supporting party priority congressional races in 2008 and 2012. Habitual party donors in general are shown to target their contributions to congressional campaigns in support of their parties’ seat maximization goals.
In short, while parties in particular (Kolodny & Dwyre, 2018), as well as campaigns and some EPN aligned interest groups no doubt do most of the influencing, it would be a mistake to assume that donors are merely followers. If we accept the view that donors are consumers (Magleby et al., 2018), and survey data indicates many of them are sophisticated consumers (Page et al., 2013; Rhodes et al., 2016; Francia et al., 2005; Cook et al., 2014; La Raja & Schaffner, 2015), then they should be able to exert some influence over which candidates receive disproportionate support from the EPN (La Raja & Schaffner, 2015; Rhodes et al., 2018). As La Raja and Schaffner (2015) put it: “donors will exercise their influence by giving their money to candidates and policy-demanding groups who hold views like their own”; “this a form of candidate vetting on policies that takes place in an extended party network” (61). Further, they add: “Candidates, therefore, are more likely to succeed in winning office to the degree that they earn the collective financial support of a dense core of partisan supporters in the partisan network” (61). In keeping with this notion, Moon (2004) takes a game theoretic approach to demonstrate that candidates are dependent upon the resources provided by party activists and, as a consequence, are incentivized to diverge from the median voter in their district in order to keep activists happy—non-incumbents are found to be more likely to succumb to this pressure. Finally, while all donors may not be equally able to target their contributions effectively, Rhodes et al. (2018) demonstrate the set of nationally oriented donors, which they identify and who are the most politically engaged, are able to act like investors by “careful selection of contribution targets” (514).
Additional reasons to believe that donors now enjoy greater influence within the EPN relate to changes in campaign finance laws and the evolving fundraising strategies of House candidates in response to those changes. The Bipartisan Campaign Finance Reform Act of 2002 (BCRA) enabled individual donors to contribute more money to campaigns by setting the total amount a donor could contribute to candidates at $2,000 per election starting in 2004, by adjusting this limit for inflation going forward, and by substantially increasing the aggregate limit donors could give to federal candidates, parties, and PACs (Herrnson et al., 2014). This aggregate limit was overturned in 2014 and took force in the 2016 election cycle, making it possible for donors to contribute legally capped contributions to an unlimited number of candidates, party committees, and PACs (Reynolds & Hall, 2019; discussed further below). And simultaneously, candidates’ reliance upon out-of-state contributions has increased in part because of the rising costs of elections (Baker, 2016b; Gimpel et al., 2008). All of these developments converge to give greater influence to major national donors within the EPN.
Out-of-State Donors within the EPN
Successfully raising some funds from donors outside of the state where the House candidate is running for office may be a way for non-incumbent candidates to gain greater integration into the extended party network (EPN). Importantly, the original authors of the EPN theory, Koger et al. (2009) examine the sharing of mailing lists of “donors and subscribers” between political parties and interest groups as part of their social network analysis measuring strength of ties between different organizational members of the party coalitions (638). Despite the theory’s reliance upon donors for measurement, the role of donors as linking and signaling mechanisms within the network remains undertheorized. Most extensions of the theory focus on the connections between parties and interest groups (see above; e.g. Kolodny & Dwyre, 2018). Additionally, the role of the EPN’s activities in seat maximization and candidate success have received limited attention in the literature. Both issues are of interest to this study because non-incumbent candidates may have to do more than simply win the primary election to earn the full support of the EPN. The donors who give on a national basis may have a great deal of sway in identifying the general election candidates which the EPN organizations embrace. Indicators that the EPN is supporting the non-incumbent candidate include PAC support (Desmarais et al., 2015) and may include joint fundraising support from the parties. It may also involve independent expenditures in support of the candidate or against the candidates’ opponent. The question is whether these forms of support are tied to the candidates’ ability to demonstrate to the broader community of national donors that they are attractive consumption goods (Magleby et al., 2018).
In the only study to do so, Desmarais et al. (2015) investigate whether challengers’ integration into the EPN impacts their electoral success. Using PAC contributions as a measure of integration, they find “unique subsets of PACs converged on distinctive subsets of challengers to finance their elections with contributions and independent expenditures” (207) thereby increasing the candidate’s chances of electoral success. Further, the authors theorize that “EPN support sends a strong signal regarding a candidate’s interest in and capacity to deliver on the party agenda” from a policy and ideological standpoint (197). The more likeminded PACs that support the candidate, the greater certainty about the candidate’s policy stances. What is remains unclear is whether the PACs’ signals influence donors to contribute to the candidate or vice versa. Previous work on PACs suggests their endorsements help non-incumbent candidates to gain greater fundraising support from individual donors (Baker, 2015) and PACs with membership bases further encourage their members to contribute directly to candidate campaigns (Baker, 2018). It also seems likely that the donors who regularly contribute might also play a role in signaling to parties and PACs which candidates they prefer. I hypothesize that PACs contributions to campaigns serve as signals to national donors, and out-of-state donors, as national givers, also end up signaling PACs. Thus, I expect to see a strong endogenous relationship between out-of-state support from donors and PAC support for the candidate. Additionally, as further evidence of this relationship, out-of-state monies should more strongly predict PAC support than the in-state monies the candidate raises.
Part of candidate integration into the extended party network may also relate to their ability to participate in joint fundraising committees, which are an increasingly important fundraising tool for political parties (Kolodny & Dwyre, 2019). The increasing attractiveness of joint fundraisers is largely due to the Supreme Court’s decision in McCutcheon v Federal Election Commission to overturn the aggregate contribution cap limiting the total amount of funds individual donors could contribute to parties, PACs, and federal candidates. A joint fundraising committee (JFC) is comprised of two or more parties, PACs, and/or candidate campaigns, which “share the costs of fundraising and split the proceeds” according to a pre-established contractual formula (Open Secrets). After the Court’s McCutcheon ruling, JFCs can “represent many more individual candidate or party committees” than in the past because donors attending their events no longer need to worry about contributing over their personal aggregate limit and can write a larger check (Reynolds & Hall, 2019, p. 226). Joint fundraisers likely help non-incumbent candidates expand their pool of out-of-state contributors. Thus, I expect to see a set of positive and significant relationships between committee transfers to the campaign and out-of-state fundraising by the campaign.
In sum, a greater ability to raise out-of-state contributions is theorized to reflect the candidate’s greater integration into her respective extended party network. Donors and activists are an important part of the EPN as they make up the membership of organizations with affiliated PACs. Additionally, many party committee donors are also repeat contributors to House races (Baker, 2016a)—in this sense party donors operate in a networked way. If candidates are a consumption good, then parties and interest groups have to keep the consumer in mind and consumers, just as they do outside of the political marketplace, will signal to producers which products they prefer and which they do not. Thus, it is reasonable to think that within the EPN many signals are being exchanged concerning which candidates will best represent the party coalitions’ interests. Parties signal to interest groups by contributing to certain candidates—a multiplier effect follows in which PACs then contribute to those same candidates (Baker, 2014). PACs send signals to donors and to the party committees through their direct contributions to and endorsements of particular candidates (Baker, 2014, 2015). The question is when donors get to have a say in determining which candidates the EPN should support. If donors have no influence, then PAC money should significantly predict out-of-state fundraising but the reverse should not be true. Similarly, out-of-state money should have no relationship to outside spending in support of the candidate. However, if these relationships are endogenous or if out-of-state contributions unidirectionally influence group contributing or expenditures, that suggests donors are active participants in the EPN.
Further, if out-of-state contributing is an indication of the candidate’s integration into the EPN, as I theorize it is, then I expect that these sources of support will have a positive and significant impact on the electoral competitiveness of the candidate beyond what would be expected given the amount of money raised. Put another way, if ten thousand dollars from any source has the same impact on vote margin, then it doesn’t matter where candidates target their fundraising. They can raise money from any source they are able, including self-financing their own campaigns. However, if different sources of money have different signaling effects helping the candidate to raise even more money, gain the attention of the media or voters, and/or indicate the candidate is receiving other non-monetary forms of support as discussed above, then the candidate’s fundraising from different sources does matter and different sources of money will likely have distinct marginal impacts on candidates’ vote margins. Out-of-state funds should have a disproportionately positive impact on vote margin due to both their positive signaling effects within the EPN and because of the additional non-monetary support that is likely associated with its receipt. And out-of-state funds should have distinct positive effects on vote margin from monies raised in-state.
Data and Methods
Three different methods employ the same dataset of non-incumbent House candidates who competed in the general elections of 2010-2018. However, different variables with some overlaps are utilized in each approach. The first approach uses structural equation modeling (SEM) to examine the predicted endogenous relationship between PAC support and out-of-state support from donors in relation to other sources of financial support from parties and interest groups. SEM is appropriate in this instance because, unlike regression analysis, it can accommodate endogenous relationships using path analysis—specifically, SEM is “a multivariate statistical analysis framework that allows simultaneous estimation of a system of equations” (Cain, 2020, p. 159). A primary goal of SEM is to find the best model to fit the data making it a confirmatory rather than exploratory approach (see Golob, 2003 for a discussion). Part of the task of investigating candidate fundraising entails mapping out how success in one area of campaign fundraising may relate to success in another area of campaign fundraising and SEM is designed to perform just such a mapping process—the model system itself of these hypothesized relationships is the result of interest.
I employ Stata’s program for structural equation models using the maximum likelihood method of estimation with standardized coefficients. Standardized coefficients are utilized because in SEM the extent to which the magnitude of each parameter estimate can be explicitly compared to the sizes of other parameter estimates is limited. Parameter estimates are generated using maximum likelihood to minimize the difference between the observed covariances and the covariances implied by the hypothesized model system—in other words, each parameter estimate is a function of the entire system of equations. Standardized coefficients allow the relative effects of each variable to be compared to one another along with their sign and significance. Traditionally, with standardized variables, the magnitude of the effect can be differentiated as follows: path coefficients with large effects will have an absolute value greater than 0.50, those with medium effects will exhibit path coefficients around 0.30, and those with small effects will have absolute values of less than 0.10. More information about this method and related choices can be found in the Appendix. In SEM, a variety of measures are used to evaluate the fit of the models, including the Root Mean Square Error of Approximation (RMSEA).
Two additional approaches test the impact of outside contributions on candidate competitiveness during the 2010-2018 election cycles. A coarsened exact matching analysis (CEM) is included to estimate the impact of varying amounts of out-of-state support on candidates’ vote margins in comparison to varying amounts of in-state support. The advantage of a matching analysis is it can isolate the effect of different ranges of out-of-state and in-state monies on vote margin. This analysis is followed by a full OLS regression estimating how unit changes in various sources of financial support directly impact the candidate’s vote margin using the whole population of non-incumbent candidates who ran 2010-2018. More about the rationale for these two approaches will be discussed after reviewing the variables used in these respective analyses. Open seat candidates and challengers are analyzed together in all three approaches and only major party candidates who ran in the general election are included in the samples used for estimation all three instances.
The primary variable of interest in all three approaches is the total amount of money the candidate raised from individuals residing outside of her state. Other campaign finance variables are gleaned from candidate summary files from the U.S. Federal Election Commission’s website. Totals in hard dollar support from parties (includes direct and coordinated monies) and PACs as well as total disbursements by the non-incumbent’s opponent are taken from the candidate summary files (Party Contributions; PAC Contributions; Opponent’s Total Spending). Total independent expenditures by parties and interest groups (including PACs, Carey PACs, Super PACs, and any electioneering communications by 501(c) organizations) both for and against the non-incumbent candidate are calculated as separate variables using the candidate contribution files (Party Independent Expenditures Supporting NI; Party Independent Expenditures Against NI; IG Independent Expenditures Supporting NI; IG Independent Expenditures Against NI). These variables are summarized because they are added to the model as separate control variables representing the amounts of money generally being spent to help the candidate or, conversely, to hurt the candidate’s competitive chances in keeping with the idea that outside spending by groups follows a “team” approach (Magleby, 2014). As more and more money is raised for House campaigns via joint fundraisers (Dwyre & Kolodny, 2019), I include total transfers from other committees in the SEM and regression models (Transfers From Other Committees). All monies are placed in 2010 constant dollars and divided by a thousand.
Additionally, a number of variables reflecting different characteristics of the candidates, contests, and districts, are added to the OLS regression as controls, with some utilized, as indicated below, in the matching analysis. I include the democratic presidential vote share as a measure of partisan support in the district (Democratic Presidential Vote Share). I also include a dummy variable reflecting whether the candidate has experience in elected office—this variable was coded using candidate biographies on Project Vote Smart’s webpage. Non-incumbent candidates with experience are more likely to have an established fundraising base and to benefit from name recognition (Experienced Candidate). I include a dummy variable for the candidate’s party (Republican) and whether the contest was for an open seat (Open Seat). The Rothenberg Political Report ratings are added as a measure of race competitiveness as these scores are publicly available to donors and political activists alike and there is some thought that, in addition to the Cook Political Report, these are the ratings both sets of actors are most likely to utilize. The Rothenberg ratings are particularly comprehensive because the ratings are constructed using both qualitative interviews with congressional members and key partisan decision-makers as well as quantitative data, such as polling and previous vote shares (Gonzales, 2015). Races that are classified in mid or late October (date of reports varies by year) as titling or toss ups are coded 1, 0 otherwise (Competitive Seat). Finally, I include the percentage of the district that changed after the 2010 Census to reflect the extent of redistricting—this variable is calculated from a Daily Kos analysis of districts in 2012 and their follow up analyses of Florida in 2016 and Pennsylvania in 2018 as both states experienced mid-decade gerrymandering (Daily Kos, 2020). I subtract the amount the district stayed the same, which is expressed as a percentage, from 100. Greater percentage changes indicate that the district has become less competitive (Percentage Change in District Boundaries). The OLS model includes robust standard errors and fixed effects for each election year.
This OLS regression helps to confirm that the results of the CEM analysis are not dependent upon specific matches or match rates and it allows the inclusion of many more control variables than can be accommodated in the matching analysis. That said, the OLS model only provides the estimated additive effects of an additional $1,000 in either in-state or, conversely, out-of-state contributions on vote margin for the average candidate competing in the average district. The expectation is that additional funds in these increments from both sources will have small positive marginal effects on vote margin. However, as the list of variables highlights, subgroup and contextual effects are an issue in these data particularly when it comes to estimating the how the effects of candidate characteristics, fundraising variables, and district-level variables combine to impact vote margin. This creates a problem when it comes to interpreting those effects as multiple three and four-way interactions would be needed to determine conditional effects. Fundraising outliers are also an issue in these data. The matching analysis provides a solution in part to these two data problems. In the matching analysis similar candidates are placed into treatment and control groups for comparison prior to analysis and outlier candidates who do not have comparable matches are dropped from the analysis and thus are not biasing the results (Blackwell et al., 2009). This approach does a good job providing estimates of the average effects of different amounts of in-state versus out-of-state money on the candidate’s vote margin with the least amount of bias and model-dependency (Blackwell et al., 2009) —the impacts of these two sources of money can also be respectively isolated so that a baseline comparison of their relative effects can be made. That said, a limitation of the approach is that the combined effects of candidate characteristics, district characteristics, together with different sources of funds, and other conditional contextual effects on the candidate’s competitiveness cannot be extrapolated as sets of mutually interrelated and important variables. In fact, the goal of the matching analysis is to isolate the effect of the treatment alone, which in this analysis is either in-state or out-of-state money raised from donors.
Specifically, a matching procedure called Coarsened Exact Matching (CEM) is utilized to estimate the effect of different amounts of out-of-state and in-state fundraising from individuals on candidate competitiveness as reflected by the candidate’s vote margin (see Blackwell et al., 2009). In keeping with other matching procedures, CEM generates treatment and control groups containing candidates who are similar to one another based upon both the specified treatment dummy variable and other covariates that represent either exact matches or are coarsened into meaningful categories or bins usually after an examination of the distribution of each variable. The test statistic L1 (ranging from 0 to 1, with 0 indicating complete balance and 1 indicating complete imbalance) along with the match rate are used to assess the balance between the treatment and control groups. Candidates are sorted into treatment and control groups using exact matches based upon their party, whether the seat is open or not, their political experience, and whether the contest is classified as competitive based upon the Rothenberg ratings. Coarsened variables using natural cut-points in the data, such as the median, are also employed to match candidates. They include: the candidate’s total disbursements excluding the amount of money they raised from donors outside of their state; their opponent’s total disbursements; and Democratic presidential vote share in their district. All monies are placed in thousands of 2010 constant dollars.
In keeping with the theory that outside money is worth more than its cash value, the treatment variables are designed to represent different tipping points in which the money raised could serve as a signal to the larger party network, while also testing the relative impacts of the same amounts of in-state versus out-of-state funds. Thus, two monetary treatment effects are utilized on four separately matched subsets of non-incumbent House candidates. The candidates for these subsets are all drawn from the same sample of non-incumbents who competed in the general elections of 2010-2018. Each treatment effect is specified as a dummy variable representing a range of either in-state or out-of-state monies received by the candidate campaign. For the whole sample, the median amount of out-of-state support from donors was $13,767 in 2010 constant dollars whereas the median amount of in-state support from donors was $120,781 in 2010 constant dollars. As candidates raise much more from in-state donors than out-of-state donors on average, I use the percentile ranges for out-of-state money in both sets of analyses. I do this to examine the candidate’s electoral prospects in a scenario where the candidate is able to raise equal amounts of out-of-state money as in-state money. Each type of money is used as a separate treatment. Thus, the first treatment dummy represents total funds ranging from $13,800 to $111,000 in either in-state or out-of-state contributions—candidates raising money within this range are coded 1 and candidates who raised less than $13,800 or more than $111,000 are coded as 0s. The second treatment dummy represents the 90th percentile of candidates who raised $386,000 or more in either in-state or out-of-state monies—with those raising $386,000 or more coded as 1, 0 otherwise. The logic behind these two treatments is to examine the relative signaling effects of a median amount of support, which is achievable for a majority of candidates, versus the effects of receiving the strongest possible signal of support reserved for only a small subset of candidates. The question is twofold: whether party network support provides greater returns on vote margin when out-of-state funding signals are strongest and whether in-state money provides the same returns, less returns, or have no impact at all at different levels of support comparable to similar totals of out-of-state money. Each of these two treatment dummy variables for each type of money—in-state contributions and out-of-state contributions—result in four distinct treatments that are separately tested on four different matched subsets of candidates (as recommended by Blackwell et al., 2009) using the same covariates used for matching that are discussed above. This is due to the fact that each time the treatment variable changes, the matched sample also changes slightly. As a consequence, across analyses the sign, significance, and only the general magnitude of the differences in vote margin can be compared.(Baker, 2014; Golob, 2003)
After the matching process in which treatment and control groups of candidates are created, to calculate the sample average treatment effect on the treated (SATT), a simple OLS regression of each respective treatment dummy on the House candidates’ vote margins including the strata-based weights generated by the CEM logarithms is performed. The House candidate’s victory or loss margin is expressed as a percentage (Vote Margin).
Results
The results of the SEM analysis are displayed in Figure 1. The RMSEA is well below 0.08 (at 0.041) and the Comparative Fit Index (CFI) and Tucker-Lewis Index (TLI) are above the benchmark of 0.9 suggesting the specified model is an excellent fit (see Appendix). As this approach is confirmatory, the fit of the model and the pathways which allow successful convergence represent important indicators of how one source of campaign fundraising relates to another source of campaign fundraising—thus, in some instances, which are discussed below, the absence of a pathway is a significant finding. SEM pathway analysis of non-incumbent house Campaigns’ fundraising and spending by outside groups 2010-2018. Note: RMSEA value of 0.041; CFI value of 0.995; TLI value of 0.984; SRMR value of 0.014; IG = interest group; Indpt = independent expenditures; All coefficients are standardized. Maximum likelihood estimation employed. For all direct effects p < 0.05 for every pathway coefficient displayed along an arrow representing the direction the relationship. Only statistically significant pathways are retained in the model—otherwise, the model would not converge. See Appendix for more details regarding other numerical values presented.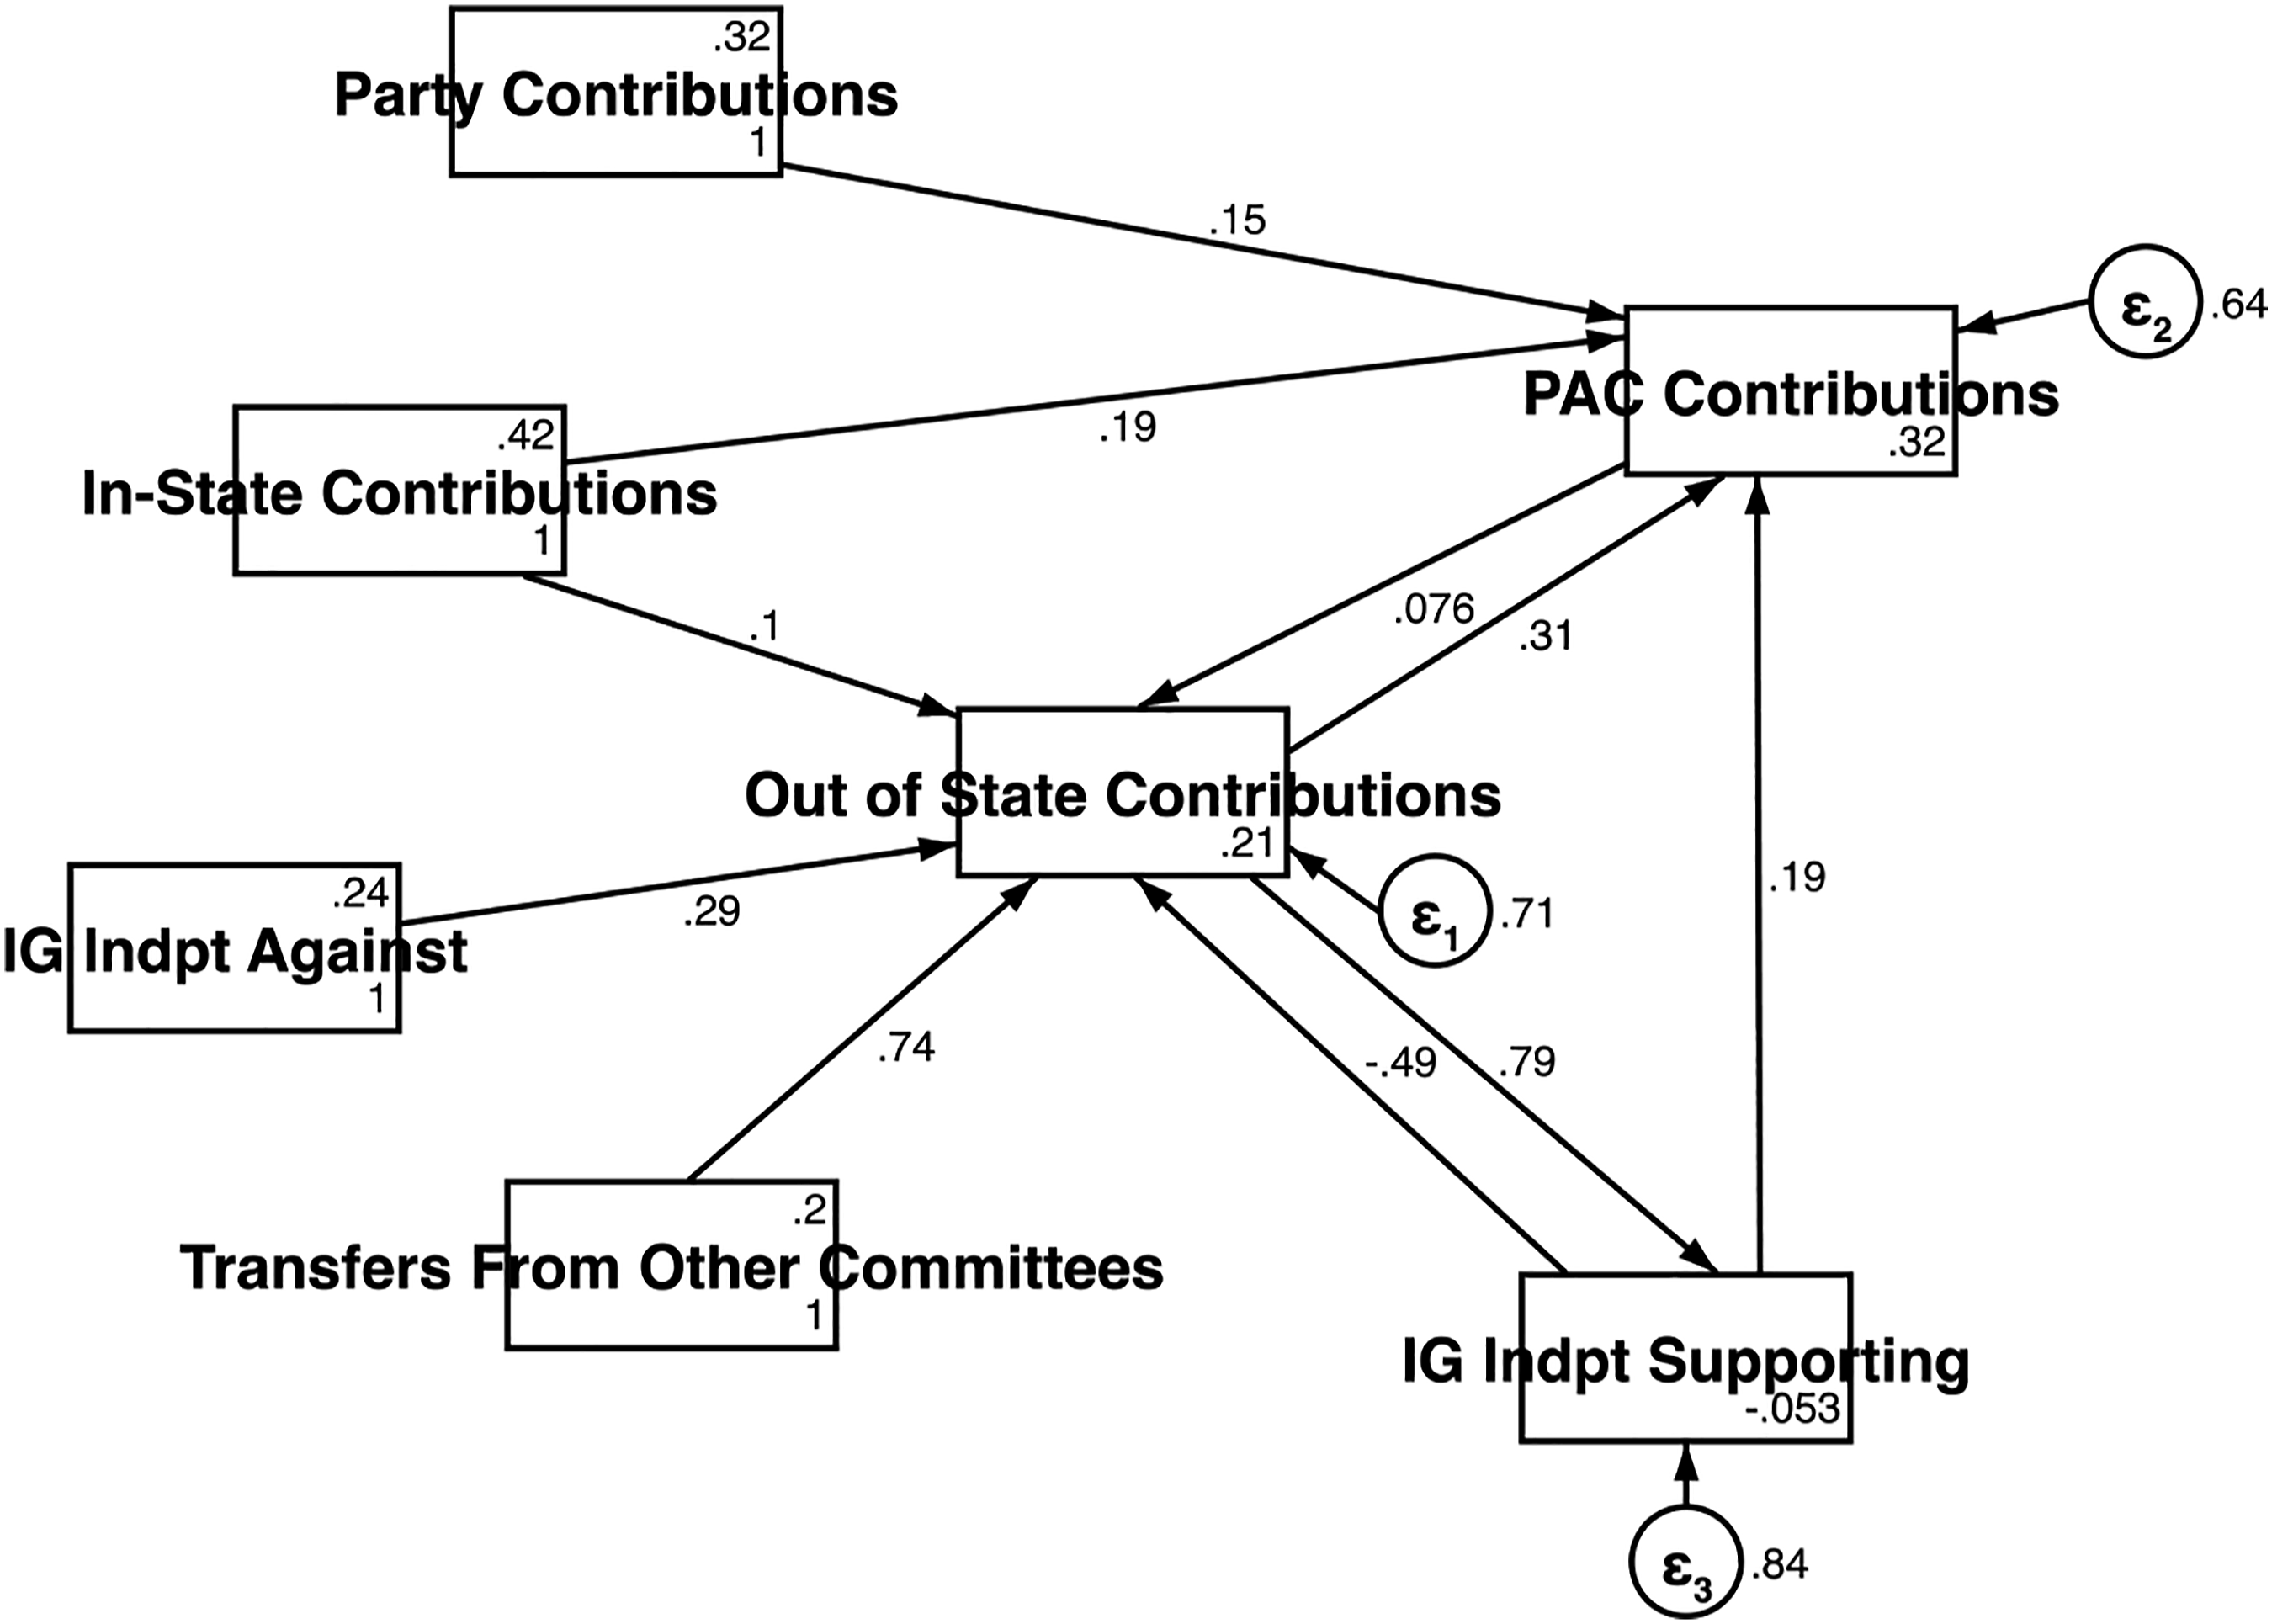
The pathways between out-of-state contributions and PAC contributions are successfully specified as endogenous (see Figure 1). The size of the standardized coefficients suggests out-of-state contributions more strongly predict PAC contributing to the campaign than vice versa but both pathways are positive and significant (
In keeping with previous research (see Baker, 2014), party support significantly predicts PAC contributing to the candidate but other finance variables were not directly related to the candidate’s receipt of direct party support (see Figure 1). Additionally, parties’ independent expenditures both in support of the candidate and against the candidate could not be successfully included in the model as pathways dependent upon or related to any of the other fundraising sources. Relatedly, transfers from other committees, which largely include transfers from joint fundraisers hosted by the national party committees, significantly and positively increase out-of-state contributions (
Coarsened Exact Matching Analyses.
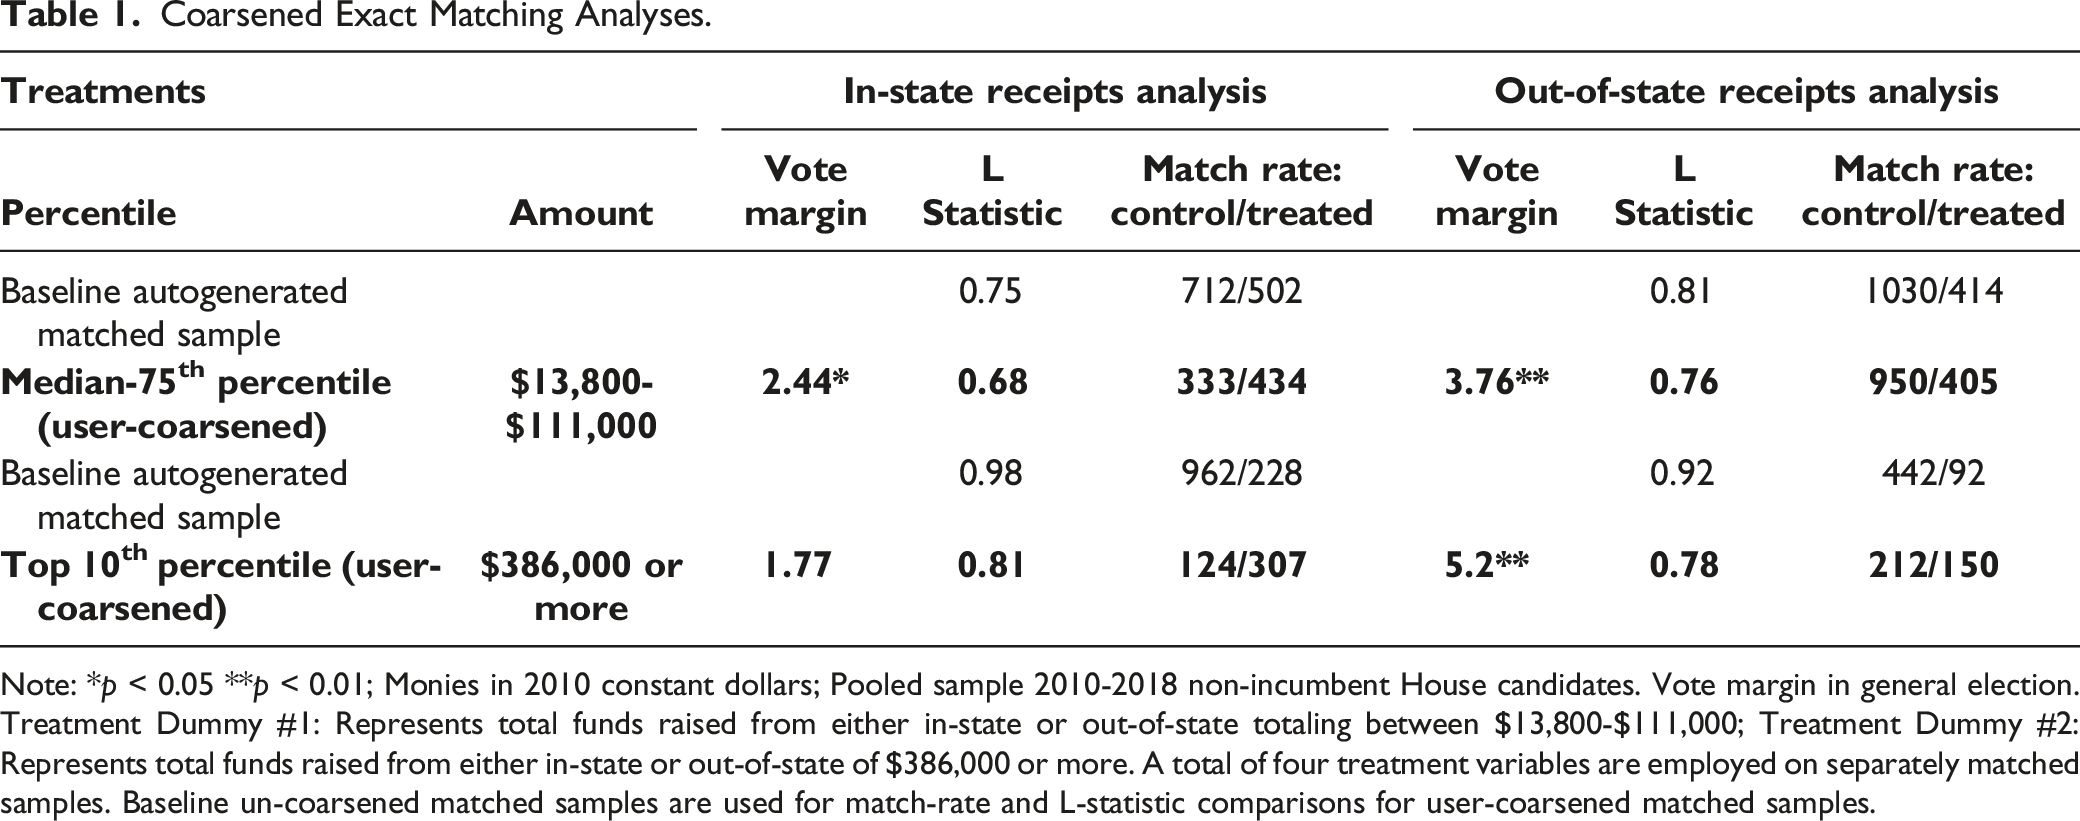
Note: *p < 0.05 **p < 0.01; Monies in 2010 constant dollars; Pooled sample 2010-2018 non-incumbent House candidates. Vote margin in general election. Treatment Dummy #1: Represents total funds raised from either in-state or out-of-state totaling between $13,800-$111,000; Treatment Dummy #2: Represents total funds raised from either in-state or out-of-state of $386,000 or more. A total of four treatment variables are employed on separately matched samples. Baseline un-coarsened matched samples are used for match-rate and L-statistic comparisons for user-coarsened matched samples.
Non-Incumbents’ Vote Margin OLS Regression Model.
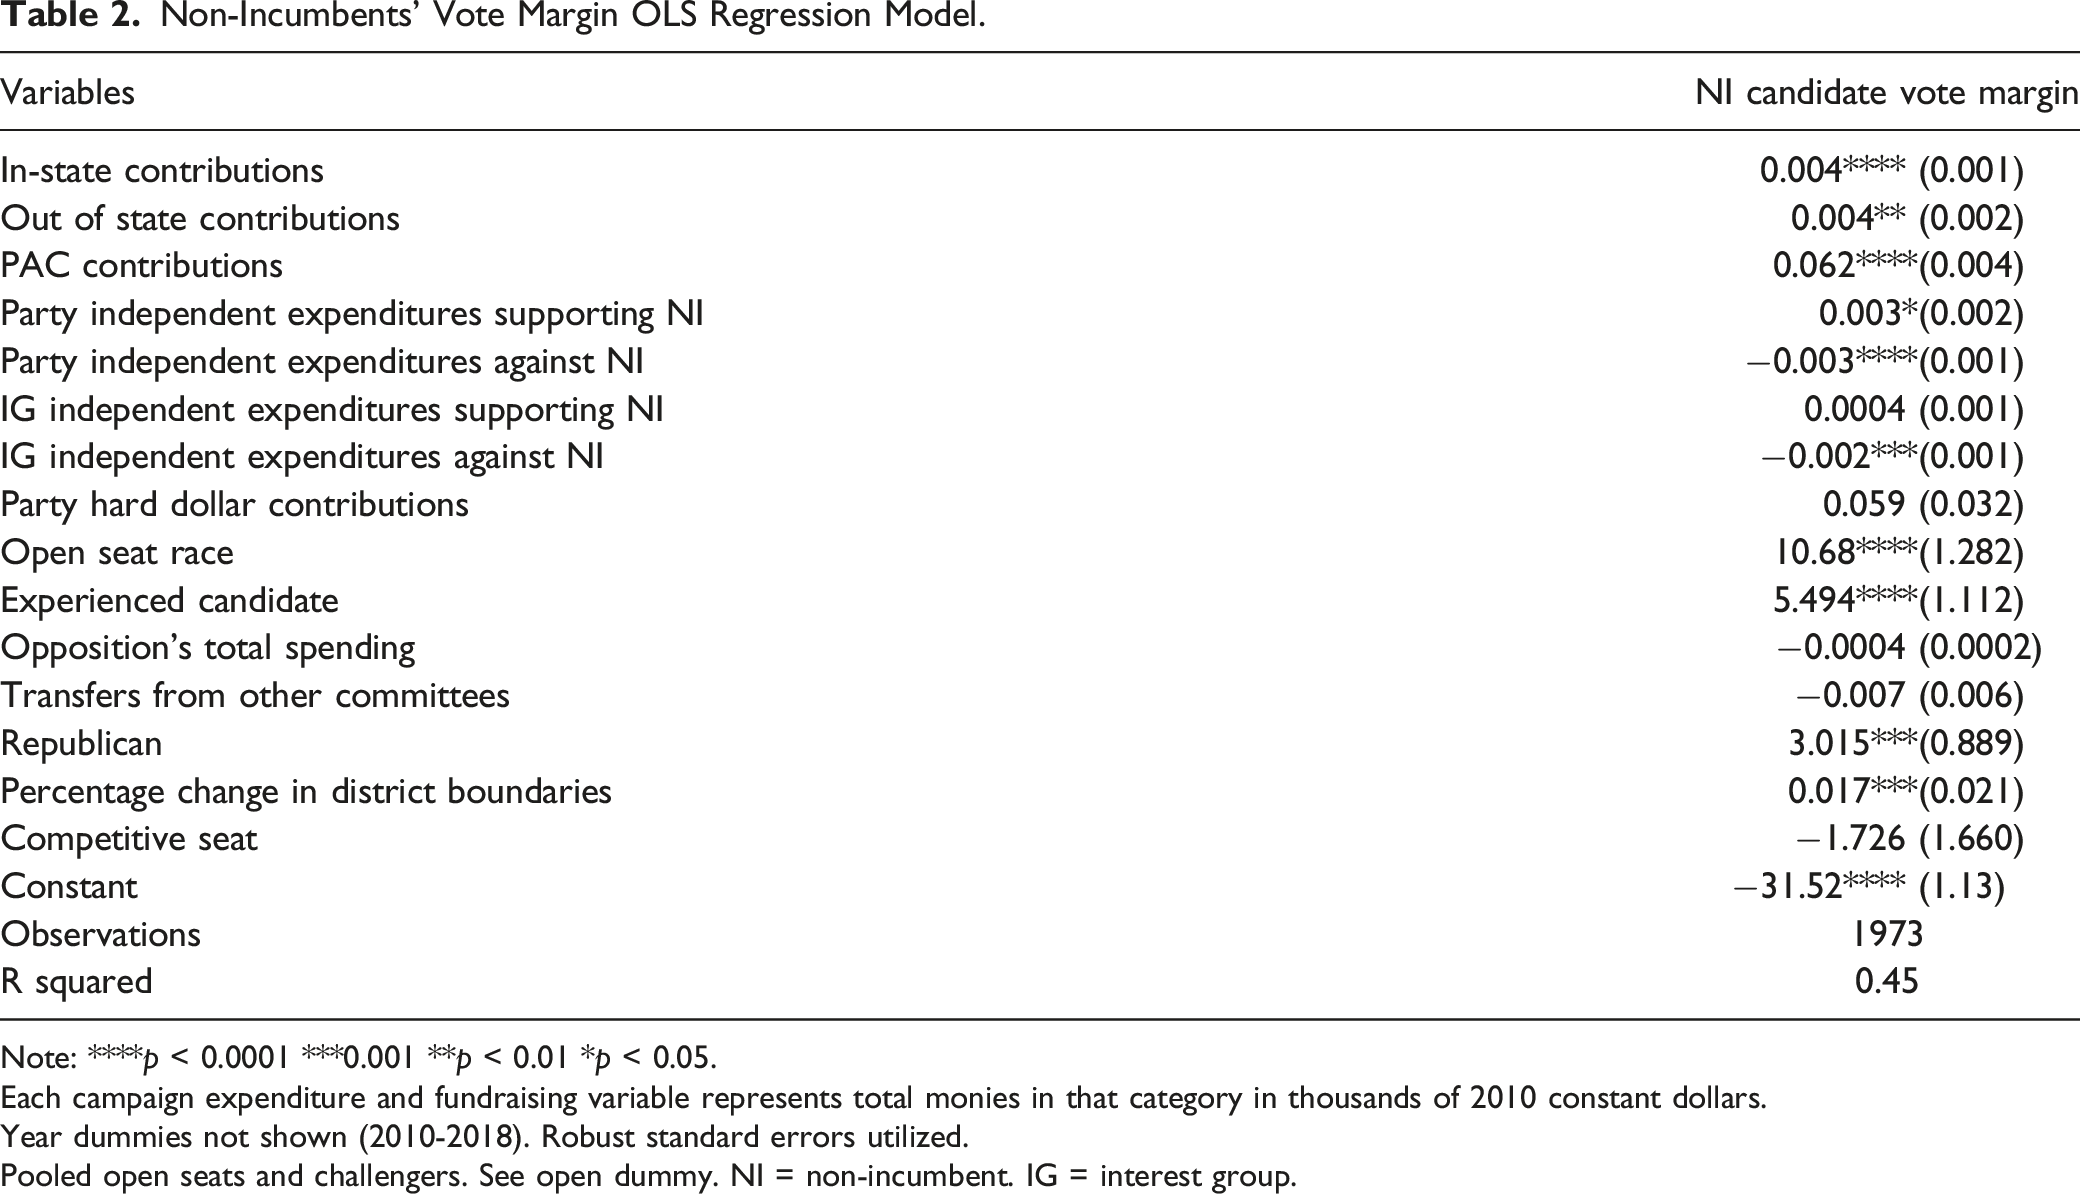
Note: ****p < 0.0001 ***0.001 **p < 0.01 *p < 0.05.
Each campaign expenditure and fundraising variable represents total monies in that category in thousands of 2010 constant dollars.
Year dummies not shown (2010-2018). Robust standard errors utilized.
Pooled open seats and challengers. See open dummy. NI = non-incumbent. IG = interest group.
While the significant effects are all small and marginal, it is important to remember that the units are in thousands of dollars and when it comes to independent expenditures only a handful of races will see large amounts of outside spending. In the 10% of races where interest groups and parties make heavy amounts of independent expenditures, it amounts to hundreds of thousands of dollars. Additionally, in a given election cycle only 3-4 percent of challengers win seats, so rather than simply winning, the focus here is on improvements in the overall competitiveness of the candidate as reflected by the vote margin (Reynolds & Hall, 2019). If we think of each of these sources of support as each having an additive impact on the candidate’s competitiveness, then the gains are much greater and that is the true value of EPN support for non-incumbent candidates. In sum, all of the financial variables have the expected directional effects—either positive or negative—on candidate vote margin.
Out-of-State Fundraising and EPN Integration
The results of the SEM analysis show out-of-state donors hold a significant place of influence within the EPN, particularly in regard to interest group support of non-incumbent candidates. Out-of-state contributions are strong predictors of within-network PAC support more so than within-network PAC support influences out-of-state contributing; at the same time, these sources of money are endogenously related suggesting some degree of interdependence. PAC support has already been identified as an indicator of the EPNs’ support of particular candidates (Desmarais et al., 2015)—thus, the endogenous relationship between within-network PAC support and out-of-state contributors’ support of the candidate suggests national donors’ support, like PAC support, is a sign of candidate integration into the EPN. Furthermore, contributions from within the state in which the candidate is running have a much smaller positive impact on the candidate’s likelihood of receiving PAC support additionally demonstrating that out-of-state contributions represent a unique signal of the candidates’ ties to PACs, and the broader EPN. Further evidence of a potentially complimentary relationship between national donors’ and interest groups’ support with the EPN lies in the positive and significant pathway that is uncovered in SEM analysis between out-of-state contributions and interest groups’ independent expenditures in support of the candidate. This finding is particularly important because it indicates a larger set of interest groups, which includes PACs but also extends to Super PACs, are potentially being influenced by national donors’ support of particular non-incumbent candidates—that the reverse relationship is negative is only further indication that supportive interest groups within the same party network as out-of-state donors are following their lead but not vice versa.
There is also evidence that out-of-state donors are responsive to interest group spending from the opposition party network—their independent expenditures generate a rallying effect in which national donors contribute more to their preferred candidates when those candidates are attacked but the opposition’s choice to spend against those same candidates is not driven by the other EPN’s donors’ support of those candidates. This finding makes it clear that signals between the two EPN’s occur but it also indicates additional work is needed to understand how, when, and under what conditions each extended party network’s fundraising and spending decisions influence one another.
While the results of the SEM analysis indicate donors and interest groups are influencing one another within the EPN, with national donors taking the lead in terms of signaling PACs and at least some Super PACs, they also suggest the national party committees continue to be the nexus of the EPN in keeping with previous research (Herrnson & Kirkland, 2013; Herrnson, 2009; Kolodny & Dwyre, 2018). The parties’ hard dollar contributions to the campaign have a significant indirect effect on out-of-state fundraising—party contributions significantly increase the likelihood of PAC contributions, which in turn are associated with greater success in raising out-of-state contributions. Thus, in line with previous studies, national donors in this study are shown to be responsive to parties’ signals to the EPN (Baker, 2016a; Herrnson & Kirkland, 2013; Kolodny & Dwyre, 2018). Additionally, transfers from other committees positively and significantly increase the likelihood of out-of-state contributions suggesting parties’ joint fundraisers, which largely make up those transfers, are key conduits for out-of-state contributions—again, suggesting many out-of-state donors take their cues about which candidates to support from the parties’ national committees. Conversely, party support is not found to be contingent upon the non-incumbent candidate’s fundraising success. Neither parties’ independent support of the candidate nor the opposition parties’ choice to spend money against the candidate relates to the candidates’ success with fundraising from either PACs or individual donors, whether in-state or out-of-state. This implies the parties decide which non-incumbent candidates to target without relying upon fundraising signals from other EPN members. In this vein, out-of-state contributions do not increase the amount of money raised via transfers from other committees—further suggesting parties recruit donors to support particular campaigns rather than vice versa. These findings indicate parties are sending their own signals to the EPN about which non-incumbent candidates are considered priorities and the results of the SEM analysis suggest many national donors and PACs for their part remain responsive to those signals.
Taken together, the results of the SEM analysis suggest successful fundraising from out-of-state donors serves as an indicator of the candidate’s integration into the EPN. Candidates who receive the support of out-of-state donors also benefit from additional interest group support in the form of direct contributions and independent expenditures, which in turn may also be accompanied by non-monetary forms of support, such as endorsements. And if the campaign is receiving sizable amounts of out-of-state funding this also suggests the party committees have thrown their support behind the candidate as well. The results of the matching and regression analyses further underscore the importance of EPN integration for candidate competitiveness, while also showing out-of-state contributions have unique signaling effects that are distinct from any signaling effects associated with similar amounts of in-state contributions from donors.
Out-of-state funds ranging from the median to the 75th percentile provided roughly the same gains to candidates as in-state funds in the same range, but with a higher level of significance than in-state funds. However, at the 90th percentile, out-of-state funds provided a predicted 5.2% greater increase in vote margin whereas in-state funds did not have a significant effect. And 5.2% is the sample average treatment effect on the treated, meaning for some candidates in this sample the gains can be higher. When these results are juxtaposed with those from the SEM analysis, it is clear that out-of-state monies are signaling other groups within the larger EPN that the candidate is worth supporting and those signals provide the candidate with higher rates of return on vote margin. In-state funds do not have the same impact—this is a likely because in-state donors are not as strongly integrated into the larger EPN as the set of national donors, who not only have membership in multiple groups within the EPN, but also are networked among themselves (Francia et al., 2003).
In close races, these marginal improvements in vote share are likely pivotal for candidate success. That said, it is important to note that these are estimated average effects for the treated subset of candidates which are grouped together during matching. While the matching analysis isolates the respective effects of out-of-state and in-state funds and demonstrates out-of-state funds are worth more than their simple cash value—otherwise these monies would have the same treatment effect as in-state monies raised in the same quantities, on average—a limitation of this approach is that it cannot determine which district and candidate characteristics combine with out-of-state support to have the greatest improvement on candidate competitiveness. One can imagine an experienced non-incumbent candidate running for the second time—benefiting from some name recognition and an established local fundraising base and competing in a swing district—to have an easier time attracting out-of-state donors than a non-incumbent candidate who does not enjoy those advantages. Additional studies are needed to advance our understanding of how money interacts with other contextual variables at different points in time over the course of the entire election cycle to produce competitive gains for the campaign as Election Day approaches.
Despite these limitations, the results do shed light on how relationships within the broader EPN work. Out-of-state donors or national donors are the linking mechanisms within the network connecting parties and interest groups organizations to one another (Koger et al., 2009; Rhodes et al., 2018). And this set of “strategic donors” (Rhodes et al., 2016) have the greatest influence when it comes to interest group support of candidate campaigns. This is likely because national donors are members of multiple interest group organizations (Francia et al., 2003), have volunteered on campaigns (Francia et al., 2003), are networked with other donors living in the same wealthy zip codes (Cho-Tam & Gimpel, 2007; Gimpel et al., 2006; Gimpel et al., 2008), and many campaign donors are habitual party donors as well (Baker, 2016a). Examining non-incumbent candidate support is a great way to test these relationships as many of the candidates are new to politics and do not have established fundraising bases or name recognition (Jacobson & Carson, 2016). Thus, the EPN needs to determine which set of newcomer candidates to target based upon a limited set of information. The results suggest the parties as well as national donors take the lead in vetting candidates and their support sends signals to the rest of the network about the viability of particular campaigns (La Raja & Schaffner, 2015). Non-incumbent candidates in particular need national donor support in order to be brought into the fold of the larger EPN and to enjoy its benefits, both monetary and non-monetary, which the results of these analyses suggest lead to gains in vote shares. And national donor support is especially critical for non-incumbent candidates as the EPN expands overtime to include more Super PACs and the role of interest groups in elections grows.
Footnotes
Declaration of Conflicting Interests
The author(s) declared no potential conflicts of interest with respect to the research, authorship, and/or publication of this article.
Funding
The author(s) received no financial support for the research, authorship, and/or publication of this article.
Note
Author Biography
Appendix
Structural Equation Modeling. Standardized coefficients are justified for two reasons. First, direct comparison of parameter estimates is limited in SEM. It is not an approach that is designed to identify the exact magnitude of specific causal effects of one variable upon another—rather the system of hypothesized relationships is the result of interest. Due to the fact that maximum likelihood is used to find the best model to fit the observed data, each parameter estimate is a function of the model system and can only be compared in terms of sign, significance, and general magnitude—in other words, specific unit estimates can change as the model system changes. Second, even though all of the variables are in thousands of 2010 constant dollars, they are not all free to vary in the same way. Independent expenditures are unlimited in amount but each of the contribution variables are subject to campaign finance contribution limits 2010-2018. These variables include both in-state and out-of-state contributions from donors to congressional campaigns, the party committee’s direct contributions to congressional campaigns, and PAC contributions to congressional campaigns. PAC contribution limits remained the same over this time period with multi-candidate PACs able to contribute $5,000 to a congressional campaign and $15,000 to a party committee (US Federal Election Commission). In 2010, the individual contribution limit to House campaign was $2,400 and it rose to $2,700 in 2018 (US Federal Election Commission). The global hard dollar contribution limit for individual donors making contributions to campaigns, party committees, and PACs was eliminated in 2014. For the 2010 cycle, the global contribution limit was $115,500 and in 2012 it was $117,000 (US Federal Election Commission). Party committees can contribute $5,000 in direction contributions per election to a House candidate 2010-2018. For Senate campaigns, the party contribution limit rose from $42,600 per campaign in 2010 to $47,400 per campaign in 2018 (US Federal Election Commission). These limits could affect the variance of these variables by making them bounded—in most cases the total amount raised will be less for hard money contributions, those listed above, than the totals for independent spending in support of or against the candidate. Standardizing allows the coefficients to be compared to one another and the relative magnitude of the effects to be understood more easily. Another way of thinking about this is a that a hundred dollars of PAC money is not the same as a hundred dollars of Super PAC money in terms of signaling effects—a hundred dollars of PAC money is worth more as a signal because it can only be contributed as a fraction of $5,000 as opposed to a fraction of infinity in case of a Super PAC dollar.
SEM Diagram Interpretation. Path coefficients lying above the arrows represent the magnitude of the effect and the directionality of the relationship. In each box, representing a variable, there are different values listed. For the exogenous variables, which include party contributions, in-state contributions, interest group independent expenditures against the candidate (IG Indpt Against), and transfers from other committees, the value in the upper righthand corner is the mean constant and the value in the lower righthand corner is the variance. For endogenous variables, which include out-of-state contributions, PAC contributions, and interest group independent expenditures in support of the candidate (IG Indpt Supporting), the value in the lower righthand corner is the intercept constant. Next to each circular error terms, the variance is listed. In path analysis, direct, indirect, and total effects as well as endogenous relationships are examined in relation to one another. The goal is to understand how fundraising in one area affects fundraising in another area—for example, if the candidate successfully raises more out-of-state contributions from donors will the candidate receive more PAC contributions? Insignificant pathways are dropped from the final analysis, although sometimes an insignificant pathway that does not end up in the final model system can be an interesting finding, as was the case here with parties’ independent expenditures. The RMSEA for the model was 0.041. The CFI was 0.995 and TLI was 0.984.