
Abstract
Substantial research exists to support the use of reading curriculum-based measures (R-CBMs) for screening and progress monitoring in schools; however, nearly all of this work has been done in English. The changing demographics of students who attend public school includes children who speak other languages. The purpose of this study was to examine the relationship between R-CBMs in Spanish used as a universal screening measure and performance on the state achievement measure in Spanish. Results included moderate correlations at third and fourth grade. Diagnostic accuracy results using the 25th percentile and the selection of cut scores using receiver operating characteristic curves suggest the utility of R-CBMs in Spanish for screening purposes. Practical implications and future directions for research are discussed.
The use of curriculum-based measures (CBMs) in schools as a way to directly measure student academic skills is supported by nearly 40 years of research. Many studies have established that CBMs are able to function as indicators of academic skill capacity (Deno, 1985; Deno, Mirkin, & Chiang, 1982), allow for determining specific skill deficits (Shapiro, 2011), and are adequate tools for progress monitoring response to instruction (Fletcher & Vaughn, 2009). CBMs have been developed for use in reading, math, writing, and spelling, with reading CBMs (R-CBM) being the most widely used in the school setting. Increasingly, and most notably as a result of the shift to response to intervention (RTI) models of service delivery, CBMs have become a more common part of measurement practices in schools as an effective and efficient method for screening student performance in RTI models (Glover & DiPerna, 2007) and for determining adequate student progress (Deno, 2003).
The technical adequacy of R-CBMs in English is well established; however, the population of students who attend public school in the United States is rapidly changing. The National Center for Education Statistics [NCES] reported in 2008 that of the students in schools who spoke a language other than English, 75% spoke Spanish (NCES, 2010). Research conducted by the Pew Hispanic Center has indicated that the number of Latino children under 17 years of age has grown 39% over the last 10 years (Passel, Cohn, & Lopez, 2011), and this group of students is at increased risk of dropping out of school (Fry, 2010). Given the increase in the number of students who speak Spanish in schools and the increased risk for school failure and drop out, methods for screening to identify students at risk academically is critical. Adequate measurement strategies should include tools that allow for the measurement of the academic skills of English language learners (ELLs) in both English and in their native language.
CBMs have been suggested as an appropriate and valuable tool for use in the measurement of reading skills for both ethnic minority as well as language minority students (Baker & Good, 1995; Baker, Plasencia-Peinado, & Lezcano-Lytle, 1998; Ramírez & Shapiro, 2006, 2007). Despite substantial evidence to support the use of R-CBMs in English to identify academic skill problems for all children, several questions about their use persist. The technical adequacy of R-CBMs in Spanish and its utility as a screening tool for identifying students at risk for academic failure has not been fully established. With increased emphasis on accountability and performance on high stakes, statewide measures of achievement, questions about how R-CBM relates to performance on longer, more substantial measures of achievement is of ongoing relevance. This study examined the relation between R-CBMs in Spanish and statewide standardized measures of reading achievement in Spanish and the utility of Spanish R-CBMs for identifying ELLs at risk for poor performance. Given the increased number of children in public schools who are ELLs and who speak Spanish in particular, this is a validity question that warrants attention.
CBMs and Statewide Achievement Tests
Research over the last decade has examined whether CBMs are related to high stakes, statewide achievement tests. Implementation of the No Child Left Behind (NCLB) Act requires that each state develop standardized achievement measures in reading and math that are administered annually beginning in third grade (NCLB, 2003). Each state test is developed based on the curriculum standards developed in the state and therefore examining the relation between CBMs and statewide standardized achievement measures has become a critical validity issue for CBM. The relation between R-CBMs in English and statewide achievement tests has been examined in numerous states including Oregon (Good, Simmons, & Kame’enui, 2001), Washington (Stage & Jacobsen, 2001), Florida (Roehrig, Petscher, Nettles, Hudson, & Torgesen, 2008), Pennsylvania (Shapiro, Keller, Lutz, Santoro, & Hintze, 2006), and Texas (Wanzek et al., 2010), among others. Results across studies indicate that there is a significant positive correlation between R-CBM benchmarks in English across the year and performance in the spring on statewide achievement tests, suggesting that R-CBM is a valid indicator of reading performance in English (Reschly, Busch, Betts, Deno, & Long, 2009).
In addition to studies of validity, the predictive validity and diagnostic accuracy of R-CBM has also been examined. Good et al. (2001) found 96% of children who met the reading fluency benchmark at third grade met or surpassed the expected level of performance on the statewide high-stakes assessment during the same academic year. Most other studies of diagnostic accuracy have found diagnostic accuracy results to be in the .60 to .80 range across measures of sensitivity and specificity, with overall classification rates hovering around .70 (Hintze & Silberglitt, 2005; Roehrig et al., 2008; Shapiro et al., 2006; Stage & Jacobsen, 2008). The diagnostic accuracy results have persisted across the use of different R-CBMs as well as across the various state achievement tests given between third and fifth grade. The pattern of diagnostic accuracy across studies indicated that lower sensitivity and positive predictive power were typically found with higher specificity and negative predictive power, indicating that the use of R-CBMs is more likely to accurately identify students who will pass the criterion measure than those who will fail. Various approaches to examining the diagnostic accuracy of R-CBMs for performance on statewide achievement measures have been used, but the research has recently been dominated by statistically driven procedures such as receiver operator characteristic (ROC) curves (Hintze & Silberglitt, 2005; Shapiro et al., 2006; Swets, Dawes, & Monahan, 2000).
Most relevant to the present study, Wanzek et al. (2010) examined the relation between R-CBMs in first through third grade using the DIBELS ORF and performance on the Texas Assessment of Knowledge and Skills (TAKS) and on a nationally standardized test, the Stanford Achievement Test (SAT-10; Harcourt Educational Measurement, 2003). Correlations were similar to those found in other studies and ranged from a low of .44 for the relation between winter R-CBM in first grade and the TAKS in third grade, to a high of .70 between the winter R-CBM score in third grade, and performance on the SAT-10 in third grade. Higher performance on R-CBMs was required for success on the SAT-10 than for success on the TAKS, indicating a difference between state and national achievement standards (Wanzek et al., 2010).
Results of numerous studies have indicated a positive relation between R-CBMs and state tests and supported the predictive validity of R-CBMs for understanding future student performance. Research regarding decision-making and diagnostic accuracy has begun to critically examine the use of diagnostic accuracy statistics and their utility in the context of RTI models. Some suggest that the measures we currently have may lack the diagnostic strength that is required for higher-stakes decision making (Jenkins, Hudson, & Johnson, 2007) and that caution should be used when using diagnostic accuracy statistics such that they are not misapplied and do not generate misleading results (VanDerHeyden, 2011). Research must continue to investigate the functionality of screening measures and the degree to which they improve diagnostic accuracy for the identification of later problems beyond that of chance. It is also important to extend these questions to include the investigation of diverse populations like ELLs because of the implications for early identification and intervention for children experiencing academic difficulties (Betts et al., 2008; Hosp, Hosp, & Dole, 2011).
CBMs With English Language Learners
CBMs have been proposed for use to measure the transfer of language skills from one language to another (Baker et al., 1998), for academic skills progress monitoring (Baker & Good, 1995), for adjusting language instruction to improve student language development and achievement outcomes (Fuchs & Deno, 2001; Fuchs & Fuchs, 2002), and to function as an alternative, less biased assessment strategy for bilingual students (Bentz & Pavri, 2000; Esparza Brown & Sanford, 2011). In addition, R-CBM has been found to be an adequate measure of the response to instructional intervention for ELLs from diverse backgrounds (Wayman, McMaster, Saenz, & Watson, 2010).
CBMs and Statewide Achievement Tests for ELLs
Studies have examined the use of R-CBMs in English and the relation with statewide measures of achievement for students who are ELLs with diverse language backgrounds including Spanish. Wiley and Deno (2005) studied the use of both R-CBM and Maze passages in English as predictors of state test performance for 36 third- and 33 fifth-grade students in Minnesota. Fall CBM data were used along with the statewide achievement measure that is administered in March for a subset of 15 third-graders and 14 fifth-grade students who were considered ELLs. Correlation results yielded a stronger relation between the CBMs and the state assessment for non-ELLs than for ELLs and the use of Maze in addition to R-CBMs found that the Maze task accounted for most of the variance in state test performance but mostly for the non-EL group. A limitation to this study was that students enrolled were all classified as being in need of additional instructional intervention because of performance below most of their peers on the CBM Maze task in addition to the use of a small group of ELLs in the total sample.
Muyskens, Betts, Lau, and Marston (2009) examined the diagnostic accuracy of R-CBMs for fifth-grade students who spoke numerous languages at home including Spanish, Hmong, and Somali, for performance on the Minnesota Comprehensive Assessment (MCA). The use of ROC curves to establish cut scores yielded specificity of 90% and sensitivity of 44%, while false positives were 34% and false negatives 22% and positive predictive power was 66% and negative predictive power 78%. ROC curve analysis showed significant results and acceptable discrimination and suggests that CBM scores are a valid indicator of later reading passing status on state proficiency tests.
R-CBMs in Spanish
The studies conducted thus far have used R-CBMs in English to monitor the reading skill of students who speak various languages at home. Considerably less research has been done to examine R-CBMs in different languages. A series of two studies by Ramírez and Shapiro (2006, 2007) used R-CBM passages in both English and Spanish to investigate the growth patterns and reading performance on passages of both languages. Ramírez and Shapiro (2006) examined both native English speaking students and Spanish speaking students in bilingual programs. Spanish reading passages were developed for the purpose of this study using reading instructional materials. The results indicated that Spanish speaking ELLs read less fluently in Spanish than general education students did in English across grades. One explanation for this finding was that Spanish stories tended to be longer in mean syllables than English passages; consequently, reading time is increased by word length (Ramírez & Shapiro, 2006).
This work was extended to examine the expected oral reading fluency growth rates specifically among Spanish speaking ELLs in both English and Spanish across first through fifth grades (Ramírez & Shapiro, 2007). The findings suggest that all students showed growth from the beginning to end of the school year and that oral reading fluency in Spanish was related to fluency levels on English passages. Specifically, Ramirez and Shapiro (2007) found that R-CBM performance in English at the end of the year was significantly predicted by R-CBM performance in Spanish at the beginning of the year for students receiving transitional bilingual programming. The authors suggest that this provides support to the hypothesis that establishing native language fluency is essential to supporting the acquisition of English language skills and provides support for the use of R-CBMs as a tool for measuring language loss and acquisition (Ramírez & Shapiro, 2007). Although these studies advance the literature on R-CBM performance across languages, they provide only initial evidence of validity for the use of R-CBMs in Spanish. In addition, the Spanish R-CBM passages used in the studies described above were developed by the researchers for the purpose of the study and were not taken from a commercially developed probe set and no technical adequacy for their use is established.
R-CBM passages in Spanish have been developed for general use. Baker, Cummings, Good, and Smolkowski (2007) examined the reliability and validity of early literacy and reading fluency measures in Spanish, the Indicadores Dinamicos del Exito en la Lectura (IDEL; Baker, Good, Knutson, & Watson, 2006), published R-CBMs in Spanish. As part of the passage development process, the IDEL R-CBM scores in Spanish were correlated with the Bateria Woodcock-Munoz: Pruebas de Aprovechamiento–Revisada (Woodcock & Munoz-Sandoval, 1996) at the end of first and second grades. Correlations with the Letter and Word Identification subtest was .75, Word Attack was .80, and Text Comprehension was .73, all significant at the p <.001 level. Correlations with the Vocabulary subtest were not significant (–.11). The relation between the IDEL R-CBM in Spanish and the Spanish achievement subtest at the end of second grade were all significant at the p <.01 level and ranged from .56 for Vocabulary to .64 for the Total Score (Baker et al., 2007). These measures are the only published R-CBMs in Spanish that have accompanying technical adequacy data.
Purpose of the Current Study
Several decades of research support the utility of R-CBMs for a variety of educational purposes; however, very few studies have examined R-CBMs in other languages and limited validity exists for R-CBMs in Spanish in particular. Given that many students who speak Spanish as a native language in schools experience increased risk of drop out, effective tools for screening in Spanish to identify students who are in need of academic skills intervention are critical. In addition, although numerous studies across the country have examined the relation between CBMs and statewide assessments, it is important that this work continue because of the practical implications that understanding the relation between R-CBMs and state tests has for decision making about which students are at risk for failure and require intervention. In fact, there have not been any studies to investigate the adequacy of R-CBMs in Spanish using a statewide achievement criterion in Spanish and no published work using the AIMSweb (Pearson Education, Inc., 2010) R-CBM passages in Spanish.
The purpose of this study was twofold. First, the relation between R-CBMs in Spanish and performance on the reading Spanish Texas statewide achievement test, the TAKS (Texas Education Agency, 2010), in reading within the same academic year was examined. The second question focused on the diagnostic accuracy of R-CBM cut scores in Spanish for identifying whether students will be successful on statewide achievement measures of reading in Spanish using both the 25th percentile as well as a cut score established using ROC curves. Although there are benefits to using ROC curves from a statistical perspective, the practice of using a cut point established based on environmental resources available in the school setting is often used. A comparison of the diagnostic accuracy results across fall, winter, and spring benchmark periods generated by ROC curves and by the use of the 25th percentile cut score is warranted.
Method
Participants
Participants in this study were students in the third and fourth grades in a school district in the southeastern United States. This district serves more than 21,000 students including 73% Latino, 20% African-American, 6% White, 1% Asian/Pacific Islander, and <1% American Indian. The district demographics also include 74% economically disadvantaged students as well as 29% limited English proficient students. The school district routinely collected universal screening data using R-CBMs in both English and Spanish three times per year (fall, winter, and spring) as part of the implementation of a RTI service delivery system. Students were included in the study if data existed for the statewide test in Spanish and any one of the Spanish R-CBM benchmarks. All students included in the study were enrolled in bilingual classrooms where a percentage of instruction was given in English and the rest in Spanish. The students included in this study took the TAKS in Spanish and were identified as limited English proficient (LEP); however, data regarding language proficiency testing were not available.
A total of 1,927 third-grade students and 1,848 fourth-grade students took the TAKS during the spring of 2010 in the school district where these data were obtained. In third grade, 1,466 students took the TAKS in English and 461 took the TAKS in Spanish. Also at third grade, 291 students were assessed using R-CBMs in Spanish at each benchmark period. Of the students who were given benchmarks using R-CBMs in Spanish, 205 took the TAKS in Spanish and 87 took the TAKS in English. Missing R-CBM Spanish data accounts for decreases in sample size from 205. The third-grade sample also included 144 (49.5%) girls and 147 (50.5%) boys, and 261 (89.7%) students receiving free or reduced-price lunch.
At the fourth-grade level, 1,562 students took the TAKS in English and 286 took it in Spanish. A total of 175 students completed R-CBM benchmarks in Spanish, and of those students, 131 took the TAKS in Spanish and 44 took it in English. Students who took the TAKS in Spanish were those who were served in bilingual classrooms. The fourth-grade sample also included 92 (52.6%) girls and 83 (47.4%) boys as well as 160 (91.4%) students receiving free or reduced-price lunch.
Measures
Spanish R-CBM
Reading passages in Spanish were taken from the AIMSweb system of benchmark probes (Pearson Education, Inc., 2010). AIMSweb R-CBM benchmark probes include three grade-level reading passages that are given three times throughout the academic year, fall, winter, and spring. The median words read correct per minute (WRC) was recorded for each student. Reliability and validity for the use of 1-minute reading passages in English is well established. Reliability studies have indicated adequate interrater and test–retest reliability (see Marston, 1989 and Wayman, Wallace, Wiley, Ticha, & Espin, 2007). Additional reliability estimates for R-CBMs have been reported to be in the .90 range (Christ & Silberglitt, 2007). Studies of the validity of R-CBMs for measuring overall reading achievement have also indicated the technical adequacy of R-CBMs (for a summary of reliability and validity, see Wayman et al., 2007). The R-CBM Spanish passages from the AIMSweb system are translations of the R-CBM English passages. To date, there are no reliability or validity studies using scores on R-CBMs in Spanish and therefore no technical adequacy data available specifically regarding the AIMSweb reading benchmark passages in Spanish. Users of the AIMSweb reading passages in Spanish are directed to the existing data regarding R-CBMs in English for technical adequacy. However, given differences in language difficulty, separate examination of the R-CBM Spanish passages is required in order to establish technical adequacy.
Spanish TAKS
The TAKS is a paper-and-pencil test administered to students in Texas beginning in third grade and on through fifth grade during the spring, typically during the month of April (Texas Education Agency, 2010). The TAKS is untimed and students are permitted to take breaks throughout testing as needed. The third-grade reading TAKS contains 36 total items; the fourth-grade version contains 40 items. The four main objectives assessed on the TAKS are Basic Understanding, Applying Knowledge of Literary Elements, Using Strategies to Analyze, and Applying Critical Thinking Skills. These skills are given differential emphasis at various grade levels depending upon the curricular expectations for that grade. At third grade, the number of items across the four domains of the reading TAKS in Spanish are 15, 7, 6, and 8. On the fourth-grade Spanish version TAKS, the distribution of items across the four domains is 15, 8, 7, and 10, respectively (Texas Education Agency, 2010).
A total of 34,719 third-grade students took the reading TAKS in Spanish during the 2009-2010 school year. The TAKS system uses a vertical scale score to report results. Scores of 503 and 555 were considered passing scores on the reading TAKS in Spanish at the third- and fourth-grade levels, respectively. The standard error of measurement for the passing score on the reading Spanish TAKS at third and fourth grades was 27. The mean standard score performance for this group was 602.7, with a standard deviation of 101.5. At the fourth-grade level, 21,558 students took the reading TAKS in Spanish and the mean performance was 636.2 with a standard deviation of 94.6.
The reliability of the reading TAKS was determined using Kuder-Richardson 20 (KR20) reliability estimates (Texas Education Agency, 2010) and the standard error of measurement for student scores is also available. The KR20 coefficients for the third-grade Spanish TAKS include 0.89 for the entire assessment, 0.74 for the Basic Understanding objective items, 0.62 for the Applying Knowledge of Literary Elements domain, 0.51 for Using Strategies to Analyze, and 0.71 for Applying Critical-Thinking Skills. The KR20 results at the fourth-grade level included 0.87 for the total test, 0.67 for the Basic Understanding domain, 0.59 for the Applying Knowledge of Literary Elements, and 0.51 for Using Strategies to Analyze, and 0.67 for Applying Critical-Thinking Skills.
Validity evidence on the reading TAKS in Spanish includes content validity. Evidence of content validity includes the process of establishing the test items such as developing items based on the state content standards, field testing of items, and reviewing the test items with educators and other content experts (Texas Education Agency, 2010). Reference is made in the Technical Digest (Texas Education Agency, 2010) to studies that examine the relation between the TAKS and performance in courses as measured by the grade earned; however, these data are not available for third- and fourth-grade students. Students in third grade are required to pass the reading TAKS in order to advance to fourth grade. Therefore, in third grade, the TAKS is administered up to three times to those students who do not earn passing scores. For the purpose of this study, passing at the expected level only on the first administration of the Spanish reading TAKS from the spring of 2010 was used.
Procedures
Data used in this study were collected through the use of a RTI model of service delivery. The school district had institutionalized the collection of universal screening data using R-CBMs three times a year during 2-week windows in the middle of September, January, and May. Data included in this study were collected during the 2009–2010 school year. The procedures used for data collection were consistent with typically used procedures for benchmarking (Shinn & Shinn, 2002). School staff who administered the reading passages were trained to do so at the individual school level by a designated RTI leader. Training was conducted using AIMSweb scoring practice materials and training videos to learn administration in English (Pearson, 2010). No training materials exist in Spanish, so those examiners who were proficient in Spanish were trained in English and then administered and scored the Spanish R-CBM passages. Faculty or staff members who were identified as unable to administer the CBM passages were not involved in the data collection process. District policy for the collection of benchmarking data included a training refresher session prior to each benchmarking period and a full training for all new faculty and staff involved in collecting benchmark data.
Students were administered the same three 1-minute reading passages during the fall, winter, and spring and the passages were scored for the WRC. The median WRC score was recorded for each of the three time points. Discretion was left to the individual school campuses to determine how benchmark data would be collected. Some campuses used each classroom teacher to collect these data whereas others used instructional support staff to administer and score the R-CBM passages. RTI procedures also included the requirement that 20 percent of all benchmark probes were checked for scoring accuracy and for determination of the median score. When errors were identified, all probes from that particular examiner were checked for accuracy.
The reading TAKS in Spanish was administered during April 2010 to third- and fourth-grade students. The TAKS is administered on a single day, with no time limit for completion. Students are permitted to take the TAKS in various settings, including large group classroom settings, small group settings, as well as individually without modification of the administration procedures. TAKS data included in this study were likely collected in all of the settings described above. Data from the first administration of the Spanish-version TAKS and the fall, winter, and spring Spanish R-CBM scores for third- and fourth-grade students were included in this study.
Data Analysis
Before initiating any analysis, data were screened for outliers using a visual screening process and frequency histograms. Cases were eliminated only if there was a data entry error, that is, a score that was out of the range of acceptable values. Correlations were conducted including Spanish R-CBMs across all benchmark time points and the TAKS reading in Spanish. Following the correlation analyses, cut scores for the fall, winter, and spring CBM benchmarks were established using both the 25th percentile as a cut point as well as ROC curves to examine all possible cut points. The 25th percentile cut point was examined because of its frequent use in practice as the cut point above which instructional success is implied and below which performance is considered at risk. For the purpose of this study, the 25th percentiles for Spanish R-CBM performance at third and fourth grade across the district were used as the cut point. The use of ROC curves has been suggested as a more flexible way to determine a cut score that maximizes diagnostic accuracy for various purposes (Hintze & Silberglitt, 2005; Shapiro et al., 2006; Swets et al., 2000). Cut scores for the fall, winter, and spring Spanish R-CBM scores were used in the diagnostic accuracy analysis to examine changes in cut scores and in diagnostic accuracy across the year and with the use of different procedures for selection. The dichotomous criterion measure of interest was passing at the expected level on the reading TAKS in Spanish. When ROC curves were used, cut scores were selected to maximize sensitivity and specificity at .70 or higher, consistent with previous work in this area (e.g., Keller-Margulis, Shapiro, & Hintze, 2008). When acceptable levels of both sensitivity and specificity were not able to be achieved, a cut point that maximized sensitivity at or above .70 was examined.
After establishing cut scores, cross-tabulation analyses were used to determine the number of cases above and below the R-CBM Spanish cut point and who passed and failed the TAKS. Using that cross-tabulation analysis, diagnostic accuracy statistics were calculated. The diagnostic accuracy statistics of interest included sensitivity, the probability that when the condition is present (failing TAKS) it will be identified by the predictor (below CBM cut score), and specificity, the probability that when the condition is absent (success on the TAKS) the test for the condition or the predictor will be negative (above CBM cut score). Also of interest was positive predictive power (PPP), the probability that given a positive test for the condition (below CBM cut score), the condition is present (TAKS failure), and negative predictive power (NPP), the probability that given a negative test for the condition (above CBM cut score), it is indeed absent (TAKS success). Additional statistics of interest when the ROC curves were used included the area under the curve (AUC), an overall measure of accuracy generated through ROC curve analysis as well as the hit rate or overall accuracy of CBM as an indicator of performance on the criterion (Swets et al., 2000).
Results
Data screening resulted in the elimination of one case from the fourth-grade analyses due to an out-of-range value. All other cases were retained for analysis. Data were analyzed separately across grade levels. Descriptive statistics for all variables are included in Table 1. Skewness and kurtosis statistics indicate little deviation from a normal distribution. In addition, the percentage of students who passed the TAKS on the first administration was 86.9% at third grade and 88.9% at fourth grade.
Descriptive Statistics of R-CBM and TAKS Across Grades
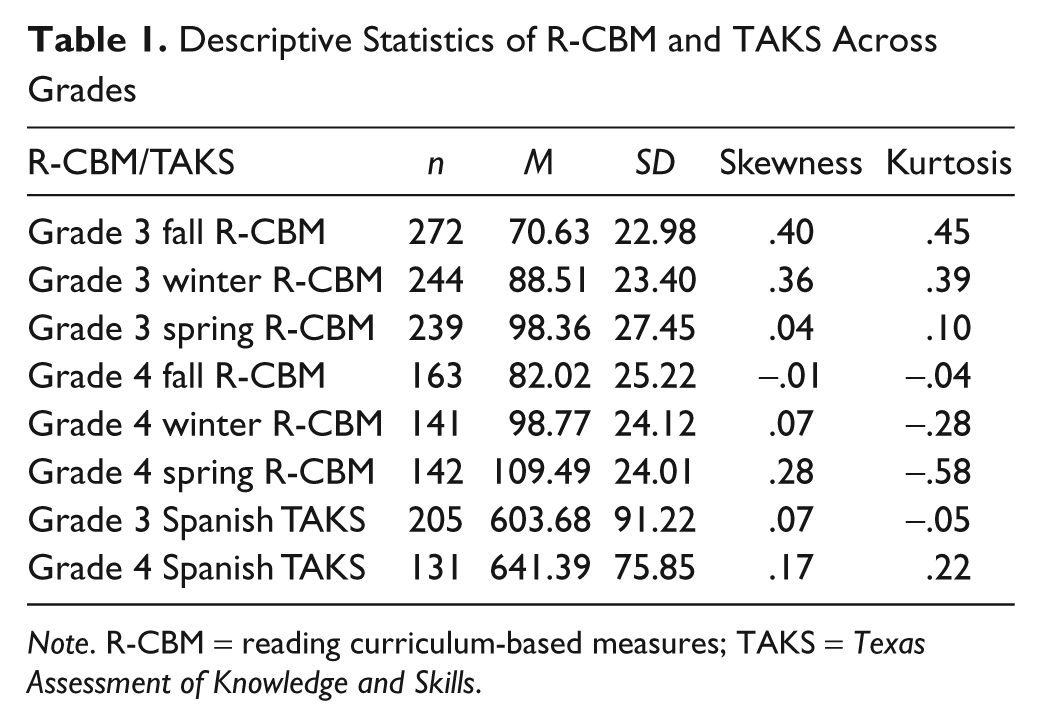
Note. R-CBM = reading curriculum-based measures; TAKS = Texas Assessment of Knowledge and Skills.
Correlation Results
Correlations were calculated using Spanish CBM benchmarks in the fall, winter, and spring and the first spring TAKS administration given in March or April of the school year. The correlation results are depicted in Table 2. The relation between R-CBMs in Spanish and Spanish TAKS reading performance ranged from 0.41 to 0.48 at third grade and from 0.37 to 0.44 at fourth grade.
Correlations of R-CBM Spanish Benchmarks and TAKS Spanish Reading Scaled Scores
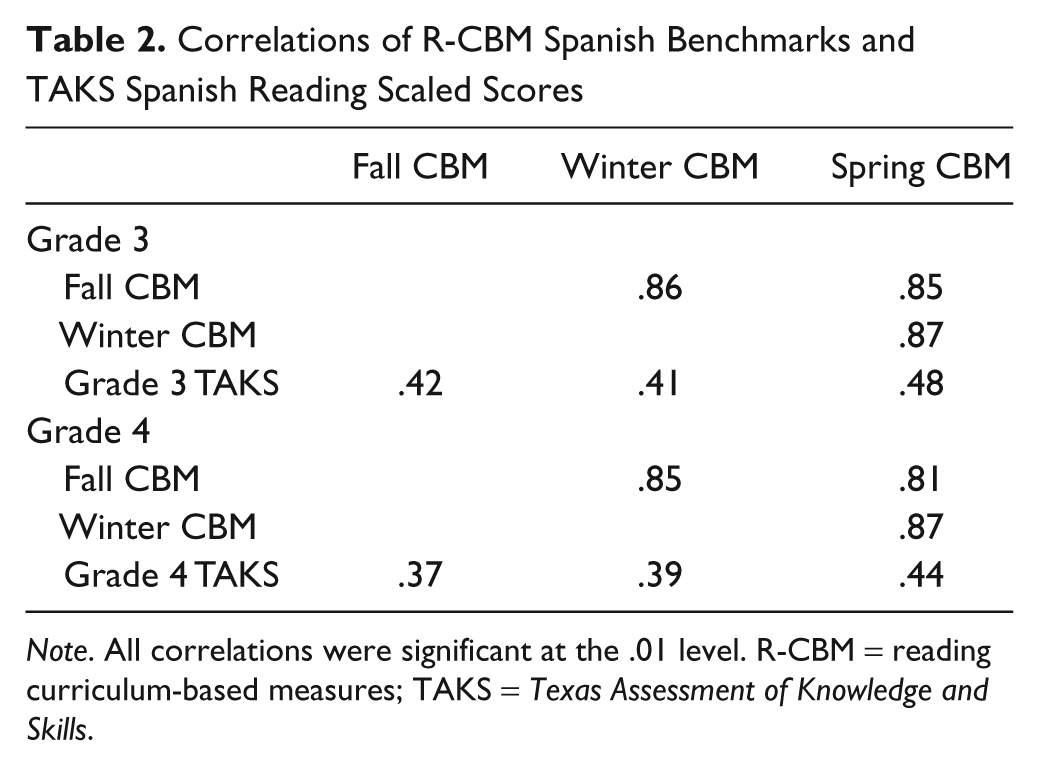
Note. All correlations were significant at the .01 level. R-CBM = reading curriculum-based measures; TAKS = Texas Assessment of Knowledge and Skills.
Diagnostic Accuracy Results
The diagnostic accuracy analyses were conducted in two phases. First, an examination of the diagnostic accuracy of a Spanish R-CBM cut score at the 25th percentile was conducted and the results are summarized in Table 3. The hit rate for Spanish R-CBM was greater than 70% for third and fourth grade. The general patterns for the other diagnostic accuracy measures when the 25th percentile cut point is used included low sensitivity and PPP and at or above adequate levels of specificity and NPP. This pattern persisted across the fall, winter, and spring benchmarks for both third and fourth grades, with the exception of the fall and spring scores at fourth grade. The 25th percentile cut score in the fall of fourth grade resulted in adequate levels of both sensitivity and specificity. In addition, the spring cut score for fourth grade resulted in an adequate level of positive predictive power (.75). The highest hit rate within grades was the spring analysis with the spring of fourth grade exceeding .90.
Diagnostic Accuracy Results for R-CBM in Spanish 25th Percentile Cut Scores
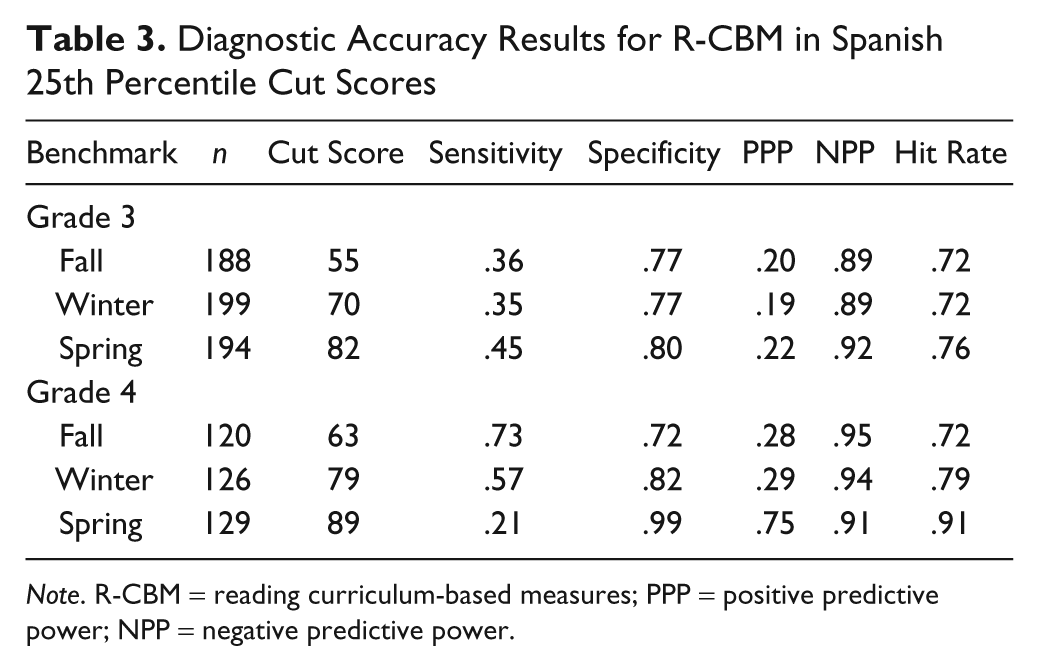
Note. R-CBM = reading curriculum-based measures; PPP = positive predictive power; NPP = negative predictive power.
The use of ROC curves to establish cut scores and conduct diagnostic accuracy analyses resulted in higher cut scores overall (see Table 4). The ROC curves for fall, winter, and spring R-CBM Spanish performance are depicted in Figures 1 and 2. The AUC results were all above .70, which is considered moderate (Streiner & Cairney, 2007), and approached .80 in some instances. The overall accuracy, as measured by the AUC, is visible when the ROC curve graphs across the year are examined. The hit rate ranged from .57 for the spring R-CBM in fourth grade to .78 for both the fall and winter R-CBM scores in fourth grade, with most results in the .60 to .70 range. The use of ROC curves allowed for the selection of cut scores that offered balance between sensitivity and specificity and resulted in all measures of sensitivity exceeding .70. There were several instances where the specificity dropped below .70 when sensitivity was maximized. The NPP of Spanish R-CBM across grades was considerably higher than the PPP. That is, of the students who performed successfully on the Spanish TAKS, a large percentage were identified as such using the Spanish R-CBM as the predictor.
Diagnostic Accuracy Results for ROC Curve Analysis
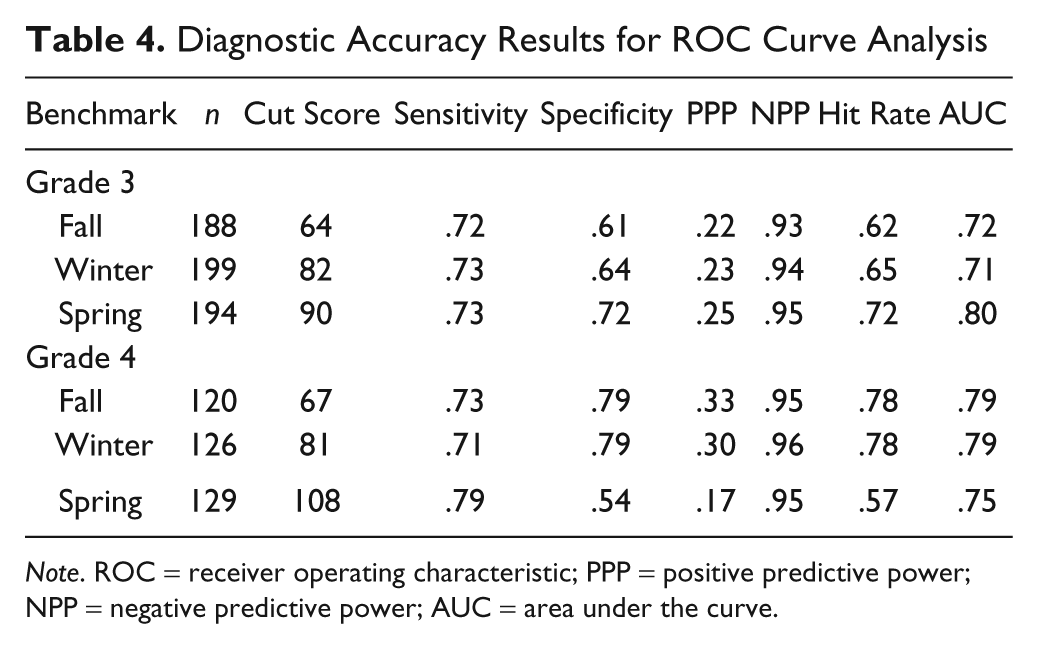
Note. ROC = receiver operating characteristic; PPP = positive predictive power; NPP = negative predictive power; AUC = area under the curve.
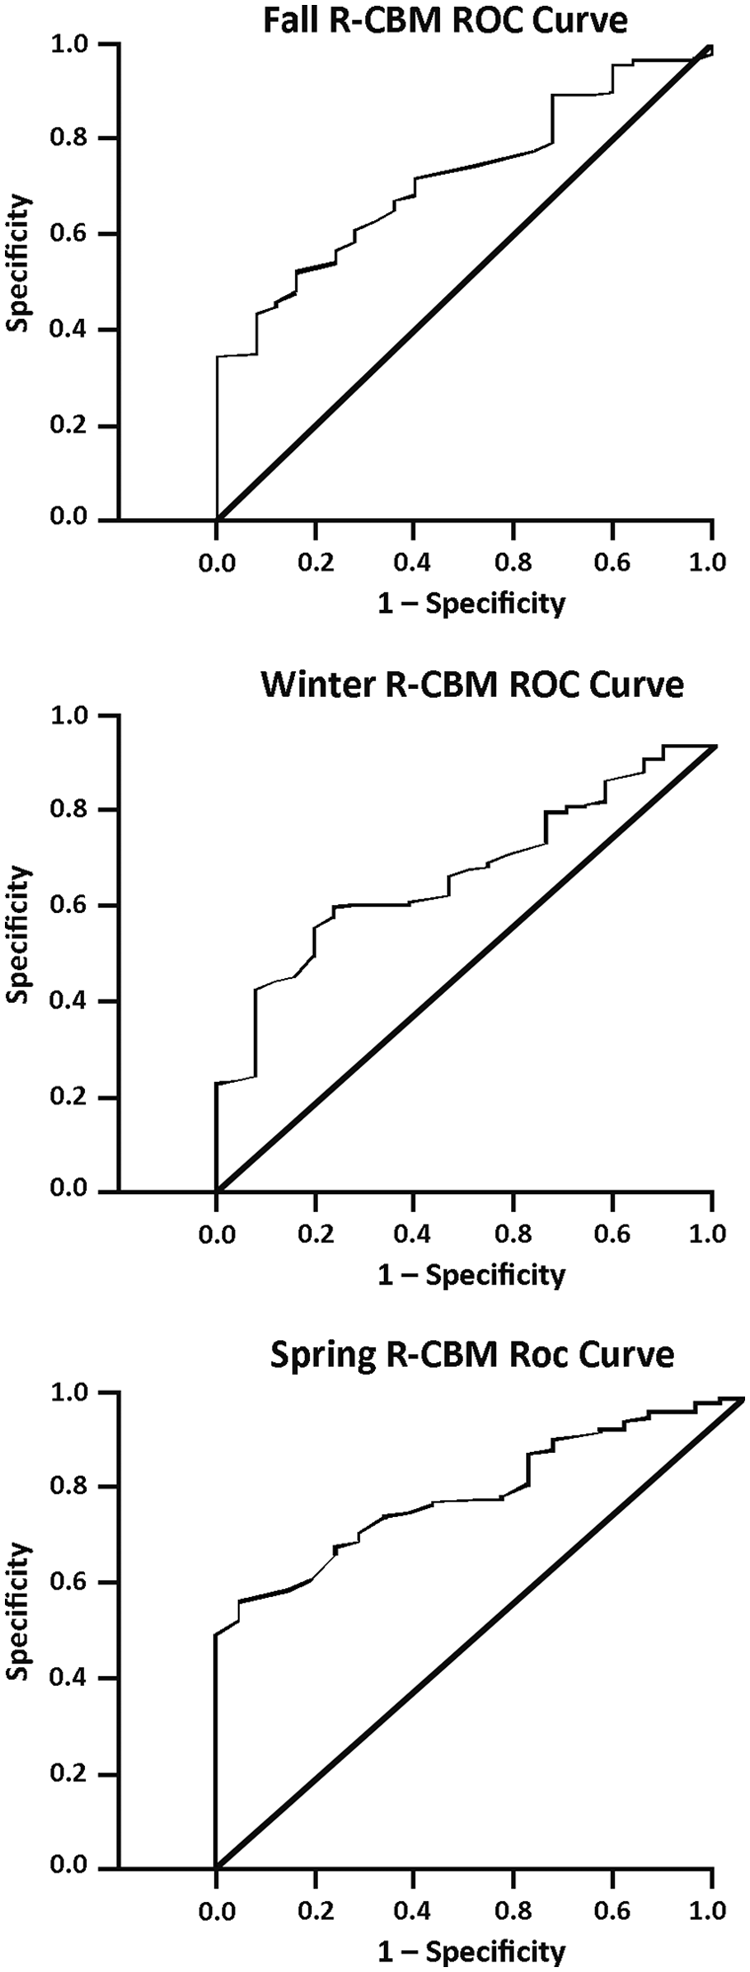
Third-grade fall, winter, and spring Spanish R-CBMs and passing the Spanish TAKS in April.
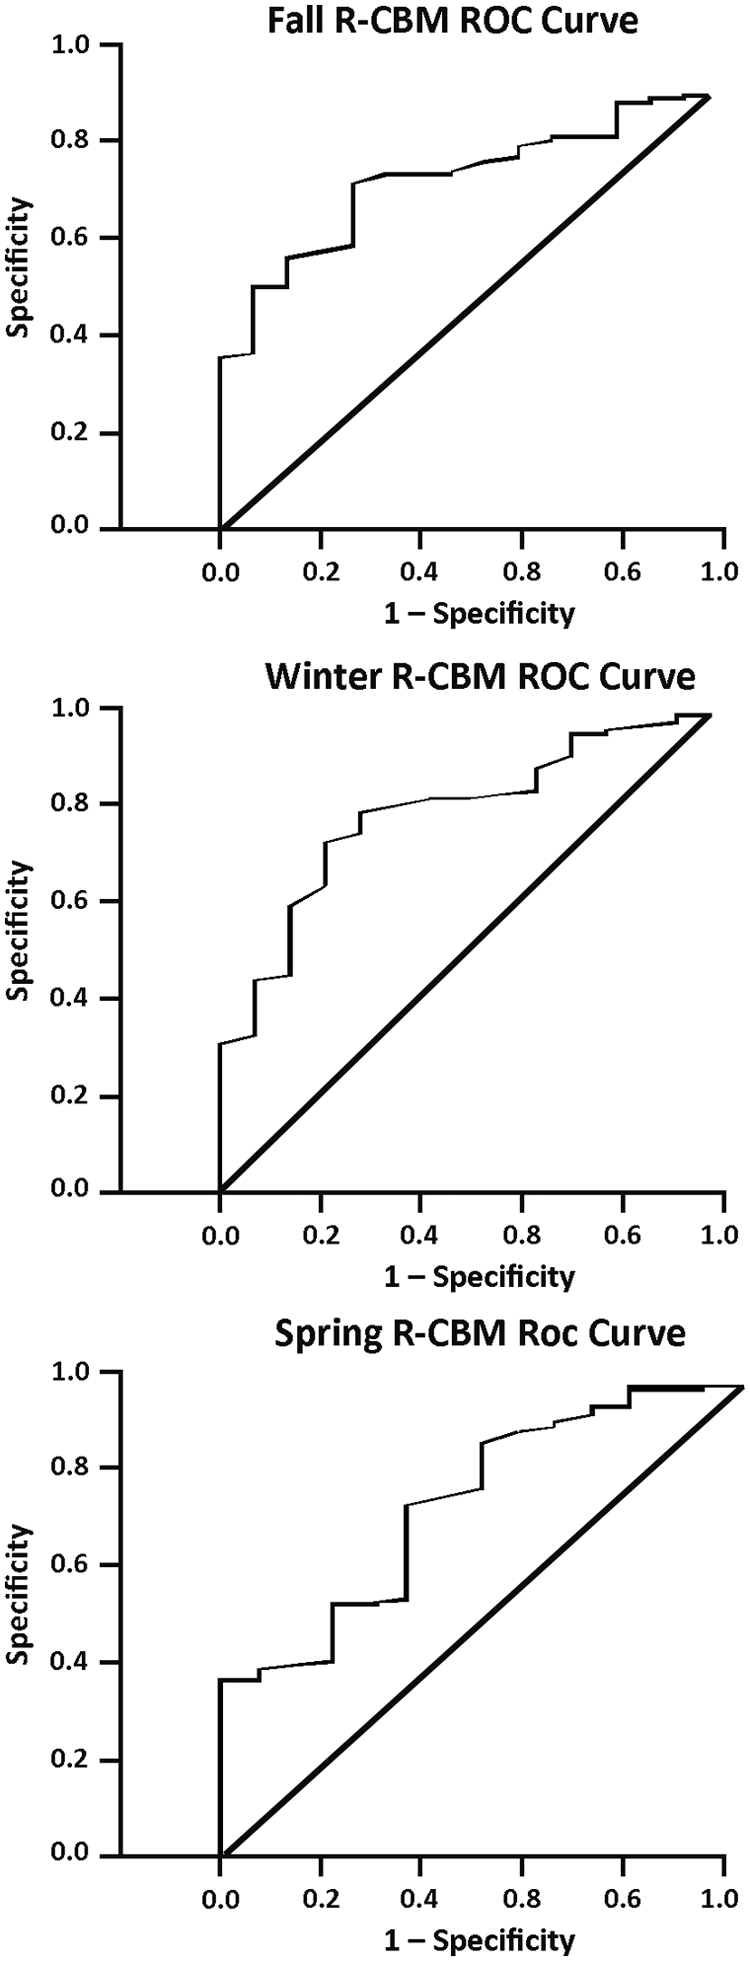
Fourth-grade fall, winter, and spring Spanish R-CBMs and passing the Spanish TAKS in April.
Discussion
Substantial evidence supports the use of R-CBMs in schools, and recent questions have emerged regarding the nature of the relationship between R-CBMs and statewide measures of achievement (e.g., Good et al., 2001; Shapiro et al., 2006). Arguably, the validity of R-CBM as a measure that captures general reading performance in English has been substantiated. From a practical perspective, however, it continues to be important to examine whether this relationship can be maintained across diverse CBMs and across various state tests or other criterion measures of relevance. Specifically, the commercial availability and increased use of Spanish R-CBM necessitates an examination of whether these measures can function with similar technical adequacy to similar measures in English.
The correlation results of the present study extend the validity evidence for CBM by examining the relation between Spanish R-CBM and performance on a statewide measure of reading performance in Spanish, the Spanish reading TAKS. The correlation results for this study were slightly lower than those found in other studies of English R-CBM and high stakes measures. Previous studies have found within-year correlations in the elementary grades to be in the .60 range (Hintze & Silberglitt, 2005; Shapiro et al., 2006). Although no previous studies have been conducted using the Spanish R-CBM passages from the AIMSweb system of probes, previous results in English for students of diverse language backgrounds have indicated lower correlations between R-CBMs and high stakes measures for students who are ELLs than those who are native English speakers (Wiley & Deno, 2005). This decrease appears to be enhanced when examining the Spanish R-CBM and a Spanish criterion measure. Nevertheless, the correlation results provide emerging evidence of the validity of R-CBM measures in Spanish for measuring overall reading ability in Spanish for students who are in classrooms where Spanish is the primary language of instruction.
Increased emphasis on data-based decision-making paradigms in schools necessitates ongoing investigation of the most efficient and accurate measures of student performance that allow for the identification of students who are at risk for failure (Glover & DiPerna, 2007). The results of the diagnostic accuracy analyses found here are similar to previous studies conducted in English where R-CBM is a better indicator of those students who will likely be successful (higher specificity and negative predictive power) on the criterion than those who will fail (Muyskens et al., 2009). In general, R-CBM in Spanish functions with hit rates that would be acceptable in practice at the third- and fourth-grade levels. The hit rates were higher when the 25th percentile was used as the cut score for success on R-CBM in Spanish, but the sensitivity was low. A better balance between sensitivity and specificity was achieved by using cut scores that were established using ROC curves. In addition, the shift in overall accuracy across the three benchmark periods is visible when ROC curves are used. The capacity to model all possible cut scores at each time point in order to select the score that offers the best accuracy for the desired purpose is a clear benefit of using approaches like ROC curves. Methods like ROC curves are not always used in school-based practice, where cut score procedures are often driven by the resources available for intervention provision. If a balance between sensitivity and specificity is desired, however, and if cut scores for different purposes are to be established, a more sophisticated approach like the use of ROC curves is essential.
The correlation and diagnostic accuracy results across third and fourth grade provide emerging evidence of the utility of R-CBM in Spanish for screening and identification of which students will be successful versus unsuccessful on the statewide achievement measure in Spanish. The overall accuracy of classification in the diagnostic accuracy results was greater than 70% and consistent with previous studies of the diagnostic accuracy of R-CBM (Muyskens et al., 2009; Stage & Jacobsen, 2001). Recent work regarding the process of universal screening to identify students likely to fail criterion measures or who are in need of academic intervention has suggested that caution is warranted when interpreting diagnostic accuracy analyses. The research regarding CBMs, particularly R-CBM, yields moderate diagnostic accuracy results with false positives and false negatives often present (Jenkins et al., 2007). Diagnostic accuracy results are inherently affected by characteristics of the population in which they are conducted (VanDerHeyden, 2011). The base rate in the population as well as the nature of the criterion being used as the outcome measure limit the generalizability of diagnostic accuracy studies. In the present study, the passing rate for students on the first administration of the TAKS exceeded 86%. It cannot be expected that these results will generalize to other populations where a different Spanish criterion measure is used and the base rate for success differs. In addition, some suggest that successful screening measures should reach diagnostic accuracy in the .90 range (Jenkins et al., 2007; Johnson, Jenkins, Petscher, & Catts, 2009). Screening measures that are so robust that they reach sensitivity of .90 would result in accurate and efficient screening. Work must continue to improve the technical utility of R-CBMs in Spanish as assessment tools for screening that offer increased accuracy for identifying students at risk for failure on a criterion measure who therefore require intervention. Additional investigation into the many factors that may affect the diagnostic accuracy of these tools when used in practice is warranted. This may include an examination of the diagnostic value of using multiple measures to more accurately identify those students with skills requiring intervention (Johnson, Jenkins, & Petscher, 2010) as well as the use of progress monitoring approaches to increase the accuracy of identification for those students (Compton, Fuchs, Fuchs, & Bryant, 2006).
Implications for Practice
The findings of the present study serve as the first evidence of the validity for R-CBMs in Spanish for capturing overall reading performance and skills on statewide assessments. Although the correlation results were slightly lower than those found in some other states, this study presents emerging evidence to support the use of R-CBMs in Spanish as a tool to measure reading skills of Spanish-speaking ELLs. It is critical that students who receive instruction in bilingual classrooms in Spanish should be screened with measures that match the language of instruction and the language of assessment (Esparza Brown & Sanford, 2011). The work presented here suggests that R-CBMs in Spanish may be used for that purpose.
There are also practical implications for the findings that R-CBMs in Spanish have similar diagnostic accuracy for statewide test performance to that found with R-CBMs in English. Primarily, R-CBMs in Spanish can be used as a screening tool to identify students that may require additional instructional intervention in order to be successful on high stakes, statewide achievement tests. The patterns of performance across grades evident in this study reflected the utility of R-CBMs in Spanish for monitoring reading growth in Spanish.
Finally, the use of ROC curve analyses appears to offer benefit over the 25th percentile cut score in this study. The use of ROC curves allowed for better detection of the students that will likely fail the criterion measure, which is the ultimate purpose of universal screening procedures. It is far more beneficial to have improved detection of students who will fail while potentially identifying students who will later be successful (false positives) than to risk not detecting students who require additional instruction in order to be successful. Although the use of a cut point that is more universal across grades, like the 25th percentile, does not require more advanced statistical procedures, the consequences are poor diagnostic accuracy and a consequential lack of practical utility. The approach to cut score establishment must be driven by the resources of the school to provide intervention to students. The fewer resources that the school has to provide intervention, the fewer students that can be identified and the lower the cut score. ROC curves allow for the selection of cut scores that are adequate and practical. The results described here indicate the effectiveness of setting cut scores to identify those students at risk academically, and providing intervention to increase the likelihood of success on the statewide achievement measure.
Limitations
There are several limitations to the present study. First, these data represent one group of students from one district, making the extent to which these results can be generalized to others limited. There are also instructional factors that may have affected the conclusions in the present study. The results presented here reflect the nature of bilingual instruction in this particular district. In the district from which these data were obtained, students receive instruction primarily in Spanish in the early elementary grades, and the percentage of English instruction that students receive gradually increases over time until students exit from bilingual instruction in fifth grade. Therefore, students in third grade receive a higher percentage of instruction in Spanish than students in fourth grade. However, although these are the guidelines for how teachers are to proceed with the ratio of English to Spanish instruction, the actual delivery of instruction may deviate from recommendations. In addition, although all students in the present study were receiving instruction in bilingual classrooms, results of individual language proficiency testing for participants in this study were not available.
The diagnostic accuracy analyses were likely affected by the base rate of student success on the criterion and may reflect the impact of the RTI model of service delivery implemented in this district. Those students who scored below the 25th percentile at benchmark assessments were routinely routed to intervention in order to improve academic performance. RTI models are designed to capture those students and provide intervention such that they do not fail the criterion. It is possible that those students identified as below the cut score were provided with sufficient intervention in order to result in successful performance on the criterion. This would not affect the spring results but might have implications for interpretation of the fall and winter Spanish R-CBM analyses. At this time, it is difficult to determine whether this outcome indicates that the R-CBM in Spanish does not have the same technical adequacy as R-CBMs in English. The outcome may instead be a reflection of the instructional environment from which these data were obtained.
Future Directions
Future studies should examine the technical adequacy of the R-CBM passages in Spanish and the degree to which performance on these passages is related to other, well-established standardized achievement measures in Spanish as well as the degree to which that relationship is sustained beyond one academic year. Aside from the present study, validity and reliability data regarding R-CBM passages in Spanish are lacking. The use of R-CBMs in Spanish for progress monitoring response to instruction on a more frequent schedule (i.e., weekly or monthly) should also be investigated for students who receive instruction primarily in Spanish. This would allow for a close examination of the typical patterns of growth across the year using these measures.
The use of multiple CBMs in screening for Spanish-speaking ELLs should be examined. First, the utility of a CBM that more directly assesses reading comprehension in Spanish should be explored through future work. There may be benefit to using a measure that requires students to read a passage and respond to both literal and inferential comprehension questions to assess the comprehension skills of students receiving bilingual instruction. It would be helpful to determine whether Spanish reading comprehension offers additional information and diagnostic utility above and beyond R-CBMs in Spanish or whether the two measures can be used together to improve the identification of Spanish-speaking ELLs who are at risk for poor academic performance. Multiple measures that include assessment in both English and Spanish should also be considered. Using measures for universal screening across both Spanish and English may increase the diagnostic accuracy for performance on statewide achievement tests without requiring sophisticated statistical procedures. Additional work should also focus on ways to establish adequate cut scores on screening measures that can provide schools with direction regarding decision-making procedures at the various tiers of the RTI process. Addressing these issues would not only improve screening procedures for Spanish-speaking ELLs but might also benefit the screening of English-speaking students as well. Additional work regarding the use of R-CBMs in Spanish is critical for the improved screening and progress monitoring of students who are ELLs receiving instruction and requiring assessment in Spanish.
Footnotes
Declaration of Conflicting Interests
The authors declared no potential conflicts of interest with respect to the research, authorship, and/or publication of this article.
Funding
The authors received no financial support for the research, authorship, and/or publication of this article.