






Abstract
The relation between fidelity of implementation and student outcomes in a computer-based middle school mathematics curriculum was measured empirically. Participants included 485 students and 23 teachers from 11 public middle schools across seven states. Implementation fidelity was defined using two constructs: fidelity to structure and fidelity to process. Because of the nested nature of the data, we used a two-level hierarchical linear model for analysis. Four variables, all categorized as fidelity to structure variables, proved significant—total time in intervention (p <.001), concentration of time in intervention (p = .03), direct observation of intervention fidelity (p = .04), and pretest score (p <.001). Fidelity to process was found to be nonsignificant. The importance of measuring the relation between implementation fidelity and student outcomes is discussed as well as implications for researchers and teachers.
Keywords
In the field of education, intervention studies explore the efficacy and effectiveness of instructional practices and by doing so, further our knowledge of what works. These studies and their results are fundamental to advancing best practices for teaching students. And although educational researchers strive to design conceptually and methodologically sound studies that meet the principles put forth by the field (American Educational Research Association, American Psychological Association, & National Council on Measurement in Education [AERA, APA, & NCME], 1999; Shadish, Cook, & Campbell, 2002), it is the rare study that examines the effect of actual principles on outcomes achieved. Researchers strive to meet standards for internal and external validity without questioning the influence of different standards within the context of unique studies with diverse populations. Fidelity of implementation, one measure of internal validity, is a “multilevel, multivariate phenomenon affected by personal, programmatic, and contextual factors” (Zvoch, 2009, p. 46). Understanding the contribution of implementation fidelity to research outcomes increases our confidence in the validity of reported findings. In this article, therefore, we use data from a larger study of the effects of a middle school computer-based mathematics intervention to analyze the relation among multiple measures of implementation fidelity and student outcomes.
Defining Fidelity
In the field of education, one broadly accepted definition of implementation fidelity does not exist, and often distinctions are made when defining fidelity within efficacy or effectiveness studies (O’Donnell, 2008). However, dozens of fidelity indices have been proposed and investigated in the fields of public and mental health. Professionals in these fields often operationalize the construct of implementation fidelity into two components: (a) fidelity to structure and (b) fidelity to process (Mowbray, Holter, Teague, & Bybee, 2003). Fidelity to structure includes observable behaviors and extant data such as frequency and intensity of contacts and evidence of procedural guidelines. In the field of education, one definition that characterizes fidelity to structure is “the extent to which the treatment conditions, as implemented, conform to the researcher’s specifications for the treatment” (Gall, Gall, & Borg, 2007, p. 395). Fidelity to process includes more subjective measures, such as emotional climate and quality of professional interactions (Mowbray et al., 2003). Both of these constructs are necessary when measuring implementation fidelity and tend to complement one another (Mowbray et al., 2003).
Fidelity Research in Education
Mislevy (2007) states, “validity emerges from design activities” (p. 467). The stronger the research design the more valid our interpretation of results. Christ (2007) defines threats to internal validity as “those factors that have the potential to provide alternate explanations for the observed effects,” citing the seminal work by Campbell and Stanley (1963). Weak implementation fidelity is one of these factors; thus, measuring fidelity is one way to increase the internal validity of a research study (Hohmann & Shear, 2002; O’Donnell, 2008).
Although it is important to maximize and measure implementation fidelity, it is rarely accomplished in the field of education (Gall et al., 2007; O’Donnell, 2008). Well-established educational researchers acknowledge the challenge of creating and implementing sound research studies within school settings (Gersten et al., 2005; Hulleman & Cordray, 2009). In fact, “within a study, the intended intervention may only marginally resemble what is actually implemented” (Gersten, Baker, & Lloyd, 2000, p. 4). A balancing act is required when attempting to implement a rigorous research design within the realities posed by our school systems. Well-planned research methods can easily become distorted when moved into the reality of classroom implementation. In light of the challenges faced by educational researchers, and in particular those researchers conducting efficacy studies in classroom environments, the importance of documenting implementation fidelity cannot be underestimated. O’Donnell (2008) states the importance of measuring fidelity of implementation and studying its relation to outcomes achieved; nevertheless, her review found a paucity of studies in education that measured fidelity as related to educational outcomes. Others in the field of education have reported a similar dearth of research (National Research Council of the National Academies, 2004). Some studies measuring the relation between fidelity and achievement outcomes, however, have been conducted in the field of education. And in a review of this research, O’Donnell reports that increased fidelity of implementation led to statistically significantly higher outcomes.
Researchers have consistently found that students whose teachers implement curriculum with high fidelity made greater gains than their peers in low-fidelity classrooms (Noell, Gresham, & Gansle, 2002; Songer & Gotwals; 2005; Ysseldyke & Bolt, 2007; Ysseldyke et al., 2003). Specifically, in the Songer and Gotwals (2005) study, students of teachers who had high fidelity of implementation of a science curriculum not only learned the basic scientific principles being taught but also learned “how to reason with these concepts in complex scientific situations” (p. 18). Similarly, in Ysseldyke et al. (2003), math students in classes of high-implementers gained an average of 18 percentile points more than students in the control group.
Important, however, is the fact that much of the research surrounding implementation fidelity in educational settings has involved teacher-led instruction. And although a computer-based intervention may require similar behaviors on the part of teachers and students, it also requires unique behaviors (Mills & Ragan, 2000). Different teachers’ use of the same educational technologies will likely vary (Baker, 2001), and “conditions for successful implementation depend partly on the beliefs, motivations, and practices of teachers” (Weston, 2004, p. 57). In developing a model to measure implementation fidelity of an integrated learning system (ILS) (i.e., computer-based instructional program), Mills and Ragan (2000) empirically validated five critical constructs representing 15 separate behaviors: “(a) integrating computer instruction with classroom instruction, (b) facilitating ILS instruction while students are using the ILS in the classroom or lab, (c) using reinforcement and motivational strategies to sustain learner interest in ILS instruction, (d) participating in training in the use of ILS technology, and (e) receiving ongoing instruction and technical support in ILS use” (p. 37). In light of these five components identified and empirically validated by Mills and Ragan it would be incorrect to assume that computer-based instruction can be viewed as a stand-alone intervention with little relation to the behaviors of the teacher. Thus, in the same way that it is important to quantify the effect of fidelity of implementation on student outcomes during teacher-led instruction, so it is important to study this relation within a computer-based intervention.
Fidelity Constructs in the Context of This Study
As introduced above, fidelity of implementation can be categorized into two broad constructs: fidelity to structure and fidelity to process. In this study, we categorize the following variables as fidelity to structure: (a) total time in intervention, (b) concentration of time in the intervention, and (c) teacher adherence to and student engagement with the program (as measured through direct observations). We operationalize fidelity to process through use of a rating scale combining indicators such as teacher communication, classroom management, and problem-solving skills—behaviors that Mowbray et al. (2003) identified as process variables and Mills and Ragan (2000) validated as essential in delivery of computer-based instruction. Thus, we ended up with four fidelity variables categorized under the two constructs of structure and process.
Total Time in Intervention
The length of time students are engaged in an intervention is an important measure of fidelity to structure (Gall et al., 1996). A weak experimental treatment is one that does not allow enough time for a change to occur (Gall et al., 1996). General consensus exists regarding how much time is enough time for change to occur. In his article on evidence-based research in education, Slavin (2008) shares that the Best Evidence Encyclopedia uses a 12-week expectation. Gersten and Edyburn (2007) suggest that an intervention should be implemented for no less than one quarter of the school year, or 9 weeks. They report that ideally the length should be much longer—for example, interventions that last a full semester or an entire school year. Similarly, Cavanaugh, Kim, Wanzek, and Vaughn (2004) reported moderate to high effect sizes for studies of reading interventions employed for a duration of 8 to 10 weeks.
Terms such as duration and dosage are also used to describe the length of an intervention. Dosage is defined as duration × sessions per week × length of session (Rohrbeck, Ginsburg-Block, Fantuzzo, & Miller, 2003) but still represents total time. Researchers tend to investigate frequency, intensity, and/or duration (how often, how much time per day, and how long) as separate variables. For example, in their review of Kindergarten reading intervention studies, Cavanaugh et al. (2004) found that the more often an intervention was employed every week (frequency) the more likely the intervention was effective; time spent per day on effective interventions ranged between 15 and 30 minutes; and those interventions with the greatest effect sizes were used over 8 to 10 weeks.
Concentration of Time in Intervention
We chose to measure concentration of time in this study because of our observations that some school sites implemented the intervention for 10 to 15 minutes per day over a course of many weeks as opposed to other sites that implemented the intervention for 30 to 45 minutes every day for a fewer number of weeks. We were concerned that measuring only total time would fail to capture the more nuanced indicator of concentration of time. Rohrbeck et al. (2003) echoed our concern, “It is conceivable that an examination of the number of weeks may pit intensive, tightly controlled short-term interventions against less intensive long-term interventions” (p. 251).
Meta-analyses in the field of educational interventions support this more nuanced investigation of fidelity as they have reported conflicting findings on the effect of duration alone, with some syntheses finding an association between duration and intervention effect (Cavanaugh et al., 2004; Cohen, Kulik, & Kulik, 1982) and other studies reporting no effect for duration (Cook, Scruggs, Mastropieri, & Casto, 1985; Elbaum & Vaughn, 2001; Rohrbeck et al., 2003).
Direct Observations of Implementation Fidelity
Direct observations allow researchers to investigate the level of adherence teachers and students demonstrate to the program. Adherence is generally measured through checklists (Power, Blom-Hoffman, Clarke, Riley-Tillman, & Kelleher, 2005) and often requires direct observations of program implementation. An important first step is to operationally define components of an intervention (Gresham, MacMillan, Beebe-Frankenberger, & Bocian, 2000; O’Donnell, 2008). An operational definition of critical components in the intervention will reduce inferences and thus increase the reliability of direct observation data (Gresham et al., 2000). Once each component is operationally defined, a checklist is developed and then completed through direct observations of each component. A final step is to calculate a total score for implementation fidelity. One score method is to calculate a percentage integrity score by adding the number of components implemented correctly and dividing by total number of components (Gresham, 1989).
Fidelity to Process
Providers of teacher-led interventions (e.g., teachers; social workers; behavioral consultants) have been found to implement interventions differently both within and across sites (Songer & Gotwals, 2005; Zvoch, 2009), as have providers of computer-based interventions (Becker, 1994; Maddux, Johnson, & Harlow, 1993). Differences in how providers implement interventions can be partially attributed to fidelity to process indicators. Traditional indicators of fidelity to process include teacher motivation, preparation and experience (Zvoch, 2009), as well as time and classroom management (Melde, Esbensen, & Tusinski, 2006), all of which may contribute to differences in implementation. In a computer-based environment process variables include integration, facilitation, and management of computer-based instruction within computer lab environments as well as engaging in necessary training and ongoing troubleshooting (Mills & Ragan, 2000). Measuring these types of indicators often requires the use of indirect measures that can be used to supplement data derived from direct observations (Gresham, Gansle, & Noell, 1993; Mowbray et al., 2003), as direct observations such as fidelity checklists do not always capture the more subtle indicators of implementation fidelity (Gersten et al., 2000). Or as Mowbray et al. (2003) notes, “A focus on structural criteria may produce high reliability and validity at the cost of overly simplistic conceptions of program operations, while omitting key ingredients which are complex, reflecting values and principles, and which are, perhaps, more important” (p. 333). Important to note, however, is the subjectivity associated with indirect measures of implementation fidelity; a review of the literature reported low correlations between direct and indirect assessments of fidelity (Gresham et al., 2000).
Relying on the previous research and recommendations of professionals in the field, we hypothesize that the following implementation variables—total time in intervention, concentration of time in intervention, direct observations of teacher adherence to and student engagement with the program, and fidelity to process (as measured through an indirect rating scale)—contribute significantly to student outcomes. As a follow-up to an earlier intervention study (Crawford, 2008), we now turn our attention to the relation between fidelity of implementation of a computer-based intervention and student outcomes in math.
Method
Research Question and Design
Our analysis was guided by one primary research question: Is there a significant relation between indicators of implementation fidelity of a computer-based intervention and students’ math performance? To answer this question, we used a two-level hierarchical linear model (HLM) to examine the relation between the four fidelity variables and students’ math performance. The sample for this study included the treatment group from a larger randomized control study (conducted by the lead author, acting as an independent evaluator), of an intervention called HELP Math© (n.d.).
Intervention
HELP Math is a web-based supplemental math curriculum designed for English language learners (ELLs) in Grades 6 through 8 although it has also been found to be effective with students who are fluent English speakers (Digital Directions International, n.d.). It uses sheltered instruction to deliver math lessons with interactive language support: Students can hear, see, and manipulate math content. At the time of the study, HELP Math consisted of 44 lessons embedded within four modules (Numbers Make Sense, Geometry, Algebra, and Data Analysis), aligned with grade-level standards including those of the National Council of Teachers of Mathematics. HELP Math emphasizes the language of mathematics, conceptual understanding and problem solving—skills that all students need to succeed in mathematics.
Participants
In this study, we included only those students who participated in the treatment group: seventh- and eighth-grade students in 11 public middle schools in seven states. A total of 654 seventh- and eighth-grade students in the treatment group took the pretest in fall 2007, and 485 students took the posttest in spring 2008. Attrition factors included the following: students who withdrew from school, transferred to other classes within the school, were absent during testing, were not given a posttest because of teacher oversight, or did not label the posttest accurately. Our final analysis included the 485 participants who completed both the pre- and posttests. Of these participants, 374 (77%) were in seventh grade and 111 (23%) were in eighth grade; 249 (51%) were male and 236 (49%) were female. In addition, 337 (69%) of the students were ELLs, with Spanish speakers comprising 96% of that population. Although 31% of the participants were not designated as ELLs, the program has been shown to improve the math performance of middle school students at varying levels of English fluency (Crawford, 2008). Students receiving special education services comprised 10% of the sample.
Twenty-three teachers participated, 10 males and 13 females. Their experience ranged from less than 1 year to 20 years (M = 7.3, SD = 6.4). Teachers had been at their schools an average of 3.0 years (SD = 2.6). Twelve of the teachers majored in education (K-6; secondary; and/or bilingual) and the remaining teachers majored in a subject area such as math (n = 4) or one of six other fields (n = 7). Twenty of the 23 teachers held state teaching licenses appropriate for their subject area (e.g., a K-8 license or a mathematics license).
Procedures
Training
Before beginning the study, all 23 teachers attended a half-day training on use of HELP Math and a half-day professional development on how to use sheltered instruction while teaching mathematics. Study participants were given a login and password for the HELP Math program. When classes and teachers were ready to begin implementation, students took the pretest. Following pretests, teachers introduced the intervention and guided student activities; the expectation was that teachers facilitated the computer-based instruction. Researchers conducted direct observations of the level of teacher adherence to and students’ engagement with the program and helped troubleshoot any problems through emails, in person, and on the phone. At the conclusion of the study, teachers administered the posttest.
Implementation schedule
Schools and teachers agreed to implement the program for 25 hours per student. Exact implementation schedules depended on each school’s access to laptop computers or computer labs and teacher schedules. Most schools scheduled the intervention two to four times a week for 30 to 45 minutes per session. Scheduling of the intervention versus actual implementation of the intervention varied by classrooms and some teachers did not fully enact their schedules. We were able to collect data on actual implementation time because the HELP Math program is designed to keep track of each student’s time spent working within a particular lesson. From the total 485 participants, 138 students (28%) actually logged 25 hours or more at completion of the study. On average, students spent 20 hours on the program (SD = 8) across an average of 20 weeks. Dividing the average number of hours by the average number of weeks results in two 30-minute sessions per week on average, with some schools logging less time and other schools logging considerably more time per week. It is this variable of time that is explored further in our analyses as we observed large differences in implementation time across sites. Moreover, little research has been conducted related to the amount of time necessary to affect student achievement on this intervention or computer-based programs in general.
Data
Independent variables
Our first independent variable, total time in intervention, represents the number of minutes each student spent on the intervention. The program tallied the time students spent on each lesson and module. The second independent variable, concentration of time in intervention, aimed to capture the use of the intervention with consistency. We defined concentration of time in intervention as the ratio of minutes each student used the intervention over time (measured in days) elapsed from pretest to posttest.
The third variable, teacher adherence to and students’ engagement with the program as measured through direct observations, resulted in a total score. Direct observation items and mean scores on these items across all teachers can be found in Table 1. Each teacher was observed twice using this measure. Items were operationally defined under four major constructs. The first construct in the direct observation, adherence to the program by the teacher, included five “logistical” behaviors (Items 1–5). The second construct was defined as “instructional quality” and was measured through Items 6–8. “Student engagement,” the third construct, was measured through five items (9, 11, 14, 15, 20). The fourth construct was defined as “facility of use” (Items 10, 12, 13, 16, 17, 18, 19). Items 1 through 8 represented direct teacher behaviors and Items 9 through 20 measured student behaviors as influenced by teacher behaviors. Ideally, we would have analyzed data from this observation instrument through a factor analysis to determine the validity of our four constructs developed a priori, but because of the truncated scale (0–2) used in the measure we did not have enough variance across data to conduct a meaningful factor analysis. Instead, we relied on the combined scores across the four constructs averaged over total number of observations to draw conclusions about teachers’ adherence to and students’ engagement with the program. We had used this measure in prior years and had made revisions to some of the items to better capture teacher and student interactions with the program.
Direct Observation of Fidelity Items and Mean Scores
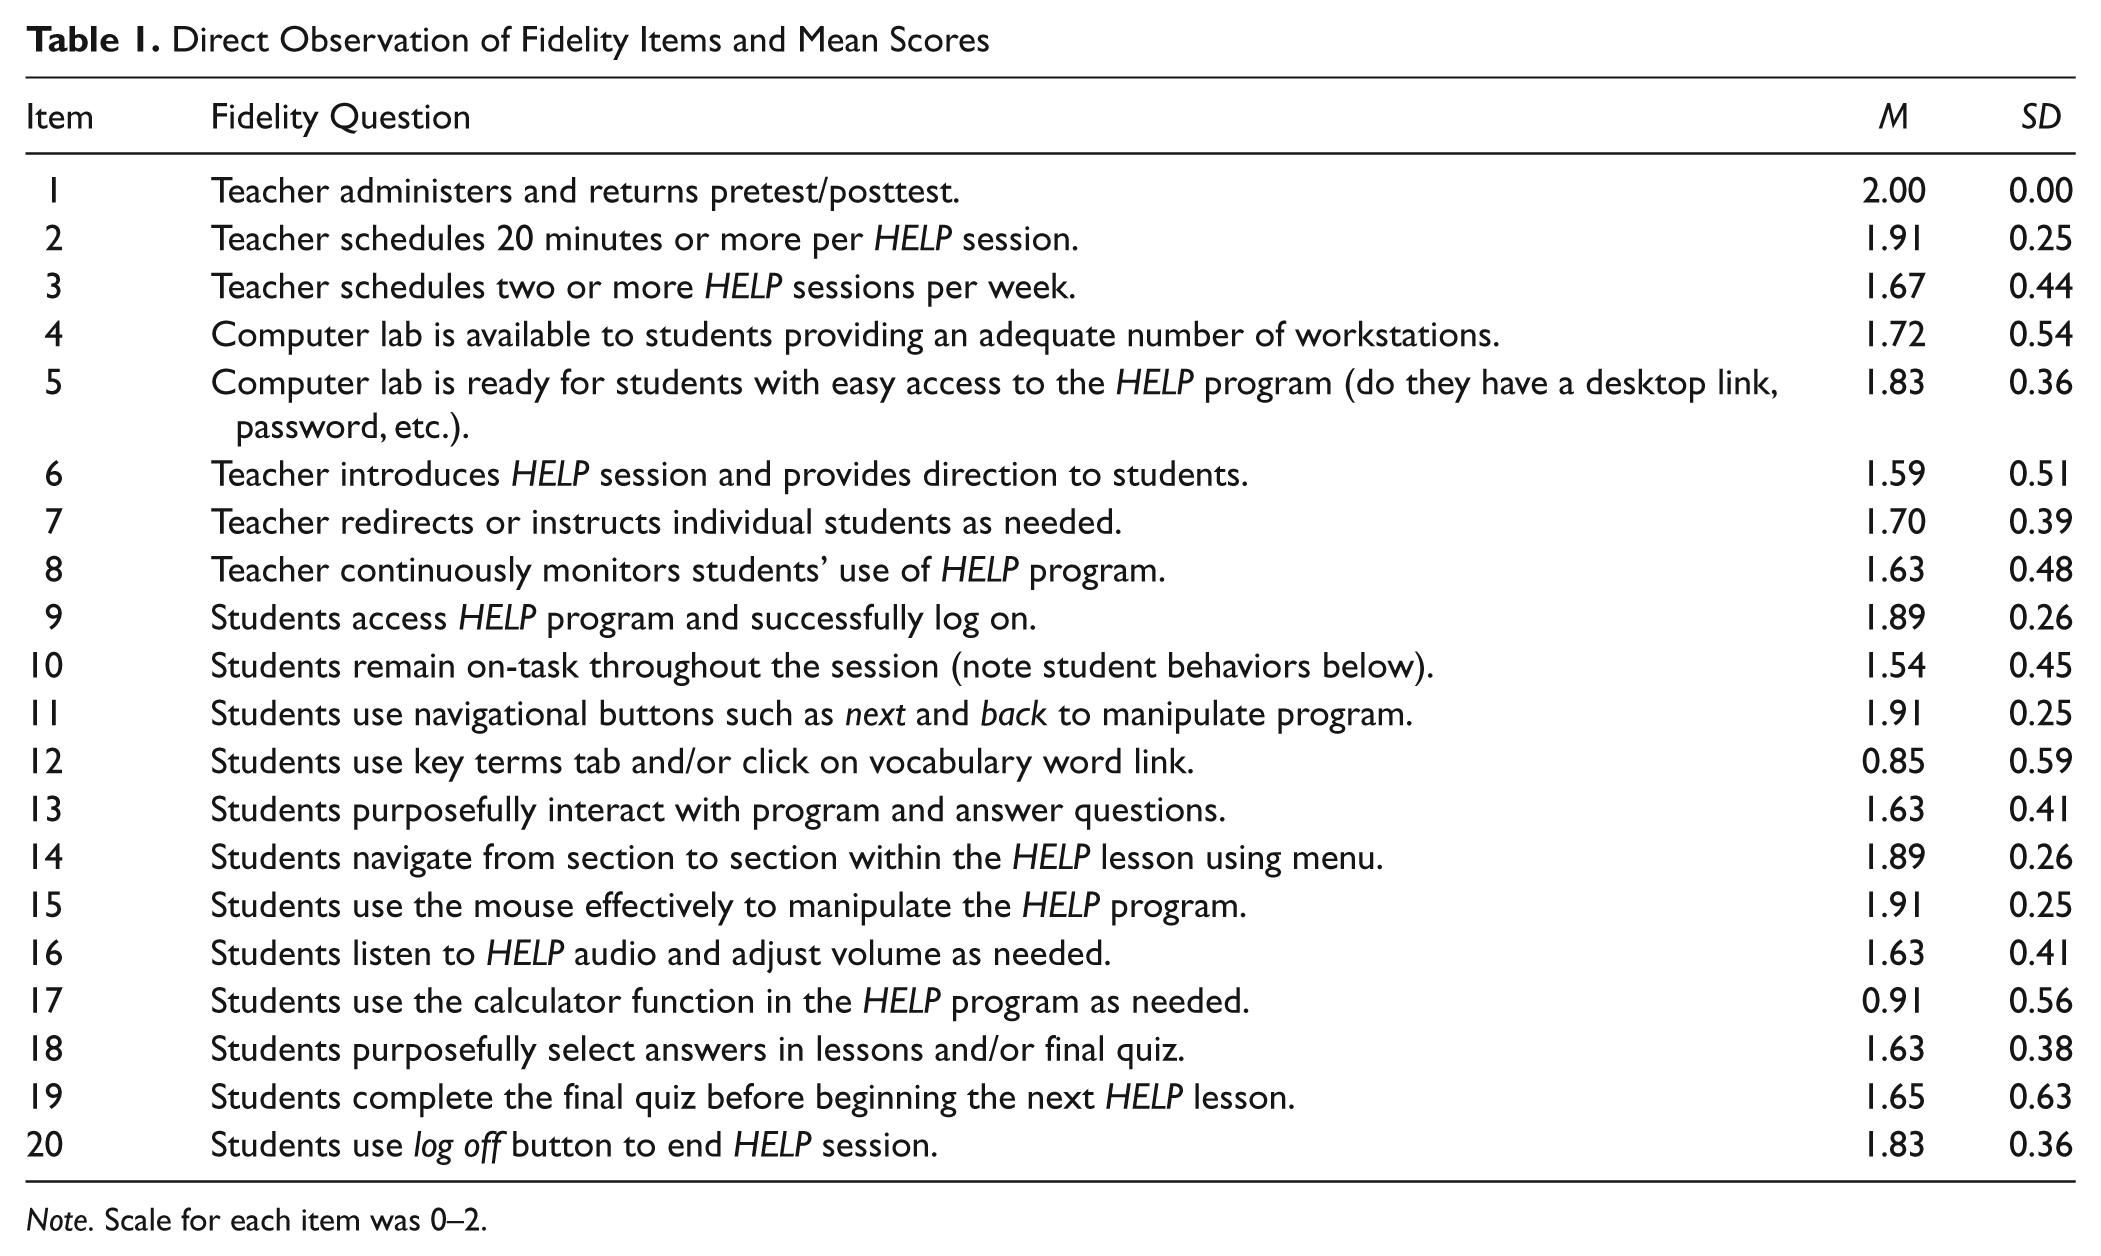
Note. Scale for each item was 0–2.
The fourth variable, fidelity to process, was operationalized through use of a rating scale designed by the researchers. Data from a minimum of three formal and informal observations were used to rate teachers; data also were drawn from implementation checklists, field notes, and teacher interviews. Data from these measures allowed researchers to look deeper into quality or process variables related to implementation. Relying on previous research about process variables important to teacher-led instruction (Zvoch, 2009) as well as research on those implementation variables essential for computer-based instruction (Mills & Ragan, 2000), we considered seven teacher factors in rating fidelity of process that were not captured in our direct observations of fidelity to structure. Following each of these seven variables is an operational definition: (a) student attrition attributed to teacher behaviors (e.g., teachers neglected to give the posttest and therefore student data was not usable for this analyses, students did not log on using the correct password, posttests labeled incorrectly), (b) scheduling of intervention (e.g., amount of time appropriated per week, realistic scheduling within the context of computer availability, teacher compliance with schedule), (c) decision making (placing students in appropriate level of curriculum, integration of computer-based lessons with content of classroom instruction, using computer-generated reports for instructional decision making), (d) communication with research team regarding correct implementation of the computer-based program (asking clarification questions, calling for troubleshooting assistance, asking for help with interpreting computer-generated reports), (e) problem-solving skills (related to use of technology or loss of scheduled computer lab time), (f) adherence to research commitment (allowing all students to log on to the program and not using access to the computer as a behavioral reward or punishment, beginning and ending the computer lab sessions on time, running reports of student progress on schedule), and (g) management of classroom and student behavior (including monitoring students while they were working on computers, facilitating instruction as opposed to distancing self from the computer-based intervention, promoting a positive class culture). Using these definitions, we rated the quality of each teacher’s implementation of the intervention (fidelity to process) on a 1 to 5 scale, with 5 being the highest score. The two raters demonstrated exact agreement on individual item scores for individual teachers 85% of the time and agreement was off-by-one 12% of the time. They reached consensus on those items that did not have exact agreement and this consensus score is included in the analysis (see Table 2).
Teachers’ Fidelity to Process Scores
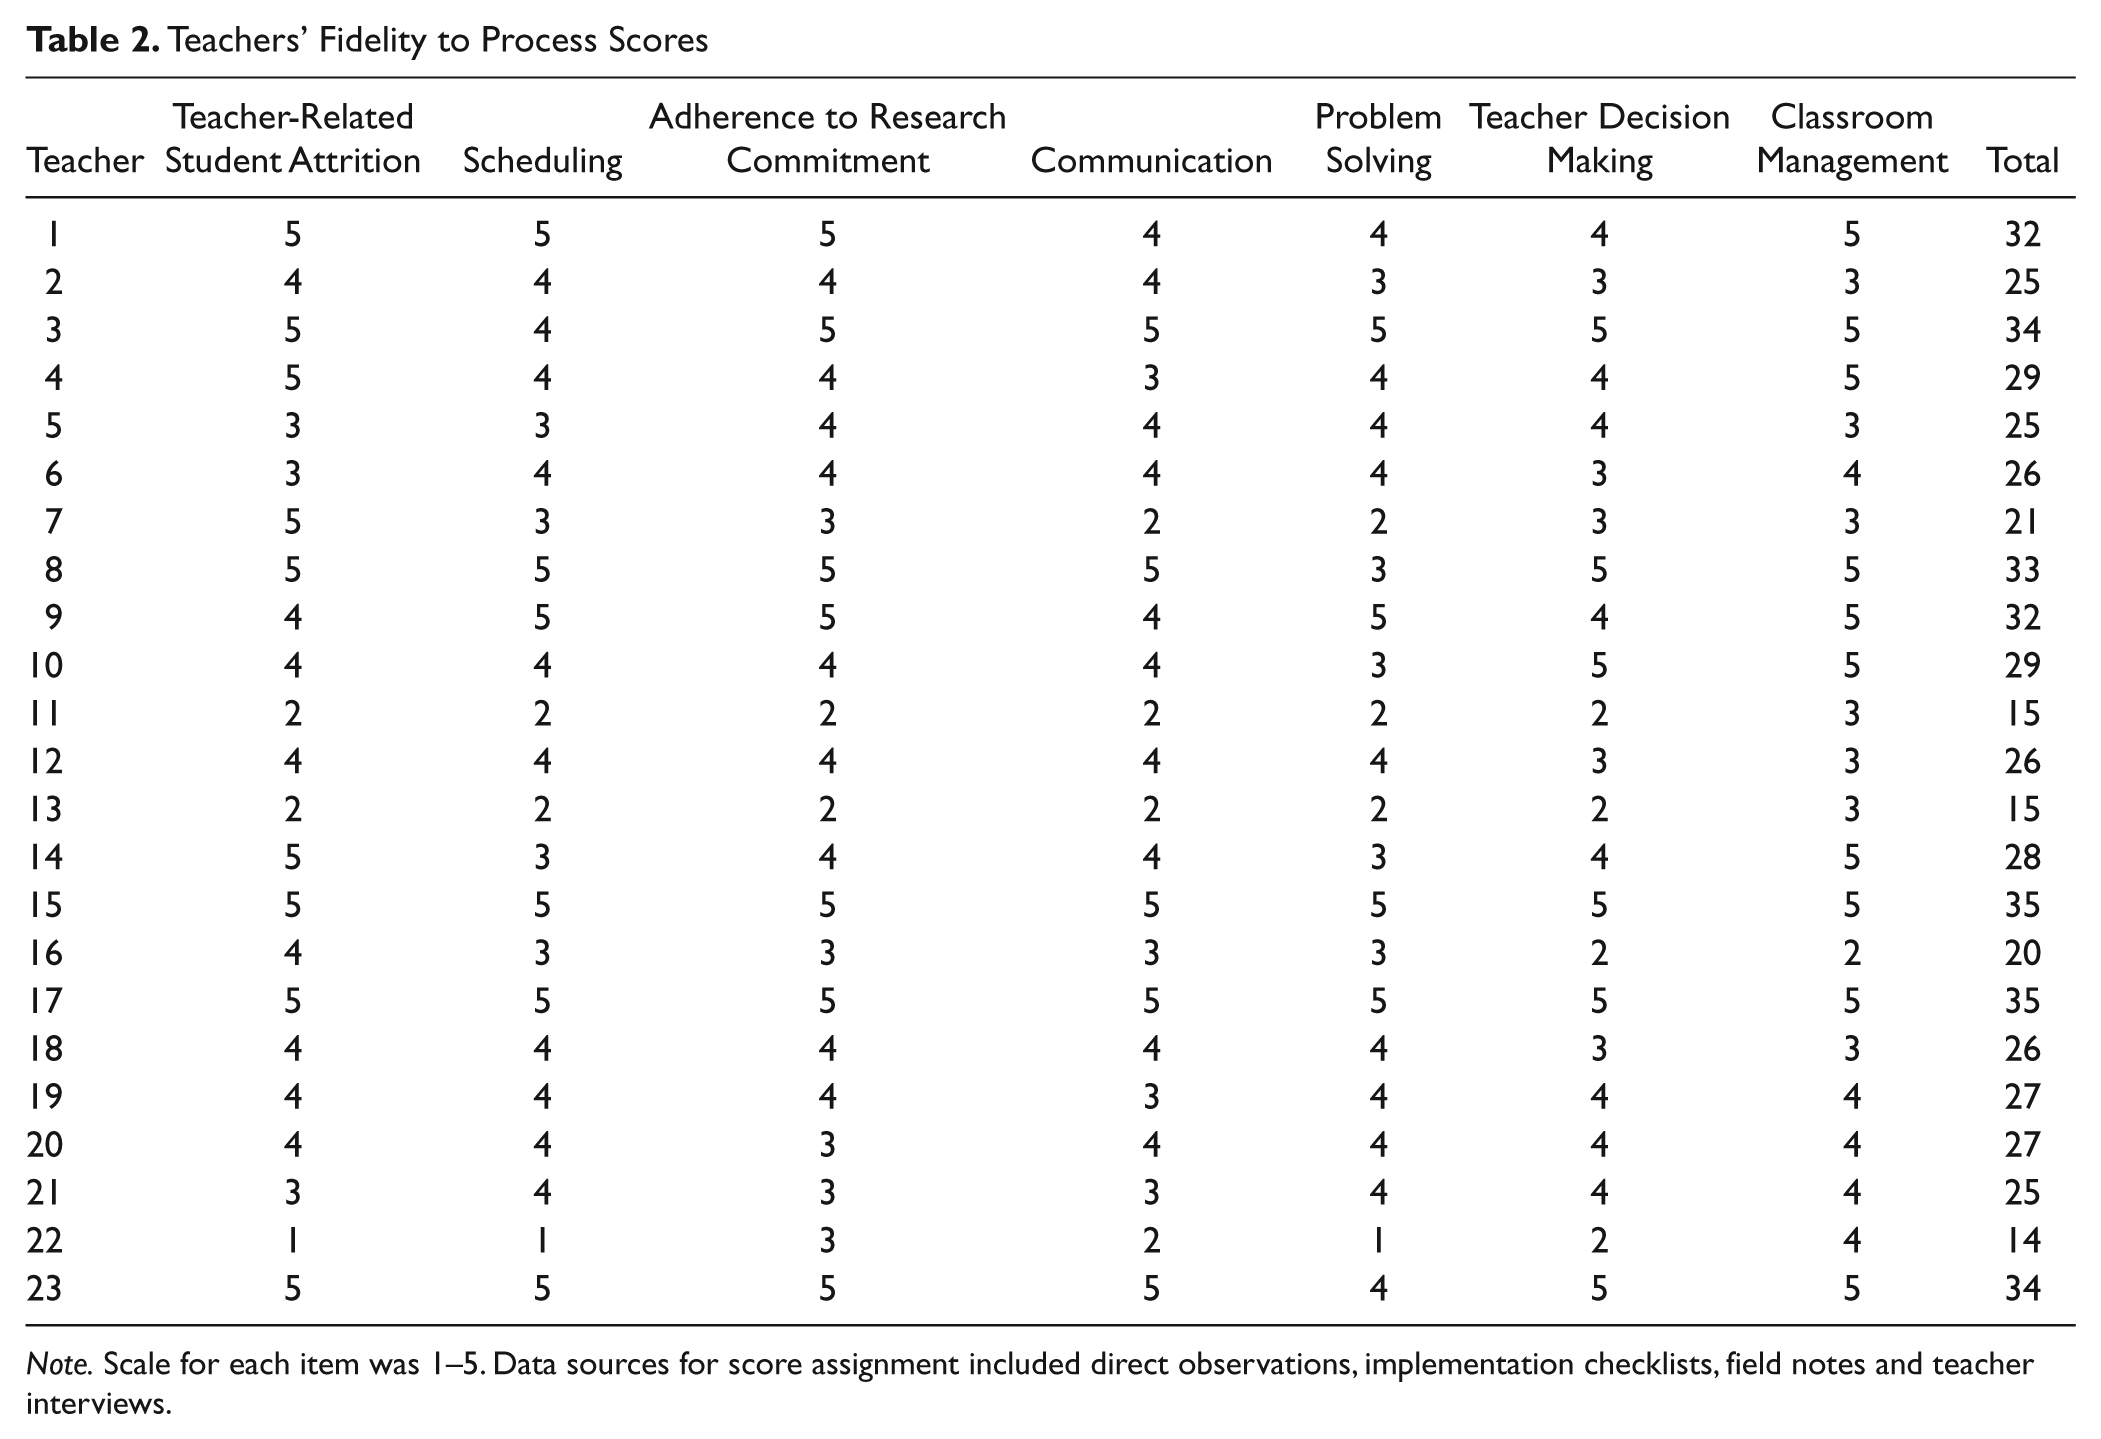
Note. Scale for each item was 1–5. Data sources for score assignment included direct observations, implementation checklists, field notes and teacher interviews.
Dependent measure
We created and validated the pre- and posttest used in this study. The same set of items was included on the pre- and posttest. We created questions by modifying those found on various state math tests and writing questions that resembled those posed in HELP Math lessons. The test consisted of questions from five mathematical strands: Basic Skills, Number Sense, Algebra, Geometry, and Data Analysis. A balance of items similar to state math test items and HELP Math items was a purposeful attempt to reduce bias across control and treatment groups.
One year before the study described here, we created a pilot test with 20 Basic Skills items and 32 items across the four mathematical strands (Number Sense, Algebra, Geometry, and Data Analysis), for a total of 52 items. We analyzed items for language load, clarity of wording, and cultural bias. Final items were piloted with 42 middle school students recruited through summer school programs in the local community. Results were organized into lowest and highest scoring items within each strand. For the lowest scoring items, we set 2 standard deviations from the mean as the cut point for making changes or deleting the item. Two items were modified using that criterion. The highest scoring items on the pilot test were from the Basic Skills strand. Within Basic Skills, 1 standard deviation above or below the mean was used as a cut point for inclusion in the final version of the test. Of the 20 basic skills items, 11 scored within 1 standard deviation. This process resulted in a final test containing 40 items, 8 items from each of the five strands. Next, we investigated the technical adequacy of the test. Scores of 586 seventh- and eighth-grade students were included in the analyses. Test reliability was moderate (pretest α = .79, posttest α = .86), with a discrimination index score of .66 at pretest and .62 at posttest (0- to 1-point scale). The distribution of scores was normal as were distributions of scores from subtests.
Analysis
Because of the nested nature of the data, we used a two-level HLM for analysis. Level 1 represented student data, specifically pretest results, total time in intervention, and concentration of time in intervention. Level 2 included teacher data—direct observations and fidelity to process (rating scale) scores. Although the direct observations included measurement of both teacher behaviors and student engagement in the program, we have classified it as a teacher variable because student response to an intervention is largely dependent on teacher behavior (Hulleman & Cordray, 2009). Because of the colinearity between total time in intervention and concentration of time, we ran two separate models, one for each variable, taking the form:
Because we had no a priori theory or empirical direction concerning random coefficients for the pretest and total minutes/concentration slopes, those remained fixed. Likewise, lacking any theoretical or empirical direction on interactions, we did not include any cross-level interactions with direct observations, fidelity to process, total time, and concentration of time. Two of the measures, the direct observation total score and the score from the fidelity to process scale were grand-mean centered in the analysis. Pretest score, total time, and concentration of time were entered uncentered. Level 2 variables were centered to make 0 a meaningful value and aid in the interpretation of the intercept. As Hofmann and Gavin (1998) describe, sometimes 0 has no real meaning, as it falls outside of the range of the real data or is not included in a variable’s scale of measurement (as in an ordinal scale with no 0). Grand mean centering gives the 0 a real value. With the Level 2 variables here, direct observations and fidelity to process, 0 was not a value in the real range of data and were thus centered. Level 1 variables were not mean centered because 0 had real meaning—a test score of “0” or zero minutes on the program.
It is important to note that our goal in this article was not model building. Rather, we sought to test the relation between a specific index of fidelity measures and an educational outcome. Thus, the results below do not include a “full” model and a parsimonious “final” model. Results do, however, include four different models—an empty model and three additive models—to measure the contributions of the addition of variables. The empty model includes no predictors. Model 1 includes only the pretest at Level 1. Model 2 includes all Level 1 variables—pretest, and either total time in intervention or concentration of time in intervention. Model 3 includes all Level 1 variables and both Level 2 variables—direct observation of implementation fidelity and the fidelity to process score. Intraclass correlation coefficients (ICCs) are calculated for each model, and Level 1 percentage of variance accounted for (PVAF; Hox, 2002) is determined after the addition of pretest to the empty model and after the addition of either total minutes or concentration is added to Model 1 (the pretest-only model). We also re-ran Model 3 with all predictors standardized, facilitating a comparison of the effects across all independent variables.
Results
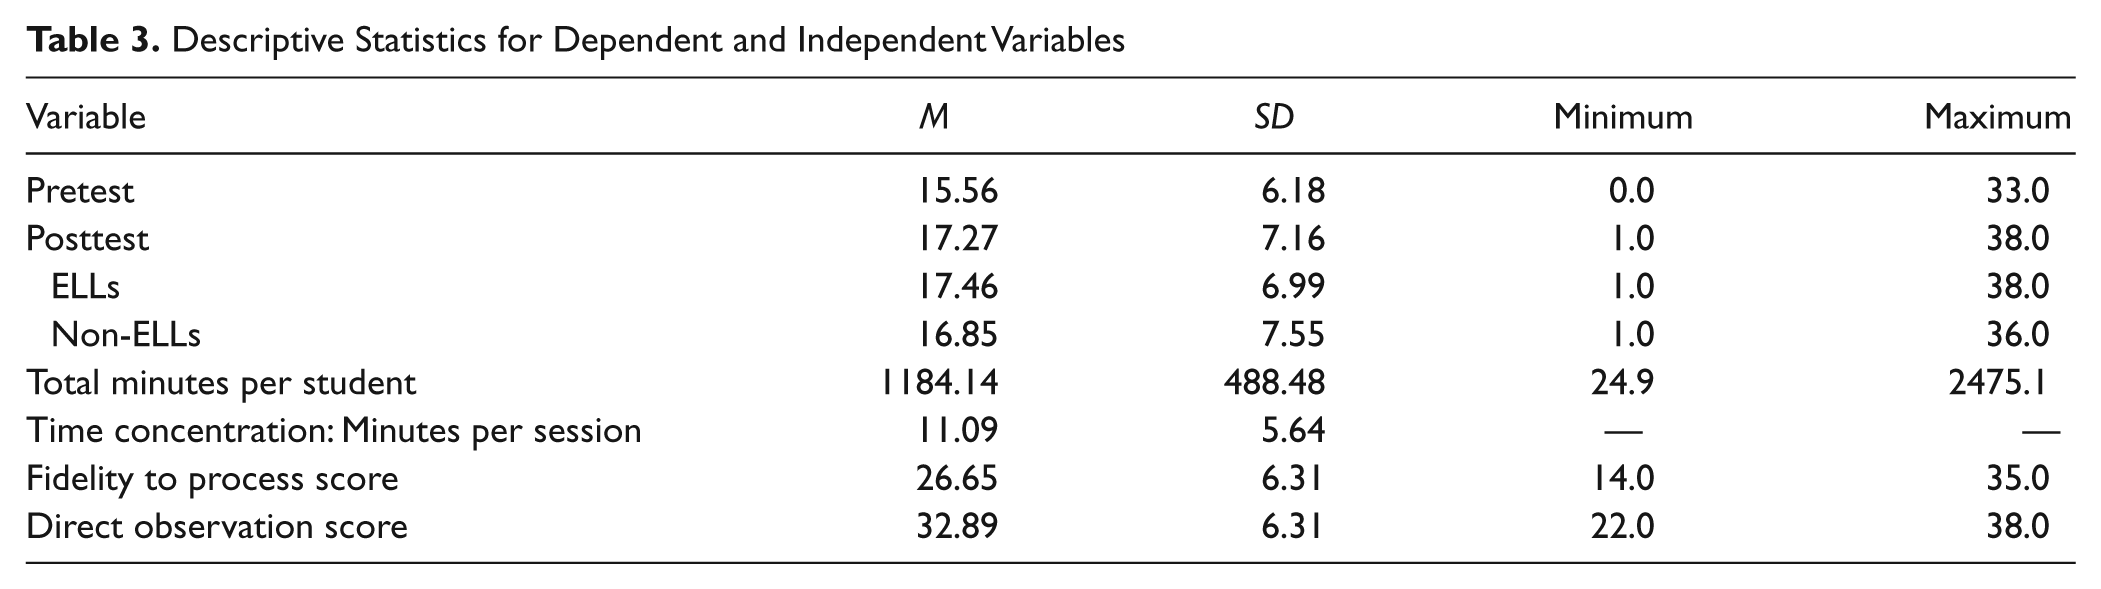
Beginning with descriptive statistics, results indicate an increase of 1.71 points (or 11%) in mean math performance from the pretest to the posttest (see Table 3). On average, each student spent a little more than 1,184 total minutes (almost 20 hours) on the intervention. Teachers averaged 26.65 points out of a possible score of 35 on the fidelity to process scale (76.14%). Mean scores on the direct observation of implementation fidelity averaged 33 out of a possible 40 (82.5%). EL students achieved a mean of 17.46 on the posttest, whereas non-EL students achieved slightly less with a mean of 16.85; differences were not statistically significant. This latter difference is important to note because the intervention was designed to meet the needs of ELLs, but 31% of this sample represented fluent English speakers.
Descriptive Statistics for Dependent and Independent Variables
Turning to HLM results, Table 4 presents the findings for the models with total time. In Model 3, three variables prove significant—total minutes in intervention (p <.001), direct observation (p =.04), and pretest (p <. 001). For total minutes, the relation is positive—more minutes equals greater performance—but the effect is small: Each 1-minute increase on the intervention results in a .001-point increase in math performance. For direct observation, the relation is likewise positive; each one-unit increase on direct observation measure results in a .42-point increase in performance. As is often the case, the relationship between pretest and posttest sores is positive. In this model, fidelity to process is not significant. The “standard” column in Table 4 presents the results with the variables on a standard scale. The variable with the greatest effect is pretest, followed by direct observation and total minutes.
HLM Results for Total Minutes Spent in Intervention
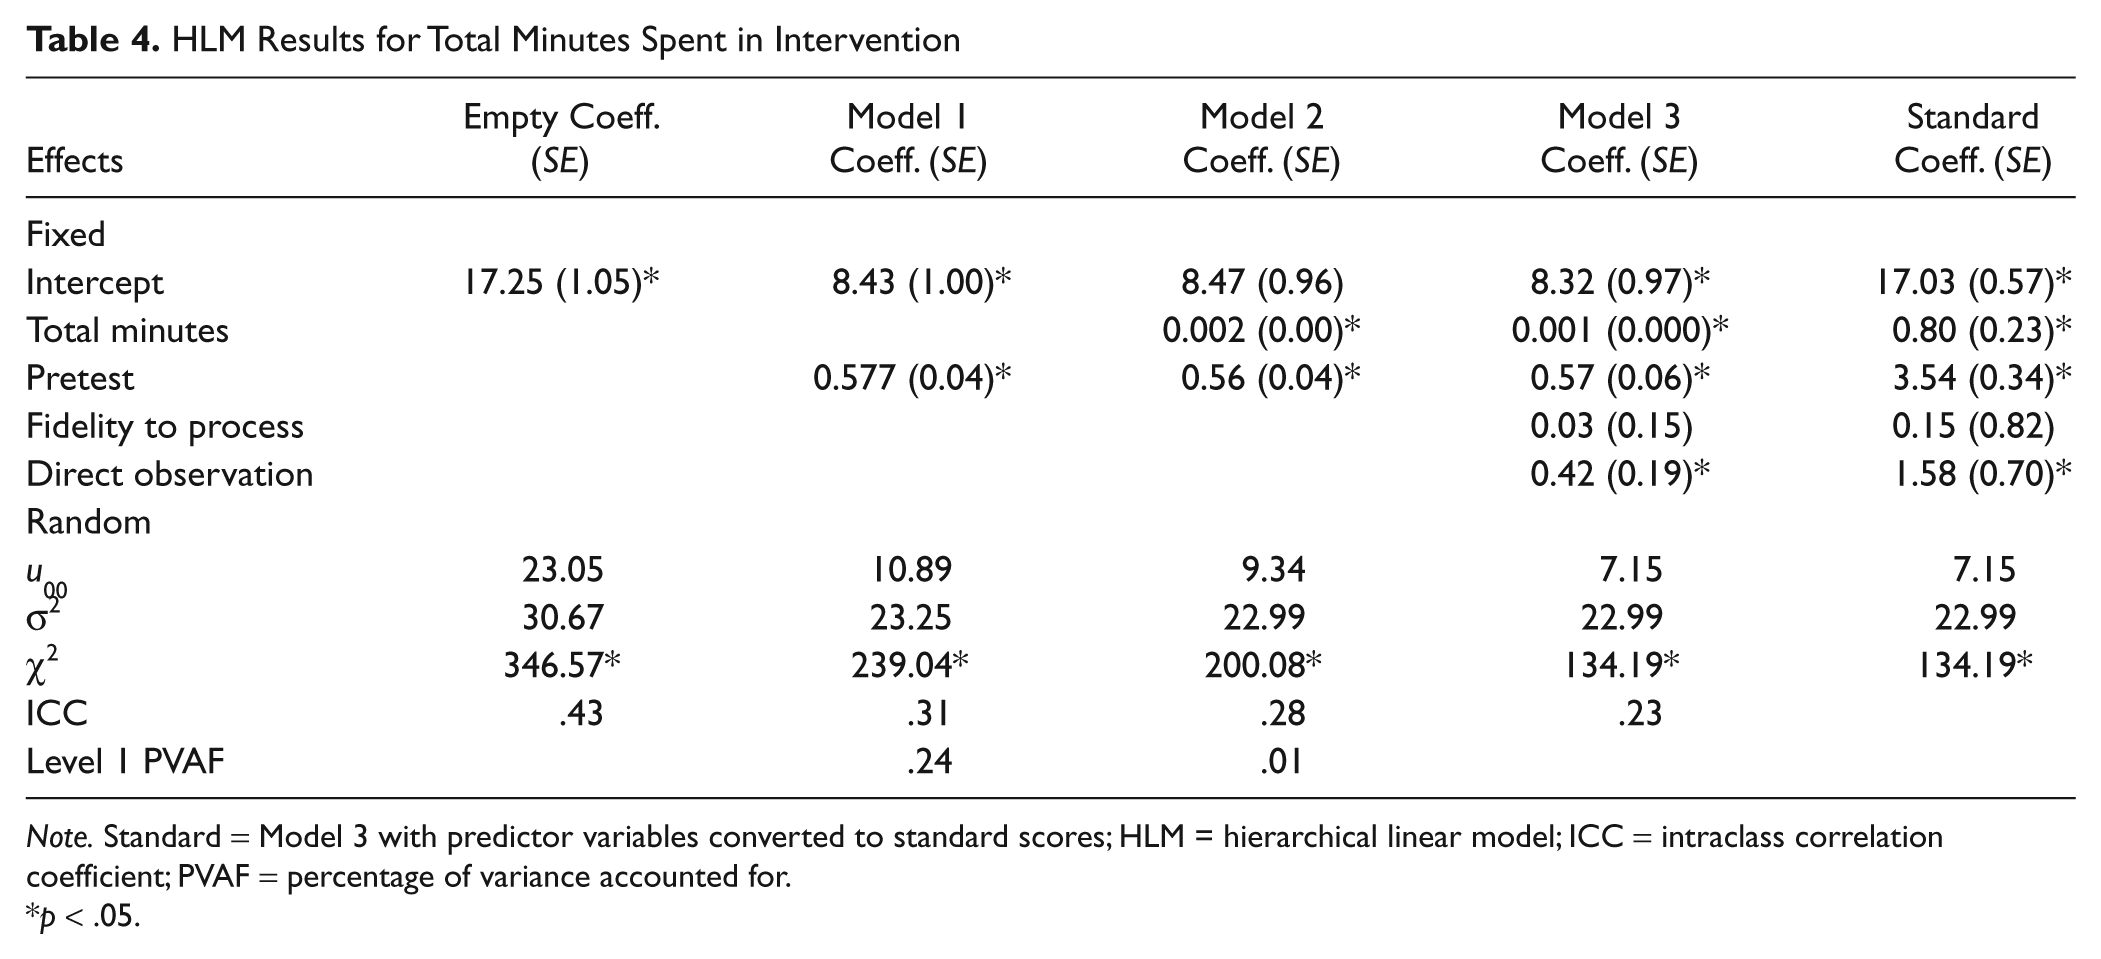
Note. Standard = Model 3 with predictor variables converted to standard scores; HLM = hierarchical linear model; ICC = intraclass correlation coefficient; PVAF = percentage of variance accounted for.
p < .05.
With concentration of time as the variable included in Level 1, rather than total minutes, the same pattern of significant and nonsignificant variables is evident (see Table 5). As indicated in Model 3, concentration of time in intervention (p = .03), direct observation (p = .04), and pretest (p < .001) are significant, whereas fidelity to process is not (p = .77). For concentration, each additional minute per session on the intervention yields a .10-point increase in math performance. Likewise, as the direct observation score increases 1 point, math performance increases by .43 points. The latter is quite similar across models. As above, the standardized coefficients indicate pretest is the strongest predictor, followed by direct observation and total minutes. To reiterate, direct observation of implementation fidelity was the strongest predictor of math performance, after the pretest score.
HLM Results for Concentration of Time in Intervention
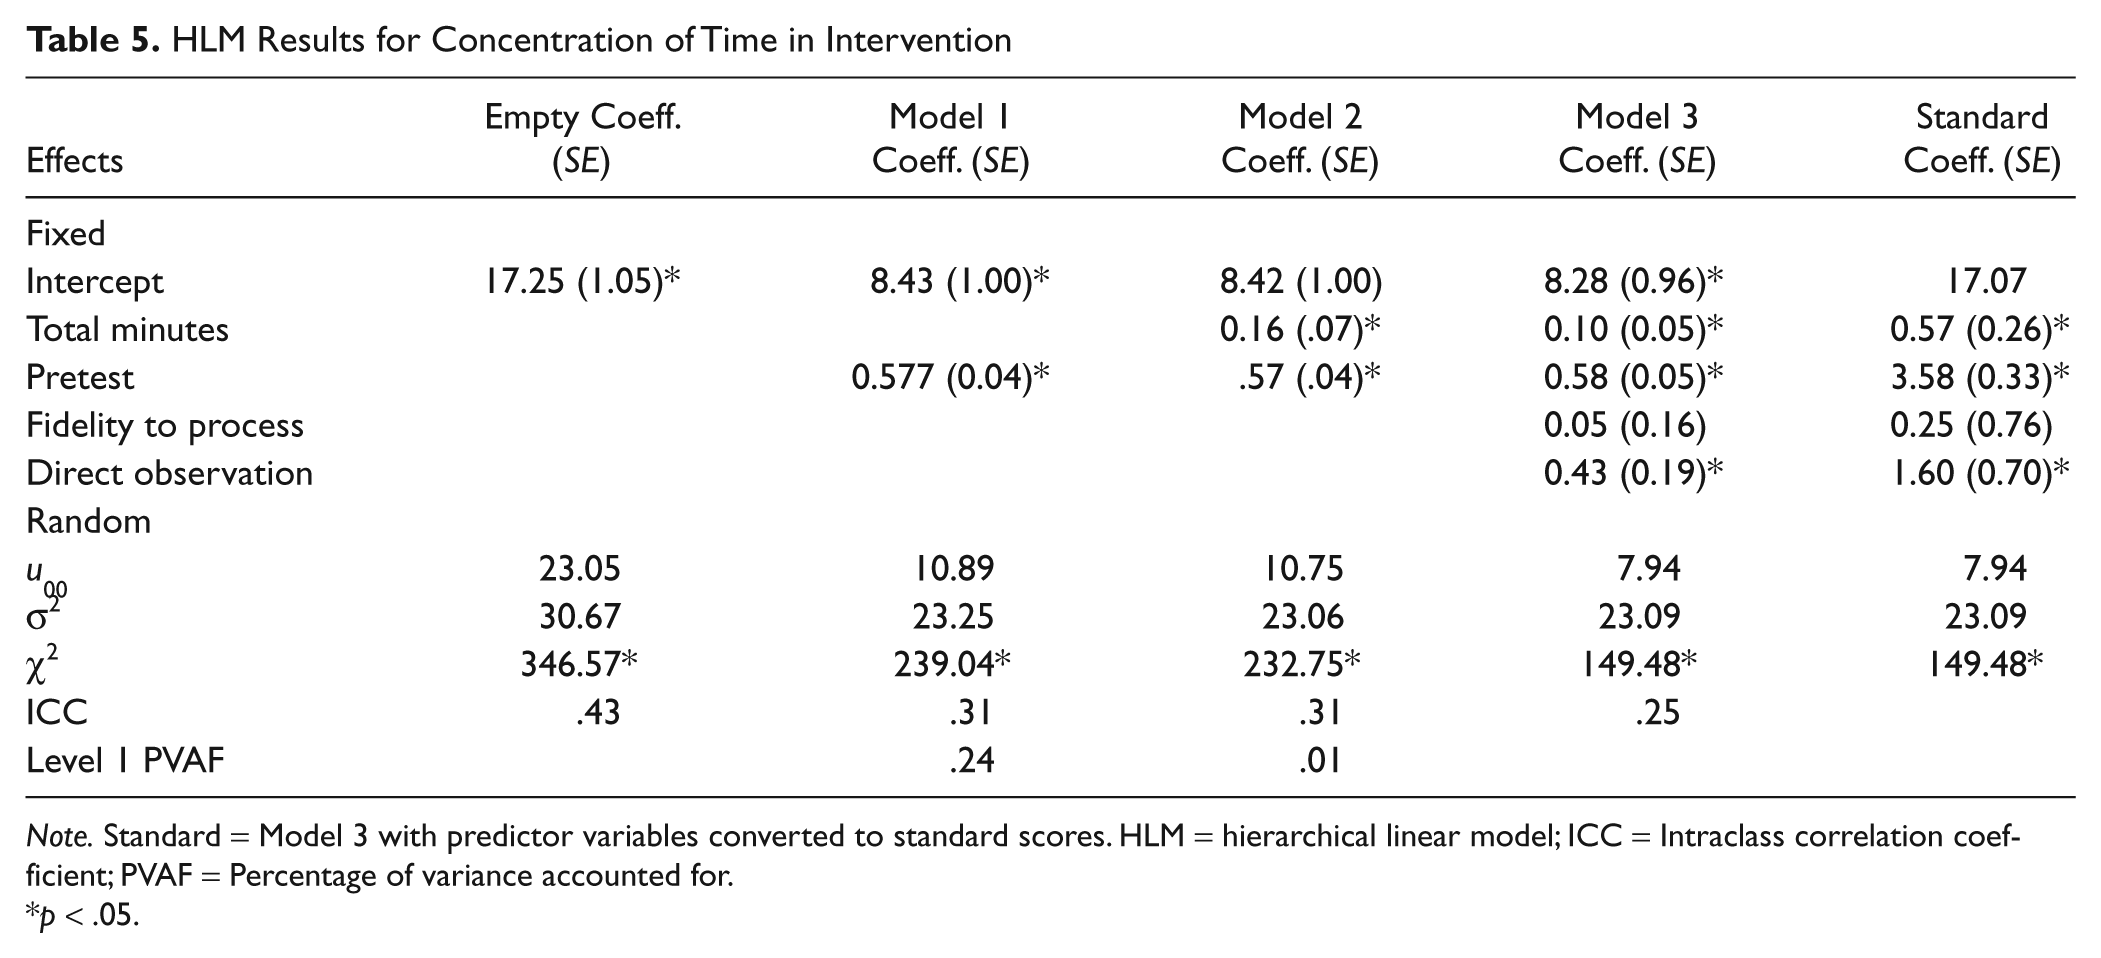
Note. Standard = Model 3 with predictor variables converted to standard scores. HLM = hierarchical linear model; ICC = Intraclass correlation coefficient; PVAF = Percentage of variance accounted for.
p < .05.
Turning to variance components (bottom panels of Tables 4 and 5), the empty model ICC was .43, meaning 43% of total variance was between classes. This between-class variance was reduced similarly from one model to the next with the use of both measures of time. In Model 3, the ICC was 23% for total minutes and 25% for concentration, although significant between-class variance remains in both cases. At Level 1, the addition of pretest accounts for 24% of the variance, when compared to the empty model. The addition of total time, or concentration of time, accounts for only 1%, as compared to the pretest only model. Finally, results of separate HLM analyses across both total time and concentration of time revealed no significant differences in math performance between EL and non-EL students (when EL status was included as an independent variable). Thus, fidelity does not appear to be jeopardized when the program is used outside of its originally intended population.
It is also possible to calculate optimal times for students to participate in the program in order to achieve desirable outcomes. The latter we define as an “A” grade on the posttest, which is a score ranging from 36 to 40. To determine optimal amounts of time, we used the HLM equation with the coefficients reported in Tables 4 and 5, and the mean values reported in Table 3 for the pretest and fidelity to process variables. For fidelity to structure, we set the variable to 40, which was the highest possible score on the direct observation measure. So, for a student with an average pretest score, a teacher with average scores related to fidelity to process who institutes the program as intended (score of 40 on direct observation), the optimal number of total minutes in the program is 3,500 (or approximately 58 hours). It is also important to consider concentration, or optimal amount of time. Using coefficients from Table 5 and the same variable settings used for the total time calculation, optimal time per session is approximately 15 minutes.
Continuing to explore the relation between total time and concentration of time, the data reveal that, except for two outliers, the fewer the overall intervention days spent on the computer, the greater the minutes spent per session and vice versa. As an example, the fewest number of days overall (elapsed time) was 54 days, and students in this classroom spent 24 minutes per day interacting with the intervention, whereas the class with the greatest amount of days, 157, averaged only 5.74 minutes per day on the intervention.
Discussion
Summary of Findings
Four variables were significant in their ability to predict student outcomes: (a) teacher adherence to and student engagement with the program as measured through direct observation, (b) concentration of time in intervention, (c) total time in intervention, and (d) pretest scores. The first three of these variables were classified as fidelity to structure variables and are listed in order of importance as indicated by the results. Specifically, when measured as total time, math performance increased by one point for every 1,000 minutes, and when measured as concentration, an increase of 10 minutes yielded a 1-point increase in math performance. When the independent variables were standardized, by converting them to z scores, results revealed that the “adherence” variable, as measured through direct observation, was approximately 2 to 3 times greater than that of the variable of time in the program. More specifically, increasing the direct observation score by 1 SD resulted in a 1.59-point increase in math posttest (40 points possible), whereas a 1 SD increase in total minutes yielded a .80 increase in posttest score and a 1 SD increase in concentration produced a .56 increase in math posttest. The effect of adherence to the program is so strong that modest decreases on the direct observation score require substantial increases of time spent in the program to maintain a desirable achievement outcome.
In summary, fidelity of implementation, and specifically those variables we grouped as fidelity to structure, of a computer- based middle school math program is significantly and positively related to increased student performance. Results showed that an increased fidelity to structure relates significantly to higher outcomes in student posttests, whereas fidelity to process—including classroom management, teacher communication, and problem solving—demonstrated no significant increase in outcome measures. Calculations of the effect of time on student outcomes revealed that the optimal concentration of time during any individual session was 15 minutes and the optimal amount of time for students to engage with the program was 58 hours.
Implications for Research and Practice
Guidelines exist for how much time should be spent on a teacher-led intervention. Many of these guidelines are associated with the Response to Intervention model and its emphasis on Tier 2 interventions designed for students who need supplemental instruction to support the core curriculum. Guidelines for these interventions are set at 20 to 40 minutes per session, 5 days per week (Fletcher & Vaughn, 2009) across 9 to 12 weeks (Mellard & Johnson, 2008; Pierangelo & Giuliani, 2008). Guidelines are based on research into the impact of teacher-led interventions. Similar guidelines have not been fully established, however, for computer-based interventions. Results of this study contribute empirically to this discussion, and support the positive influence of time (both length and concentration) on student outcomes as related to a computer-based math intervention. And, a resulting implication for practice dictates the need for teachers to ensure students are spending that allotted time in a productive manner.
Statistically, we found that the optimal concentration of time during any individual session was 15 minutes, and the optimal amount of total time was 58 hours. But to calculate optimal time we had to set parameters around the variables included in the statistical model—for example, we set high standards for students’ posttest scores assuming that positive outcomes implies an A grade at posttest and true adherence to program implementation implies a perfect score on the direct observation measure. Obviously, any changes to these parameters results in a change to the reported optimal time. A statistical analysis, however, is a place to start and because the variables and their parameters have been fully explained in this article, other researchers can continue to explore the construct of “optimal time” as related to computer-based interventions. Interestingly, the time recommended for students to engage in SuccessMaker Math, a computer-based mathematics intervention for students in Grades K–8 (Pearson, 2008-2009) is 15 minutes per session. And although 15 minutes is set as the default time for any one session of SuccessMaker Math, we were unable to find any empirical data directly related to the program that supported this recommendation. Finally, what was learned from direct observations of HELP Math in classroom settings was that the program held students’ attention for at least 30 minutes in every setting, and the complexity of the program’s content (problem solving as opposed to drill and practice) seemed to necessitate this amount of time for students to fully engage (Crawford, 2008). These observations challenge the findings from the statistical model of 15 minutes per session, implying the need for more research into what is a statistically optimal amount of time per session as opposed to what is realistically optimal in classroom settings.
Teacher adherence to and students’ engagement with the program was found to be even more significant than time. Researchers emphasize the need to conduct direct observations of implementation fidelity but few educational research studies explore the effect of observation scores on student outcomes. We found that an increase in adherence to program elements by teachers and students was positively associated with an increase in student outcomes. Specifically, we found that as the direct observation score increased by 1 point (on a scale of 40), math performance on posttest increased by almost .5 points (also on a scale of 40). Although little research has been conducted into the relation between fidelity of computer-based interventions and student outcomes, these findings imply that fidelity is just as important in this context as it is in teacher-led instruction. These results demonstrate that helping students log on to a computer and then walking away does not constitute appropriate implementation and that to foster positive student outcomes, teachers must implement computer-based programs with the same level of rigor that they implement teacher-led interventions.
Finally, the variable of fidelity to process did not contribute significantly to student outcomes. As we discussed previously, however, subjective measures of process variables are less reliable than more direct observational measures and our findings should not suggest that process variables are unimportant in the field of educational research. As stressed by Tucker and Blythe (2008), we should examine two components of implementation fidelity: (a) treatment adherence and (b) practitioner competence. They note that adherence is qualitatively different from competence and we must attempt to measure both. They also call for more research into the impact of these constructs on desired outcomes. Similarly, Mills and Ragan (2000) identify teacher skills needed for fidelity of computer-based instruction such as integration of computer-based curriculum with classroom instruction, trouble-shooting technology problems as they arise, and seeking out ongoing training—skills that are less observable in a time-constrained direct observation. It is clear that continued research into how best to measure both constructs, and their effect on student outcomes in a computer-based instructional environment, is needed. For teachers, understanding the components and structure of a computer-based curriculum and being able to help students expeditiously with any problems they encounter (both process variables) enables students to increase their time on task, which in turn contributes to positive outcomes.
Limitations
One possible limitation of this study is that our sample included fluent English speakers as well as students who were ELLs—the population for whom the program was intended. However, as previously documented, the program has been found to be successful with both populations of students. Moreover, in this study we found no differences across the two groups of students at posttest and no difference in results of the HLM analyses when the variable of language fluency was included. These findings suggest that this is less of a limitation than it may first appear to be. A second limitation may be the use of an indirect measure of fidelity—the fidelity to process scale used in this study. Specifically, and as discussed in our introduction, indirect measures of fidelity are weakly correlated with direct measures of fidelity (Gresham et al., 2000), and process variables tend to be more subjective and harder to define than more objective and observable behaviors. And because fidelity to process was the only variable in this study found not to relate to the outcome variable, one must question the validity of the construct. Yet computer-based instruction requires subtle changes to classroom culture and teacher problem-solving and facilitation skills that may not be as easily observable as behaviors associated with teacher-led instruction. Therefore, the challenge is to measure these somewhat elusive variables systematically with as little subjectivity as possible.
Conclusions
Educational research poses challenges that differ greatly from those challenges associated with basic laboratory research. In the lab, research integrity is largely dependent on the researcher who has control over the environment. In the field of education, research integrity is often dependent on the fidelity to which teachers implement the intervention. Although a lack of fidelity may not be intentional, it still challenges the integrity of one’s research and the validity of the findings. We can (and must) improve the implementation fidelity of our research studies and also increase our attention to the impact of this fidelity on outcomes achieved. In this study, we measured the relation between implementation fidelity and student outcomes and found that when an online supplemental math intervention was delivered as intended, with fidelity, student outcomes improved. But, as fidelity of intervention decreased so did student scores, reinforcing the belief that measuring students’ pre–post gains is not enough; we must also interpret these scores in the context of implementation fidelity.
Footnotes
Declaration of Conflicting Interests
The authors declared no potential conflicts of interest with respect to the research, authorship, and/or publication of this article.
Funding
The authors disclosed receipt of the following financial support for the research, authorship, and/or publication of this article:
This research was funded in part by the U.S. Department of Education (Grant CFDA84.286B).