
Abstract
This article reports the results of a study examining the utility of curriculum-based measurement (CBM) in algebra for predicting performance on a state math assessment and informing instructional placement decisions for students in seventh, eighth, and tenth grades. Students completed six Basic Skills algebra probes across different time schedules and took their respective grade-level state math assessment. Using a dichotomous pass/fail variable based on whether students met grade-level proficiency, logistic regression and receiver operating characteristic (ROC) curve analyses were conducted to assess the CBM’s predictive validity. Rates of improvement (ROIs) were computed using the Tukey method to collect initial information on whether these measures would help monitor student progress. Finally, to determine whether these measures might inform instructional programming, a MANOVA using course assignment as the grouping variable and CBM, ROI, and state assessment performance as the dependent variables was conducted for the tenth-grade students. Results indicate that these measures show promise to predict which students might not meet grade-level proficiency standards as well as to determine whether students are progressing in the curriculum. Implications for practice are discussed.
The context for this article is the convergence of initiatives currently impacting secondary schools (Grades 7–12). This convergence consists of (a) response to intervention (RTI), a tiered service delivery model for instruction that focuses on the use of data-based decision making to inform instructional placement and programming; (b) the requirement that all students successfully complete algebra coursework and achieve required performance standards in math; and (c) the lack of available formative measures that support secondary schools in their efforts to implement these initiatives. Within this context, we explore and describe a process that practitioners can undertake to make informed decisions that can lead to improved student outcomes.
RTI
RTI is a preventive framework patterned on a public-health model, in which instruction is delivered with increasing intensity to meet the needs of all learners (Mellard & Johnson, 2008). RTI is most often conceptualized as a three-tiered model, with Tier 1 representing the general education program, Tier 2 representing a system of interventions designed to meet the needs of students who are struggling to learn, and Tier 3 representing special education (Vaughn & Fuchs, 2003). As described by the National Center on Response to Intervention (NCRTI), the essential components of an RTI model include screening, progress monitoring, multitiered intervention, and data-based decision making (NCRTI, 2010).
At the secondary level, RTI includes the implementation of these essential components; however, implementation presents challenges due to the structure and organization of secondary schools (Duffy, 2007; National High School Center, 2010). For example, the process of screening, progress monitoring, and data management for a large number of students served by several teachers each day presents logistical issues that can be very difficult to negotiate to begin the RTI process. Additional concerns include how to award credit for intervention courses, staffing issues, and scheduling challenges (National High School Center, 2010).
Despite these implementation challenges, there are compelling reasons for high schools to consider RTI models. For example, in recent years, states have increased the number of credits required in mathematics, and the Common Core State Standards (National Governors Association Center for Best Practices, Council of Chief State School Officers, 2010) reflect a strong emphasis on ensuring all students complete advanced mathematics successfully. The increased academic demands come at a time when national performance in mathematics is low. Recent reports of math performance at the secondary levels are discouraging. Only 26% of 12th graders and 34% of 8th graders scored at or above the proficient level on the most recent National Assessment of Educational Progress (NAEP; 2009) Mathematics test (National Center for Education Statistics). A responsive system of effective instruction and intervention that are the hallmarks of an effective RTI system can support high schools as they work to meet these new challenges.
For RTI to work well, screening tools must reliably identify students at risk of poor outcomes, and progress-monitoring tools must be reliable, sensitive to student growth, and predictive of general performance in the construct of interest (Deno, 2003). Screening and progress-monitoring tools are well defined for many areas, primarily for elementary grades in reading and math. At the secondary level, these instruments are still being refined. In a recent review of eight high schools implementing RTI processes, the National High School Center reported that most schools rely on teacher-created probes to monitor progress in math (National High School Center, 2010). With 49 of 50 states developing either state-level policy or guidance about K–12 RTI systems (Zirkel & Thomas, 2010), measurement tools for secondary levels are rapidly emerging (Johnson, Smith, & Harris, 2009).
Math Content and Performance Standards
In addition to considering issues about RTI implementation, with the movement to common core standards, secondary schools are increasingly under pressure to offer a challenging academic curriculum for all students and to demonstrate that students are able to achieve a certain level of proficiency in mathematics as measured by state assessments. These calls for improvement reflect a response to the historically low performance of U.S. secondary students in mathematics (American Diploma Project, 2004), with the resulting requirement that all students successfully complete coursework in algebra as a condition of high school graduation (Allensworth, Nomi, Montgomery, & Lee, 2009). This requirement is not limited to students pursuing a college preparatory curriculum but extends to all students, including those who had previously received instruction in remedial math courses. A recent analysis of this policy in Chicago Public Schools concluded that mandating algebra resulted in increased enrollment for student populations (e.g., students with disabilities, Latino students, students from low socioeconomic backgrounds) who had previously not had access to challenging math courses. However, increased enrollment did not translate into successful performance for these students (Allensworth et al., 2009). Failure rates in algebra increased, and students who previously took remedial courses were no more likely to enter college after enrolling in algebra. Rather than serving as an indictment of the policy, however, Allensworth et al. (2009) recommended that the next step in implementation is for schools to improve their instructional offerings and placement decisions to better meet student needs. One of the most effective ways to inform instructional planning is through the use of formative assessment measures, and in particular, curriculum-based measurement (CBM; Deno, 2003).
CBM
Improving instructional practices to meet the needs of a diverse population of students can be challenging at the secondary level. Formative assessment measures can inform instructional placement and instructional programming. This view is not necessarily widely shared at secondary levels. For example, a recent review by Dunn and Mulvenon (2009) on formative assessment claimed to “dispel the myth that formative assessment had thorough empirical evidence supporting its positive impact on student performance” (p. 3). We wish to counter that claim, by focusing on the extensive research base of one particular type of formative assessment, CBM. Unlike other forms of formative assessment, CBM has a strong evidence base that supports its use to benchmark and progress monitor student performance in a variety of academic areas, including mathematics and more specifically, algebra (Deno, 2003; Foegen, Olson, & Impecoven-Lind, 2008).
Several publications and references provide detailed descriptions of CBM (see, for example, Deno, 1987; Fuchs, 2004). Essentially, CBM is a type of measurement that is created by sampling the curriculum over the course of an entire year, then constructing alternate forms of a test that consist of items that reflect the grade-level curriculum (Hintze, Christ, & Methe, 2006). This is in contrast to other types of measurement more routinely used as formative measures, for example, mastery measurement, where performance on the specific skill being taught is assessed and retaught until students reach a specified level of performance, then the next skill is taught and assessed, but the student’s performance across skills is never systematically reviewed (Fuchs & Deno, 1991). Although both types of formative assessment are useful in instructional planning, CBM is considered superior to mastery measurement as a benchmarking and progress-monitoring tool because it systematically measures student performance in the grade-level curriculum, providing teachers with a direct measure of whether the student is benefiting from the instructional program (Hintze et al., 2006).
More than three decades of research support the use of CBM as an important formative assessment tool that results in improved student outcomes (Deno, 2003). This finding has been consistent across content areas (i.e., reading and math) and grade levels. Some research indicates that the mere collection of data results in improved student performance even if teachers do not actively make significant instructional changes in response to those data (Fuchs, 2004). Because of this evidence base, CBM is prescribed for use within an RTI process (Mellard & Johnson, 2008). One area of nascent CBM research is secondary mathematics. Although some measures exist that assess computation and concepts at middle school levels (e.g., AIMSweb computations), these measures do not tap more advanced mathematical operations such as algebra, and therefore tend not to have high face validity for middle and high school mathematics teachers (Foegen, 2008). Very few measures that assess algebra or more advanced mathematics are available, with the NCRTI, including easyCBM (Nese et al., 2010) and Orchard software (EdOptions, 2011). EasyCBM is designed up to eighth grade and Orchard up to ninth grade. A promising alternative for secondary math assessment is Project AAIMS (Algebra Assessment and Instruction: Meeting Standards), developed by Foegen and her colleagues (2008) at Iowa State University. Project AAIMS has developed several algebra CBMs and has conducted preliminary research on their use as potential benchmarking and progress-monitoring tools in the area of algebra.
The Project AAIMS CBMs include four different types of probes: (a) Basic Skills, (b) Algebra Foundations, (c) Translation, and (d) Content Analysis—Multiple Choice. In this study, we focused on the Basic Skills probe only, which was designed to assess the skills that students need to be proficient in algebra. Basic Skills probes include items such as solving simple equations, applying the distributive property, and working with integers (Foegen, Olson, & Perkmen, 2005). The measures are described in detail through several technical reports on the Project AAIMS website (http://www.ci.hs.iastate.edu/aaims/homepage.php). Investigations of their technical adequacy have established high reliability (alternate forms) and moderate validity (criterion) for the measures for high school students (Foegen et al., 2005; Foegen, Olson, & Perkmen, 2006; Perkmen, Foegen, & Olson, 2006), but important questions about these measures remain. For example, there is little information regarding how well the measures predict more general math outcomes and also scant information on how performance on these measures might inform instructional decisions.
CBMs are developed and standardized through a series of stages of research as outlined by Fuchs (2004). Briefly, the stages include (a) establishing the psychometric properties of the static scores on the measures, (b) establishing the reliability and validity of the slope or the measures’ ability to measure growth, and (c) establishing the instructional utility of the measures (Fuchs, 2004). The AAIMS measures have been tested in numerous studies to establish the psychometric properties of their static scores (Stage 1), but less emphasis has been placed on Stages 2 and 3 research. In an ideal world, CBM measures are not used by practitioners until a compelling research base across the three stages has been established.
Waiting for the ideal can leave secondary schools in a quandary. Many practitioners are confronted with the requirement to ensure all students successfully complete algebra and achieve high levels of math performance; evidence suggests that simply placing students in algebra courses does not promote successful achievement; benchmarking and progress monitoring are effective ways to inform instructional decision making; however, measures for secondary mathematics with a strong research base are not currently available. There are promising measures that have an emerging evidence base to support their use. This suggests that practitioners wishing to adopt these measures should engage in active research processes through which they establish and refine decision rules (or alternatively, decide that the measures are not helpful in their particular context) to reliably inform placement decisions and instructional programming. The purpose of this article is to describe two schools’ efforts in implementing such a process using the Basic Skills algebra probe developed by Foegen et al. (2005).
Method
Setting and Participants
Two schools from two districts in the Pacific Northwest participated in this project: one junior high in a rural setting that serves 397 students in Grades 7 and 8, and the other high school in a suburban setting that serves 748 students in Grades 10 to 12. At both the junior high and high school, the RTI implementation team was interested in developing a process that would reliably identify students at risk of not meeting performance targets on a state math assessment. The junior high was also interested in finding a way to monitor student progress within the instructional setting and to identify students who might require differentiated instruction to be successful. At the high school, the team was interested in finding a way to reliably inform instructional placement decisions into one of three math courses for 10th-grade students.
To accomplish these goals, the junior high assessed all of its 7th- and 8th-grade students except for those working on alternative curriculum standards (n = 357). At the high school, because state assessments are only given through 10th grade, only 10th-grade students participated in the collection of data to establish cut scores for determining risk status and instructional placement decisions (n = 123). The demographics of the participating students are presented in Table 1.
Participant Characteristics.
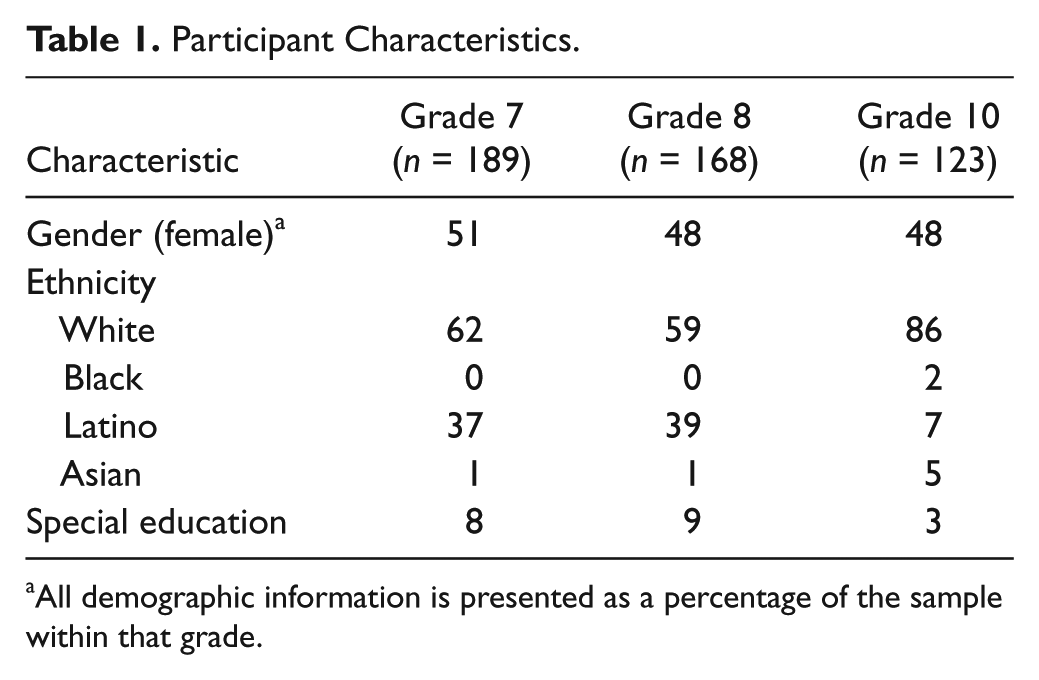
All demographic information is presented as a percentage of the sample within that grade.
Procedures
Project AAIMS provides on-site training to schools and districts interested in using the algebra CBM tools they have developed. In February 2010, a trainer from Project AAIMS provided a 1-day training session for the participating junior high and high school math and special education teachers. Training consisted of familiarizing teachers with the probes, explaining their development, scoring practice exercises, charting and data interpretation exercises, and obtaining high interrater reliability on scoring the various probes. Included as part of the training was a complete set of probes, scoring directions, and a database template for inputting student data. The teachers participating in the training were then charged with implementing the collection of data at their respective schools. At the high school, probes were administered and scored by four math teachers according to the standardized procedures provided in the training materials. Support for data collection at the high school was provided by the school psychologist. At the junior high, probes were administered and scored according to the standardized procedures provided in the training materials by one special education and two math teachers. Both schools decided to begin with the Basic Skills algebra probes only. The Basic Skills algebra probes are the least complex to score of the four types of probes; thus, both teams felt that would make them more readily accepted by their school staff, and would also facilitate getting started with benchmarking and progress monitoring.
Junior high
Seventh- and eighth-grade students took a total of six Basic Skills algebra measures over a 3-month period in the spring of the 2009/2010 school year. Two forms were given in early March, two more were administered 4 weeks later, and two final measures were administered after another 4 weeks. The measures were administered by classroom teachers who were trained by the second author according to standardized procedures as specified in the AAIMS training materials. All measures were administered in a group setting at the beginning of their math class period. Students who were absent on the day of administration were given the measures on returning to school. The order of presentation was randomized by student. The measures were printed on one side of the paper and stapled together. Students were given 5 min to complete as many problems as possible.
The measures were graded using the answer keys provided by Project AAIMS. The second author scored the measures and had a colleague conduct a 10% interrater reliability check. The two scorers achieved a 95% interrater reliability. The scoring rules for the Basic Skills algebra measures were adhered to: All correct items were marked with a C, all mathematically equivalent answers were accepted, skipped problems were ignored, and the total number correct was noted on each page. Then the total number correct was noted on the first page of each measure. Scores on each measure, student identification number, grade level, gender, and state math assessment scores were input into a database for analysis.
High school
The participating high school followed similar procedures, with the exception that the measures were administered and scored by the math teachers who participated in the AAIMS training. In addition, the schedule for administration differed. The first measure was administered at the end of March, followed by one measure administered every other week for a total of five by the end of May. The measures were scored using the procedures described above, and student performance on each measure along with their score on the state math assessment was collected in a database.
Measures
Basic Skills algebra measures
The Basic Skills probe consists of 60 items that are designed to assess students’ basic skills in algebra that serve as indicators of overall proficiency (Foegen et al., 2005). Items include solving simple equations, combining like terms, applying the distributive property, and working with integers. A description of the content selection and problem-type selection process for the Basic Skills probe is provided by Foegen et al. (2005). Students are given 5 min to solve as many problems as possible. Each item is scored as 1 point if answered correctly. Reliability for the Basic Skills probe is high, with reported interrater reliability coefficients of .97, alternate forms reliability ranging from .73 to .78, and test–retest reliability coefficients of .75 (Foegen et al., 2005). Raw scores (total number correct) are used to report performance on the Basic Skills measures. The criterion validity of the Basic Skills algebra probes with class grades and teacher ratings has been reported in the low range, from .23 to .31 (Foegen et al., 2005), and in the moderate range, .60 with the Iowa Algebra Aptitude Test (Perkmen et al., 2006).
Idaho Standardized Assessment Test (ISAT) mathematics
The ISAT math test is a multiple-choice, computerized assessment that is aligned to the Idaho State Content and Performance standards. The math assessment includes items across five categories: (a) number and operations, (b) principles of measurement, (c) concepts of algebra and functions, (d) geometry, and (e) data analysis and statistics. The tests are administered in Grades 3 to 8 and 10. Scale scores for the ISAT were developed using a Rasch model. The tests in Grades 7, 8, and 10 consist of 70 items: 45 core items that form the basis of students’ scores, 10 field items that are piloted to create the core the following year, and 15 extender items that allow for greater measurement precision in the reporting categories. Reliability (coefficient alpha) for the math assessments was reported as .90 for seventh, eighth, and tenth grade for the 2010 administration. Both scale scores and dichotomous pass/fail scores based on state-published cut scores for the ISAT were used to conduct the data analysis.
Data Analysis
Determining at-risk status
To determine cut points for identifying students at risk of poor math outcomes on the state assessment, binary classification analyses were run for each grade level. Performance on the state assessment was coded as a dichotomous variable based on whether the student met the published cut score for proficiency for the relevant grade level. A logistic regression was then conducted to determine whether the AAIMS probes could accurately predict performance in the pass/fail category. For the junior high grades, the median score of the first two probes was used as a predictor. For the tenth grade, only the score on the first probe was entered. Then, a receiver operating characteristic (ROC) curve analysis was conducted to identify the cut score that predicted the group of students who were at risk. ROC analysis provides a measure of how well a screening measure correctly sorts students as at risk or not at risk by plotting the range of sensitivity and specificity levels across all possible scores of the screening tool (Zhou, Obuchowski, & Obuchowski, 2002). A ROC analysis produces a plot of sensitivity and specificity levels, and reports the area under the curve (AUC) as a way to determine the utility of the screening measure. AUC values closer to 1 indicate the screening measure reliably distinguishes among students with satisfactory and unsatisfactory math performance, whereas values at 0.50 indicate the predictor is no better than chance (Zhou et al., 2002).
In addition to the AUC, ROC analysis also produces a table of scores on the screening measure along with the associated sensitivity and specificity levels. Sensitivity represents the proportion of truly at-risk students in a screened population who are identified as being at risk by the screen. It is calculated by dividing the number of truly at-risk students identified by the screen by the total number of students who are truly at risk, for example, true positives / (true positives + false negatives). Specificity is the proportion of not at-risk students who are so identified by the screening test. It is calculated by dividing the number of truly not at-risk students identified by the screen by the total number of students who are truly not at risk, for example, true negatives / (true negatives + false positives). In most screening procedures, practitioners are interested in identifying all or nearly all the students who are at risk while minimizing the overidentification of students who are not at risk. Thus, we examined cut scores that maximized sensitivity and specificity levels. Next, we created a 2 × 2 table based on these cut scores to determine the overall classification accuracy. These analyses were conducted separately for each grade level because in each case, the outcome being predicted was the relevant grade-level state math assessment.
Evaluating instructional placement and progress
In addition to identifying a benchmark for student performance, the teams were interested in determining whether performance on the Basic Skills algebra measures over time might provide useful feedback for instructional programming. Essentially, the staff wanted to determine whether the use of the Basic Skills algebra probes would be sensitive to student growth. That is, over time, would changes in student performance be detected by repeated measures, and if so, what type of growth might be expected? To collect initial data to answer this question, the junior high administered probes across 4-week intervals to all students. A rate of improvement (ROI) for each student was computed using the Tukey method (Lemons, Saenz, & Stecker, 2007). The median of the first set of probes was subtracted by the median of the last set of probes, and the result was divided by the total number of weeks elapsed between the first and last administration. A mean ROI and SD were computed by grade level. The process for computing ROI was similar at the high school, except that staff administered only one probe during each testing administration and decided on a schedule of every other week for subsequent administration. Following the Tukey method, scores were split into three groups, with two data points in the first group, one data point in the second group, and two data points in the third group. The median score of the first group was subtracted from the median score of the last group and the result was divided by the elapsed number of weeks between the first and last administration (in this case, nine). A mean ROI and SD were computed.
Finally, at the high school, ROI was examined by course placement. Tenth-grade students can take one of three math courses (Geometry, Applied Math, or Applied Algebra). Performance on the algebra probes and on ROI was compared by class placement through a MANOVA to determine whether there were differences in performance based on placement in math courses.
Results
Determining At-Risk Status
Descriptive statistics of the variables are reported in Table 2. Prior to conducting the logistic regression, correlation coefficients were calculated using the median of the first two probes in 7th and 8th grades, with the scale score on ISAT. The correlation for the junior high was .67 (p < .0001), and for the 10th graders, the correlation was .68 (p < .0001). The results of the logistic regression are presented in Table 3. For 7th and 8th grades, the median score of the first two Basic Skills algebra probes was a significant predictor of later performance on the state math assessment. In 7th grade, the classification accuracy improved from 68% with no predictors (i.e., assuming all students would pass) to 73%. In 8th grade, classification accuracy improved from 71% with no predictors to 82%. In 10th grade, performance on the first Basic Skills probe improved classification accuracy from 81% to 85%. Logistic regression provides an overall indication of a measure’s potential use as an effective screener, but it does not inform potential cut scores. In fact, the sensitivity levels reported in the logistic regression (which maximizes overall classification accuracy) are low—Too many students at risk of poor performance on the state math assessment would not be identified using the decision rules generated by the logistic regression analysis.
Means, Standard Deviations, and Correlations of Basic Skills Probes and ISAT Math Performance.
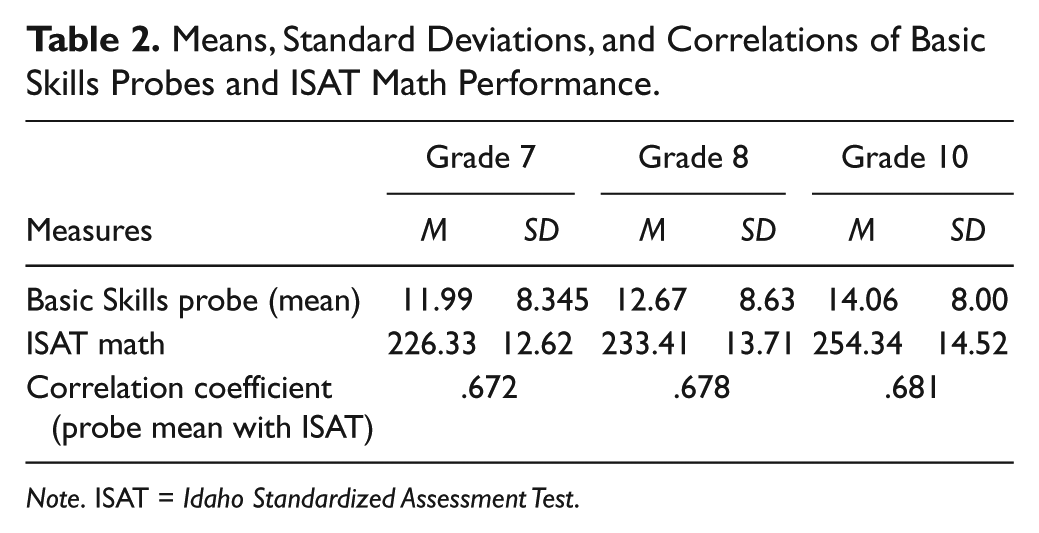
Note. ISAT = Idaho Standardized Assessment Test.
Results of Logistic Regression Analysis of Basic Skills Algebra Probe on Meeting Proficiency Standards.
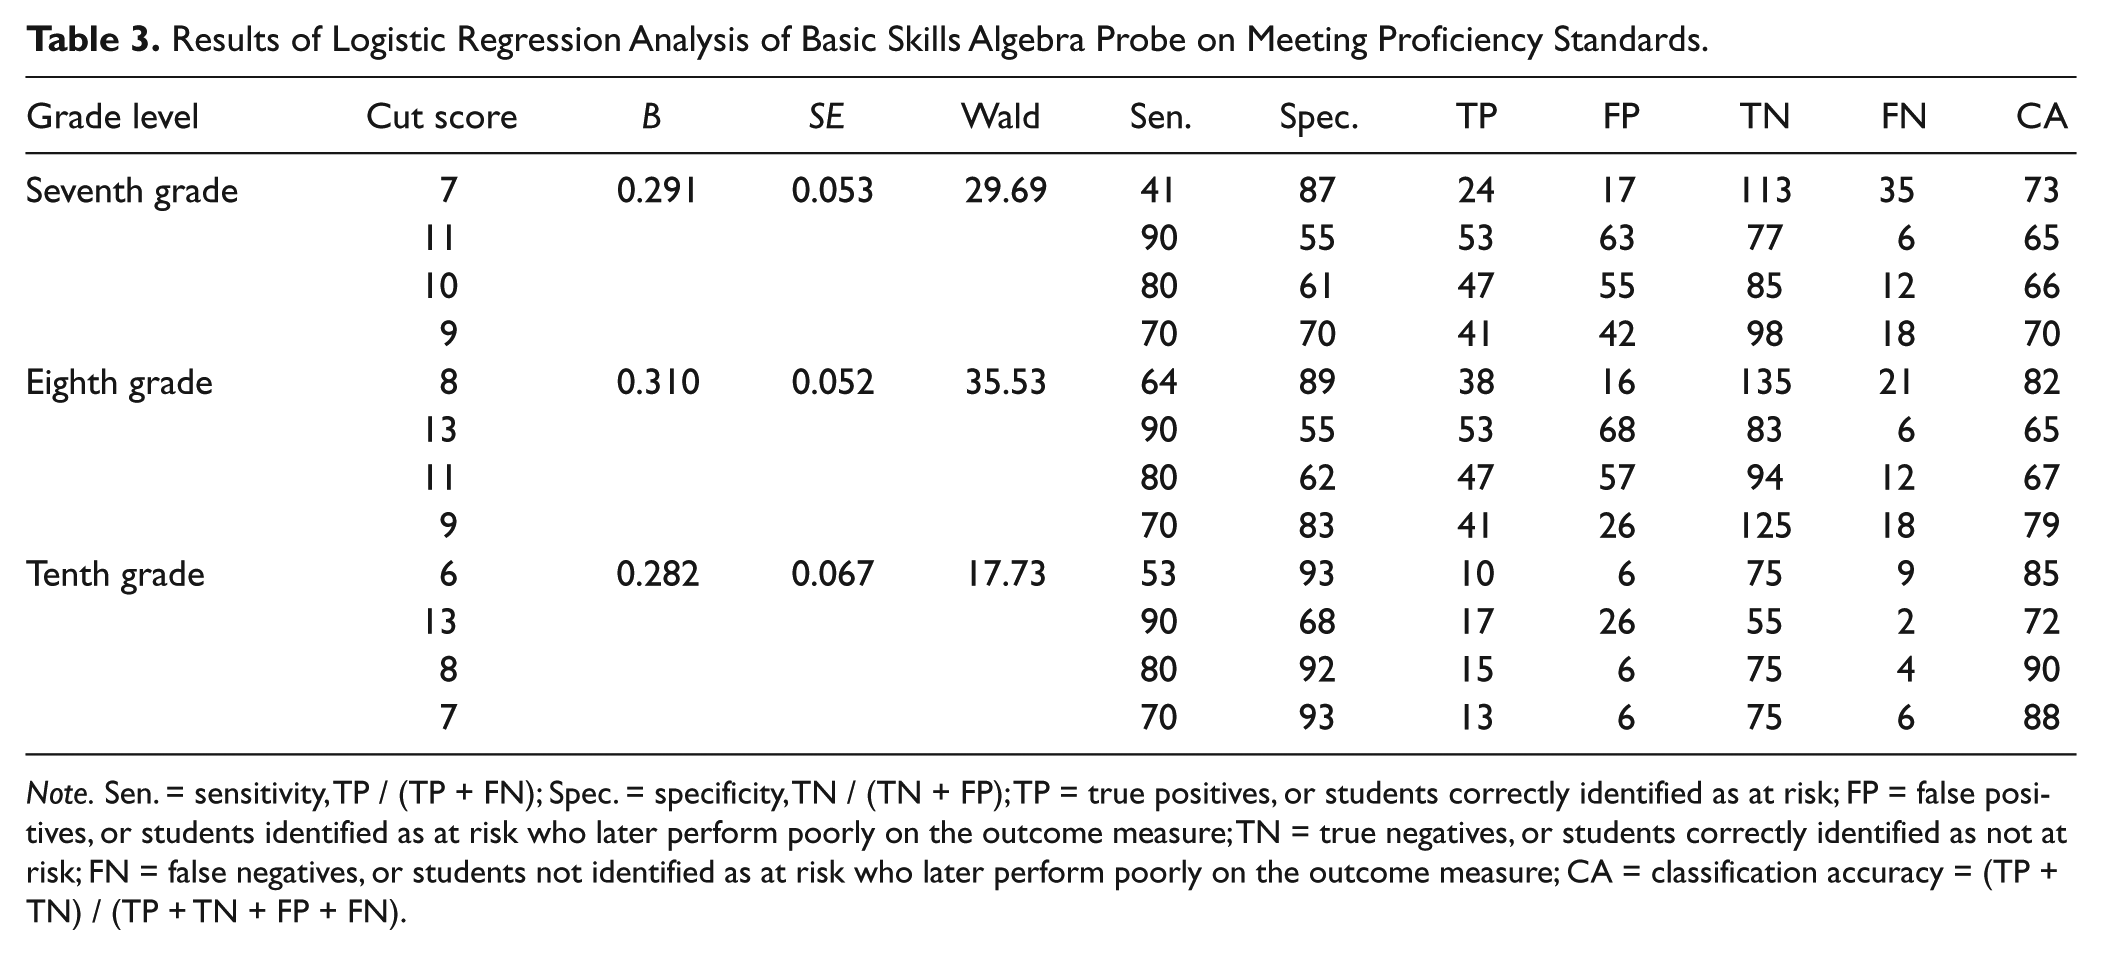
Note. Sen. = sensitivity, TP / (TP + FN); Spec. = specificity, TN / (TN + FP); TP = true positives, or students correctly identified as at risk; FP = false positives, or students identified as at risk who later perform poorly on the outcome measure; TN = true negatives, or students correctly identified as not at risk; FN = false negatives, or students not identified as at risk who later perform poorly on the outcome measure; CA = classification accuracy = (TP + TN) / (TP + TN + FP + FN).
To inform cut scores that would identify all or nearly all students at risk, a ROC analysis was conducted using ISAT pass/fail status as the test variable and for 7th and 8th grades, the median of the first two CBMs as the predictor. For 10th grade, the first algebra probe score was used as the predictor. Table 3 presents the results of the ROC analyses. For each grade, the cut score that would result in identifying 90% of the students at risk (sensitivity) was identified, and the corresponding number of students who would correctly be identified as not at risk (specificity) was calculated. This process was repeated for identifying 80% and then 70% of students at risk. For each level, the corresponding numbers of true positives, true negatives, false positives, and false negatives were computed. Classification accuracy was then calculated by adding the number of correctly categorized students divided by the total number of students.
For 7th grade, the highest level of classification accuracy was achieved with 70% sensitivity and 70% specificity levels. For the current group of 7th graders, that means 18 students who did not meet state performance standards would not have been identified as at risk based on their performance on the Basic Skills algebra probes, and therefore would not be considered to receive intervention or more intense instruction. For 8th grade, the results were similar, although higher levels of classification accuracy were achieved. When sensitivity levels were set at 70%, a corresponding 83% specificity level and 79% classification accuracy rate were achieved. Using the resulting cut score of nine for 8th grade, 18 students in this data set would not have been identified as at risk (false negative). The analysis for 10th grade resulted in the highest levels of accuracy, in part because they had the lowest percentage of students who did not meet proficiency levels on the state math assessment. Classification accuracy is affected by overall base rate (Wilson & Reichmuth, 1985), so these results should not be interpreted to mean that the algebra probes are more valid for identifying 10th graders at risk. When sensitivity was set at 80%, resulting specificity was 92%, with overall classification accuracy of 90% and a cut score of eight.
Evaluating Instructional Placements
The goal of using the Basic Skills algebra probes over several weeks was to determine if they might inform whether students were benefiting from the instructional placement. The mean ROI for 7th grade was 0.60 problems per week, with a SD of 0.89, and a range of growth from −1.40 to 4.10 problems correct. The descriptive statistics for students in 8th grade were similar, with a mean ROI of 0.53, SD of 0.90, and a range of growth from −2.50 to 3.20 problems per week. The mean ROI for 10th grade was low, 0.14, with a SD of 0.42 and a range of growth from −0.89 to 1.67. One sample t tests indicated that each of these mean ROIs differed significantly from 0 (p < .001 for all grade levels). These ROIs are consistent with those reported in other studies of the Basic Skills measures (range = −0.8–2.1, M = 0.5, SD = 0.48; Perkmen et al., 2006) and suggest that these measures may be useful in determining whether a student is benefiting from the instructional program. Additional steps for implementation at the junior high and high school involve the collection of more reliable benchmark data and subsequent calculations of ROI across an entire school year. CBM research in reading has suggested that stable growth estimates can be obtained through a less frequent monitoring schedule, so long as more than one measure is administered at each time period (Jenkins, Graff, & Miglioretti, 2009). Computing ROI through a more systematic process will provide the schools with more stable estimates, which can then be used to help evaluate individual student progress (e.g., Is this student’s progress similar to grade-level peers or is an instructional change warranted?).
Finally, to determine whether the instructional placements at the high school were supporting student growth in math, we conducted a MANOVA using course assignment as the grouping variable and algebra probe, ISAT, and ROI as the dependent variables (see Table 4). The full model was significant as assessed with Pillai’s Trace, F(2, 120) = 16.27, p < .001. Tests of between participants’ effects indicated that the groups differed on all three measures. Although size of the groups differed substantially, both Box’s test of equality of covariance matrices and Levene’s test of equality of variance were nonsignificant. Follow-up Tukey comparisons indicated that on all measures, students in Geometry outperformed students in Applied Algebra or Applied Math. Students in Applied Algebra scored higher than students in Applied Math on the state math assessment, but otherwise the two groups performed similarly on the remaining measures. Of greatest concern was that the students in Applied Math and Applied Algebra had mean ROIs that were negative. Although more data are needed, it appears that these courses may not be supporting student growth in algebra, although negative growth might also reflect a lack of the measures’ sensitivity to growth or regression to the mean. Next steps at the high school include the continued collection of data to cross-validate these findings as well as a careful review of the instructional programs in these classes to determine whether changes in curriculum and/or instruction might be needed to better support student learning needs.
Means, Standard Deviations, and MANOVA for Effects of Course Placement on CBM Probe Score, Rate of Improvement, and State Math Assessment.
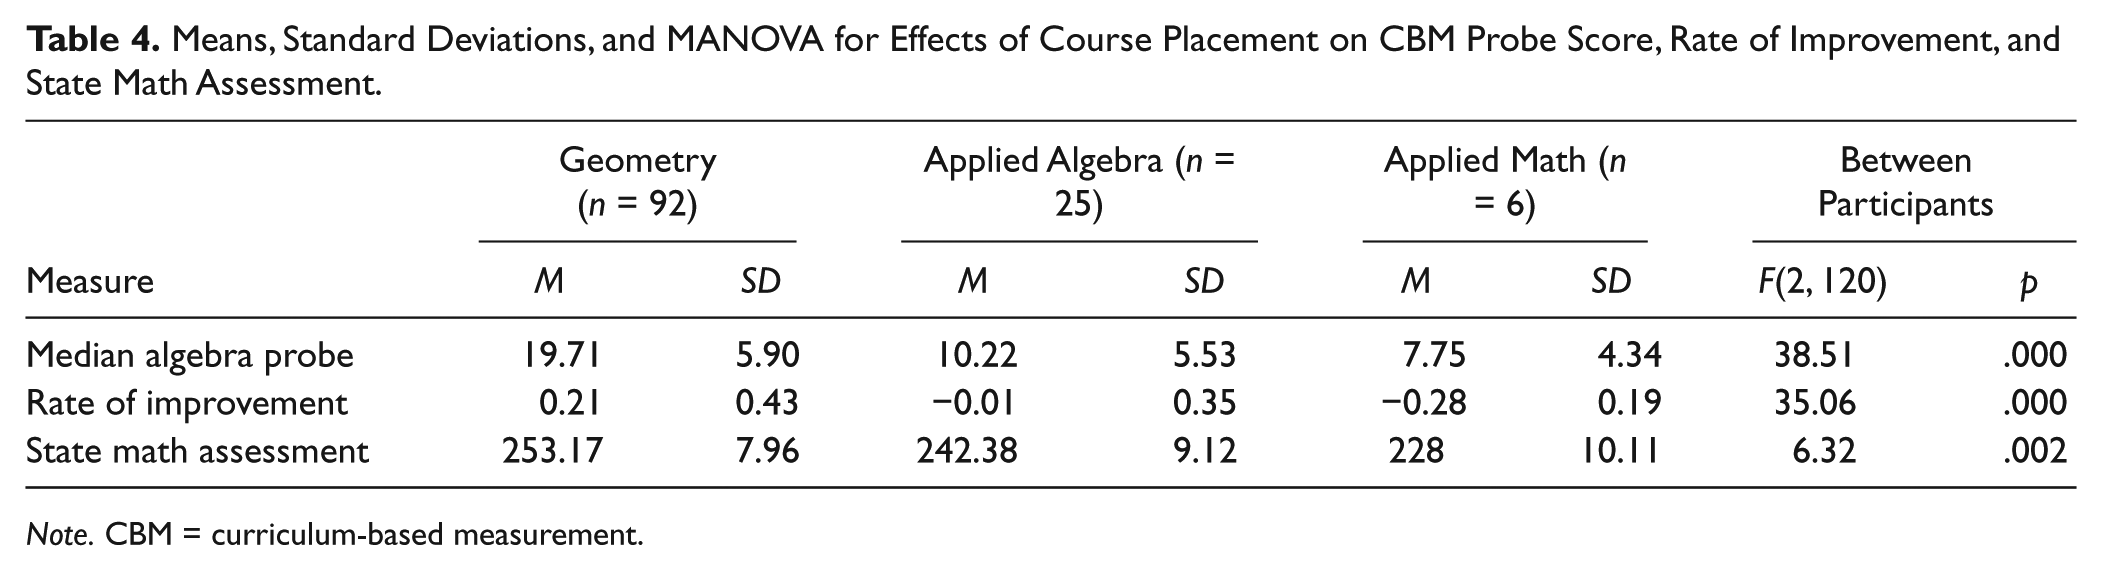
Note. CBM = curriculum-based measurement.
Discussion
The schools participating in this study were interested in finding measures that reliably identify students at risk of poor outcomes and that could be useful in providing formative feedback about student progress within the instructional program. To make comparisons and school-level decisions, measures should be standardized to support reliable decision making about student performance and subsequent instructional planning. In the absence of measures with a compelling research base to support their use in this capacity, the schools were willing to participate in a process of data collection, analysis, and evaluation that included the following steps: (a) collect data on student performance on the CBMs and the state math assessment, (b) administer the CBMs over regular intervals to students, and (c) analyze results to make initial decisions about cut points and progress monitoring.
In general, the results obtained through this process were very consistent with results reported in the research base produced by Foegen and colleagues (Foegen et al., 2006; Perkmen et al., 2006). The use of the Basic Skills algebra probes improved classification accuracy across junior high and high school grades, which can facilitate the design and implementation of a more effective intervention program for students who are struggling in algebra. Improving the school’s ability to accurately identify students in need of targeted intervention can lead to more students successfully meeting increased demands in mathematics and specifically algebra performance at the secondary levels. Interestingly, the correlation of the Basic Skills algebra probe to the ISAT math assessment was consistent with correlations to the Iowa Algebra Aptitude Test (IAAT) but higher than correlates with grades as reported by Foegen and colleagues.
In addition to the promising results for its use as a screening tool, the Basic Skills probe ROIs achieved in this sample are consistent with those reported in previous research (Foegen et al., 2005, 2006; Perkmen et al., 2006). Given the depth of the research base supporting the use of progress-monitoring tools to improve student outcomes, it appears that the Basic Skills algebra probe may be helpful in expanding this process to secondary algebra. A more specific application of the potential use of these probes for progress monitoring is seen through the 10th-grade analyses reported; students in Applied Mathematics courses showed a negative ROI. This information is helpful for schools—If the goal is to improve student performance in algebra, then instructional programs need to support student development in this area.
The procedures outlined in this article represent the initial step in developing procedures for using algebra CBMs for screening and progress-monitoring tools. Potential next steps in this process at the junior high will be to administer these measures in the fall to all students. Students who score below nine in the junior high on the Basic Skills algebra probe will have their progress monitored using the Basic Skills probes on a biweekly basis. Students who do not make progress on the measures will then be further assessed to determine whether they require more individualized instruction to support their needs. At the high school, the same process will be followed, except that students who score below seven on the Basic Skills probe will be monitored. Benchmark probes in fall, winter, and spring will be administered so that norms for each time period can be developed.
Limitations
This article reports the findings of two secondary schools’ attempt to implement progress-monitoring tools in algebra in ways that might facilitate their decision making regarding placement decisions and instructional programs. The sample in this study reflects a convenience sample from two schools in the Pacific Northwest, with each grade level coming from one school only, and therefore limits generalizability of the results. Classification studies and determining recommendations for cut points require cross-validation across multiple samples. In addition, our analysis of rates of improvement are based on student performance without any intentional focus on instruction. Nevertheless, the methods described in this study may be useful for other schools that face similar challenges.
Conclusion
The confluence of educational initiatives in math instruction, data-based decision making, and tiered service delivery provides secondary schools the unique opportunity to bring their resources to bear on improving the quality of instructional programming in math. This opportunity will be realized only to the extent that schools are provided with the resources to do so. In the absence of such resources, schools should consider engaging in practices such as those described in this article to make informed decisions regarding instructional programming for their students.
In this article, we outlined the processes for data collection and analysis using existing CBMs in algebra to identify students at risk of poor outcomes and to monitor progress within the instructional program to determine whether students are benefiting. Our results indicate that the Basic Skills algebra probe may provide a useful means of benchmarking and monitoring student progress in math. Continued implementation of these measures to evaluate student progress will support the schools’ ability to improve instruction in math for their students.
Footnotes
Declaration of Conflicting Interests
The author(s) declared no potential conflicts of interest with respect to the research, authorship, and/or publication of this article.
Funding
The author(s) disclosed receipt of the following financial support for the research, authorship, and/or publication of this article: This study was supported by Idaho State Department of Education Grant No. 6FT84XXXX0020.