
Abstract
Language skills developed during preschool contribute strongly to later reading and academic achievement. Effective preschool assessment and intervention should focus on core components of language development, specifically oral language skills. The Early Language and Literacy Individual Growth and Development Indicators (IGDIs) are a set of measures that have demonstrated utility in language and early literacy assessment, evaluation, and intervention studies. The purpose of this article is to describe two studies conducted to build on the existing oral language IGDI, Picture Naming, to increase utility for instructional decision making, particularly within an early childhood Response to Intervention framework. Study 1 outlines the initial development and piloting of potential measures and Study 2 describes the revision and continued analysis of the most promising measures. Results of Study 1 and Study 2 indicate that Picture Naming has continued utility as a measure of oral language skill development and that one newly developed oral language IGDI, Definitional Vocabulary, has potential utility.
Reading ability begins in preschool. This does not suggest preschoolers should be reading chapter books to themselves; rather, the skills acquired during the preschool years are essential for successful acquisition of reading and related skills in elementary school. In turn, these skills contribute to overall reading proficiency in primary and later grades. To ensure that children are on a trajectory to be proficient readers, we need to identify, efficiently and validly, children at risk of later reading difficulties so we can provide effective and immediate early language and literacy intervention.
Of the skills developed in preschool, oral language development is one of the most critical influencers of later reading achievement. Indeed, a child’s vocabulary at school entry is a powerful predictor of later literacy and reading outcomes (Dickinson & Tabors, 2001; Poe, Burchinal, & Roberts, 2004; Roth, Speece, & Cooper, 2002; Snow, Porche, Tabors, & Harris, 2007). Language development in preschool sets the foundation for reading achievement in elementary school (Dickinson & Porche, 2011; Juel, 2006) and middle school (NICHD [National Institute of Child Health and Human Development] Early Child Care Research Network, 2005; Storch & Whitehurst, 2002; Walker & Greenwood, 1994).
When focused on the outcome of eventual reading achievement, children’s oral language development is particularly important to consider due to its demonstrated effect on early and later reading competencies, and the documented duration of its effects on reading comprehension (Dickinson, Golinkoff, & Hirsh-Pasek, 2010). In addition, a child’s existing vocabulary knowledge can predict his or her ability to learn new vocabulary, comprehend language, and access verbal information (Fernald, Perfors, & Marchman, 2006; Marchman & Fernald, 2008), all strong predictors of later reading. Through direct and indirect pathways, oral language development seems to have a key role in early literacy and later reading development (Dickinson, McCabe, Anastasopoulos, Peisner-Feinberg, & Poe, 2003; Fernald & Weisleder, 2011; Scarborough, 2001; Vernon-Feagans, Hammer, Miccio, & Manlove, 2002).
What Is Oral Language?
Oral language is the ability to use words to communicate ideas and thoughts and to use language as a tool to communicate to others (Dunst, Trivette, Masiello, Roper, & Robyak, 2006; Roskos, Tabors, & Lenhart, 2004). Within the broader category of oral language, expressive language is the use of words to express meaning, and receptive language is the ability to listen, process, and understand the meaning of spoken words (Morgan & Meier, 2008). Because oral language skills are a key predictor of later reading outcomes (Dunst, Trivette, & Hamby, 2007; Hart & Risley, 1995; National Early Literacy Panel, 2008; Storch & Whitehurst, 2002; Walker & Greenwood, 1994), it makes sense to focus preschool assessment and instruction on this domain. Specifically, preschool children’s performance on oral language tasks serves as a reliable indicator of their development toward acquiring conventional literacy skills.
To this end, a number of standardized, norm-referenced assessments exist for assessing oral language development in young children, such as the Peabody Picture Vocabulary Test, Fourth Edition (PPVT-4; Dunn & Dunn, 2007), and the Preschool Language Scale, Fourth Edition (PLS-4; Zimmerman, Steiner, & Pond, 2002). These measures provide point-in-time descriptions of preschoolers’ oral language skills but are limited in their ability to (a) identify children who need more intensive levels of intervention or (b) monitor children’s progress in oral language development. To assist all children in becoming proficient readers later in life, a robust framework must guide the assessment of and intervention for all aspects of early literacy development, specifically oral language development.
Response to Intervention (RtI)
RtI holds promise as this framework. RtI is, generally, a set of procedures for identifying children failing to make expected progress and for allocating resources to provide increasingly intensive intervention to create conditions where individual children succeed (Vaughn & Fuchs, 2003). In concept and practice, RtI models include multiple tiers of increasingly intense student interventions, often referred to as multitiered systems of support (Greenwood et al., 2011; Johnson, Mellard, Fuchs, & McKnight, 2006; Mellard, McKnight, & Jordan, 2010). To identify children who would benefit from more intense levels of instruction, regular screening of all children is required, with more intensive monitoring of progress conducted with children as their levels of support increase (Fuchs & Fuchs, 2007; McConnell & Missall, 2008). To implement effective early identification and intervention practices that promote long-term language and literacy success, teachers need psychometrically sound and logistically feasible procedures to assess child language and literacy development to pinpoint those at risk of future difficulty (McConnell & Missall, 2008; Phaneuf & Silberglitt, 2003). Conceptual reviews (Greenwood et al., 2008; McConnell & Greenwood, 2013; McConnell & Missall, 2008) make clear that efficient and effective identification and treatment of children at risk of later reading difficulties is central to early intervention.
The Early Language and Literacy Individual Growth and Development Indicators (IGDIs) are a set of measures with demonstrated utility in language and early literacy assessment, evaluation, and intervention studies (Cadigan & Missall, 2007; Greenwood et al., 2008; Hojnoski & Missall, 2006, 2007; McConnell & Missall, 2008; K. N. Missall, Carta, McConnell, Walker, & Greenwood, 2008; K. N. Missall, McConnell, & Cadigan, 2006). The IGDIs are a form of General Outcomes Measurement (GOM; Fuchs & Deno, 1991), and as such demonstrate the hallmark characteristics of GOMs: brief, easy-to-administer and interpret, related to long-term goals, reliable, valid, inexpensive, and sensitive to growth over time (Deno, 1997; Fuchs & Deno, 1991).
When the IGDIs were originally developed, the goal of one measure—Picture Naming (PN)—was to capture young children’s oral language development. Across studies, PN has demonstrated strong correlations with criterion measures of the oral language domain, with correlations ranging from .56 to .75 with the PPVT and from .63 to .79 with the PLS (Priest, McConnell, McEvoy, & Shin, 2000). PN has also demonstrated adequate test−retest reliability (r = .67) and has been shown to be sensitive to differences due to chronological age, with correlation coefficients ranging from .41 to .60 (McConnell, Priest, Davis, & McEvoy, 2002); children’s performance on PN has been a valid predictor of reading performance through the end of first grade (K. Missall et al., 2007).
Although the original version of PN (from here on referred to as PN 1.0) demonstrated adequate psychometric properties and has been shown to have high feasibility and utility (McConnell, Missall, Rodriguez, & Wackerle-Hollman, 2010), some flaws in its design limit its use in instructional decision-making contexts. The most obvious design flaw is with the images used to represent common objects during item construction. The images used to create PN 1.0 items came from a clip art image set from the early 1990s. Now many of the images are outdated and demonstrate such poor quality that it is difficult to determine what the image represents. A substantive flaw is that the standardized administration instructions for PN 1.0 specify that the entire set of items (100) needs shuffling before each administration, thus producing varied item sets with uncontrolled and variable difficulty levels. As such, PN 1.0 presents larger-than-desired standard errors within and across individuals, and relies on a large, somewhat variable array of items. We determined it was necessary to evaluate more tightly and work to control item and test variance to assess individual children’s current and over-time language performance more closely.
Furthermore, the PN 1.0 assessment captured performance of only one aspect of oral language development: expressive vocabulary. Although the PN 1.0 task had been shown to be a strong indicator of overall development of the construct of oral language, it was determined that any test development efforts should be dedicated to examining the oral language construct more fully through a rigorous test development process, to ensure that the IGDI 2.0 cadre would consist of the most robust indicator-level measures of the domain of oral language development.
To this end, and through support of the Center for Response to Intervention in Early Childhood (CRTIEC; see Greenwood et al., 2011), our research team adopted Wilson’s (2005) test development model, which is based on four building blocks, including the construct map, item design, outcome space, and measurement model. As a starting point, the construct map defines the construct and its form. Thus, to develop a construct map for the oral language construct, a literature review process was initiated to identify an operational definition of the domain. Because we were interested in how the field was currently conceptualizing oral language, we limited our review to the current year and the 2 years immediately preceding.
General review methods included the following criteria: Articles were in peer-reviewed journals, written between 2006 and 2008, had a target sample of children ages 3 to 6 years, and used English as the primary language. The review excluded articles in which samples consisted primarily of children with special needs. Keywords in the search were oral language, vocabulary, expressive language, and receptive language. Databases were Academic Search Premier, EBSCO Host, and PsycINFO. We selected four articles based on the review criteria previously described. The articles varied in their precise definition of oral language, but common elements emerged, including a distinction between expressive language and receptive language and a distinction between vocabulary and grammar (Coyne, McCoach, & Kapp, 2007; Mol, Bus, De Jong, & Smeets, 2008; Morgan & Meier, 2008).
Synthesis of the articles revealed that one might best define oral language as the ability to use words to communicate ideas and thoughts and to use language as a tool to communicate to others (Dunst et al., 2006; Roskos et al., 2004).
With the construct defined, it was next necessary to define the form. In doing this, it was important to consider construct relevant tasks or behaviors that are observable, measurable, and appropriate for preschoolers: brief, engaging, and within a preschooler’s ability. Moreover, to ensure that the newly developed measure(s) would have high utility within an Early Childhood (EC) RtI model, the form should be easy to administer, score, and interpret; standardized; repeatable; and related to important long-term outcomes. With these criteria in hand, we conducted a second literature review to examine how other test developers had specified these constructs and then compare those forms against our own development criteria to inform development of a fully specified map of the construct.
A review of current oral language measures yielded 11 measures targeting tasks associated with oral language, specifically expressive and receptive language: The Test of Preschool Early Literacy (TOPEL; Lonigan, Wagner, Torgesen, & Rashotte, 2007); Hundred Pictures Naming Test (Fisher & Glenister, 1997); IGDIs 1.0 (Early Childhood Research Institute on Measuring Growth and Development, 1998); Clinical Evaluation of Language Fundamentals–Preschool, Second Edition (CELF-Preschool 2; Wiig, Secord, & Semel, 1992); Receptive One-Word Picture Vocabulary Test (ROWPVT; Gardner, 2000); Expressive One-Word Picture Vocabulary Test, Third Edition (EOWPVT-3; Gardner, 2000); PPVT-4 (Dunn & Dunn, 2007), PLS-4 (Zimmerman et al., 2002); Oral Written and Language Scales (Carrow-Woolfolk, 1999); Test of Language Development–Primary, Third Edition (TOLD-P:3; Hammill & Newcomer, 1997); and Preschool Comprehensive Test of Phonological and Print Processing (Pre-CTOPP; Lonigan, Wagner, Torgesen, & Rashotte, 2002).
Analysis of the specific skills assessed across these 11 measures demonstrated that 8 of the 11 measures focused on children’s vocabulary knowledge skills (either receptive or expressive), thus highlighting vocabulary knowledge as a central aspect of oral language development that meets Wilson’s specified criteria for defining the form of the construct. Vocabulary knowledge ability can be captured in a number of ways, including formats that tap receptive and expressive vocabulary. As such, five different potential test formats focused on preschooler’s expressive and receptive vocabulary knowledge and use. The “Method” section of this article will further specify these measures.
We identified Picture Naming 2.0 as a potential measure of expressive language. Potential receptive language tasks included Point-to-Picture (PtP), Motor Instructions (MI), Which One Doesn’t Belong (WODB), and Definitional Vocabulary With Pictures (DVwP) and Without Pictures (DVw/oP). These task formats were similar to task formats contained within the reviewed assessments.
Having identified specific forms of the construct, we moved to item design. The first next step was to ensure that test items would be a lexical match for preschoolers’ ability, and to this end, we used four resources.
First, words that appeared on existing lists of oral language and vocabulary: The Lexical Development Norms for Young Children (MacArthur-Bates Communicative Inventory; Dale & Fenson, 1996), The Social World of Children: Learning to Talk (Hart & Risley, 1999) and the Kindergarten List from Words worth Teaching (Biemiller, 2009) entered a pool of potential word candidates. Words that appeared on all three lists became the ultimate list, to ensure the words were likely to be in a preschooler’s vocabulary.
Second, a review of eight published, frequently used preschool curricula yielded a list of target words presented during the prekindergarten year. Cross-referencing the candidate words with the existing published word lists yielded a composite list of words represented in common vocabulary assessments and word lists, and within widely published and accepted curricula. We applied these words in each measure developed for testing.
The above steps describe our movement through Wilson’s first two building blocks, construct map, and item design. Outcome space was simple to define, as right and wrong answers are clear, given the construct of the measures. To complete the test development process, the two studies discussed below describe a two-phase approach to measure testing and validation using two successive measurement models: a Classical Test Theory approach and the Rasch Model.
General Purpose
The overall purpose of the work described here was to conduct careful evaluation and make systematic improvements to the cadre of IGDIs that might be used to measure oral language development. The research proceeded in two phases; we will discuss each separately. Study 1 outlines the initial development and piloting of newly designed potential measures of oral language, with a focus on examining the psychometric and practical properties of these potential measures to determine which measures warranted further research and development. Study 2 describes revision and continued analysis of the most promising measures, with analysis of measure performance in a larger sample, and with analysis conducted more formally.
Study 1
The aim of Study 1 was to pilot test the cadre of potential IGDIs of the oral language domain, with the intended outcome of determining which measures warranted further development and larger scale field-testing. Thus, the purpose of Study 1 was to examine the psychometric properties of newly designed oral language IGDIs by answering these questions:
To what extent do new IGDIs demonstrate characteristics of General Outcome Measures (GOMs)?
To what extent do new measures relate to one another?
What is the criterion validity of the new measures?
How do the new IGDIs perform at the item level?
Method
Participants and setting
Study 1 participants were 55 children ranging in age from 36 to 71 months, recruited from two child care centers in and around a Midwestern metropolitan area. They included 18 three-year-olds (36−47 months), 20 four-year-olds (48−59 months), and 17 five-year-olds (60−71 months), and included 25 females and 30 males. Because this was a pilot test of newly designed measures, we collected no other demographic information on Study 1 participants.
Measures
PN
During PN, researchers presented the children with pictures of objects and asked them to name the pictures as quickly as possible. They received one picture (item) at a time on 8.5- × 5.5-inch cards, with items administered in a set order. At the beginning of assessment, the administrator read standardized directions to the child and modeled the task by showing the participant four example cards and naming them. The administrator then asked the participant to name the same four sample cards and provided corrective feedback, if needed. If the child correctly named the four sample cards, the examiner said, “Look at the cards and name these pictures,” and began timing for 1 min. The score on PN was the number of cards correctly labeled in 1 min.
DV
DV had two different formats: one with pictures (DVwP) and one without (DVw/oP). During DVwP, the child looked at a picture and answered a question that referenced a characteristic or use for the pictured item (e.g., “This is the sun. Is the sun HOT or is the sun COLD?”). The children viewed one picture (item) at a time on 8.5- × 5.5-inch cards, with items administered in a set order. Each item had a different picture and therefore a different question associated with it. Before administering items, the administrator provided the standardized prompt, “I am going to show you some pictures, and I want you to answer a question about each picture.” Before beginning timed administration, participants received two sample cards with corrective feedback. If the child correctly answered the questions for the two sample cards, the measure lasted for 1 min. If a child answered one or more of the sample cards incorrectly, administration stopped. The score on DVwP was the number of questions answered correctly in 1 min.
To determine if the visual cue included in the DVwP was a necessary component of item construction, we used the second version of the task, DVw/oP. The purpose of this test was to assess the same construct as DVwP but with no visual cue (e.g., “Is a baby young or old?”) and in which the children received each item verbally only. The administrators gave standardized administration directions to the participants, “I am going to ask you some questions that I want you to answer.” Before timed administration began, the children received two sample items with corrective feedback. If a child correctly answered the questions from the two sample cards, the measure continued for 1 min. If a child answered one or more of the sample cards incorrectly, administration stopped. The score on DVw/oP was the number of questions answered correctly in 1 min.
PtP
During PtP, a child received a card with three pictures on it. Then, the administrator asked the child to point to a picture that represented the word the administrator said. The 8.5- × 5.5-inch cards (items) were in a set order. The administrator read standardized administration directions to the participant, “Find the one that I say.” Before beginning timed administration, participants saw two example items, in which the administrator modeled the task. The child then completed four practice items, two with corrective feedback, and two without feedback. If the child correctly answered two of the four practice trials, the measure continued for 1 min. The score on PtP was the number of pictures correctly identified in 1 min.
MI
During MI, the child’s task was to perform simple motor tasks with instructions presented verbally. The administrator read the standardized administration directions to the participant, “Do the action that I say.” Each item was a different motor action. For example, the administrator would say, “Jump” or “Clap your hands.” The administrator modeled the task before beginning the test. The child then completed two practice trials with corrective feedback. If the child correctly performed the two trials, the administrator continued the test for 1 min. The score on MI was the number of actions correctly performed in 1 min.
WODB
During WODB, the child received a card (item) containing three pictures. The task was to identify one picture “different” from the other two as a function of high-level classification (e.g., sun, moon, and car). The administrator read standardized administration directions to the participant: “We’re going to look at some pictures and find the one that doesn’t belong with the others.” The administrator labeled each of the pictures on each card. Before beginning timed administration, participants saw an example item, and the administrator modeled the task. The child then completed four practice items, two with corrective feedback, and two without. If the child correctly answered two of the four practice items, the administrator continued the measure for 2 min. During timed administration, items appeared in a set order. The score on WODB was the number of items answered correctly in 2 min.
PPVT-4
The PPVT-4 (Dunn & Dunn, 2007) is an individually administered, norm-referenced test of oral language development. It produces standard scores with a mean of 100 and a standard deviation of 15. It is a technically adequate measure of oral language, with normative data from 3,500 children yielding reliability and validity coefficients in the .90 range. For the test, the administrator orally presented a stimulus word along with a set of four pictures and asked the child to select the picture that best represented the word’s meaning. Administrators used the PPVT-4 protocol to determine the child’s raw score. The PPVT-4 was administered here as a criterion measure for receptive language.
PLS-4
The PLS-4 (Zimmerman et al., 2002) is an individually administered, norm-referenced test of overall language development, with three subtests and a total scale score. The PLS-4 produces standard scores with a mean of 100 and a standard deviation of 15. It is a technically adequate measure of oral language, with normative data from 1.534 children yielding reliability and validity coefficients ranging from .67 to .95. For this test, the administrators presented the child with a variety of tasks, using a picture book, actual objects, and verbal instructions to assess the child’s ability to communicate verbally. They used the PLS-4 protocol to determine the child’s raw score, administering PLS-4 as a criterion measure for expressive language.
Procedures
Tests administrators were graduate students who had successfully completed a series of training activities on standardized administration and who demonstrated accurate fidelity of administration (at least 90% accuracy on fidelity check process). They provided all IGDI measures one-on-one with each participant. They administered each measure, with the exception of DV, to 55 children: 27 children received DVwP and 28 received DVw/oP. Half of the sample received each version to determine which version of the measure worked best.
All assessments (IGDIs, PPVT-4, and PLS-4) took place either in an empty room within the child care center or on the floor in the hallway directly adjacent to that room. The researchers assumed it would be difficult for a child to participate in all the assessments at once, so to reduce the burden, they conducted the assessments during two separate 15- to 20-min sessions. After each assessment session, the child could select a small toy from a prize box.
Results
Descriptive statistics
Table 1 shows the mean, standard deviation, median, range, skew, kurtosis, and percentage of zero scores for each IGDI measure included in Study 1. Five of six IGDIs had standard deviations less than half the observed sample mean, and distributions for four of the six measures demonstrated acceptable levels of skew and kurtosis (PtP and MI did not). Other than with WODB, only a small fraction of participants failed to respond correctly to a single item.
Study 1: Means, Standard Deviations, Medians, Ranges, Skew, Kurtosis, and Percentage of Zero Scores for Each Measure.
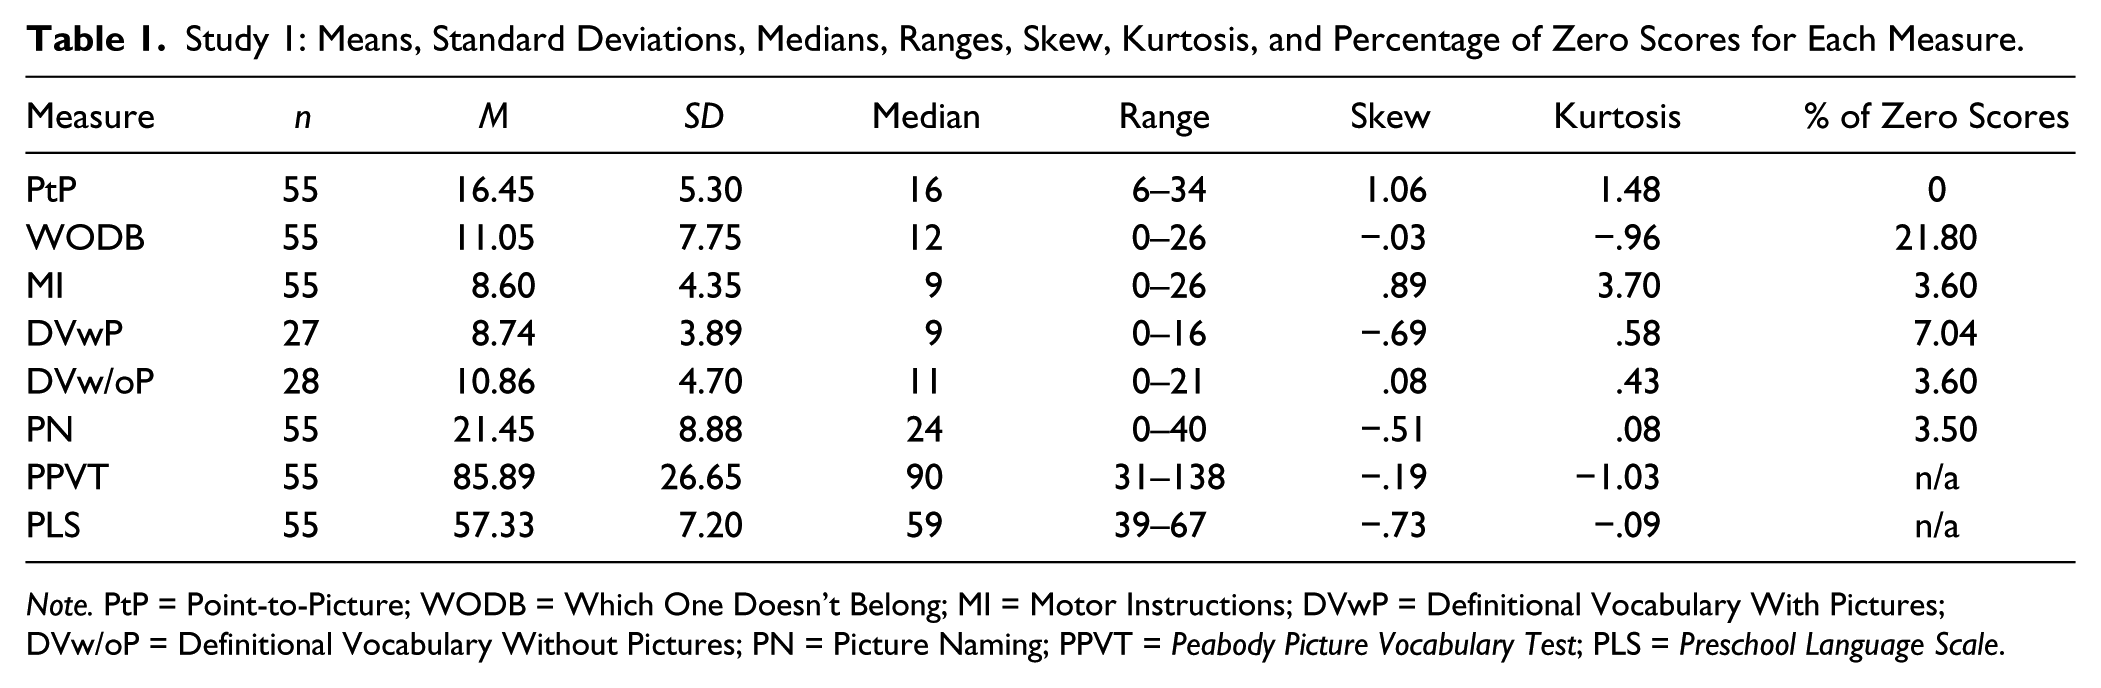
Note. PtP = Point-to-Picture; WODB = Which One Doesn’t Belong; MI = Motor Instructions; DVwP = Definitional Vocabulary With Pictures; DVw/oP = Definitional Vocabulary Without Pictures; PN = Picture Naming; PPVT = Peabody Picture Vocabulary Test; PLS = Preschool Language Scale.
Relation among measures
Table 2 shows correlations between each measure included in Study 1, including criterion measures. The highest correlation obtained was between DVwP and PtP (.73) and the lowest correlation was between MI and PtP (.06). Criterion validity correlation coefficients ranged from .32 to .70 with the PPVT-4 and .24 to .79 with the PLS-4. In general, the correlation between the IGDI measures and criterion measures was significant.
Study 1: Correlations Between Each Measure.
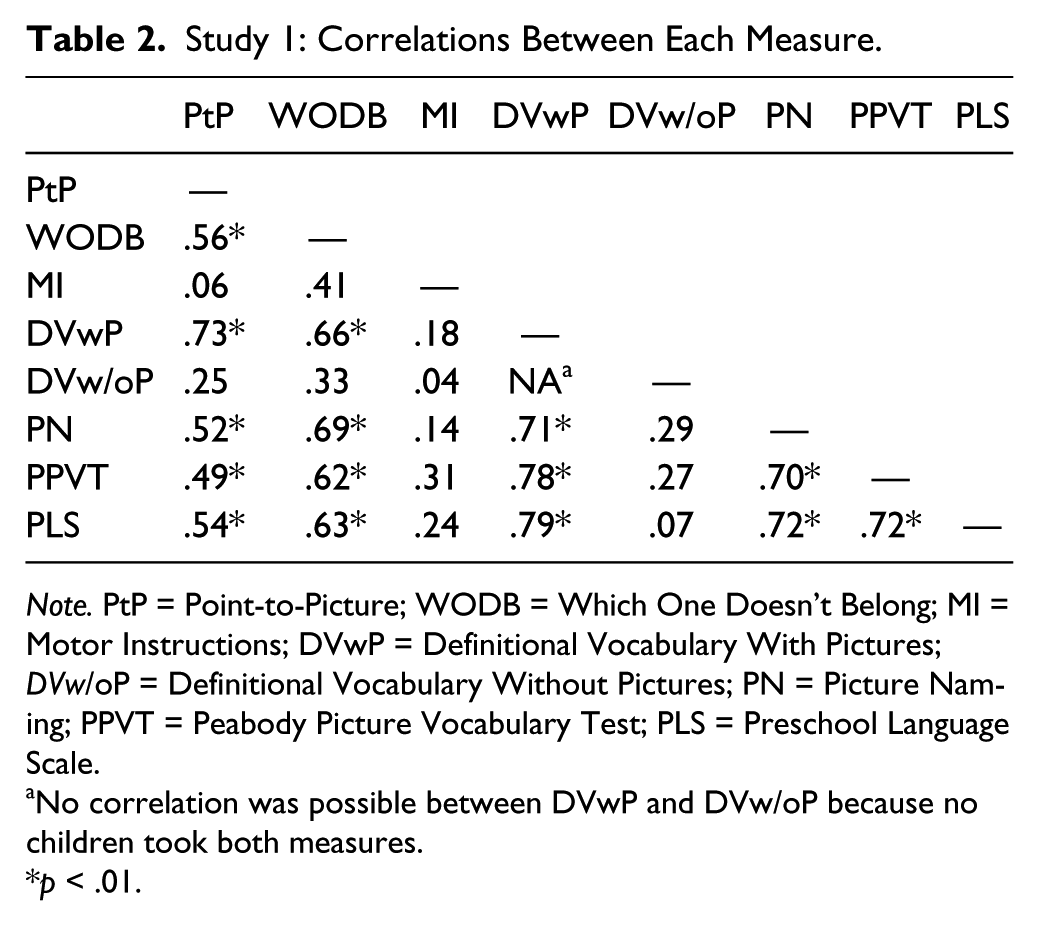
Note. PtP = Point-to-Picture; WODB = Which One Doesn’t Belong; MI = Motor Instructions; DVwP = Definitional Vocabulary With Pictures; DVw/oP = Definitional Vocabulary Without Pictures; PN = Picture Naming; PPVT = Peabody Picture Vocabulary Test; PLS = Preschool Language Scale.
No correlation was possible between DVwP and DVw/oP because no children took both measures.
p < .01.
Item-level performance
Table 3 outlines the mean number of responses per item in each measure, the range of item means, the percentage of items with means between .2 and .8, the range of item-total correlations, and the percentage of items with item-total correlations greater than .2.
Study 1: Item-Level Statistics.
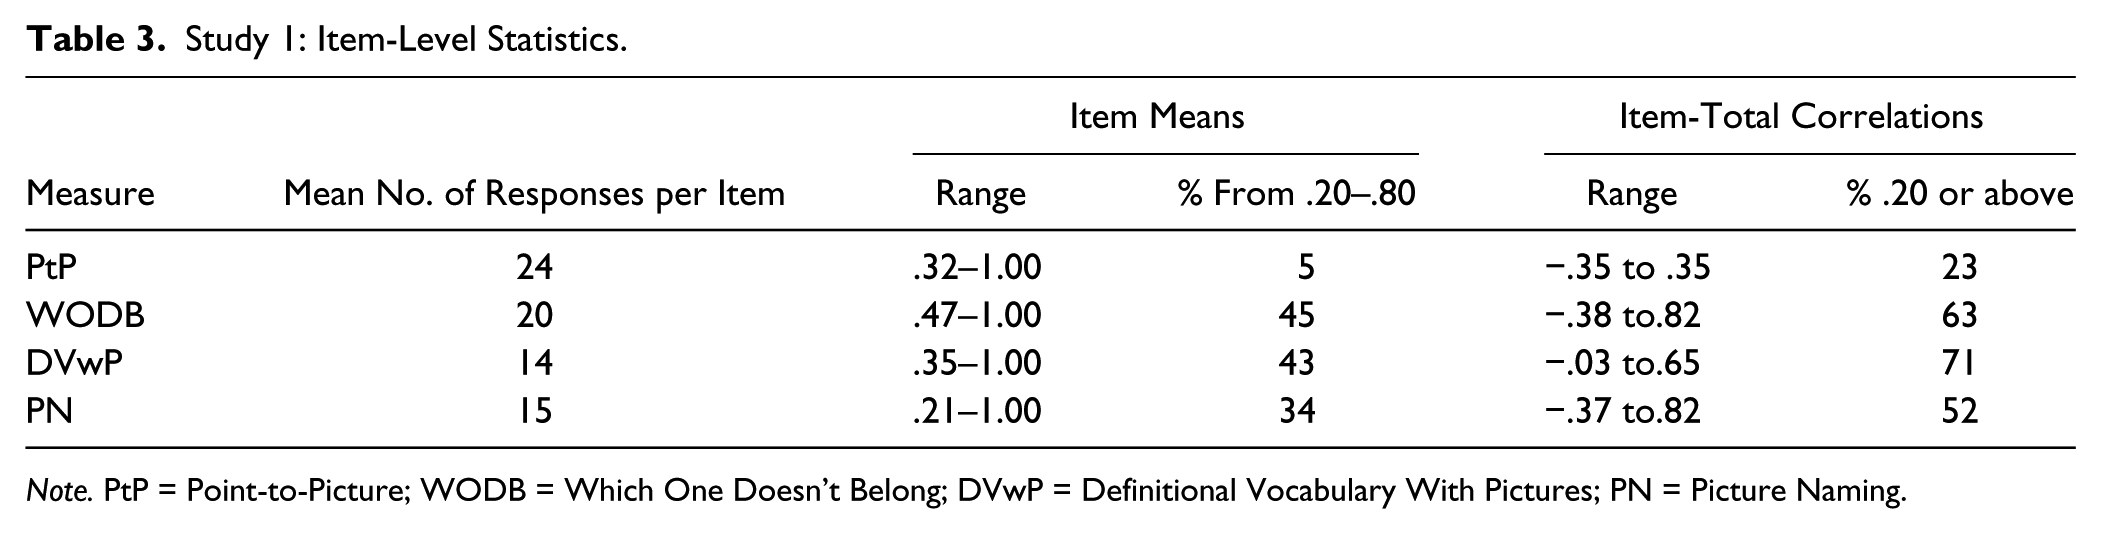
Note. PtP = Point-to-Picture; WODB = Which One Doesn’t Belong; DVwP = Definitional Vocabulary With Pictures; PN = Picture Naming.
Discussion
Study 1 was a small-scale field test conducted to gather preliminary information to determine which of the newly developed cadre of oral language IGDIs were the best candidates to subject to further development and a larger scale field trial. To make this determination, we compared each measure’s descriptive statistics against essential criteria of GOMs, examined intermeasure correlations and concurrent criterion validity relations, and explored item-level functioning. We then compiled and analyzed this information to determine which measures we would move forward to Study 2.
Essential GOM criteria and psychometric standards
When developing GOMs, there are essential criteria to consider when evaluating the relative rigor and utility of the measure. To be as useful as a GOM, a measure should be quick and easy to administer (Fuchs & Deno, 1991). The longest oral language IGDI lasted for only 2 min and test administrators reported each measure was easy to administer.
In addition to these utility criteria, any newly developed GOM should meet certain psychometric standards (McMaster & Espin, 2007). It is particularly important to examine the normality of the distribution of scores the measure produces, as a normal score distribution increases the certainty that the measure can distinguish between children with higher ability and lower ability in the construct. To evaluate the shape of a measure’s score distribution, we considered the relation between sample mean and standard deviation as well as skew and kurtosis. Measures that are functioning well produce a sample standard deviation that is less than half the value of the sample mean. The results of this study showed that the standard deviation was less than half the mean for five of the six oral language IGDIs (PtP, MI, DVwP, DVw/oP, and PN). WODB did not meet this criterion.
The skew and kurtosis of the distribution of scores produced by each measure was also evaluated, with the assumption that a measure would be considered to be functioning well if it produced a distribution of scores in which the skew and kurtosis were less than an absolute value of 1 (DeCarlo, 1997; Hopkins & Weeks, 1990). Results showed that neither PtP nor MI met this criterion. The kurtosis of the distribution of MI scores was clearly outside of the stated criterion (3.70). The kurtosis of the distribution of scores for PtP was just outside of the acceptable range (1.48). The remainder of the oral language IGDIs either met these criteria or closely approximated them.
The final psychometric standard is to find less than 20% of zero scores per measure (Carta, Greenwood, Walker, & Buzhardt, 2010). Finding a high percentage of zero scores suggests that the measure does not match the ability level of the intended population and is not sensitive enough to provide information for those with low ability in this construct. WODB was the only measure that demonstrated a large percentage of zero scores.
Validity evidence
To examine the convergent validity of the measures, intermeasure correlations were calculated. For many of the measures, we found significant evidence of convergent validity, as demonstrated by strong intermeasure correlations. The measures PtP, WODB, DVwP, and PN demonstrated intermeasure correlations ranging from .52 to .73. These high intermeasure correlations indicate that these four measures were similar in the constructs or behaviors we assessed and scored.
We examined concurrent criterion validity to determine if the newly developed oral language IGDIs were capturing the oral language construct similarly to established measures of oral language development. To this end, administrators used the two criterion measures of oral language development: the PPVT-4 and the PLS-4, and examined the relation between scores on each IGDI measure and scores on these criterion tests. When examining correlation coefficients, the best method of interpretation is in reference to similar correlations. Cohen (1988) recommended the following interpretation guidelines: .10 = small, .30 = moderate, .50 = large. However, the PPVT-4 demonstrates concurrent correlations with other measures of the oral language construct in the range of .37 to .84. Given that the PPVT-4 has demonstrated correlations as high as .84, we instead adopted the following interpretation criteria: 0 to .3 = weak; .4 to .6 = moderate; .7 to 1.0 = strong (Ratner, 2011).
Given these guidelines, two of the oral language IGDIs demonstrated strong correlations with the PPVT-4 and PLS-4: PN and DVwP. WODB demonstrated a moderate-strong relation with the PPVT-4 and PLS-4. PtP demonstrated a moderate relation with the PPVT-4 and the PLS-4. MI demonstrated a weak to moderate relation with the PPVT-4 and PLS-4, and the correlation with the PLS-4 was found to be nonsignificant. DVw/oP demonstrated weak nonsignificant relations with the PPVT-4 and the PLS-4.
Measure analysis against criteria and removal of measures
Table 4 presents each measure compared with the essential criteria of GOMs and validity evidence criteria. After consideration of these criteria simultaneously, we decided to drop two of the six measures from the pool of potential measures and not subject them to further analysis. The first measure dropped was MI. The kurtosis of the distribution of MI scores far exceeded the stated criteria (3.70). In addition, MI demonstrated weak intermeasure and concurrent validity correlations. As such, we determined that the MI task did not accurately capture the construct of oral language development and removed it from further analysis and the pool of potential measures.
Criteria for Evaluating Measures.
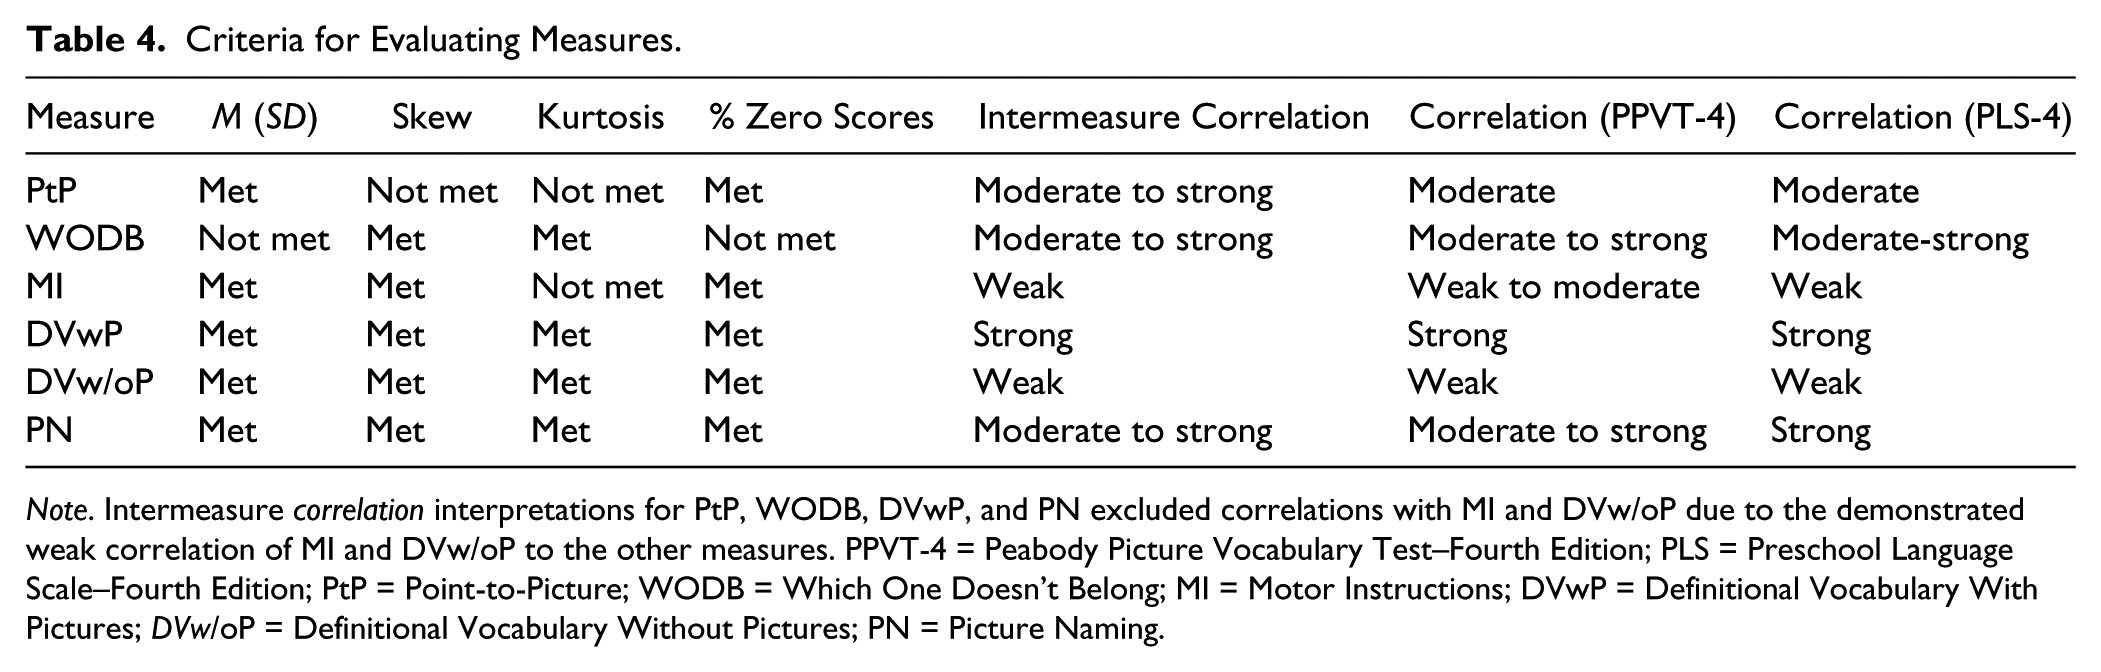
Note. Intermeasure correlation interpretations for PtP, WODB, DVwP, and PN excluded correlations with MI and DVw/oP due to the demonstrated weak correlation of MI and DVw/oP to the other measures. PPVT-4 = Peabody Picture Vocabulary Test–Fourth Edition; PLS = Preschool Language Scale–Fourth Edition; PtP = Point-to-Picture; WODB = Which One Doesn’t Belong; MI = Motor Instructions; DVwP = Definitional Vocabulary With Pictures; DVw/oP = Definitional Vocabulary Without Pictures; PN = Picture Naming.
DVw/oP did well when compared against the essential criteria of GOMs. However, it demonstrated weak intermeasure and concurrent validity correlations. Because the only difference between DVwP and DVw/oP was the presence of a visual stimulus or prompt for the child, we determined that DVwP performed better and would be more useful to retain, while we should remove DVw/oP from further analysis. Along with this decision, the description of item-level functioning below and the related data in Table 3 do not include data for MI and DVw/oP.
Item-level functioning
To understand how each measure functioned at the item level, two pieces of information underwent analysis. The first piece of information was the item mean or p value, which provides evidence of an item’s difficulty in that it represents the percentage of children in the total sample who passed the item. We considered items to demonstrate an acceptable p value if the item mean was within the range of .2 to .8, suggesting it was not too difficult or too easy. When considering item mean information, it was evident that PtP did not have a sufficient percentage of items within the acceptable range. The remaining three measures did have a high percentage of items with p values in the acceptable range, with WODB having the highest percentage (45%) and PN the lowest (34%). PN items demonstrated the widest range in p value (.21–1).
We also examined item-total correlations as evidence of item discrimination, with high item-total correlations indicating that children who did well on the test got the item right, while low or negative correlations indicate that children who did well on the test got the item incorrect. Our working assumption was that if an item demonstrated an item-total correlation of .2 or higher, it was contributing meaningfully to the test. PtP had the fewest items with item-total correlations greater than .2 (23%) meaning that relatively few of the items in this measure were discriminating well between ability levels. WODB, PN, and DVwP all demonstrated an adequate percentage of items that demonstrated evidence of the ability to discriminate between ability levels. Based on this analysis, it was determined that we would drop PtP from further research and development.
Finalization of measure pool
A number of different criteria formed the basis for determining which measures would move forward into further phases of research and development, including essential criteria of GOMs, intermeasure and concurrent criterion correlations, and item-level functioning. We removed MI and DVw/oP from the pool of potential measures after examining their intermeasure and concurrent criterion validity. We removed PtP after further item-level analysis. PN and DVwP demonstrated the strongest combination of GOM characteristics, validity evidence, and item functioning. WODB demonstrated sufficiently strong validity evidence and item-level performance to remain in the pool of measures. It was determined that careful item revision to make WODB items easier would reduce the number of zero scores obtained and affect the ratio of mean to standard deviation as well.
Study 2
The purpose of Study 2 was to submit the newly developed oral language IGDIs that demonstrated sufficient performance in Study 1 to a larger and more diverse field trial to answer the following questions: (a) To what extent do the measures relate to one another? and (b) What is the criterion validity of the measures?
For Study 2, we also transitioned from use of Classical Test Theory as our guiding measurement framework to use of the Rasch (1960) model. It was determined that use of an item-response theory approach, specifically the Rasch model, was necessary to address the issue of uncontrolled and variable item difficulty levels, which was noted with the original oral language IGDI, PN 1.0. The Rasch model alleviates this concern, as it locates items and child ability on a common arbitrary scale, with the average item located at zero (typically resulting in an ability scale from −4 to +4). Commonly locating items and student abilities on the same scale allows test developers to create tests comprising item sets that capture student ability within precise and specific ranges of performance. Thus, it should be noted that in addition to addressing the stated research questions, the data collection effort described in Study 2 was also used to facilitate the data calibration necessary to commonly locate student abilities and items to inform test development for specific instructional purposes (screening, progress monitoring, etc.; see McConnell, Bradfield, & Wackerle-Hollman, in press, for additional discussion).
To be consistent with this change in the measurement model, information reported in the “Results” and “Discussion” sections will focus on the Rasch-based scores rather than traditional raw IGDI scores. Rasch scores are reported as logits reflecting the ability scale (−4 to +4; average item set at zero). Thus, the Rasch score reflects the child’s ability in the oral language domain, with negative scores indicating below-average performance and positive scores indicating above-average performance. Because the Rasch model provides one-to-one correspondence between the Rasch scaled score (logit) and IGDI raw score, all correlations reported and discussed can be interpreted in exactly the same manner as if the IGDI raw score had been reported.
Method
Participants and setting
Study 2 was part of a larger descriptive study on language and literacy development in preschool, conducted by CRTIEC (see Greenwood et al., 2011). Child language and literacy assessments took place in the fall, winter, and spring; 756 children and families participated in the study, served by preschool programs at four sites in the Midwest and Pacific Northwest. Children between 4 and 5 years of age (48 and 71 months) were eligible for recruitment. Parental consent forms accompanied all eligible children home. The mean age of children was 54 months. Exactly half of the children were male (n = 378), half were female (n = 378). The distribution of race/ethnicity was 36% White, 30% African American, 20% Hispanic, 10% Multirace, 2% Asian, 1.5% Other, and 0.4% American Indian. Eighty-four percent of parents reported speaking English to their children at home; 21% spoke Spanish.
Measures
The oral language IGDIs administered during Study 2 included PN 2.0, DVwP and WODB. Before administration in Study 2, the team made item-level revisions to each measure. We either discarded or edited items that were not functioning well (item-total correlations below .2). For the DVwP measure, we retained 10 items, edited 9, discarded 2, and created 23 new items. We retained 34 WODB items with specific revisions made to address construct irrelevant features, extensively edited 6 (modification of response choice content), and created 4 new items, retained 75 PN items, and discarded 22 items. After all revisions, DVwP and WODB each had a total item pool of 44 items. PN had 75 items. During test administration, for each test, children received 20 predetermined items.
The instructions for each measure in Study 2 were the same as in Study 1. The PPVT-4 was the norm-referenced criterion test used in this study.
Procedures
Study 2 consisted of three waves of data collection, completed in late fall, winter, and early spring. During Waves 1 and 3 (late fall and early spring, respectively), children completed all three IGDIs and the PPVT. During Wave 2, only the IGDIs were administered.
Tests administrators were graduate students who had successfully completed a series of training activities on standardized administration, and who demonstrated accurate fidelity of administration (demonstrated at least 90% accuracy on fidelity check process). Assessments in each wave took place during two to three testing sessions that lasted 15 to 20 min each. The assessments occurred in either an empty room within the child care center or on the floor in the hallway directly adjacent to that room. After each assessment, the child received the opportunity to select a small toy from the prize box.
Results
We converted IGDI raw scores into Rasch scores before analysis. Participants who received a raw score of zero were not included in the analysis. Table 5 presents results of the fall wave and reports descriptive statistics for PN, DV, and WODB, including raw score and Rasch score. WODB demonstrated the lowest mean Rasch scores (.10); PN and DV had demonstrated higher and similar mean Rasch scores (1.68 and 1.65). PN had the highest variability in scores, with a standard deviation of 1.92.
Study 2: Means, Standard Deviations, Skew, and Kurtosis for Oral Language IGDIs.
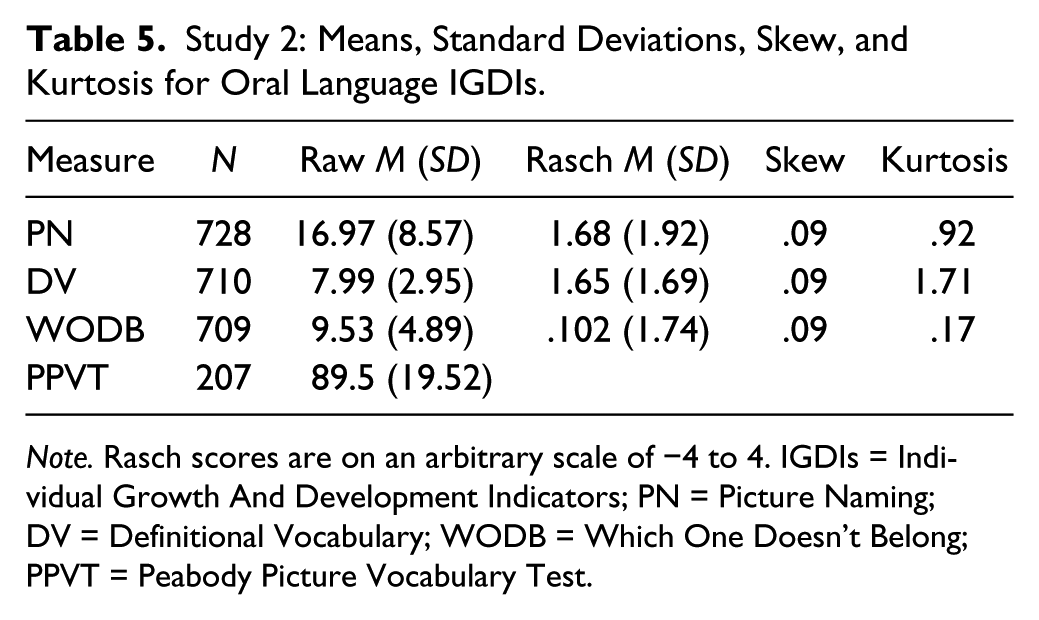
Note. Rasch scores are on an arbitrary scale of −4 to 4. IGDIs = Individual Growth And Development Indicators; PN = Picture Naming; DV = Definitional Vocabulary; WODB = Which One Doesn’t Belong; PPVT = Peabody Picture Vocabulary Test.
Table 6 shows correlations between each IGDI and the criterion measure. In general, the correlations among IGDIs were significant and of moderate magnitude while correlations between IGDIs and PPVT were significant and moderate to strong. The highest correlation obtained was between DV and PN (.55) and the lowest correlation was between DV and WODB (.43). Criterion validity correlation coefficients ranged from .51 to .66 with the PPVT.
Study 2: Correlations for Each Measure in Wave 1.
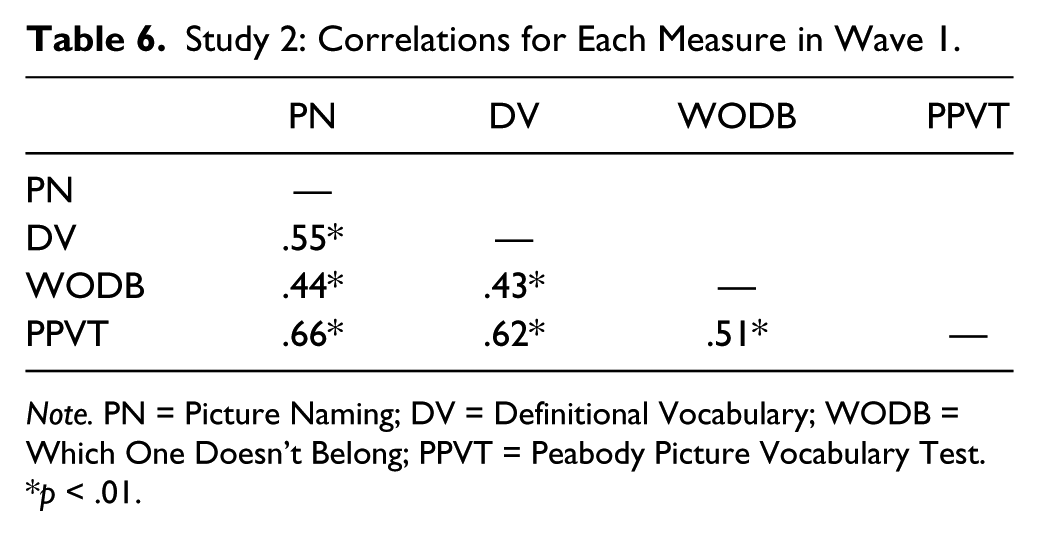
Note. PN = Picture Naming; DV = Definitional Vocabulary; WODB = Which One Doesn’t Belong; PPVT = Peabody Picture Vocabulary Test.
p < .01.
Discussion
The purpose of Study 2 was to examine the convergent and concurrent criterion validity of the revised oral language IGDIs with a larger and more diverse sample of children.
Validity evidence
We found evidence of convergent validity indicated by moderate, significant intermeasure correlations. To be specific, DV and PN had the highest intermeasure and criterion measure correlations, while WODB produced lower, but still significant, correlations with IGDIs and the PPVT. Although the original intent of the WODB was to tap into the domain of oral language, the decreased magnitude of the intermeasure and criterion correlations indicated WODB was not capturing the construct of oral language development similarly to the other measures. As such, we removed WODB as a potential measure of oral language development and instead considered a potential measure of early comprehension.
As our work progressed, it became clear that an optimal assessment structure to support identification decisions within an RtI framework is one that minimizes assessment burden and maximizes efficiency. We thus became interested in identifying the single measure that best captured the domain of oral language development and demonstrated the strongest technical adequacy. Thus, while PN and DV showed promise as a GOM of oral language, PN demonstrated slightly better evidence of concurrent criterion validity than DV, and became the preferred measure of oral language development.
In summary, in our efforts to improve our capacity to measure oral language development to inform instructional decision making, we conducted a series of studies. Study 1 demonstrated that PN, DV, and WODB met essential GOM criteria and psychometric standards, demonstrated strong intermeasure correlations, and demonstrated high concurrent criterion correlations. Study 2 provided additional validity evidence from a larger and more diverse sample indicating that PN was the strongest candidate to move forward as a robust measure of oral language for use in supporting identification decisions with an early childhood language and literacy RtI framework.
Implications for practice
Acquiring early literacy skills during preschool is essential for later reading acquisition. To ensure that children are on a trajectory to become proficient readers, we need an efficient and valid way to identify children at risk of later reading difficulties so we can provide effective and immediate early language and literacy intervention. The PN IGDI has historically shown high feasibility and utility as a measure of oral language development, but flaws existed in its ability to provide precise and specific information on the oral language ability of a child. This paper describes the process of developing and field-testing a new cadre of oral language IGDIs, with one measure, PN 2.0, rising above the others in terms of demonstrated technical adequacy and psychometric performance.
The work we have described here is the first step in an ongoing process of iterative development and validation. Future papers will describe results of item- and person-level analyses that inform further test development, resulting in an oral language measure that will provide precise and specific information to facilitate oral language tier-level placement instructional decisions necessary within an RtI model.
As this process of refinement and validation continues, our CRTIEC partners are simultaneously developing and validating interventions for children requiring Tier 2 and Tier 3 oral language instructional services. This soon-to-be realized package of robust assessment to inform identification, coupled with targeted evidence-based intervention, will allow early educators to ensure that all children are making the best progress possible toward becoming future readers.
Footnotes
Authors’ Note
The opinions and recommendations presented in this article are those of the authors alone, and no official endorsement from the Institute of Education Sciences should be inferred.
Declaration of Conflicting Interests
The authors declared the following potential conflicts of interest with respect to the research, authorship, and/or publication of this article: Please note that Drs. Bradfield, Wackerle-Hollman, Rodriguez, and McConnell have developed assessment tools and related resources known as Individual Growth & Development Indicators. This intellectual property is subject of technology commercialization through the University of Minnesota. All four investigators may be entitled to royalties through the University of Minnesota for products related to the research described in this article. In addition, Dr. McConnell has equity interest in Early Learning Labs, Inc., a company which may commercially benefit from the results of this research. This relationship has been reviewed and managed by the University in accordance with its conflict of interest policies.
Funding
The authors disclosed receipt of the following financial support for the research, authorship, and/or publication of this article: This work was supported in part by grant R324C080011, the Center for Response to Intervention in Early Childhood, from the Institute of Education Sciences, U.S. Department of Education, to the University of Kansas; Charles Greenwood and Judith Carta, Principal Investigators.