
Abstract
Curriculum-Based Measurement (CBM) is a direct method of academic assessment used to screen and evaluate students’ skills and monitor their responses to academic instruction and intervention. Interventioncentral.org offers a math worksheet generator at no cost that creates randomly generated math curriculum-based measures (M-CBMs). In this study, we examined the test–retest reliability and alternate-form reliability of four parallel, randomly generated M-CBMs designed to assess multiple arithmetic skills (addition, subtraction, multiplication, and division). The participants (N = 283 sixth-grade students) completed each M-CBM worksheet twice during a semester. According to our results, these M-CBMs have moderate test–retest and alternate-form reliability. Applying the Spearman–Brown Prophecy Formula revealed that aggregating M-CBMs increases the reliability of these measures to acceptable levels for progress monitoring (i.e., above .80).
Curriculum-Based Measurement (CBM; Deno, 1985) is a brief standardized method of academic assessment that measures student learning in relationship to the curriculum (Hosp, Hosp, & Howell, 2007). Curriculum-based measures (CBMs) are general outcome measures that have alternate forms to allow for frequent and repeated administrations, which are useful for evaluating students’ academic skills and monitoring their progress or response to academic instruction and intervention (Hosp et al., 2007; Shapiro, 2011). General outcome measures, such as CBMs, include a “systematic sampling of the annual curriculum” (Foegen & Deno, 2001, p. 5), which provides a measure of skill attainment in a particular subject. Given that CBMs are short and have multiple forms, school personnel can administer CBMs frequently and measure a student’s rate of learning a particular skill set. Knowing a student’s current level of skill attainment and rate of learning can help school personnel determine the student’s need for secondary or tertiary interventions.
CBM’s popularity has grown over the past 15 years because of federal mandates and educational agencies’ adoption of Response to Intervention (RTI), which is a multi-tiered approach for prevention and identification of students at risk of academic failure (Fuchs & Fuchs, 2002; Individuals With Disabilities Education Improvement Act, 2004; No Child Left Behind, 2001). Several websites offer online CBM resources to aid educators. Some are subscription based (e.g., AIMSweb, 2014) while others are available at no cost to users (e.g., EasyCBM Lite Edition, 2014; Intervention Central, 2014).
A popular free website is interventioncentral.org. According to Jim Wright, the website’s creator (J. Wright, personal communication, April 16, 2015), the site generated approximately 1,879,254 total visits in the 1-year span from April 16, 2014, to April 16, 2015. On this site, educators and parents can access academic (e.g., click or clunk reading checklist) and behavioral interventions (e.g., behavioral report cards), research articles, CBMs (e.g., reading and math-fluency measures), and the math worksheet generator. Many of the resources offered on the site are evidence based and technically adequate (Elliot, Lee, & Tollefson, 2001; Foegen, Jiban, & Deno, 2007; Grafman & Cates, 2010). However, educators and researchers know little about the technical adequacy of the math worksheet generator—one of interventioncentral.org’s most popular resources—which accumulated approximately 121,562 total visits between April 13, 2014 and April 13, 2015 (J. Wright, personal communication, April 14, 2015).
The math worksheet generator randomly creates single or multiple skill computation worksheets and/or cover-copy-compare worksheets. Users specify problem types to be included on the worksheet (e.g., single-digit plus single-digit addition). According to interventioncentral.org (CBM Warehouse, 2014), educators and school psychologists can use the math worksheets during interventions (e.g., cover-copy-compare for accuracy, speed drills for fluency), as math CBMs (M-CBMs) or as math mastery measures (Grafman & Cates, 2010). CBMs differ from mastery measures because they include a sampling of questions from across the curriculum as opposed to a single skill criterion-referenced test (Fuchs, 2004). CBMs include problem types that measure students’ integration of all skills required for mastery of a curriculum whereas mastery measures measure one skill at time in concordance with the sequence of the curriculum and attainment of mastery scores on prior tests. Educators often use CBMs and mastery measures for progress monitoring and making educational decisions about curriculum mastery; both types of measures need evidence of reliability and validity prior to dissemination.
Currently, there is no published research on the test–retest reliability, alternate-form reliability, and predictive validity of the randomly generated M-CBMs and math mastery measures from interventioncentral.org. Until research supports the reliability and validity of these measures, educators should not use them as mastery measures or M-CBMs. Therefore, in this study, to provide educators with initial evidence related to the reliability of the math worksheet generator, we examine the test–retest and alternate-form reliability of four randomly generated M-CBMs (i.e., mixed skills).
Test–Retest Reliability
Test–retest reliability (e.g., temporal consistency and stability) refers to the stability of a measure over time (Gregory, 2011). This is important for M-CBM because inconsistent scores could cause students to receive interventions incorrectly matched with their instructional level. Measures should have test–retest reliability coefficients greater than .90 for high stakes decision making and greater than .80 for progress monitoring (Foegen et al., 2007; Nunally, 1978). Published studies on a variety of M-CBMs have reported moderate (e.g., r = .67 and .48) to excellent (e.g., r = .80 to .97) test–retest reliability (Foegen & Deno, 2001; Foegen et al., 2007). However, no current M-CBM studies reported using the math worksheet generator. Therefore, the test–retest reliability of M-CBMs randomly generated through interventioncentral.org is unknown. This also means that the validity of randomly generated M-CBMs is unknown because reliability is a necessary but insufficient condition for validity: An unreliable measure is invalid.
Alternate-Form Reliability
Alternate-form reliability (e.g., equivalent-form reliability and parallel-form reliability) refers to the stability of a student’s performance or rank across multiple versions of a measure (Gregory, 2011). Alternate-form reliability is essential to M-CBM because progress monitoring requires multiple assessments across time. Repeated use of the same form increases the risk of practice effects. Foegen et al. (2007) suggested that alternate-form reliability coefficients of .80 or greater are acceptable for progress monitoring. In general, alternate-form reliability coefficients for M-CBMs have ranged from poor (i.e., r = .40) to excellent (i.e., r = .99), with most of the reliability coefficients above .80 (Foegen et al., 2007; Hintze, Christ, & Keller, 2002). However, no M-CBM studies have reported using the math worksheet generator. Therefore, the alternate-form reliability of M-CBMs randomly generated through interventioncentral.org is unknown.
Purpose
In general, there is evidence that M-CBMs are reliable tools for screening and progress monitoring. However, no studies have examined the test–retest and alternate-form reliability of randomly generated M-CBMs from interventioncentral.org. Therefore, in this study, we address two research questions as follows:
The answers to these questions are a first step toward understanding whether educators can use the math worksheet generator to monitor response to math computation interventions.
Method
Participants
Participants included 283 sixth-grade students from one middle school in a small urban area in the southeastern United States. We used a passive consent process to recruit participants from general education math classes; thus, math achievement varies from low to high, and the sample included most of the sixth-grade students in the school. Approximately 60.0% of the participants were male, 55.0% were African American, 39.0% were White or “other,” and 41.0% received subsidized lunch. Of the 283 participants, 91.1% provided complete demographic data. The demographic composition closely matched the population at the middle school.
Measures
We created four multiple skills M-CBMs from interventioncentral.org, which are forms A, B, C, and D. To prevent ceiling effects (i.e., students completing the entire CBM before the time ended), we included at least eight rows of problems on each M-CBM worksheet. Only the first eight rows were considered when scoring; however, participants never completed over five consecutive rows. Each row of problems contained three-digit plus three-digit addition with regrouping from the 1s and 10s columns, three-digit minus three-digit subtraction with regrouping from the 1s and 10s columns, two-digit by two-digit multiplication with regrouping (note: regrouping was random for this problem type), and three-digit divided by two-digit division with remainders.
We designed these M-CBMs to progress monitor sixth-grade students receiving a remedial math-fluency intervention for basic math skills. Therefore, we expected sixth-grade students with average to above average math achievement to have already mastered the majority of the skills on these M-CBMs. The division problems follow sixth-grade Common Core standards (Mathematics Standards, n.d.), the multiplication problems follow fifth-grade Common Core standards, and the addition and subtraction problems follow fourth-grade Common Core standards. In addition, aggregated fluency and accuracy scores from these M-CBMs are moderately (r = .65; Strait, 2008) correlated with the sixth-grade Palmetto Achievement Challenge Test (PACT), which was South Carolina’s state standardized test. Readers can obtain an example of these M-CBMs from the first author.
Administration
Using standardized directions, undergraduates instructed participants to complete problems from left to right and to not skip problems. These directions followed Wright’s (2013) suggestions for administering M-CBMs. However, at the time of data collection, Wright (2013) had not published guidelines for testing duration. Therefore, consistent with Christ, Johnson-Gros, and Hintze’s (2005) recommendation for using longer durations to increase reliability, we gave students 5 min to complete each measure.
Scoring
Three upper-level undergraduate students (raters) used answer keys to score the completed M-CBMs. The first author trained the raters in the scoring procedures. Specifically, participants earned one point for each digit they answered correctly. Raters calculated fluency scores by summing the total number of correct digits completed in 5 min. Raters calculated accuracy by dividing the number of digits answered correctly by the total number of digits attempted. We calculated inter-rater reliability for approximately 25% of the data from the first wave using Pearson’s correlation and percentage agreement. All inter-rater correlation coefficients were above .92. In addition, we obtained an average of 92% agreement (ranging from 68.5% to 98.5%) across all three raters on comparisons of participants’ overall fluency and accuracy scores and participants’ fluency and accuracy scores for each of the four problem types (i.e., addition, subtraction, multiplication, or division). Two of the 10 comparisons fell below 92% agreement. In these 2 comparisons, no difference between raters’ scores for any one participant (71 participants per comparison) was greater than 2 digits (e.g., 30 digits correct vs. 32 digits correct). In addition, we only counted agreement when all three raters obtained the same score, creating a conservative estimate of percentage agreement.
Data Collection Procedures
During the fall semester, participants completed each of the four M-CBMs twice, completing one M-CBM worksheet every 2 weeks. The first administration of each M-CBM occurred during the first 7 weeks of the study. Specifically, we administered Form A during Week 1, Form B during Week 3, Form C during Week 5, and Form D during Week 7. We refer to the first administration of each probe as Waves 1 through 4, respectively. The second administration of each M-CBM occurred during Waves 5 through 8. Specifically, we administered Form A during Week 9, Form B during Week 11, Form C during Week 13, and Form D during Week 14. There was approximately 7 to 8 weeks between the first and second administration of each M-CBM. Data collectors administered M-CBMs at the beginning of participants’ math classes.
Data collectors were undergraduate students enrolled in an independent study course. The first author trained each data collector during four 1-hr sessions. In addition, the first author provided each data collector with written, standardized instructions prior to each administration. Training for this project was part of a larger study pertaining to a remedial math-fluency intervention. The training involved direct instruction, modeling, and role-playing related to the following topics: M-CBM administration, M-CBM scoring, and intervention implementation. Unfortunately, we did not collect fidelity data on administration.
Results
Preliminary Data Analysis
Descriptive statistics and missing data
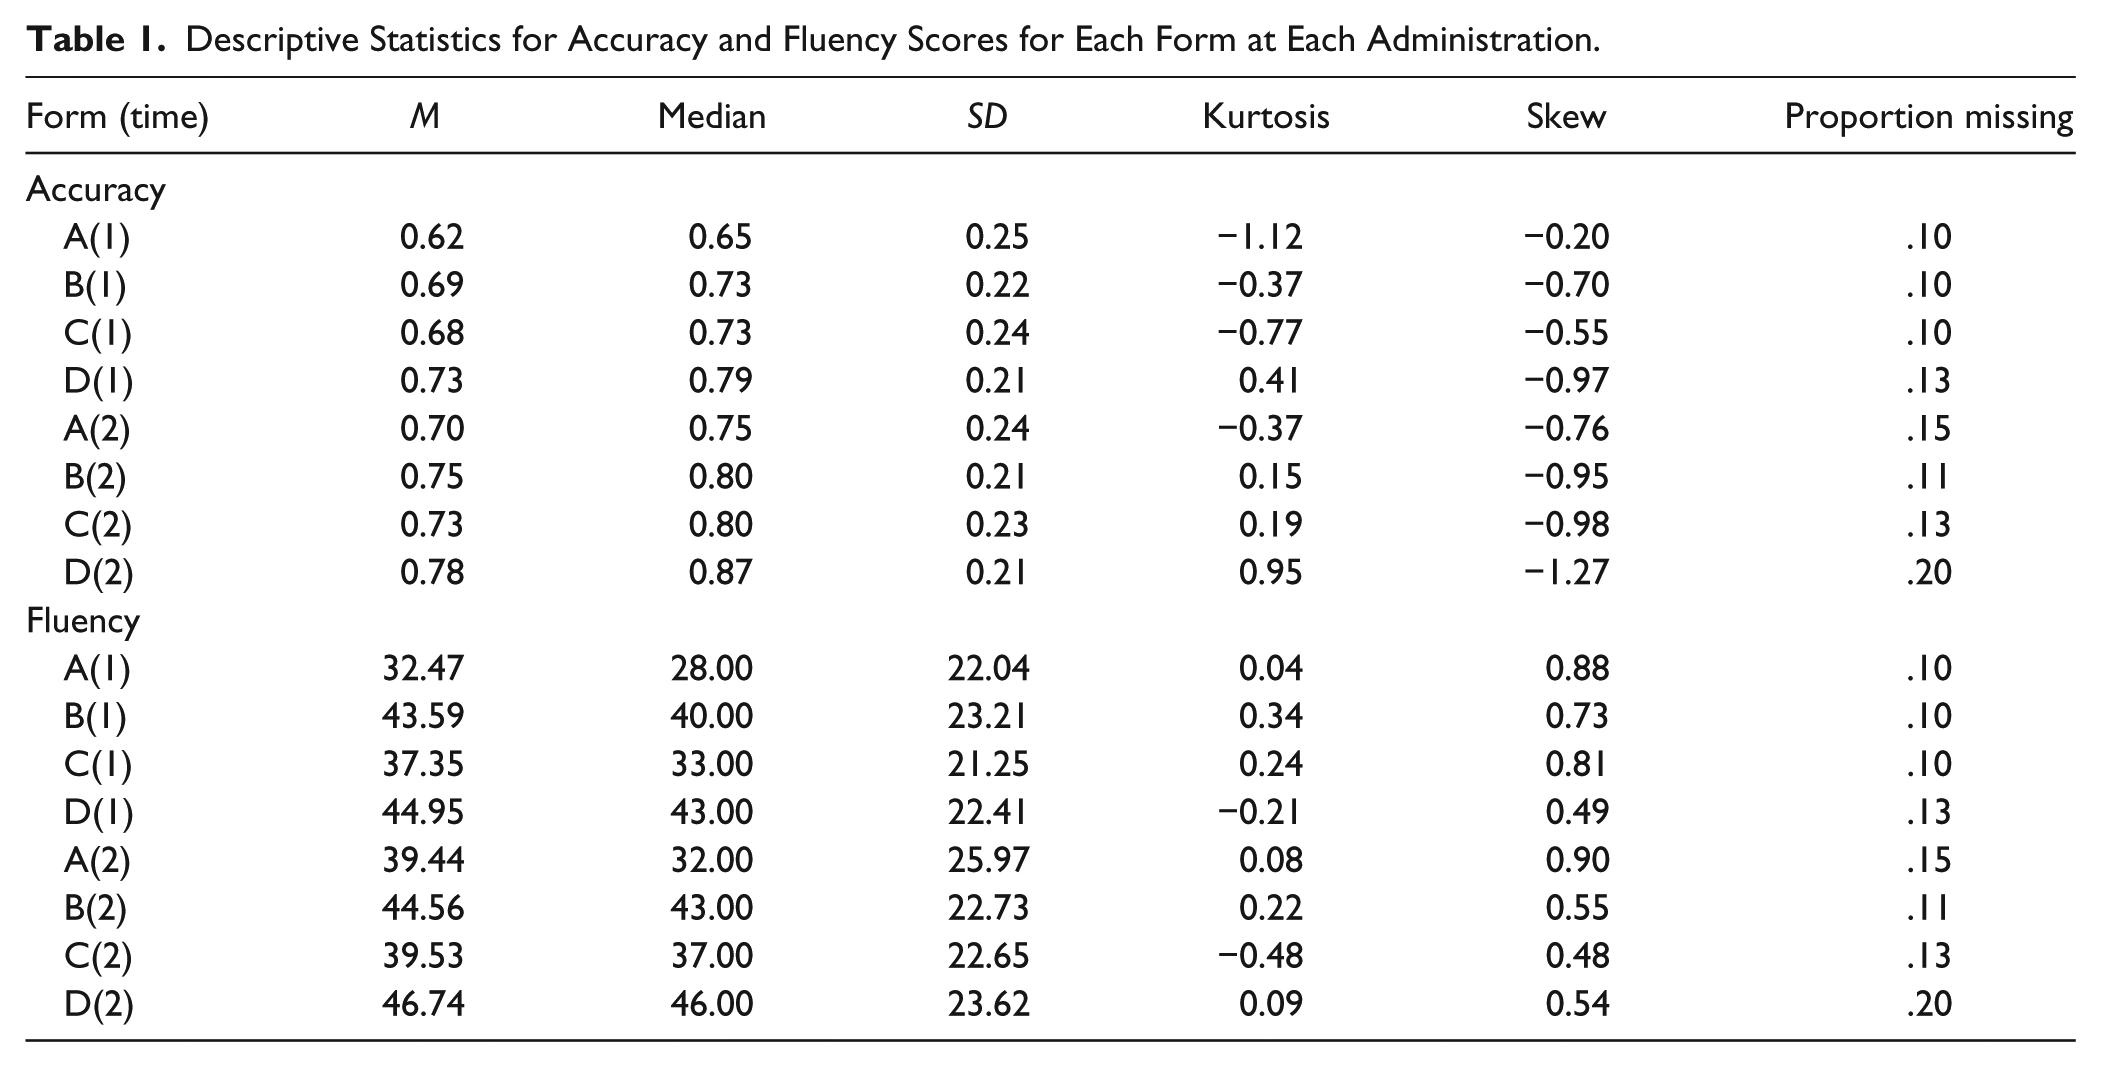
Table 1 provides the mean, median, standard deviation, skew, and kurtosis for each M-CBM administration. Table 1 also provides the proportion of missing data for each administration. Missing data ranged from 10% to 20% for each variable. Due to scheduling requirements, we did not require absent students to make up missed M-CBM administrations, which likely influenced the proportion of missing data.
Descriptive Statistics for Accuracy and Fluency Scores for Each Form at Each Administration.
To control for missing data, we used Full Information Maximum Likelihood (FIML) estimations (Arbuckle, 1996) for all analyses. FIML estimation produces unbiased parameter estimates, standard error, and explained variance when missing data exist (Cohen, Cohen, West, & Aiken, 2003). This approach is well-established in the methodological literature as retaining statistical power greater than ad hoc methods such as listwise deletion, and this approach minimizes bias introduced by unsystematic changes to the sample composition, relative to the original sampling (Schafer & Graham, 2002). However, bias due to missingness is only eliminated in data Missing at Random (MAR; Little & Rubin, 1987). MAR occurs when there is no association between the likelihood of a data point missing and its true (possibly unobserved) value, conditioned on other variables in the model. We address limitations of our study with respect to the MAR assumption.
Clustering
Another concern of this study was clustering of M-CBM scores within classes (i.e., teacher and period). Clustering can inflate alpha levels and increase the chance of a Type I error. Cohen et al. (2003) noted that intra-class correlations (ICC) greater than .01 could have strong impact on alpha levels. To examine clustering within classrooms, we calculated ICC using a two-level unconditional hierarchical linear model with no predictors. The dependent variable in this model was M-CBM scores (fluency or accuracy), and classrooms represented the Level 2 random effect. We found ICCs of .21 for aggregated M-CBM fluency and accuracy scores, indicating significant clustering within classrooms (Cohen et al., 2003).
We controlled for clustering in our second analysis by using multilevel linear models. The core assumptions for multilevel linear models are largely the same as those for multiple linear regressions (e.g., linearity of relations between predictors and outcomes and normal distributions of residuals). The key difference is that the multilevel models relax the assumption of independently distributed residuals. Specifically, the model accommodates for co-variation in the residuals that is a function of the clustering variable (i.e., math class).
Test–Retest and Alternate-Form Reliability
Pearson correlations
Table 2 displays the Pearson-product moment correlations for the two administrations of each M-CBM. Test–retest reliability coefficients for M-CBM fluency scores ranged from .49 to .75 (M = 0.66). Test–retest reliability coefficients for accuracy scores ranged from .61 to .75 (M = 0.68). For alternate-form reliability, coefficients for fluency ranged from .41 to .81 (M = 0.66), and coefficients for accuracy ranged from .47 to .78 (M = 0.65). Forms C and D had the highest test–retest and alternate-form reliability estimates.
Pearson Correlations Between Fluency Scores on M-CBMs (Upper) and Accuracy Scores on M-CBMs (Lower; N = 279).
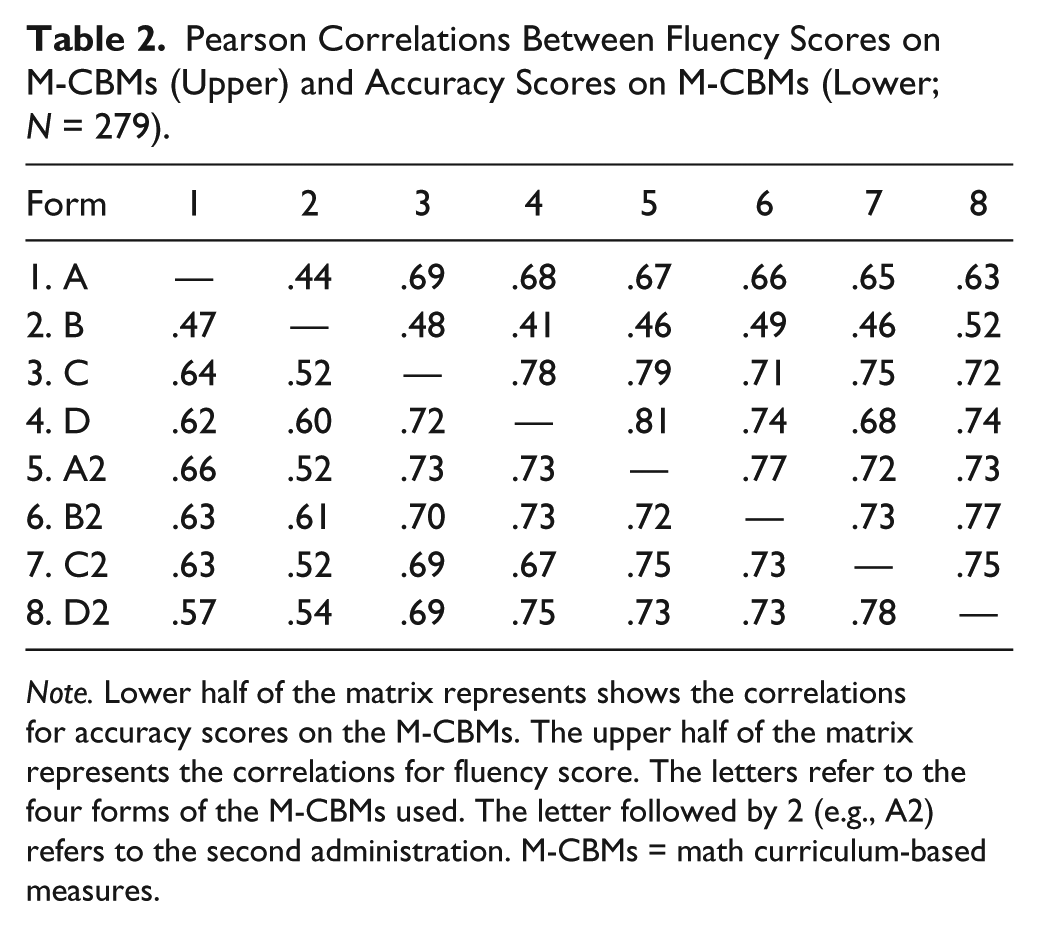
Note. Lower half of the matrix represents shows the correlations for accuracy scores on the M-CBMs. The upper half of the matrix represents the correlations for fluency score. The letters refer to the four forms of the M-CBMs used. The letter followed by 2 (e.g., A2) refers to the second administration. M-CBMs = math curriculum-based measures.
Multilevel linear model
In addition to Pearson-product moment correlation, we calculated test–retest reliability using a multilevel linear model, with time (Time 1 or 2) of administration as the Level 1 predictor, individual as the Level 2 random effect, and classroom as the Level 3 random effect. This multilevel model allowed us to examine stability of scores across time within individuals, nested within classrooms. The model also allows us to measure the variance in scores accounted for by the individual. Specifically, we used ICCs to calculate reliability estimates. The ICC estimates for accuracy test–retest reliability ranged from .59 to .74, and the ICC estimates for fluency test–retest reliability ranged from .49 to .73 (see Table 3).
ICC for Test–Retest Reliability of Fluency and Accuracy Scores After Controlling for Class.
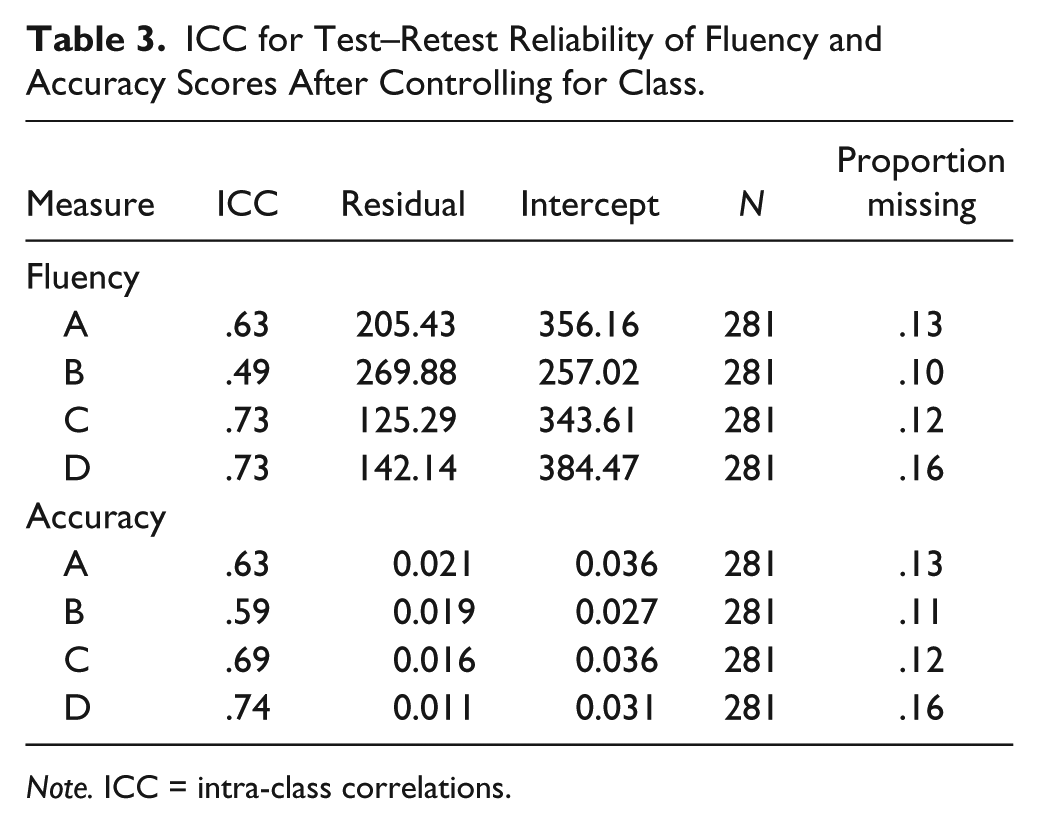
Note. ICC = intra-class correlations.
For alternate-form reliability, we used a multilevel linear model with data collection wave (i.e., Waves 1, 2, 3, and 4 for the first administration of each M-CBM, and Waves 5, 6, 7, and 8 for the second administration) as the Level 1 predictor, individual as the Level 2 random effect, and classroom as the Level 3 random effect. The ICC estimate for alternate-form reliability of fluency scores calculated for the first half of the study (i.e., Waves 1, 2, 3, and 4) was .58 (σ2 = 209.66, τ = 283.80), whereas the estimate calculated for the second half of the study (i.e., Waves 5, 6,7, and 8) was .73 (σ2 = 149.22, τ = 411.28). The ICC estimate for alternate-form reliability of accuracy scores in the first half was .57 (σ2 = 0.022, τ = 0.030), and the estimate in the second half was .71 (σ2 = 0.013, τ = 0.033).
Spearman–Brown Prophecy Formula
Given that the reliability estimates for these M-CBMs were inadequate (i.e., below .80), we used the Spearman–Brown Prophecy Formula to examine how many measures should be aggregated to obtain test–retest and alternate-form reliability estimates greater than .80 (Brown, 1910; Foegen et al., 2007; Spearman, 1910). In the following formula, rtt represents the predicted reliability, n represents the number administrations, and r represents the original test–retest or alternate-form reliability estimate:
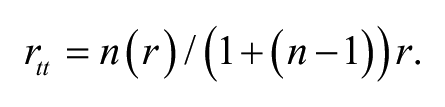
Results indicated that fluency scores achieved acceptable alternate-form reliability (>.80) by combining two administrations (rtt = .80), but for accuracy scores, three administrations were necessary (rtt = .85). For test–retest reliability, the results indicated that only two administrations were needed for both fluency (rtt = .80) and accuracy scores (rtt = .81).
Discussion
Results indicated that the four randomly generated M-CBMs had moderate test–retest and alternate-form reliability, which is below the acceptable criteria for progress monitoring (.80) and high stakes decision making (.90). Specifically, bivariate correlations indicated that the rank order of an individual’s score across measures was moderately stable, and multilevel models indicated that actual scores were moderately stable within individuals. Therefore, at this time, we advise against using these randomly generated, multiple skills computation M-CBMs for progress monitoring or high stakes decision making. Specifically, low reliability increases measurement error, which increases the risk of misidentifying students needing remediation.
Given that the resulting reliability estimates for these M-CBMs were below recommended levels for educational decision making (Foegen et al., 2007), we used the Spearman–Brown Prophecy Formula to predict the number of measures that must be aggregated to achieve adequate test–retest and alternate-form reliability (Brown, 1910; Spearman, 1910). The results indicated that aggregating two to three measures increases reliability estimates to greater than .80 for fluency and accuracy scores. Unfortunately, aggregating multiple 5-min M-CBMs substantially increases the data collection and analysis burden on teachers and schools, undermining the desired efficiency of CBM (Deno, 2003).
Limitations and Future Research
One major limitation of the present study is the proportion of missing data. Throughout the semester when data were collected, multiple students were absent from school and therefore could not complete the scheduled M-CBMs. Students were not required to make up missed assessments due to the school’s scheduling requirements. If not accounted for, missing data can lead to biased standard errors and parameter estimates. To minimize the negative effects of missing data, we used FIML Estimates. Although using FIML is a good statistical solution, we recommend that future studies minimize missing data by allowing students to make up missed administrations.
Another limitation was our focus on reliability, rather than validity, of randomly generated M-CBMs. However, reliability is a necessary condition for validity and, therefore, is an important and essential first step in test development. Future studies should replicate this reliability study and evaluate validity by comparing randomly generated M-CBMs to other types of M-CBMs and to different standardized math achievement tests. Researchers should also investigate the predictive validity of single scores and growth estimates from randomly generated M-CBMs for students’ performance on standardized achievement tests. In doing so, investigators might identify cut-scores with acceptable sensitivity and specificity.
In addition, future replications should measure M-CBM administration fidelity and counterbalance the administration of each M-CBM. The lack of fidelity checks and counterbalancing makes it difficult to disentangle procedural and form variability. Specifically, we were unable to test and control for administration errors and practice effects.
Conclusion
Overall, we found that four randomly generated M-CBMs obtained from interventioncentral.org had moderate test–retest and alternate-form reliability, which fall below acceptable levels for progress monitoring and high stakes decision making. To achieve minimally acceptable levels of reliability, practitioners may need to aggregate the results of multiple administrations of these measures, which greatly increases the time spent administering and scoring these assessments. These findings are somewhat consistent with other studies on M-CBM (Foegen et al., 2007). Future studies should continue to examine the math worksheet generator and other free source CBMs that lack evidence of technical adequacy (e.g., interventioncentral.org’s written expression CBM). Finally, given the unacceptable reliability and dearth of psychometric information on these randomly generated M-CBMs, we strongly caution practitioners against using this form of M-CBM for progress monitoring or high stakes decision making.
Footnotes
Declaration of Conflicting Interests
The authors declared no potential conflicts of interest with respect to the research, authorship, and/or publication of this article.
Funding
The authors received no financial support for the research, authorship, and/or publication of this article.