
Abstract
Venous leg ulcers (VLUs) are the most common chronic wound types in older populations, with many wounds not healing in the normal trajectory. Many older people with wounds are treated in their homes, currently assessed by monitoring the wound area over weeks to ascertain the potential for healing. A noncontact method using thermal imaging has been shown to predict the healing trajectory of diabetes-related foot ulcers, although has not been tested in VLU or the home setting. This project investigated the effectiveness of using thermal imaging to predict VLU healing in the homes of participants. Images of 78 ulcers were collected weekly using a thermal camera from 67 participants in their homes, at 5 consecutive time points. Final follow-up calls were undertaken at 12 weeks to ascertain healing status (healed/unhealed). Images were preprocessed and segmented and the area of the region of the wound was extracted. Kruskal–Wallis tests were performed to test the association of the change of areas over the 5 consecutive weeks with the healing status of the ulcers at 12 weeks. The 95% confidence interval plots were obtained to study the distribution of the area in the healed and unhealed cases. This study found that the difference in the imaged areas between unhealed ulcers at 12 weeks did not reach statistical significance using thermal imaging. Therefore, thermal images could not predict healing progression in VLUs when the images were taken in the homes of participants. Future research to improve the prediction of venous leg ulcer healing should include developing a protocol to standardize conditions, improve imaging process methods, and use machine learning.
Introduction
Venous leg ulcers (VLUs) are the most common type of chronic wounds 1 with prevalence increasing in older ages.1-3 The impact of living with a chronic wound is substantial, with not only financial burden,4-6 but also a significant cost to individuals’ quality of life. 7 These wounds can be caused by trauma or other reasons, but their chronicity is a result of venous obstruction or reflux, which leads to poor venous return (poor return of blood from legs to the heart) and venous hypertension (increased pressure in the veins). 8 Best practice management leads to 86% of VLUs healing by 24 weeks. 9 However, in practice, ∼30% of ulcers do not heal by 24 weeks. 10 Early detection of delayed healing could enable more aggressive treatment to be initiated earlier and assist in the healing process. 11 The current method to identify whether ulcers will heal is based on the healing trajectory of the wound over 4 weeks, as measured by area using digital planimetry 11 ; where normal healing is expected when there is 50% wound closure over this time period. 12 However, it has been reported 13 that this represents only 58% of the healers and thus there is a need for an improved prediction method.
A thermal imaging technique for measurement of the area of ulcers has been proposed to differentiate between the ulcers that will heal and those that could become chronic; where an image taken once can predict the likelihood of normal healing such as that of diabetes-related foot ulcers.13-17 As many older people with wounds are managed in different settings, including their homes, 18 the aim of this paper is to determine if thermal imaging is a better predictor of the wound healing trajectory than digital planimetry for people with VLU during home visits by nurses. We report on the use of thermal imaging for wound healing prediction. The advantages and limitations of thermal imaging are discussed.
Digital Planimetry
Digital planimetry records the 2-dimensional surface area of ulcers. It is one of the techniques recommended in best practice guidelines11,19 and is widely accepted as an accurate method to assess ulcers. 20 Ulcer margin lines are detected first, and the inner area is measured by tracing the outline of the ulcer by a marking pen on a clear, sterile, acetate film or graph paper. 21 The traced film is retraced using a stylus on a portable digital tablet, where the software calculates the area of the tracing by counting the number of squares on the film which fall within the ulcer tracing. 22
Thermal Imaging
Ulcers usually have underlying inflammation in them, characterized by redness, swelling, heat, and pain, which have an impact on healing. 23 These signs may be difficult to assess objectively by clinicians through visual inspection. 24 It has been reported that other parameters such as the temperature of the ulcers and the periwound regions can provide quantitative information about the inflammation. 25
Thermal imaging is a rapid, noninvasive and noncontact imaging technique that generates images based on a scale of colors representing the temperature on the surface of the object. 26 It has been used for several medical applications, including prediction of ulceration in the feet of people with diabetes since it helps to visualize and monitor the temperature distribution of the skin. 24 It can detect the temperature difference and quantify the sensitive changes in skin temperature which occur with pathological changes such as soft tissue inflammation of the skin, subsequent breakdown, and infection of ulcers.27-29 This method has been widely used to detect the risk of ulceration in people with neuropathy.17,30 An accepted approach to predict ulceration in neuropathic ulcers is to compare the skin temperature distribution of the 2 feet from the same participant, termed asymmetry analysis, and the foot with higher temperature is considered to be at risk of ulceration.24,31 Thermal imaging has also successfully predicted delayed healing of surgical wounds. 32
Temperature measurement can provide useful objective information about the progression of healing of ulcers. The presence of higher local temperature can indicate inflammation or infection, while the presence of lower temperature can indicate a slow healing rate. 22 The advantage of thermal imaging to assess chronic ulcers has been studied, where the integration of a stereo vision system with an additional infrared detector was used. The 3-dimensional image of the wound was overlaid with the thermal image to combine the color, volume, and thermal imaging to obtain both color texture and temperature information. 22 This is based on 3D scanning and simultaneous thermal imaging, making the data collection and analysis complex. Another study used thermal imaging as one of the tools to monitor the changes in the characteristics of blood flow and metabolic processes as the wound progresses. 33 However, no work has been done to study the healing trajectory of ulcers based on the area of the ulcers with respect to their temperature distribution.
The hypothesis of this study is that thermal imaging is better at predicting the healing trajectory of VLUs than digital planimetry. We propose that the area obtained from the temperature distribution of the wound using thermal imaging is a better predictive measure than the wound surface area measured using digital planimetry and can differentiate between those ulcers that heal and those that remain unhealed at 12 weeks.
Methods: Dataset for Validation
This is a prospective longitudinal observational study on a convenience sample. Individuals aged 18 years or above with VLUs being attended by a home and community care provider, Melbourne, Australia, were eligible for recruitment in this study. The presence of VLUs was defined as an Ankle Brachial Pressure Index between 0.8 and 1.2 and having signs of venous disease using a clinical, etiological, anatomical, and pathological classification system. 34 Ulcers located from the ankle region to below the knee region were considered in this study.
All data collection was performed by 1 trained research nurse with advanced training in wound management who attended the participants in their homes to provide treatment for the ulcers. This ensured consistency in the data collection. Thermal images for 5 consecutive weeks were collected between August 2018 and September 2019; the first week being considered as a baseline, followed by 4 consecutive weeks. Baseline assessment included (1) demographic factors: age, gender, income source, health care card status, living arrangement, and suburb of residence; (2) biomedical factors: comorbidities, medications, nutrition, height, and weight; (3) wound factors: ulcer duration: cause of the ulcer, location of the ulcer, digital planimetry measurement using Visitrack™ (Smith & Nephew) from acetate, dressing frequency, dressing products used, compression used, ankle and calf circumference, and conventional and thermal wound images.
Participants had weekly digital planimetry measurement using Visitrack™ (Smith & Nephew) from acetate, dressing frequency, and dressing products used collected. All the ulcers received standard wound care from the baseline week until the ulcers healed as per best practice standards. 11 Participants were followed in this study for a total of 12 weeks, and the research nurse reviewed the wound, allocating healing status at that time (healed or unhealed). We selected to follow up at 12 weeks, as it was anticipated that some wounds would potentially heal by then, given that the median time for wound healing of VLUs managed using best practice is 10 weeks. 9
Recording Wounds Using Digital Planimetry and Thermal Images
The area of the ulcers was recorded using the digital planimetry technique. Images were taken at baseline and weekly for 4 weeks using both a conventional and thermal camera. The conventional camera only uses the 3 red, green, and blue (RGB) color channels to form images. These were collected to provide a reference for the location of the ulcers. Figure 1 shows the RGB image along with the thermal image of an example venous leg ulcer.

(A) Red, green, and blue (RGB) image and (B) thermal image of a venous leg ulcer.
Thermal images were collected using the Fluke-TiR1 Infrared thermo-imaging camera (Fluke). This is a hand-held imaging device that acquires full, continuous visible near-infrared data with a simple point-and-shoot operation that is similar to conventional photo cameras. However, unlike conventional cameras that only use the 3 RGB color channels to capture images, this device captures thermal images. The obtained image is used to noninvasively identify and characterize unique thermal signatures associated with the target. The specifications are listed in Table 1.
Thermal Imaging Camera Specifications.
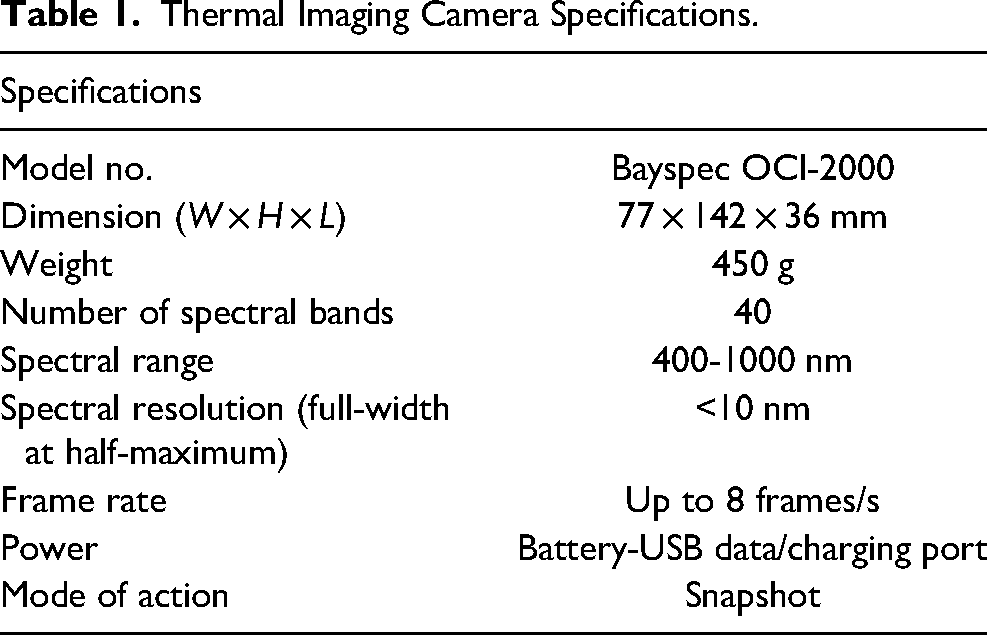
The research nurse was provided training in its use by the biomedical engineers. This training involved capturing the image, taking humidity and temperature readings, and downloading the images.
This study was approved by Human Research and Ethics Committee of Bolton Clarke and RMIT University. All participants were provided with participant information and consent forms and given the opportunity to ask questions prior to obtaining their written consent.
Statistical Analysis
An estimate of the sample size required was made using R statistical package. 35 Reliable classification accuracy of 88% was achieved with a sample size above 80.
Data were labeled as healed and unhealed at 12 weeks for classification purposes. Data are presented as proportions, means (standard deviations) or, for variables that did not conform to a normal or log-normal distribution, medians (interquartile range). Associations between area and healed status were tested for normality using the Anderson–Darling test. Normally distributed data were analyzed using analysis of variance, while the nonparametric Kruskal–Wallis test was used for nonnormally distributed data. Statistical significance was deemed to be reached when P < .05. Statistical analysis was performed using Matlab2018 (MathWorks).
Machine Training
Based on the absorption spectrum of hemoglobin versus deoxyhemoglobin, a simulation was performed. Eighteen equally spaced wavelength bands were used, starting at 600 nm and in the near-infrared range to 1000 nm. Gaussian noise was introduced to induce a coefficient of variation for the oxy and deoxy series of 37%. Support vector machine (SVM) with a radial basis function kernel, and default cost and gamma settings were fitted to 200 runs of simulation at each sample size which ranged from 20 to 200 with a train: test split of 50:50.
Segmentation of Ulcer Contour From Thermal Images
All image analyses were performed off-line using Matlab 2018b (MathWorks). The analysis of the images collected was performed on 78 ulcers. Since the images were taken over 5 weeks at different times of the day, there were differences in their orientation and scale. Hence, the images of the follow-up weeks were registered with the baseline week images to remove the variance in orientation and scale. The registration was performed under manual supervision using the Image Registration toolbox available in Matlab 2018b. The edges of the legs were considered as the reference.
As a first step, the images were binarized by taking the average of the 3 colors. This was then segmented automatically to obtain the region of interest (ROI) of the wound. The area and temperature distribution of the ROI were calculated for each week. The average, median, standard deviation, skewness, and kurtosis of wound temperatures were calculated from the ROI image of weeks 0, 1, 2, 3, and 4, respectively.
The next step was to determine the relative change in the weekly temperature with respect to week 0. A set of these for the 4 weeks was then input to an SVM classifier for training against the 2 labels: healed and unhealed by week 12. This was repeated using K-nearest neighbor and decision tree to identify the most suitable machine learning method for this application. An imbalanced class data correction method was applied to overcome the bias in the training data.
To enhance the contrast of the ulcer region from the other regions of the leg, preprocessing using histogram equalization was performed. This adjusts the image intensity values to enhance the contrast of the image. Figure 2A shows the obtained thermal image from the thermal camera while Figure 2B shows the effect of contrast enhancement, where the wound region can be clearly seen enhanced more than the other leg regions. Segmentation of the enhanced wound region was performed using Chan–Vese segmentation model, 36 which is a common active contour segmentation model used for segmentation, especially in the case of images obtained with low-resolution imaging techniques such as thermal imaging, where the edges of the objects of interest are not clearly defined (Figure 2C). It has been previously used on brain magnetic resonance images for segmentation of tumors and segmentation of white matter.37,38

Thermal imaging: (A) initial image, (B) after preprocessing, and (C) segmented ulcer region. Other image types: (D) red, green, and blue (RGB) image showing the ulcer on the skin surface, (E) digital planimetry wound tracing, and (F) digital planimetry ulcer region after tracing.
For comparison with the thermal image, the RGB image of the same ulcer has been shown in Figure 2D to show how the ulcer looks on the surface, and its area traced using digital planimetry is shown in Figure 2E. It is clear in these figures that the shape and the area obtained from thermal images based on the temperature distribution (Figure 2C) are very different from the shape and surface area obtained using digital planimetry (Figure 2F). After the segmented ulcer region based on temperature distribution was obtained, the area of the bounded region was calculated using Matlab 2018b.
Results
Participants
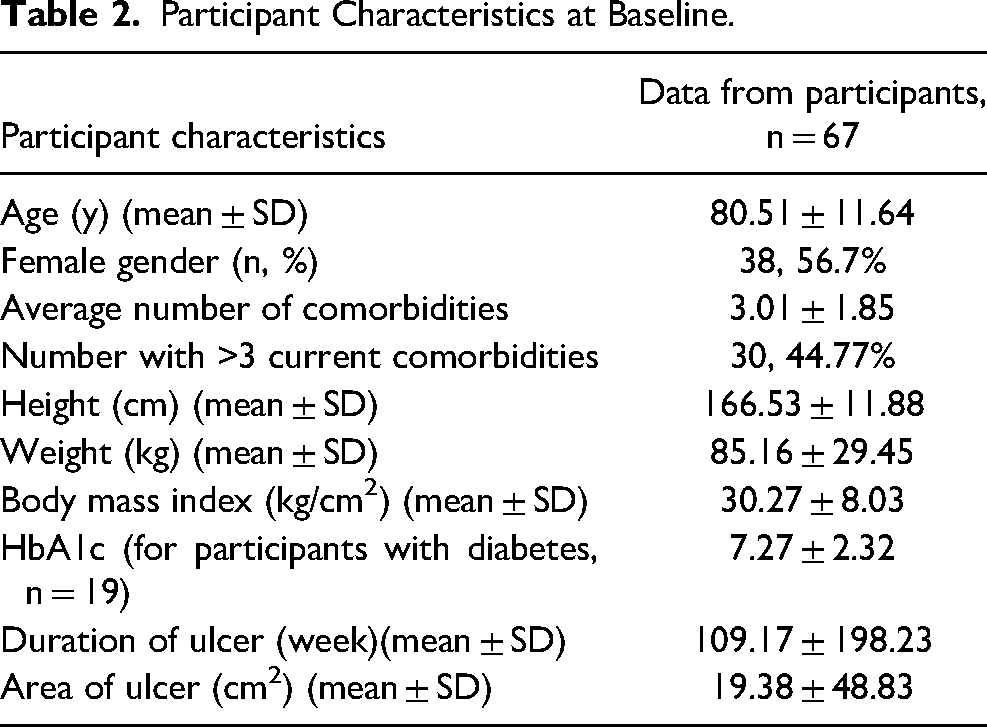
There were 67 participants with 78 wounds included in the study. Participants were in general older, with an average of 80 years of age, had multiple comorbidities, were obese, and had ulcers of long duration and large size. Details of demographic, biomedical, and wound characteristics of study participants are shown in Table 2.
Participant Characteristics at Baseline.
Wound Areas Using Digital Planimetry and Thermal Imaging
The area obtained from digital planimetry and thermal imaging did not follow a normal distribution. Hence, the nonparametric Kruskal–Wallis test was performed to test the association of the areas collected over 5 consecutive weeks with the healing status of the ulcers (healed vs unhealed at 12 weeks). The interval plots of the area with a 95% confidence interval (CI) were also obtained to study the distribution of the area in the healed and unhealed cases.
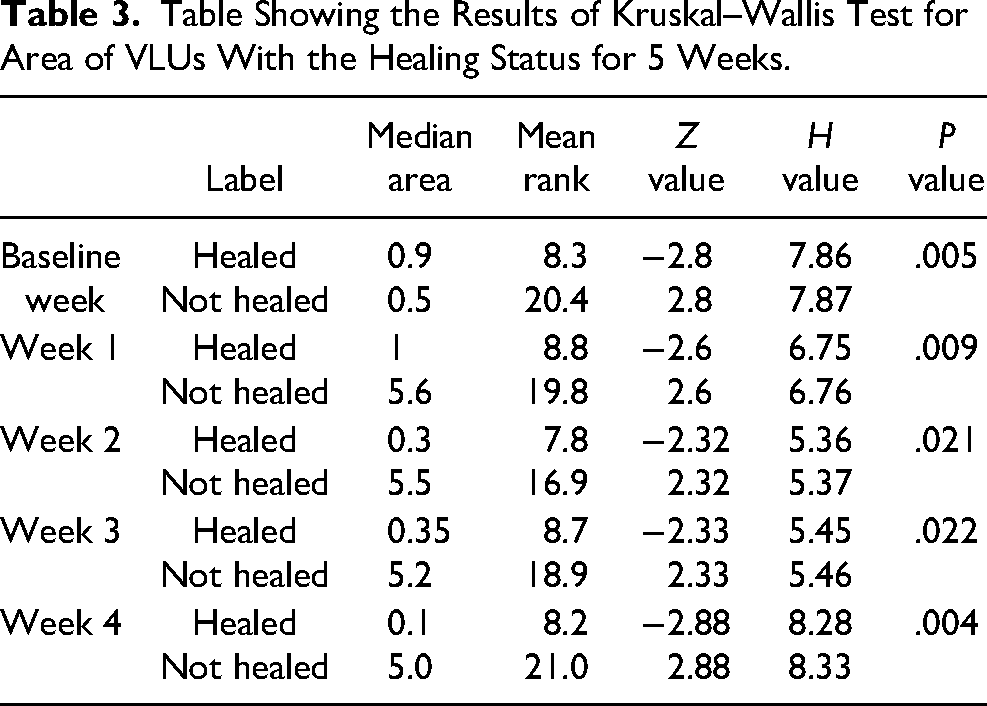
Table 3 shows the statistical results based on the area obtained using digital planimetry. Out of the total of 78 ulcers, 12 healed and 66 remained unhealed. There was a significant association between the healed/unhealed status obtained in week 12 and the area obtained by digital planimetry at each of the 5-week time points. Figure 3 shows the interval plots of the healed versus unhealed for 95% CI cases, where all healed cases had significantly smaller areas at baseline (<5 cm2) compared to the unhealed cases, whose areas were quite large at baseline. However, there is an overlap in the interval plots between the healed and unhealed cases, as not all of the ulcers that were small healed.
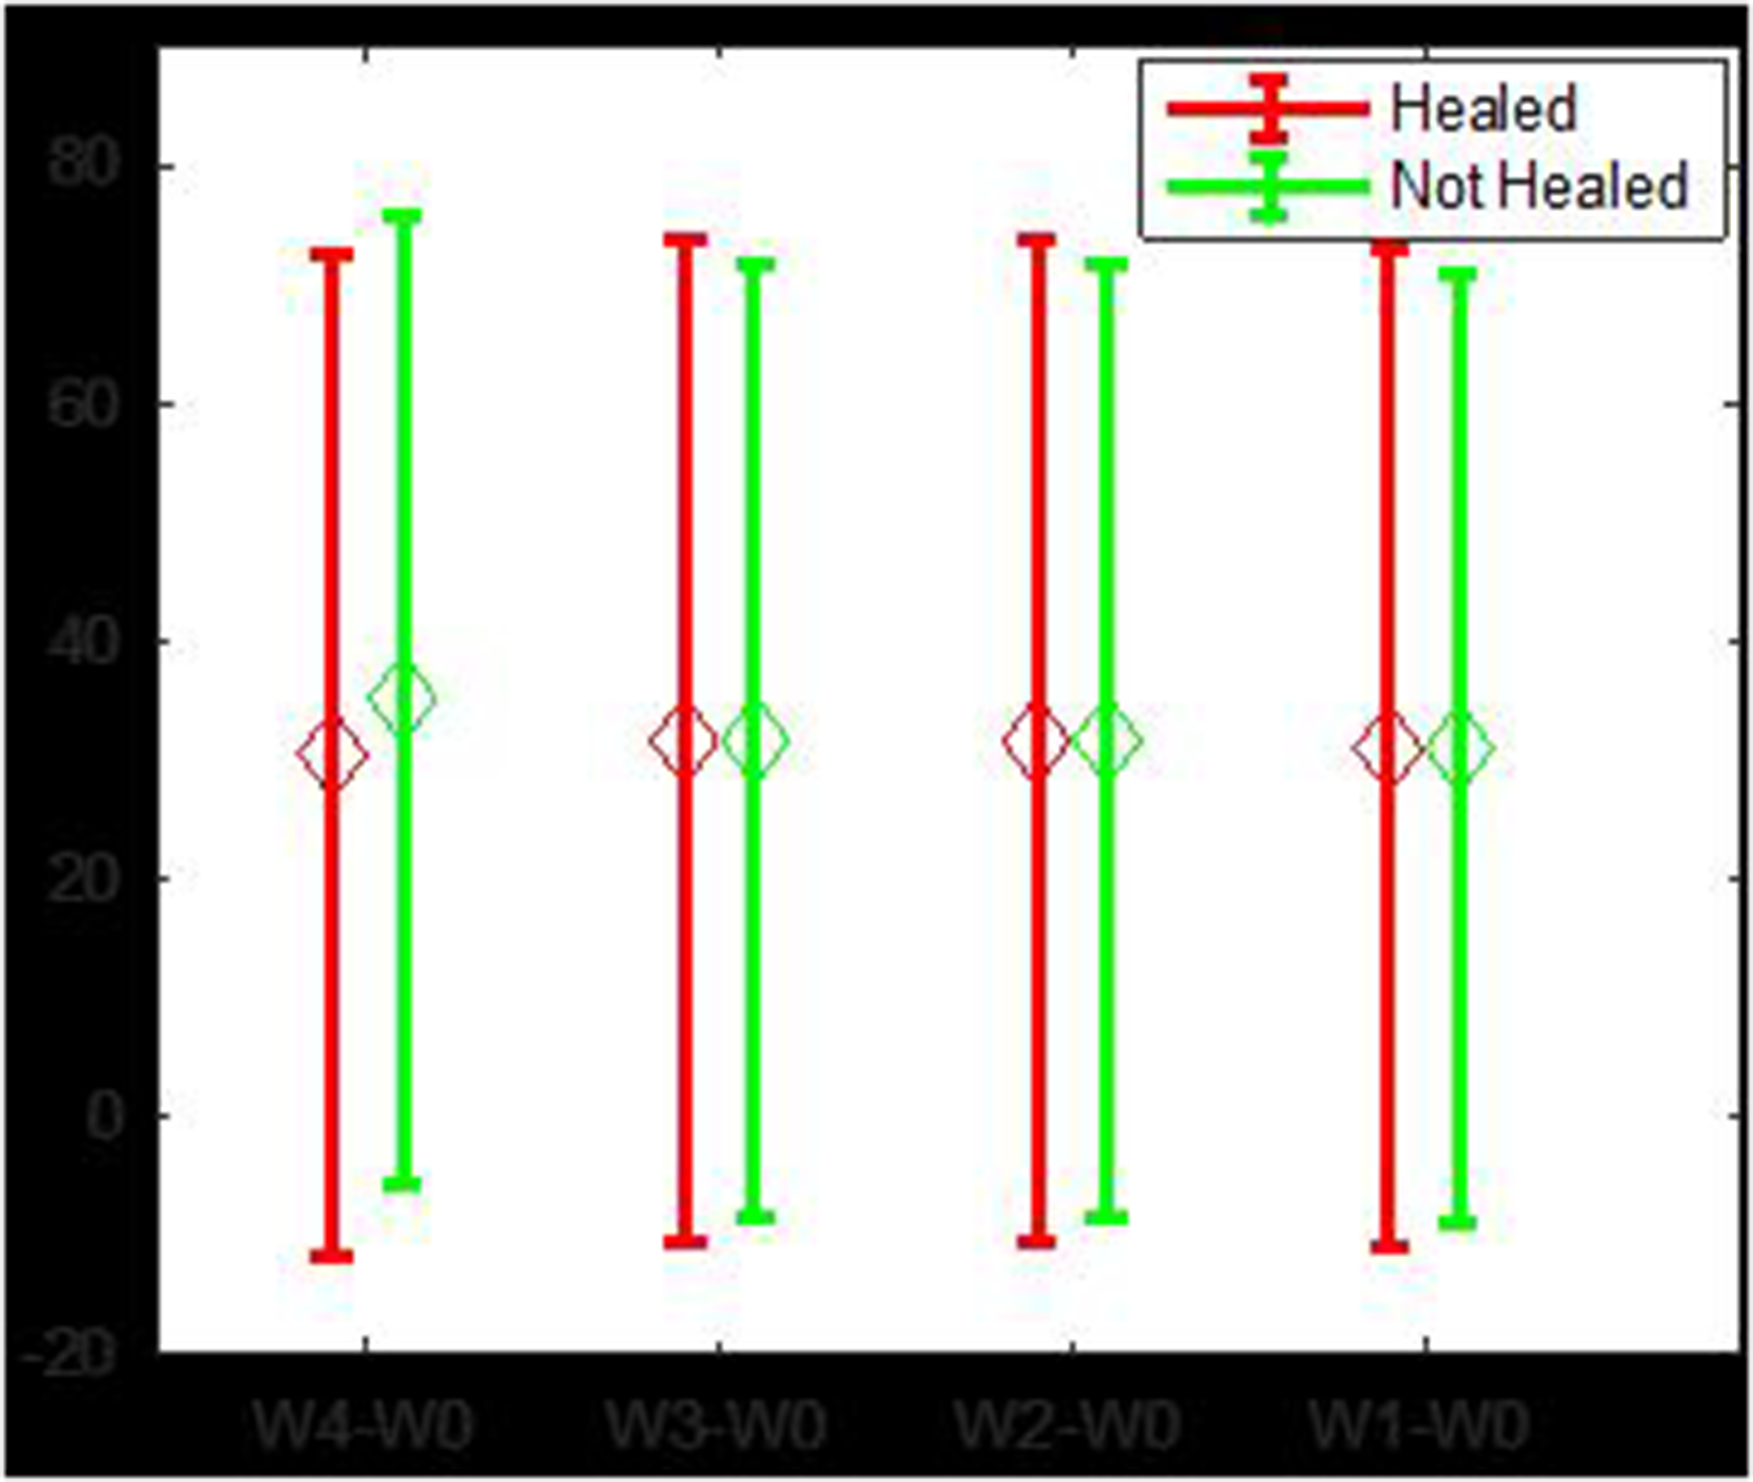
The 95% confidence interval (CI) of healed and unhealed digital planimetry features. X-axis label: average red, green, and blue (RGB) value of wound surface area. Y-axis label: relative wound surface area.
Table Showing the Results of Kruskal–Wallis Test for Area of VLUs With the Healing Status for 5 Weeks.
All of the automated machine learning algorithms failed to accurately identify most of the healed cases. The average accuracy ranged between 56% and 70%, however, the sensitivity was lower, and in the range of 20% to 40%, and specificity in the range of 59% to 78%. The classification results of SVM, quadratic discriminant analysis (QDA), decision tree (DT), and K-nearest neighbor (KNN) are shown in Table 4. The mean value of the feature for healed and unhealed images was not statistically different from that shown in the 95% CI in Figure 3.
The Performance of the Automated Machine Learning Model for Healed/Unhealed Classification Using Thermal Images. Class Balance was Maintained to Train the Classifier.
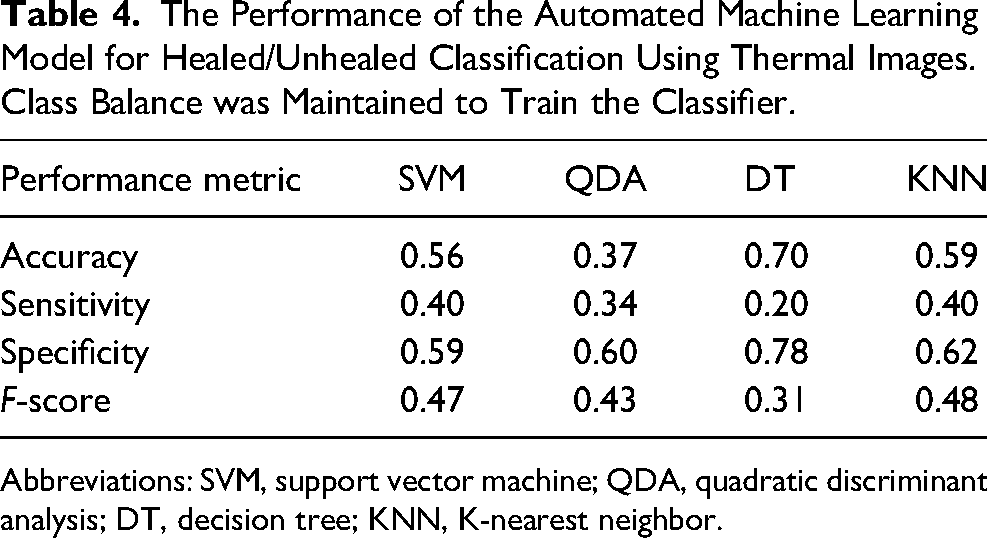
Abbreviations: SVM, support vector machine; QDA, quadratic discriminant analysis; DT, decision tree; KNN, K-nearest neighbor.
Discussion
This study shows that thermal imaging is not an accurate predictor of wound healing in VLUs when measured in the home setting. Thermal imaging is specific, but not sensitive, that is, it can identify wounds that can heal, but not those that likely would not heal. This study confirms the effectiveness of digital planimetry to predict the likelihood of VLU healing across each of the 5 time points measured. Therefore, our hypothesis that thermal imaging can predict the healing trajectory of VLUs better than the digital planimetry technique is disproved.
Digital planimetry is a widely used and reliable technique to measure the area of the ulcers as a way to assess the healing status of ulcers. 20 Figure 3 shows that there is some overlap in the interval plots between the intervals of the healed and unhealed cases. This indicates that while digital planimetry was suitable for distinguishing between most ulcers that did and did not heal at 12 weeks, some smaller ulcers did not heal at 12 weeks. Wound healing is a multifactorial process, therefore, using the measurement of the surface area alone is not a reliable parameter. Other objective parameters should also be considered when assessing the likelihood of healing. Previous work has shown that age >70 years, ulcer duration >24 weeks, whether the individual lives alone, calf/ankle ratio <1.3, the wound bed is mainly slough and/or necrotic tissue, ulcer area >5 cm2, compression level is ≤30 mmHg and there is 25% ulcer reduction in 2 weeks combined, increase the likelihood of the ulcer to heal. 39
As thermal imaging is a rapid, noninvasive, and noncontact imaging technique, it would be a useful tool should it be a valid method to predict VLU healing trajectory. This study considered whether temperature can be used to predict healing of VLUs at 12 weeks, analyzing data using machine learning methods. The results obtained using thermal imaging showed that healed ulcers had a significantly smaller area (obtained using temperature distribution of the ulcers) than the unhealed ulcers at each time point measured. This was mirrored by the digital planimetry area results. However, unlike digital planimetry areas, there were a large number of variations in the thermal image areas. This led to the thermal imaging results not reaching statistical significance.
These results differ from thermal imaging of other wound types. Thermal imaging can accurately predict the healing of diabetes-related foot ulcers 17 and delayed healing in surgical wounds. 32 It is important to note that previous research using thermal or hyperspectral imaging was done in clinic settings, where there was a stable ambient temperature, consistent lighting conditions and the patient seating remained similar for all the experiments. Further, in the clinic setting when measuring diabetes-related foot wounds, the distance between the camera and the foot and the angle of the camera taking the photo were constant. 17 In the current study, all of these conditions varied as the photos of the leg were taken in participants’ homes over 5 weeks, and at different times of the day. It is important to note that wound care can be provided in a variety of settings, including in the individuals’ home, general practice, specialist clinics (usually in a hospital outpatient setting), and if the wound deteriorates, in hospital for acute care. 18 Internationally, between 40% and 68% of home nursing care involves the provision of wound care.40,41 Given that many wounds are assessed and managed in the home, it is important to evaluate the effectiveness of diagnostic methods in the settings in which they are used. In future, research using thermal imaging for wound monitoring should consider how to manage varied conditions, so that this type of technology can be valid for use in this setting. A protocol to standardize the recording of these images may reduce the variability between the weekly images. An additional disadvantage of thermal imaging is that it currently requires analysis through manual supervision. Future work addressing poor contrast would address this issue.
Of note, the duration of follow-up in this study was 12 weeks, and only 12 (15%) of the 78 ulcers healed which is different than reported in the literature. 42 This population group was older (mean 80.5 years), with almost half having >3 comorbidities, with an average ulcer duration of over 2 years, and an average ulcer area of 19 cm2. While common in people with VLUs, 43 all of these are risk factors for delayed healing, 39 and thus the cause of the bias.
Faster speed and noncontact aspect of taking images make thermal imaging an advantageous method compared to digital planimetry in assessing wound healing prognosis, however it is not currently a valid method for VLUs in home nursing settings. Further work to investigate other methods to predict healing using this type of imaging is warranted. Improved imaging process methods and the use of machine learning may facilitate the classification of images to accurately ascertain wound healing prognosis.
Footnotes
Declaration of Conflicting Interests
The authors declared no potential conflicts of interest with respect to the research, authorship, and/or publication of this article.
Funding
The authors disclosed receipt of the following financial support for the research, authorship, and/or publication of this article: This work was supported by the Trajan Scientific and Medical Pty Ltd.