
Abstract
Monitoring foot skin temperatures at home have been shown to be effective at preventing the occurrence of diabetic foot ulcers. In this study, the construct validity of using >2.2°C difference between contralateral areas on the foot as a warning sign of imminent ulceration is explored. Thirty participants with diabetes at high risk of ulceration (loss of protective sensation and previous ulceration and/or amputation) monitored their foot temperatures at six sites, four times a day for six days using a handheld infrared thermometer. Walking activity, time of day, and environmental temperature were also monitored and correlated with foot temperatures. We found that contralateral mean skin temperature difference was 0.78°C at baseline. At single sites, left-to-right temperature differences exceeding the threshold were found in 9.6% of measurements (n = 365), which reduced to 0.4% when individually corrected and confirmed the next day. No correlation was found between contralateral temperature differences and activity, time of day, and environmental temperature. We conclude that using a >2.2°C difference is invalid as a single measurement in people at high risk of ulceration, but the construct validity is appropriate if both individual corrections and next day confirmation are applied.
Key Messages
Handheld infrared thermometry was used by 30 participants at high risk of foot ulceration to monitor foot temperatures, to explore the validity of the >2.2°C contralateral difference threshold currently used as a warning of imminent foot ulceration.
A mean contralateral temperature difference of 0.78°C was found at baseline, which questions the validity of using >2.2°C as the threshold to begin treatment.
Left-to-right foot temperature differences >2.2°C were found in 9.6% of measurements, but this reduced to 0.4% when individually corrected and confirmed the following day.
Contralateral temperature differences are not correlated with walking activity, environmental temperature, and time of day.
Construct validity of foot skin temperature monitoring for ulcer detection is appropriate when personalized thresholds are used, and confirmed the next day; correcting for external circumstances does not seem required.
Diabetes is the most common cause of nontraumatic lower limb amputations, which along with diabetic foot ulcers result in higher mortality and morbidity rates than many cancers. 1 A person with diabetes has a 19% to 34% lifetime risk and 2.2% annual risk of developing a diabetic foot ulcer.2,3 There is a 70% mortality risk after lower extremity amputation at 5 years for all participants with diabetes and of 74% at 2 years for those receiving renal replacement. The economic cost of diabetic foot ulcers is high. 2 Diabetic foot ulcers are the most common reason for diabetes-related hospitalization, placing a high burden on the healthcare system as these ulcers require intensive treatment. Diabetes has a negative impact on wound healing, often resulting in delayed or failed healing of diabetic foot ulcers, despite optimum treatment, increasing the risk of developing infection, and the probability of requiring an amputation.4,5 Diabetic foot ulcers should be treated within a multidisciplinary clinic that utilizes multiple health worker resources. 6 Indirect costs occur as a result of participants being incapacitated because of lengthy periods in hospital and attending weekly outpatient appointments for treatment of the diabetic foot ulcer. 7 Prevention of diabetic foot ulcers improves the participants’ quality of life and can conceivably save lives.8,9
An early sign of the imminent formation of diabetic foot ulceration is inflammation. 10 Repetitive shearing and vertical forces, either on or within the foot as a consequence of foot deformity and repetitive pressures, induce an inflammatory reaction with resultant hyperemia, elevating the local skin temperature. If localized trauma continues, skin integrity is broken and ulcers will occur. 11 Elevated skin temperatures have been shown to be reliable surrogate markers for inflammation. 11 And while first-line inflammatory markers may be dampened as a result of neuropathy in participants with diabetes, and while many inflammatory features are not easily measured as there may be subjectivity in assessing signs and symptoms such as loss of function, swelling, pain, and redness,12,13 foot skin temperature can be measured objectively to detect differences or changes.
Monitoring foot skin temperatures has been shown to help prevent the formation of diabetic foot ulcers. 12 There have been three RCTs that showed temperature monitoring prevents diabetic foot ulcer formation,13,14–15 and two recent meta-analyses that show there is a benefit for using daily foot skin temperature measurements for the prevention of recurrent plantar foot ulcers.16,17. However, in sensitivity analyses, these meta-analyses also cast some doubt on the effectiveness of the intervention,16,17 and temperature monitoring is hardly used in clinical practice. This could potentially be the result of the validity of using a contralateral difference as a warning sign in foot skin temperature monitoring, as the construct validity of the temperature difference used in these studies to predict the formation of diabetic foot ulcers is yet to be determined. While a 2014 study determined the contralateral difference of >2.2°C as the most optimal cut-off for detection of foot complications, the area under the curve of this cut-off was only 0.65, and the mean contralateral temperature difference in people with noninfected foot ulcers was only 1.36°C. An observational study in 2017 showed high sensitivity, but—more importantly—low specificity and very low positive predictive value of this threshold. Collectively, these findings question the construct validity of the contralateral temperature difference used in the RCTs on this topic.
Temperature differences may vary as a result of ambulatory activity, time of day, and ambient temperature, but also each foot may have an individual temperature pattern. 18 These factors influencing skin temperatures could lead to false positive or false negative results, which in turn may lead to under or overtreatment when temperature monitoring is used. If this is the case, then each patient will need to be given an individual temperature at which to commence preventative action. As a first step, a 2017 study investigated the validity of using >2.2°C as the threshold for impending ulceration in participants with neuropathy, but without ulcer history. 19 In these participants at low or moderate risk of ulceration, for whom this treatment is not recommended in guidelines, they found that the >2.2°C left-to-right foot temperature threshold was not valid as a single measurement. Validity, however, improved to acceptable levels when an above-threshold temperature difference was confirmed the following day and, crucially, further improved with individual correction based on baseline contralateral temperature difference. The threshold was independent of time of day, environmental temperature, and walking activity. However, to date, no studies have been undertaken to validate foot skin temperature measurements in people for whom this treatment is recommended: those at high risk of ulceration. Our aim was therefore to assess the construct validity of the >2.2 °C temperature difference in detection of impending ulcers, and to also investigate the impact of influencing factors or an individual temperature pattern on this difference in people with diabetes and at high risk of foot ulceration (ie those with loss of protective sensation and a history of foot ulceration and/or lower extremity amputation).
Method
A convenience sample of 30 participants with type 1 and 2 diabetes with loss of protective sensation, previous diabetes-related foot ulcer, and/or amputation were recruited from the Multi-Disciplinary High-Risk Diabetes Foot Service at the Diabetes Centre in Australia. Participants were eligible for this study if classified in risk group 3 using the International Working Group on the Diabetic Foot (IWGDF) risk stratification system;20,21 this means participants had had to be diagnosed with peripheral neuropathy and a history of foot ulcer or lower extremity amputation. Participants were excluded if they had a hallux amputation, as that would prevent them from measuring the temperature at that location. Participants with previously diagnosed peripheral artery disease (PAD) were not excluded from this study. Participants had to be able to use the equipment provided or have a carer who was willing to help with the temperature measurements.
All the initial screenings were performed by the same podiatrist and consisted of a neurological and vascular assessment. The neurological assessments were performed using a 128 Hz tuning fork and 10 g Semmes-Weinstein monofilament. Peripheral neuropathy was defined as two out of three incorrect answers on application of the tuning fork or monofilament as per the current guidelines.20,21 The vascular examination consisted of palpating the posterior tibial and dorsalis pedis arteries. PAD was defined as a non-palpable posterior tibial or dorsalis pulse and a toe pressure of ≤59mmHg. 22 Foot deformity was defined as any contracture that could not be fully corrected manually, for example, hallux valgus, clawed/hammer toes, hallux rigidus, and ankle equinus.
An “impending ulcer warning signal” was defined in three different ways, as different definitions have been used in previous studies. Definition 1: Observing a >2.2°C difference at a single measurement. Definition 2: Observing a >2.2°C difference during two subsequent measurements. Definition 3: Observing a >2.2°C difference during one measurement and at the same time the next day. False-positive outcomes (ie warning signal without subsequent development of a foot ulcer) and false-negative outcomes (ie no warning signal despite the development of a foot ulcer) using each definition were counted.
Foot Temperature Measurements
Plantar foot skin temperatures were measured using a handheld infrared thermometer (TempTouch; Diabetica Solutions Inc.). This thermometer measures when its tip gets in direct contact with the skin, with distance from the thermometer to skin thereby always the same. Baseline foot skin temperatures were collected at the initial visit while simultaneously showing the participants how to use the thermometer. Participants measured foot skin temperatures four times a day for 6 consecutive days: (a) on waking up; (b) between 11:00 h and 13:00 h; (c) between 17:00 h and 19:00 h; and (d) just before bed. Foot temperatures were measured on six plantar sites: hallux, first, third, and fifth metatarsal head, central midfoot, and heel. A study diary was provided for participants to record the measurements. Participants were advised to contact the researcher if a temperature difference of >2.2°C was recorded on identical sites on the left and right feet on consecutive days.
After measuring the temperature at six locations on both feet at baseline, the mean foot temperature was the average of these six measurements, and the foot with higher temperature was denoted as “warmer foot”. The baseline difference was also used to calculate a personalized temperature difference threshold, by correcting the threshold of >2.2°C contralateral difference for this baseline difference. For example, if the left foot was 0.5°C warmer at baseline, an “impending ulcer warning signal” was noted if the left foot was >2.7°C warmer, or if the right was >1.7°C warmer.
Activity Monitoring
Walking activity was monitored using a Stepwatch™ Step Activity Monitor (Orthocare Innovations LLC), which was fitted just above the ankle. Additionally, participants completed an account of their daily activities in their study diary.
Environmental Temperature
A standard thermometer (TFA Dostmann GmbH & Co.) was used to measure the environmental temperature at the same four time points the skin temperature was being measured. The environmental temperatures were also recorded in the study diary.
Data Analysis
General patient data were to be presented as mean with standard deviation. Primary study parameters were initially analyzed using descriptive statistics to ascertain whether any patterns could be established between contralateral limbs throughout the day. Mean and standard deviation was used to present data between: (1) Contralateral feet and (2) Different participants. If a pattern was observed, then data were to be analyzed with within-subject t-tests and multivariate analysis of variance. Data related to the secondary parameters were analyzed using Pearson correlation coefficients. The statistical analyses were carried out using the statistical package for the social sciences (SPSS, IBM Corporation).
A convenience sample of 30 participants with a history of neuropathy, and with a history of diabetes-related foot ulcers or lower extremity amputation was recruited as a representative sample of the population being investigated. As reference data and baseline data for the variables being measured were unavailable, sample size calculation was not possible. As in previous studies on the topic,19,23 we assumed that a sample size of 30 would provide adequate representation of the variables in foot skin temperatures and their association with other influencing factors.
Results
Thirty participants were recruited, with a mean age of 54 years, 6 female, and 25 with type 2 diabetes mellitus. Twenty-eight participants had a history of diabetic foot ulceration, all had been healed for 3 months or more, and six participants had had an amputation of a lesser digit. Nine participants were previously diagnosed with Charcot's neuroarthropathy which had not been active for >12 months. Six participants had mild bilateral peripheral arterial disease with toe pressures of 40 to 59 mmHg.
The warmer foot was the foot with the most recent ulcer in 97% of participants (n = 29). The warmer foot was statistically significantly warmer, with a mean contralateral temperature difference of 0.78°C (range 0.39-1.55; Table 1). Mean contralateral temperature for the nine participants with Charcot was 0.81 (range: 0.60-1.55), for the six participants with PAD was 0.86 (range: 0.59-1.30), and for the remaining 15 participants was 0.71 (range: 0.39-1.18).
Baseline Foot Skin Temperatures.
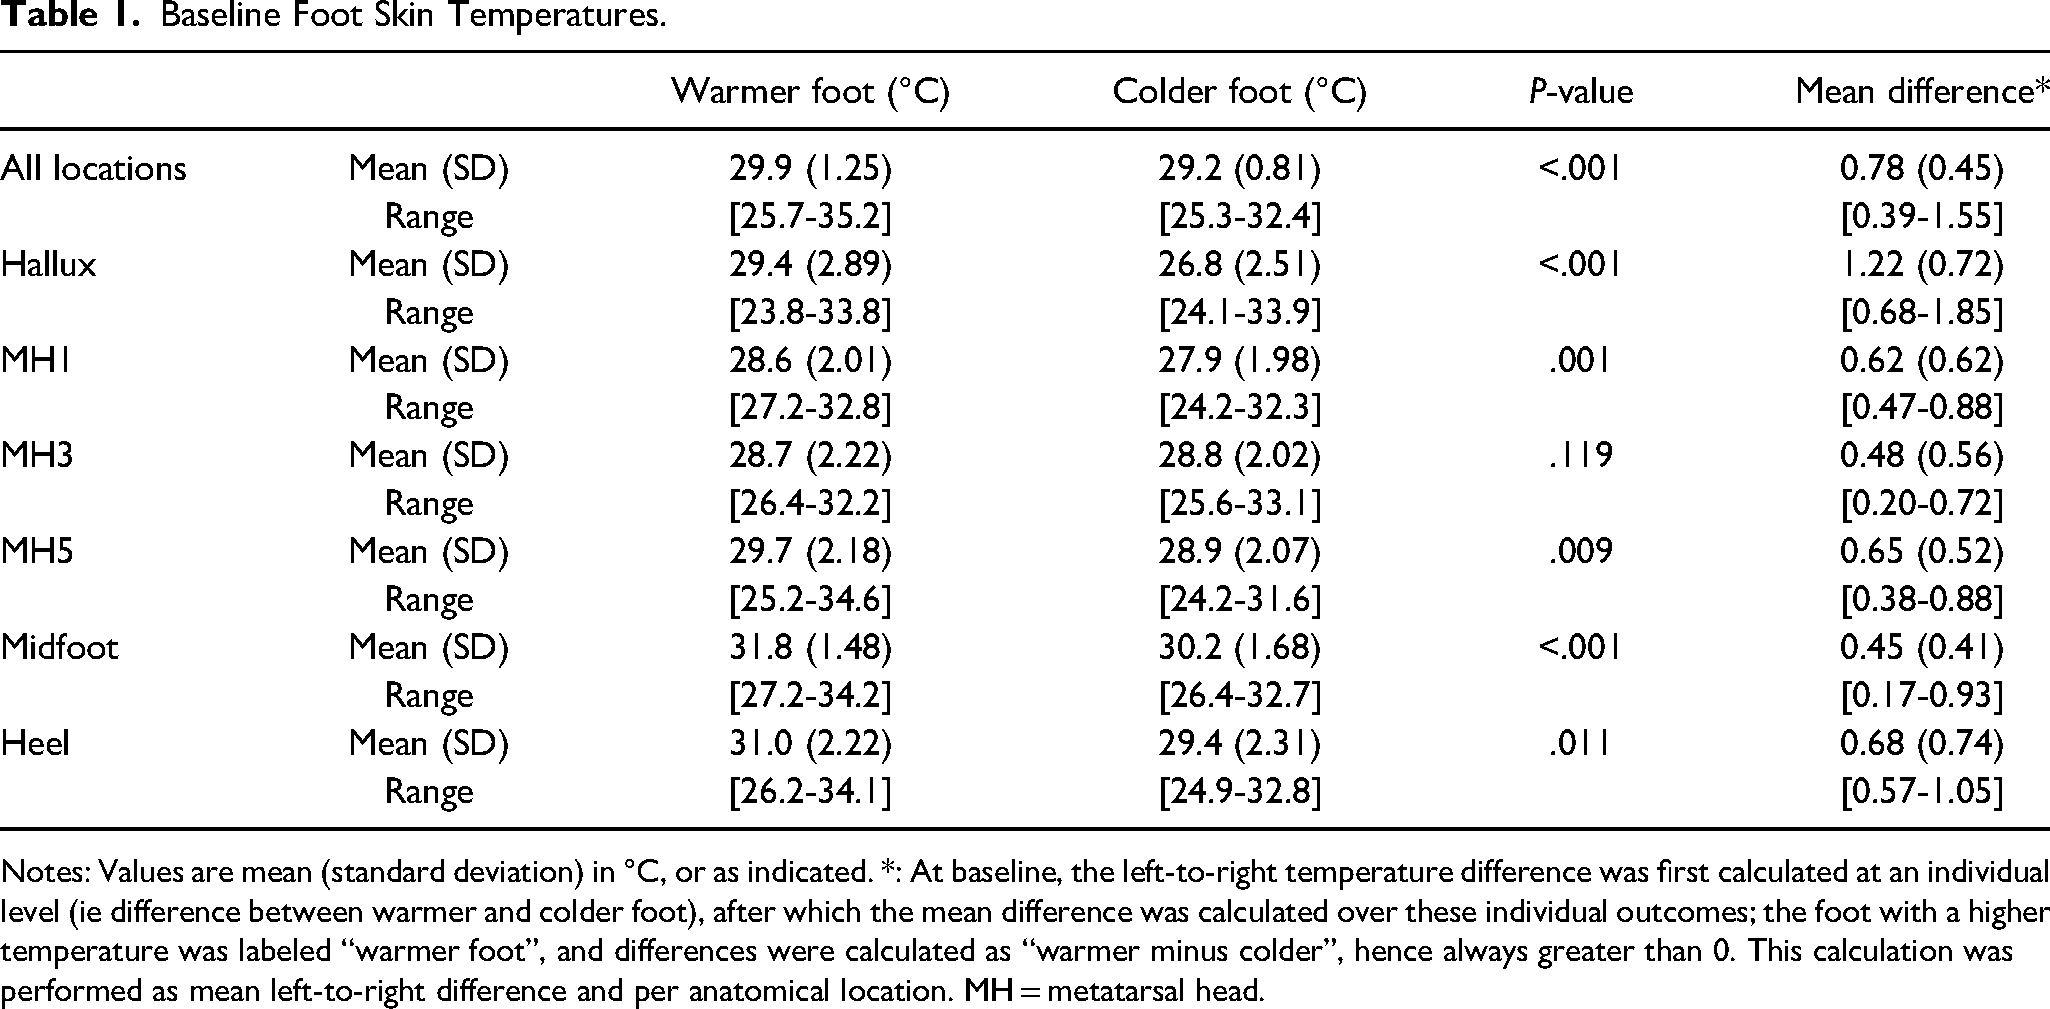
Notes: Values are mean (standard deviation) in °C, or as indicated. *: At baseline, the left-to-right temperature difference was first calculated at an individual level (ie difference between warmer and colder foot), after which the mean difference was calculated over these individual outcomes; the foot with a higher temperature was labeled “warmer foot”, and differences were calculated as “warmer minus colder”, hence always greater than 0. This calculation was performed as mean left-to-right difference and per anatomical location. MH = metatarsal head.
Temperature was higher in the warmer foot on all anatomical locations, with differences largest at the hallux (1.22 °C; Table 1). These temperature differences remained during the study period, with a statistically significant mean 0.79°C difference, and largest differences found at the hallux and first metatarsal head (Table 2).
Mean Foot Skin Temperature During Study Period.
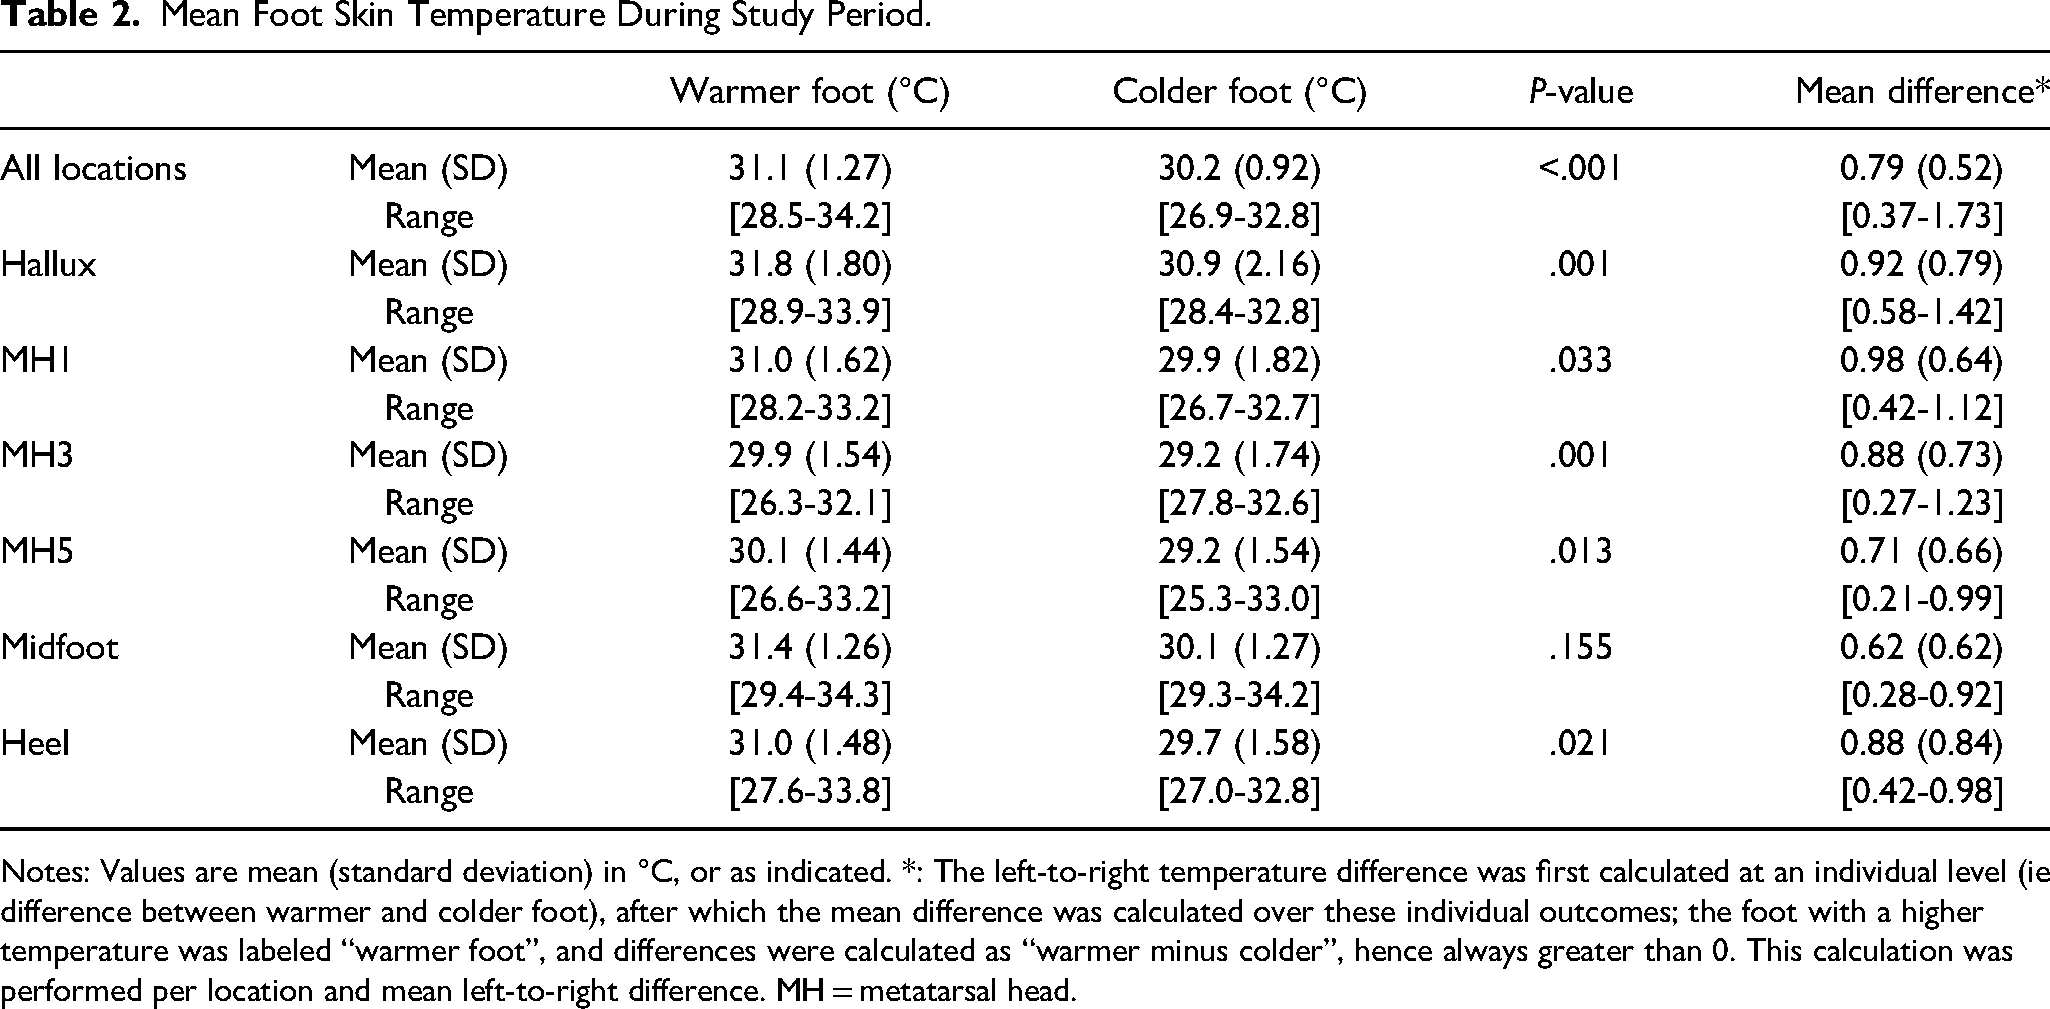
Notes: Values are mean (standard deviation) in °C, or as indicated. *: The left-to-right temperature difference was first calculated at an individual level (ie difference between warmer and colder foot), after which the mean difference was calculated over these individual outcomes; the foot with a higher temperature was labeled “warmer foot”, and differences were calculated as “warmer minus colder”, hence always greater than 0. This calculation was performed per location and mean left-to-right difference. MH = metatarsal head.
A left-to-right temperature difference >2.2°C between two anatomical locations was found 365 times (9.6% of measurements; Table 3). All but one of the participants (n = 29; 97%) measured such a difference, with an average of 11 times per participant (Table 3). Optimization by requiring a confirmation of the >2.2°C difference in the next measurement (Definition 2) improved this to 1.2%, while optimization by requiring a confirmation the next day (Definition 3) improved it to 1.5%. Personalization (by correcting for the baseline temperature difference) resulted in 5.3% measurements >2.2°C, with differences measured in 83% of participants. Combining both methods resulted in 0.8% (Definition 2) and 0.4% (Definition 3) measurements >2.2°C, with differences measured in 47% and 40% of participants, respectively (Table 3).
Number of Measurements and Participants with a Temperature Difference >2.2°C During Six Measurement Days.
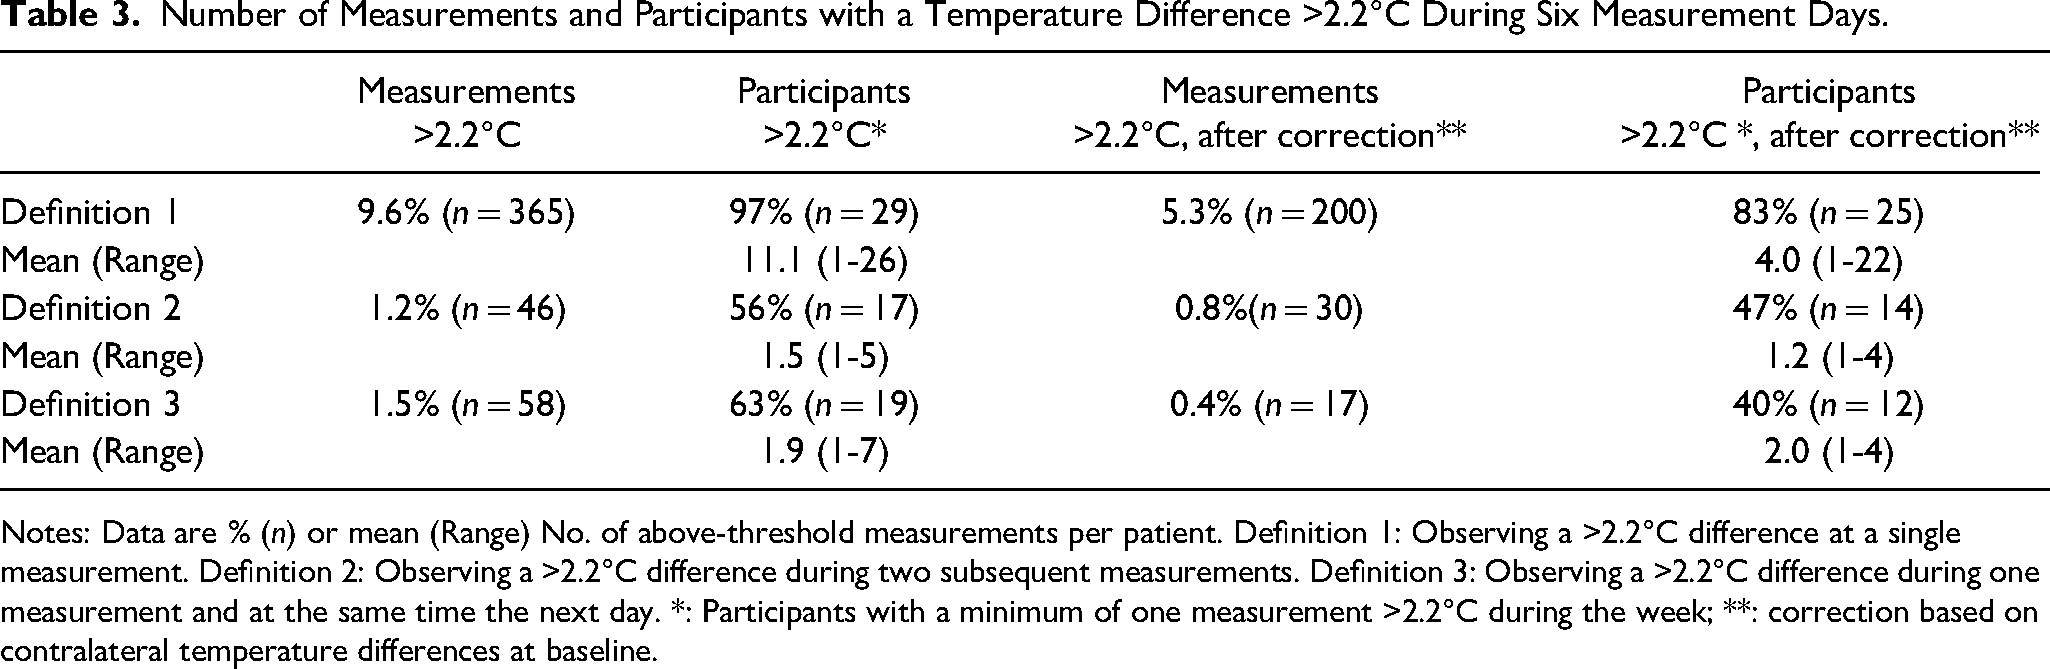
Notes: Data are % (n) or mean (Range) No. of above-threshold measurements per patient. Definition 1: Observing a >2.2°C difference at a single measurement. Definition 2: Observing a >2.2°C difference during two subsequent measurements. Definition 3: Observing a >2.2°C difference during one measurement and at the same time the next day. *: Participants with a minimum of one measurement >2.2°C during the week; **: correction based on contralateral temperature differences at baseline.
None of the participants developed an ulcer during the study. Two participants re-ulcerated in the first month after the measurements (7 and 24 days after the last study measurement, respectively). While both showed a >2.2°C temperature difference over the ulcer site at some point during the 6 days of measurement, this was not confirmed the next measurement or the next day.
Skin temperature difference was consistent throughout the day (Table 4), and no association with time of measurement was found (r = 0.022, P = .732). Participants walked an average of 5410 steps, as expected mostly during the day (Table 4). Contralateral temperature differences were not associated with walking activity (r = 0.044, P = .854), while a moderate association was found between absolute foot skin temperature and walking activity (r = 0.534, P < .001). The contralateral temperature difference was not associated with the environmental temperature (r = 0.015, P = .885).
Mean Temperature Difference, Activity, and Environmental Temperature During the day.
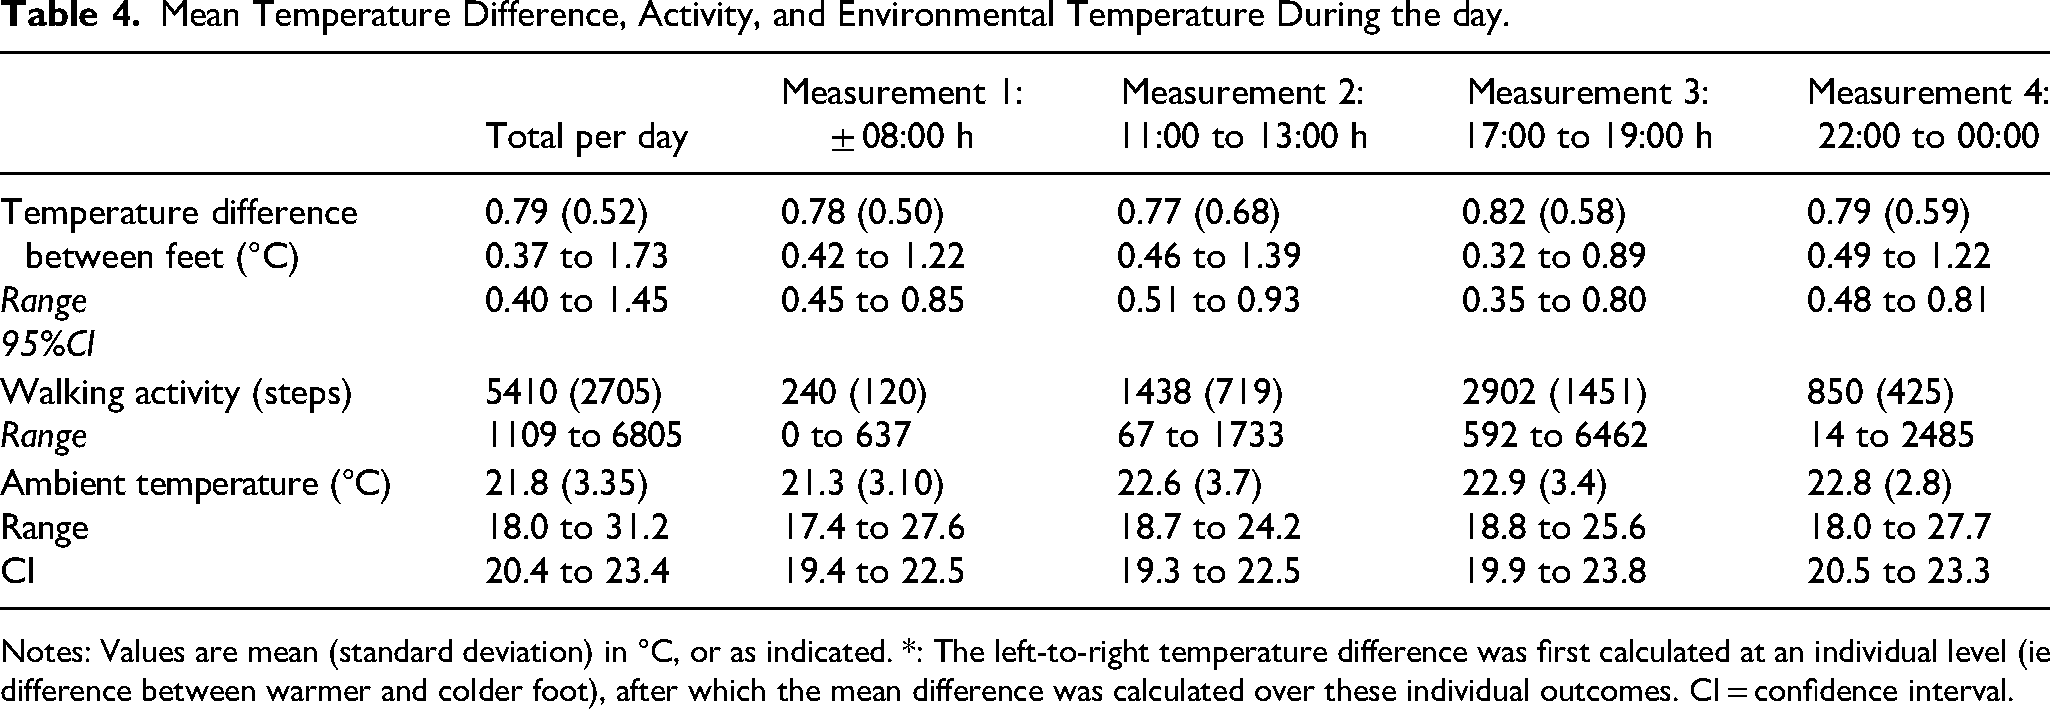
Notes: Values are mean (standard deviation) in °C, or as indicated. *: The left-to-right temperature difference was first calculated at an individual level (ie difference between warmer and colder foot), after which the mean difference was calculated over these individual outcomes. CI = confidence interval.
Discussion
While the 2019 IWGDF Guidelines recommend using daily foot temperature monitoring to prevent ulcer formation, 20 it is currently hardly used by individuals in daily clinical practice, and the construct validity of using >2.2°C as the trigger for commencing preventative care has not been validated in participants for whom this intervention is recommended (IWGDF risk 3). A key finding of the current study was that statistically significant temperature differences between left and right feet are present in people at high risk of ulceration, averaging >0.5°C, consistent throughout a week with multiple measurements, and with the foot with the healed ulcer almost always the warmer foot. This questions the construct validity of using one threshold (>2.2°C) for all people at high risk of foot ulceration. However, it also offers a relatively easy opportunity to personalize foot temperature measurements using the baseline contralateral temperature difference to individually correct the threshold. Together with a previous study 19 and with suggestions in other papers, 24 this further adds to the evidence supporting the requirement for an individualized approach to temperature measurements in a complex condition such as people with diabetes at high risk of foot ulceration.
The current study confirms the importance of having to validate temperature differences in a subsequent measurement the next day, as using a single measurement would result in many false positives. This finding aligns with a 2017 study in people at low or moderate risk of ulceration 19 and also aligns with guideline recommendations. 20 While the findings of this study may therefore seem as simply aligning with existing knowledge, recent developments have seen investigations into the use of a single temperature measurement in clinic 25 or continuous temperature measurements. 26 It is perhaps not surprising that the first did not result in ulcer prevention, while there is no evidence yet of an advantage from continuous measurements. Findings of our study are therefore relevant, to avoid further studies using single temperature measurements for clinical assessment in people at risk of foot ulceration.
Secondary findings confirm in this high-risk population the findings of an earlier study in people at low or moderate risk of ulceration. 19 We found, again, no association of contralateral temperature differences with walking activity, time of day, and environmental temperatures. These are important findings for implementation, as they confirm that baseline findings are stable, and they suggest that it is not crucial for participants to always measure at the same time, or to take their physical activity into account when performing a measurement. This facilitates implementing daily temperature measurements in people's daily life.
An unexpected secondary finding during this study was that no participant contacted the researcher to inform them of a >2.2°C difference, despite being instructed to do so. A plausible explanation might be that participants believed they received a false warning signal, or a warning signal without direct visible damage, and therefore did not feel the need to contact the researcher. However, it also emphasizes the need for participants and practitioners to establish an understanding of the instructions given, as the mechanism behind the ulcer prevention following temperature monitoring is to reduce tissue stress before damage is visible. Other systems are now available, where warning signals are automatically shared with the practitioners, and where reaching out is the responsibility of the clinician. 27 This might solve the lack of contact found in our study, as also suggested by the more frequent contact in their study. 27
None of the participants in our study developed a foot ulcer. However, two participants developed ulcers within 4 weeks, both at their previous ulcer site. And while both showed a 2.2°C temperature difference over the ulcer site at some point during the six measurement days, this was not confirmed in the same measurement the next day. This means that the average lead time of 37 days as found in another study 28 was not confirmed in these two participants. However, our study did not aim to investigate such clinical outcomes, and therefore the sample size and short duration of our study were not adequate to investigate this further. With only one observational cohort study of adequate length on temperature monitoring 28 we suggest more research remains needed to investigate if and when the foot heats up before it breaks down.
A limitation of the current study was our inability to control times when measurements were taken. As we used a relatively simple thermometer, not connected to the Internet, we had to rely on self-report for outcomes. However, participants indicated the protocol could be easily followed, and with only 6 days participants found it easy to adhere. The data also indicated that participants did have a standard routine for their measurements. Not using a more advanced system, such as a mat 28 or smartphone, 29 was also a limitation; however, such systems are more expensive, and therefore less likely to be implemented. On the other hand, such systems allow for more detailed thermography assessment instead of simply using localized temperature checking to capture the temperature changes within the foot, and should therefore be included in future research. In addition, studies over longer time periods should be considered for a better understanding of the validity of temperature thresholds in home monitoring.
Conclusion
In people with diabetes at high risk for foot ulceration, high-temperature differences between feet were consistently found, and singularly increased contralateral temperature differences >2.2°C occur frequently without developing into foot complications. Using correcting for baseline differences may make temperature measurements also applicable for people with unilateral PAD, but this needs to be studied in future research. Such differences should not be used to instigate treatment, but instead, a personalized cut-off that is optimized for individual baseline differences and confirmed the next day should be used.
Footnotes
Declaration of Conflicting Interests
The author(s) declared no potential conflicts of interest with respect to the research, authorship, and/or publication of this article.
Funding
Funding was received by WISHLIST for the purchase of equipment. They did not have any involvement in data collection, analysis, and interpretation or with manuscript writing
Ethics
The Prince Charles Ethical Committee approved the study (HREC/16/QPCH/192). Informed consent was obtained from each participant on commencement. The study was conducted in accordance with the Declaration of Helsinki.