
Abstract
Pedal acceleration time (PAT) has recently attracted clinical interest for assessing peripheral arterial disease (PAD), particularly in patients in whom ankle–brachial index (ABI) or toe pressure measurements are unreliable or not feasible, yet its diagnostic worth has not been systematically evaluated. We searched MEDLINE, Embase, ScienceDirect, and the Cochrane Library from inception to January 2026 for studies that included adults with suspected or confirmed PAD and used PAT or other acceleration-based duplex measurements, aiming to synthesize evidence on the diagnostic accuracy of PAT for PAD and chronic limb-threatening ischaemia (CLTI) classification and staging, and to explore the association between PAT and established hemodynamic indices via meta-analysis.
Nine articles were eligible, including 1115 patients and 1748 limbs. PAT across all studies illustrated strong inverse correlations with existing haemodynamic indices, with correlation coefficients typically ranging from −0.78 to −0.89, while reported diagnostic performance differed but was typically decent (AUC=0.79–0.99). A correlation meta-analysis, based on five of the included studies, revealed significant reciprocal correlations between PAT and ABI in three studies (pooled r ≈ −0.80; I2 = 0%), whereas three studies showed a statistically significant association (pooled r ≈ −0.76) between PAT and Toe–Brachial Index (TBI), with significant heterogeneity (I2 = 97%). Two studies reported inverse correlations of PAT with toe pressure (r = −0.74 and −0.41).
This study highlights that PAT consistently correlates with established perfusion indices, and appears to be a valuable measure for detecting CLTI and grading PAD.
Keywords
Introduction
Peripheral arterial disease (PAD) is a common presentation of systemic atherosclerosis that accounts for an increasing proportion of global morbidity and mortality.1,2 It results in progressive functional impairment and a decreased quality of life.3–5 In the most advanced stage, referred to as chronic limb-threatening ischaemia (CLTI), patients experience rest pain, non-healing ulcers, or gangrene, significantly increasing the risk of amputation and death by up to 40% at first year.6,7 As a result, early identification is highly critical to preserve limb salvage.
The ABI is still considered to be the most common non-invasive technique for the diagnosis of PAD, predominantly owing to its simplicity and accessibility. 8 Nevertheless, ABI may be unreliable in patients with medial arterial calcification, where arterial incompressibility can yield falsely elevated values. 9 In such cases, the use of alternative methods, eg, determining toe pressure or the TBI, is advised.10,11 However, it is challenging, in principle, to obtain these assessments, as it may be technically difficult to obtain in patients with painful ulcers, pre-existing amputations, or severe tissue loss.
PAT has emerged as one of the more promising ultrasound-based hemodynamic parameters that could overcome some of these limitations. 1 PAT is measured in pedal arteries by standard duplex ultrasound, and is defined as the time (measured in milliseconds) from the onset of the systolic rise to its maximum acceleration point (peak systole) on a Doppler arterial flow curve.1,12–14 It serves as an indirect indicator of arterial resistance, distal perfusion, and as a prognostic predictor of the healing of foot ulcers.12,15–18 Given that PAT can be obtained quickly, at low cost, and with minimal patient discomfort, it has gained ground as a convenient alternative to conventional haemodynamic monitoring.14,19,20
A recent growing body of literature in the past decade has studied the correlation between PAT and established perfusion indices, providing diagnostic information in patients with PAD.1,13,14,17,19 However, existing studies differ considerably in their design, patient populations, index tests, imaging protocols, reference standards, and diagnostic thresholds.1,18,19,21 This inconsistency in methodology leaves little basis to establish the clinical utility and harmonization of PAT measurements. Thus, the objective of this systematic review was to evaluate and synthesize the available evidence regarding the diagnostic role of PAT for the detection, staging, and characterization of peripheral arterial disease and chronic limb-threatening ischaemia.
Methods
This systematic review and meta-analysis was conducted and reported in accordance with the Cochrane Handbook for Systematic Reviews of Interventions and the Preferred Reporting Items for Systematic Reviews and Meta-Analyses (PRISMA) 2020 statement. 22 The study protocol was registered in the International Prospective Register of Systematic Reviews (PROSPERO ID CRD420261280114). Supplementary Appendix provides the compliance PRISMA checklist.
Data Sources and Search Strategy
A comprehensive search of electronic databases was conducted, including PubMed/MEDLINE, Embase, ScienceDirect, and Cochrane, from inception up to January 2026. The search strategy employed key terms such as “pedal acceleration time,” “peripheral arterial disease,” “CLTI,” and “ultrasound”. Additionally, reference lists of the identified studies were examined using backward snowballing to identify any relevant articles that may have been missed during the initial database search.
Eligibility Criteria
Studies were eligible for inclusion if they (1) enrolled adult patients with suspected or symptomatic lower-extremity PAD or CLTI; (2) assessed PAT using Doppler ultrasound; (3) used an anatomical, duplex, Doppler, or imaging-based reference standard; and (4) were prospective or retrospective observational studies, including cross-sectional and cohort designs, were eligible. Studies reporting extractable correlation coefficients between PAT and established hemodynamic indices were also included.
Exclusion criteria comprised (1) case reports, small case series without a reference standard or extractable data; (2) conference abstracts lacking sufficient methodological or outcome information; or (3) studies in which PAT could not be clearly distinguished from other non-equivalent ultrasound metrics.
Study Selection and Data Extraction
Two reviewers (N.P. and J.S.) independently screened titles and abstracts, followed by full-text assessment of potentially eligible studies. The same reviewers independently extracted data using a predefined standardized form, including study design, patient population, clinical presentation (claudication or CLTI), diabetes status, PAT acquisition protocol, reference standard, PAT thresholds, and reported outcomes. Where available, correlation coefficients between PAT and hemodynamic indices (ABI, TBI, or toe pressure) were recorded.
Any disagreements regarding study eligibility or data extraction were resolved by consensus or by consultation with a third reviewer (P.P.).
Outcomes and Endpoint Definitions
The main outcome of the systematic review was the diagnostic or hemodynamic performance of PAT. For studies reporting continuous hemodynamic comparisons, correlation coefficients between PAT and established perfusion indices, including the ABI, TBI, or toe pressure, were extracted. For studies reporting diagnostic performance, sensitivity and specificity values were recorded when available. Additional outcomes of interest included reported thresholds, AUC, and associations with clinical severity or limb ischemia classifications accuracy data.
Risk of Bias Assessment
Study quality and risk of bias were assessed using the Quality Assessment of Diagnostic Accuracy Studies (QUADAS-2) tool. 23 Each study was evaluated across four domains: patient selection, index test, reference standard, and flow and timing. For each domain, risk of bias was rated as low, moderate, or high. Concerns regarding applicability were also assessed for the first three domains. Two reviewers (NP and JS) independently performed risk of bias assessment. Disagreements were resolved through discussion and consensus.
Statistical Analysis
Due to substantial heterogeneity in study design, reference standards, and measurement protocols, diagnostic accuracy summary was not provided; instead, the results were summarized narratively. Where feasible, pooled estimates were explored.
A correlation meta-analysis was performed to quantify the association between PAT and established hemodynamic indices. Pooled analyses were conducted separately for each reference standard, including ABI and TBI. Correlation coefficients were extracted as reported. When multiple correlation coefficients were reported within a study, a single estimate per study was selected, prioritizing the highest value (eg, maximal acceleration time - ATmax or equivalent), to ensure consistency across studies. When Pearson's correlation coefficient r was available, it was used directly. When Spearman's rho was reported, it was treated as an approximation of Pearson's r. For studies reporting only the coefficient of determination (R2), the correlation coefficient was derived as r = √R2, with the sign assigned according to the expected inverse physiological relationship between acceleration time and perfusion indices.24–26 Correlation coefficients were transformed using Fisher's z transformation before pooling. Random-effects models with restricted maximum likelihood estimation were used to account for anticipated clinical and methodological heterogeneity across studies. Pooled estimates were subsequently back-transformed into correlation coefficients for interpretation. Between-study heterogeneity was assessed using the I2 statistic and τ2. Given the small number of studies available for each analysis, formal sensitivity analyses (eg leave-one-out analysis) were not considered reliable and were therefore not performed. 24 All analyses were performed using R statistical software (version 4.5.2) (R Foundation for Statistical Computing, Vienna, Austria).27,28
Results
Study Selection
Following the initial search, 428 records were obtained by database search. After the exclusion of duplicates, 301 entries underwent title and abstract screening, of which 31 were assessed in full text. Ultimately, nine studies met eligibility criteria and were included in the review.1,13,17–19,21,29–31 Figure 1 depicts the study selection process.
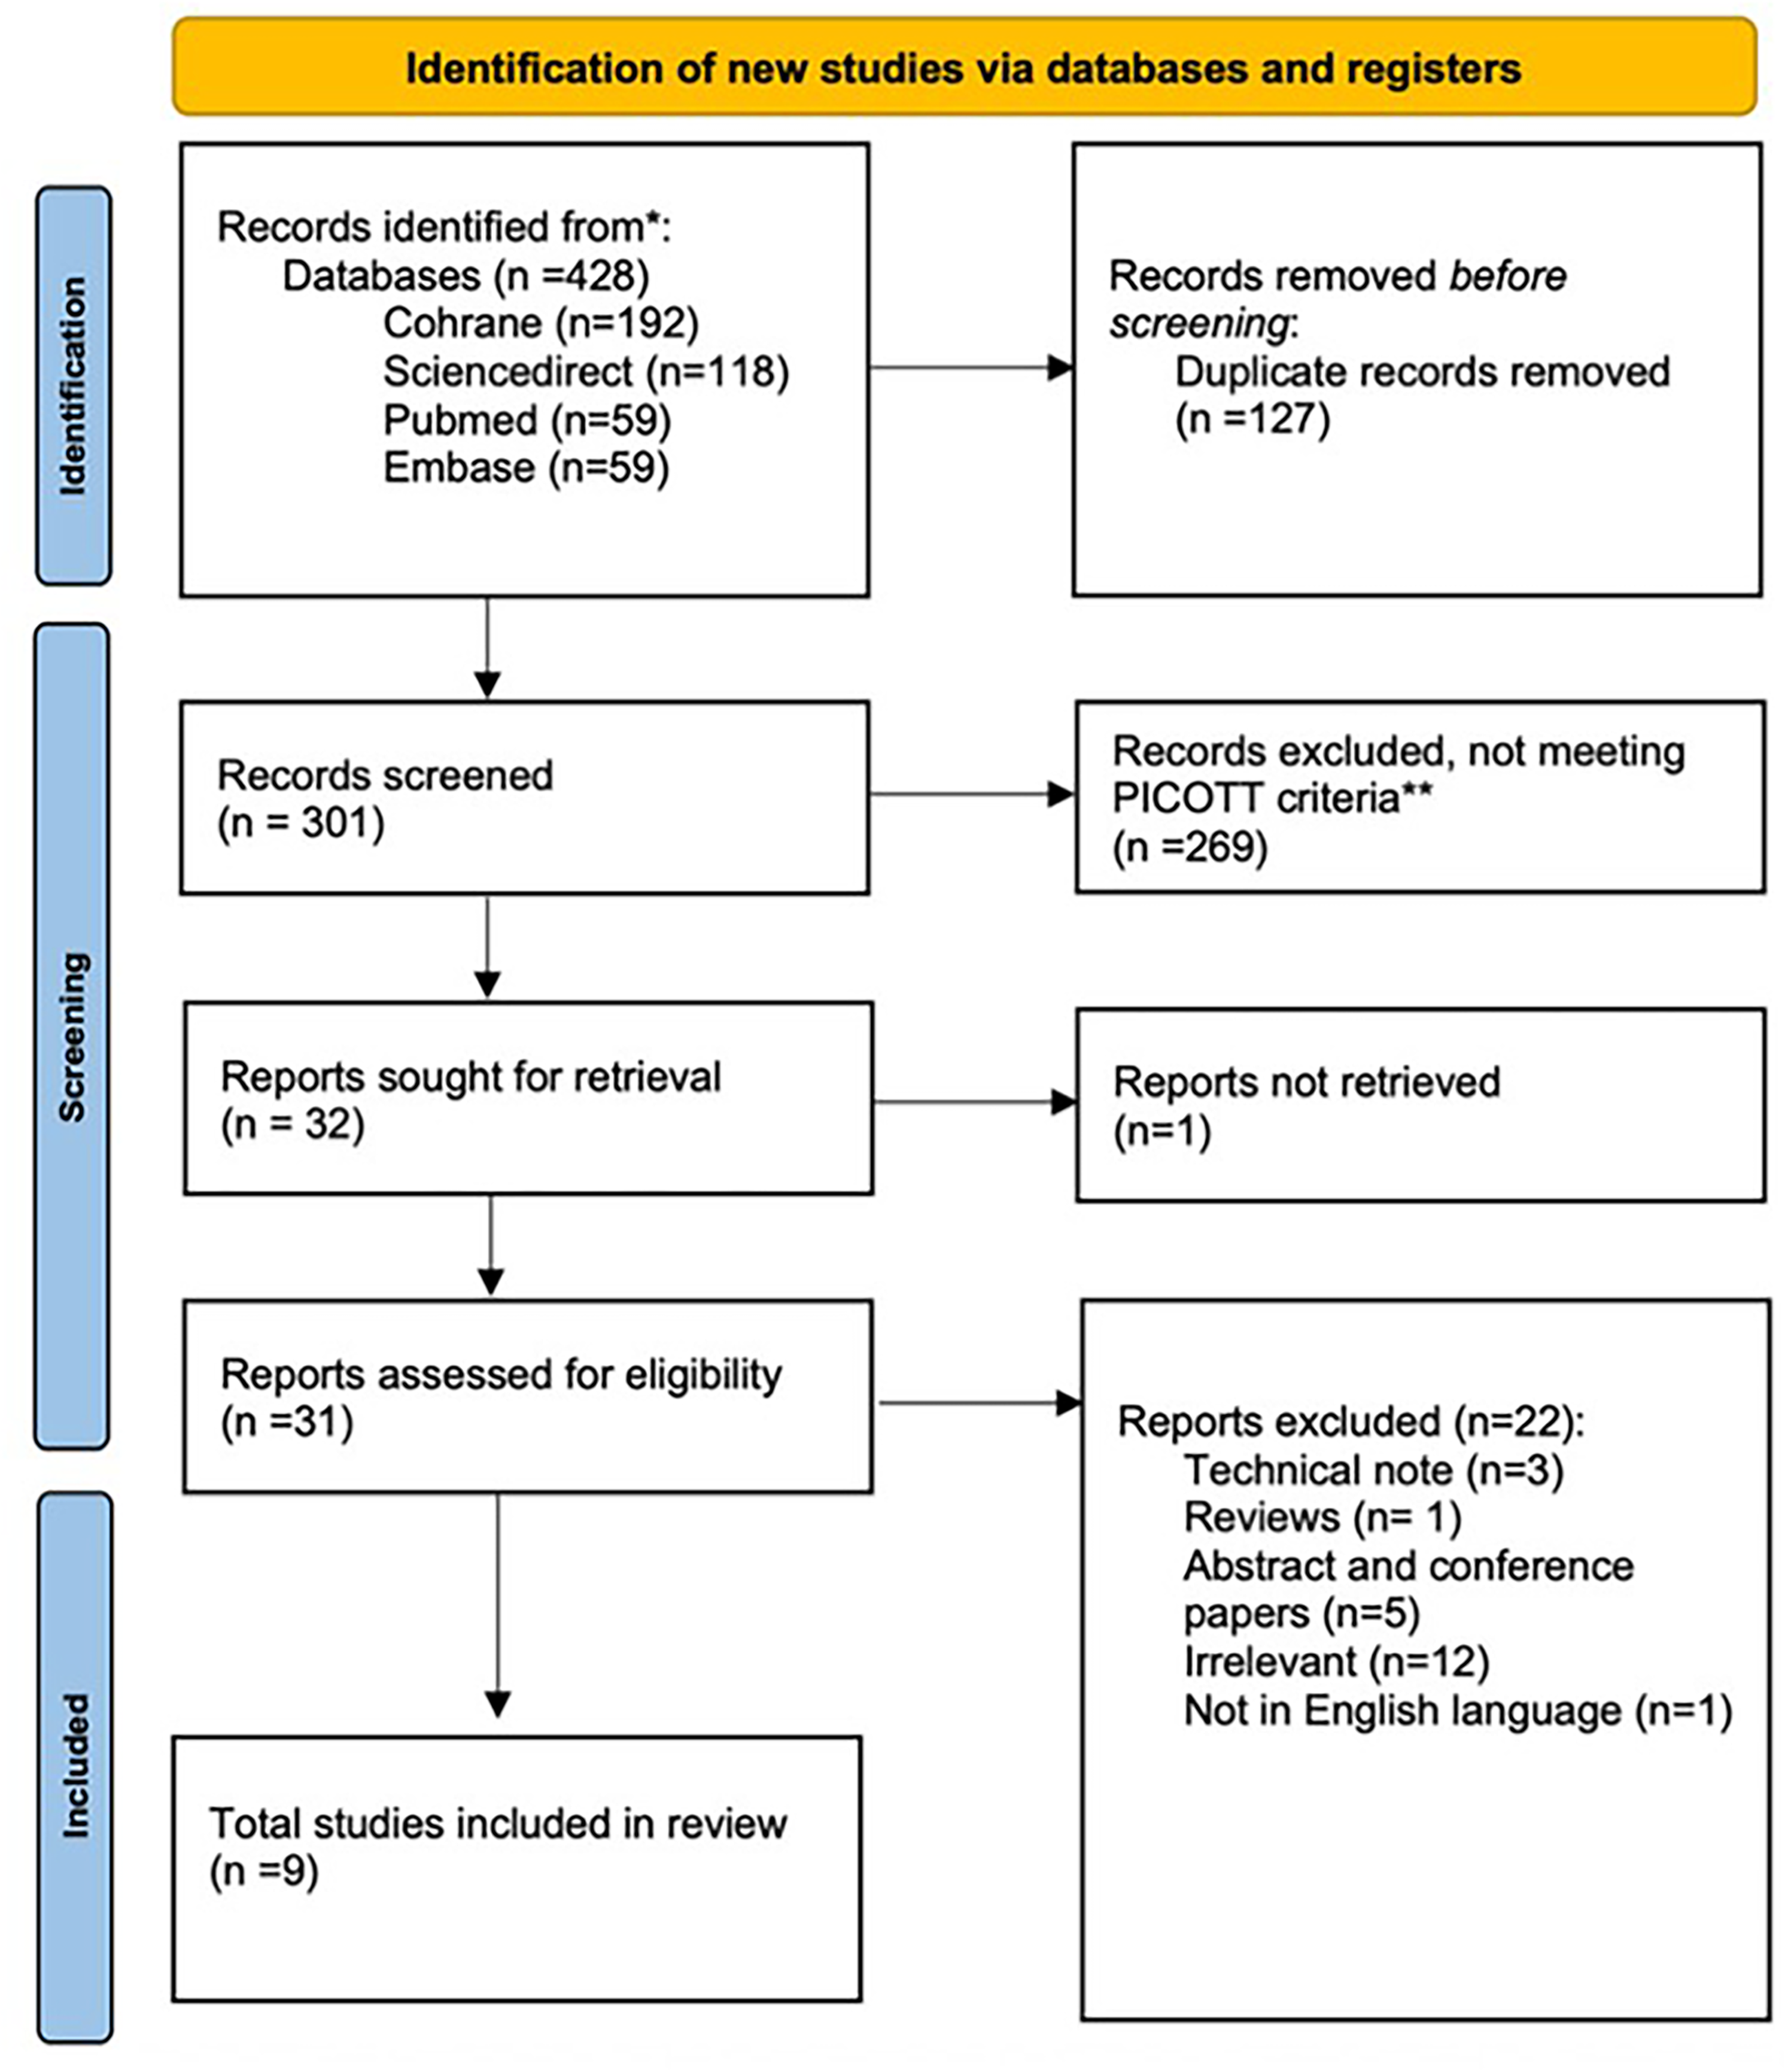
PRISMA flowchart.
Study Characteristics
The systematic review included nine studies published between 2019 and 2025, including 1115 patients and 1748 limbs. Average age ranged from 68 to 72 years, and male participants represented 66% of the population. The patient populations were affected by a large proportion of cardiovascular risk factors, making conventional assessments of ABI challenging. Duplex ultrasound-derived PAT, or its variants (maximal acceleration time or ATmax and Systolic Rise Time or SRT) were commonly used as diagnostic measures, but differences in acquisition protocols and arterial segments were significant when comparing Lateral Plantar Artery (LPA) and Dorsal Pedal Artery (DPA). Reference standards were also disparate across studies: some relied on imaging-based criteria, such as duplex ultrasound or computed tomography angiography (CTA), to detect relevant arterial disease, while others compared PAT with hemodynamic indices, which included the ABI, TBI, or toe pressure. Study characteristics are detailed in Table 1.
Characteristics of Included Studies.
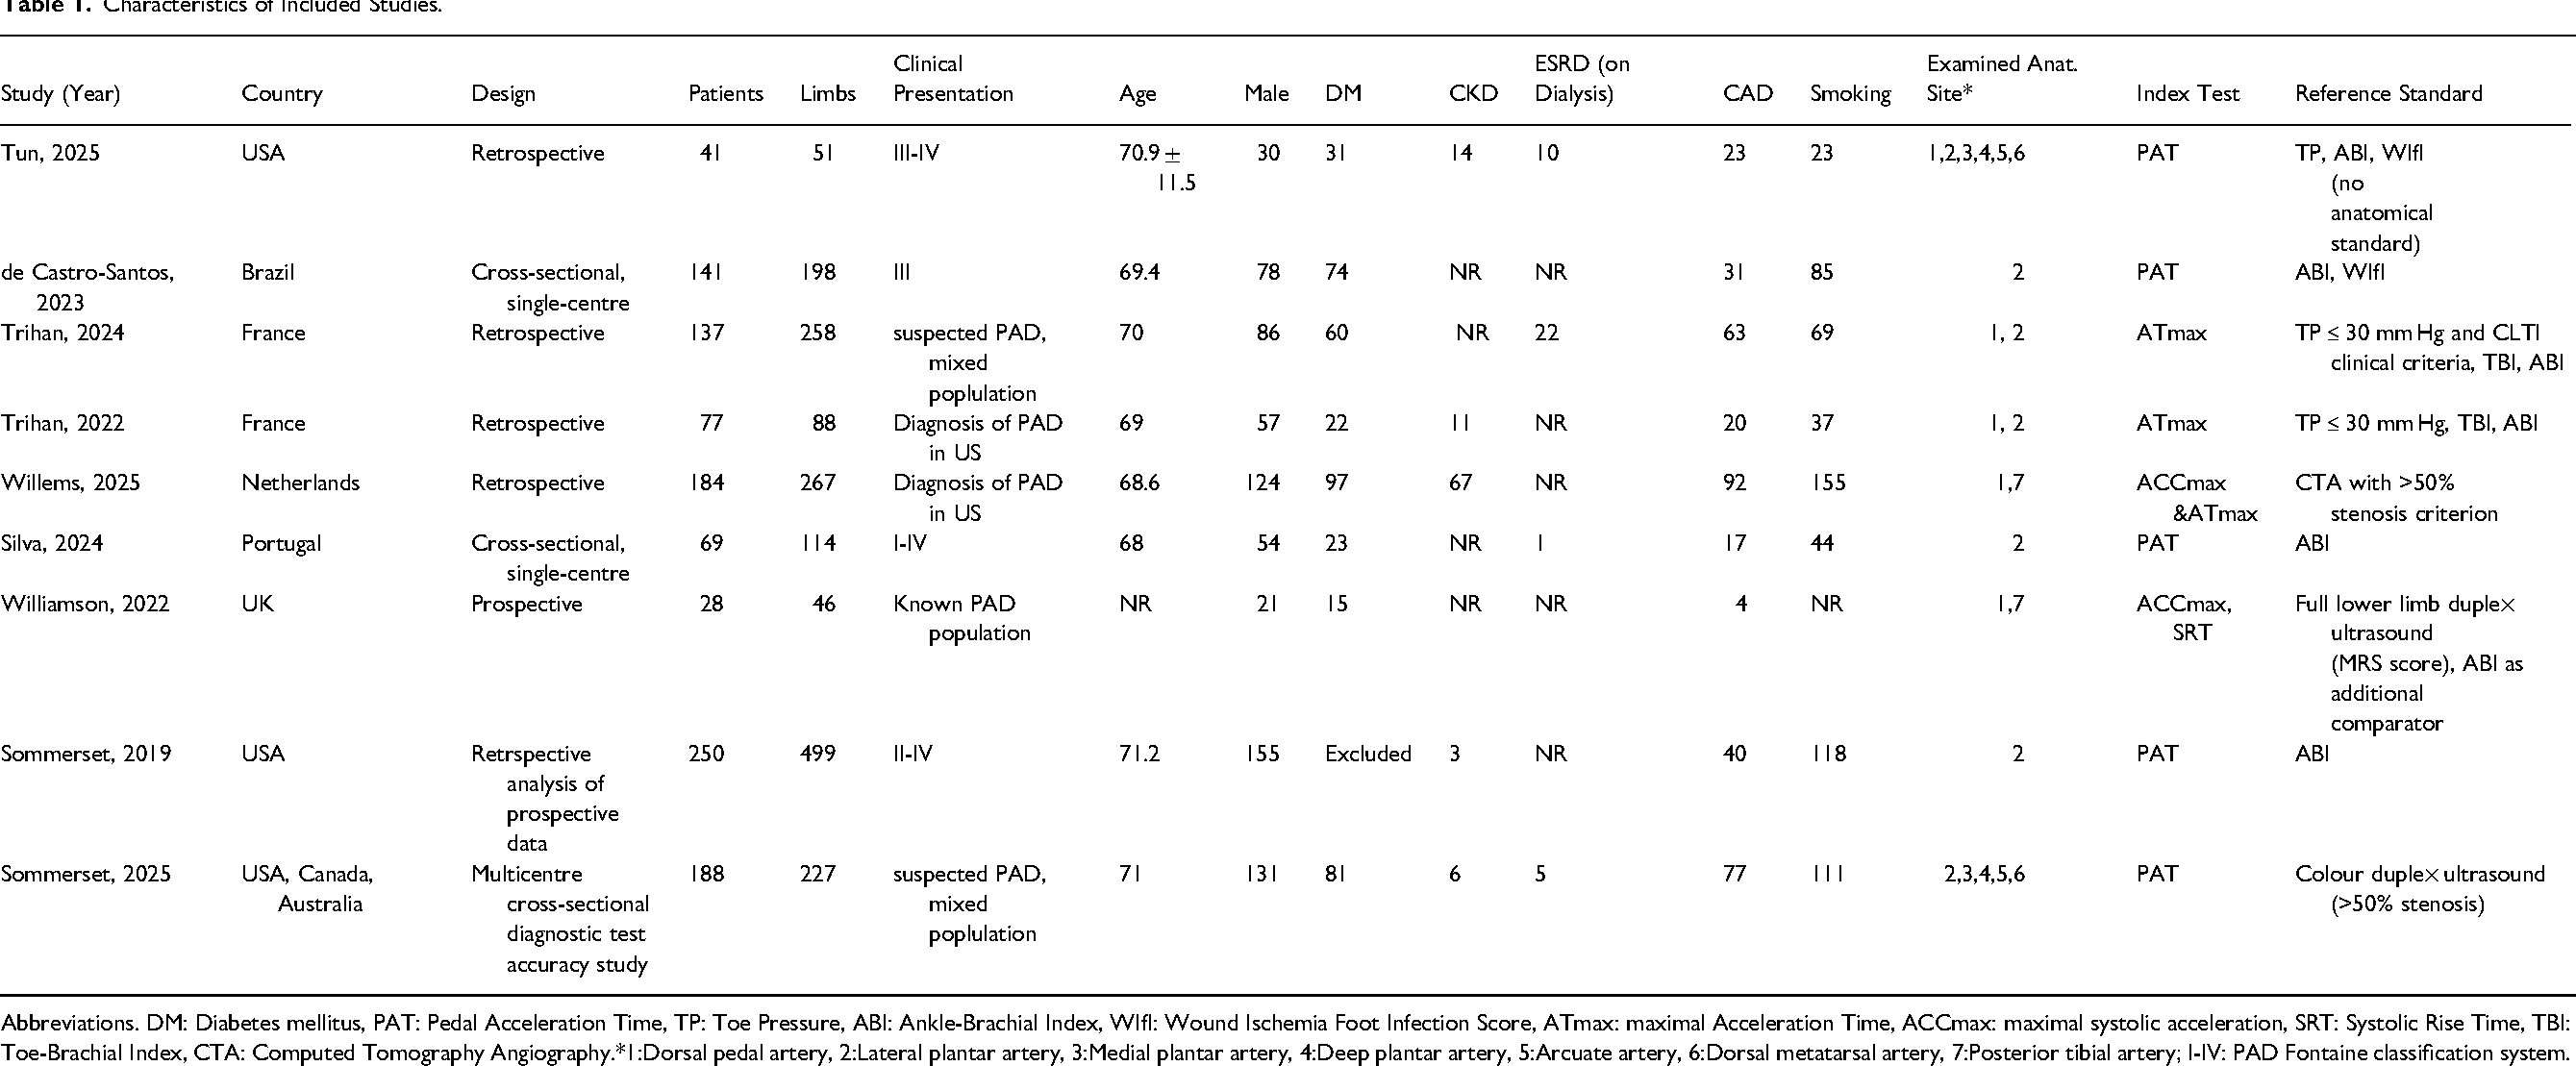
Abbreviations. DM: Diabetes mellitus, PAT: Pedal Acceleration Time, TP: Toe Pressure, ABI: Ankle-Brachial Index, WIfI: Wound Ischemia Foot Infection Score, ATmax: maximal Acceleration Time, ACCmax: maximal systolic acceleration, SRT: Systolic Rise Time, TBI: Toe-Brachial Index, CTA: Computed Tomography Angiography.*1:Dorsal pedal artery, 2:Lateral plantar artery, 3:Medial plantar artery, 4:Deep plantar artery, 5:Arcuate artery, 6:Dorsal metatarsal artery, 7:Posterior tibial artery; I-IV: PAD Fontaine classification system.
Diagnostic Accuracy
PAT and its variants, including ATmax and SRT, displayed high diagnostic accuracy in the included studies, particularly in cases of severe hemodynamic impairment. Trihan et al (2024) showed an AUC of 0.99 for detecting toe pressure of ≤ 30 mm Hg. 30 Similarly, Willems et al (2025) reported that using AT and ACCmax enabled good diagnostic performance, being able to detect a stenosis greater than 50% of the time, with AUC values of 0.96 for the posterior tibial artery and 0.92 for the anterior tibial artery. 17 Sommerset et al (2025) endorsed these results by reporting “worst-case PAT” AUC 0.79 for detecting hemodynamic significant stenosis from the iliac to pedal arteries. 19
Selection of optimal diagnostic cut-off values depended on the target clinical phenotype and reference-standard parameters. For CLTI, thresholds of ≥215 ms and >225 ms were widely used, with the first one producing high sensitivity (93%) and specificity (96%).1,13,19,30 On the other hand, investigations into the recognition of general PAD (hemodynamic major stenosis of >50%) recommended lower thresholds (eg, >85 ms for worst-case PAT or ∼112-120 ms for the tibial arteries).17,19 These results are summarized in Table 2.
Diagnostic Accuracy Results.
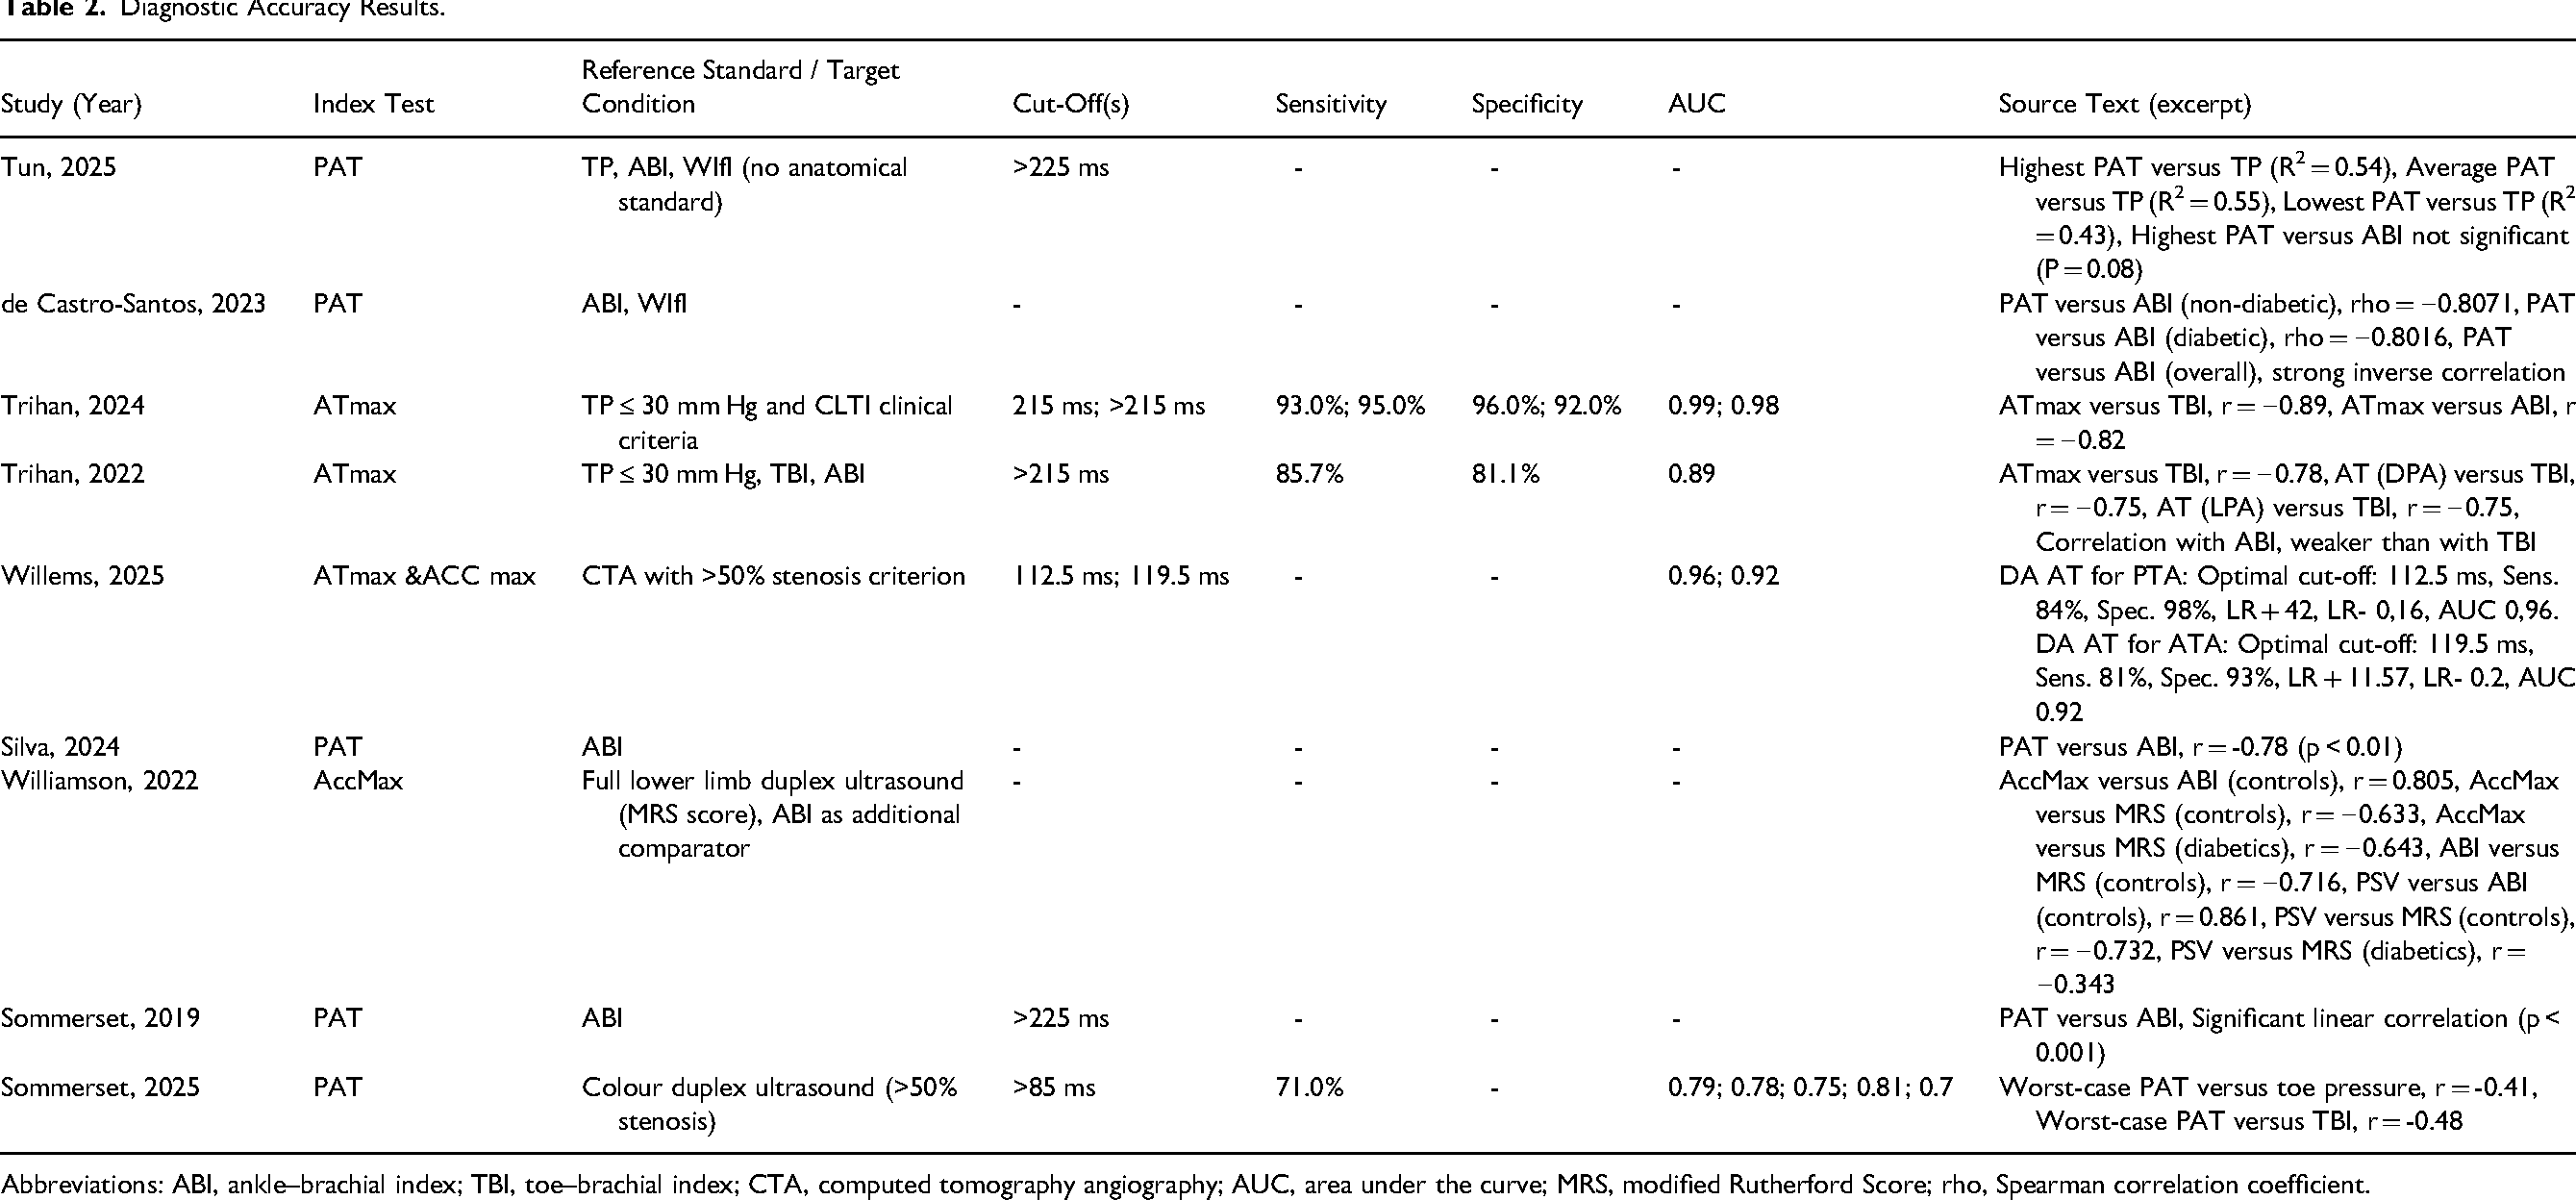
Abbreviations: ABI, ankle–brachial index; TBI, toe–brachial index; CTA, computed tomography angiography; AUC, area under the curve; MRS, modified Rutherford Score; rho, Spearman correlation coefficient.
Correlation with Hemodynamic Indices
To examine the correlation between PAT-based metrics (PAT or ATmax) and established hemodynamic indices of limb perfusion, correlation meta-analyses were conducted.
Correlation Between PAT and ABI
The analysis for ABI was based on three studies, covering 570 limbs.21,29,30 The pooled inverse correlation was significant, with a Fisher's z of −1.11 (95% CI −1.20 to −1.03; p < 0.001). The correlation coefficient was obtained after back-transformation and agreed on around r = −0.80, showing that as the acceleration time increases, the ABI decreases significantly. Heterogeneity between studies was non-existent (I2 = 0%, Q-test p = 0.60), and the estimates for individual studies were consistent, ranging from −0.78 to −0.82 (Figure 2).
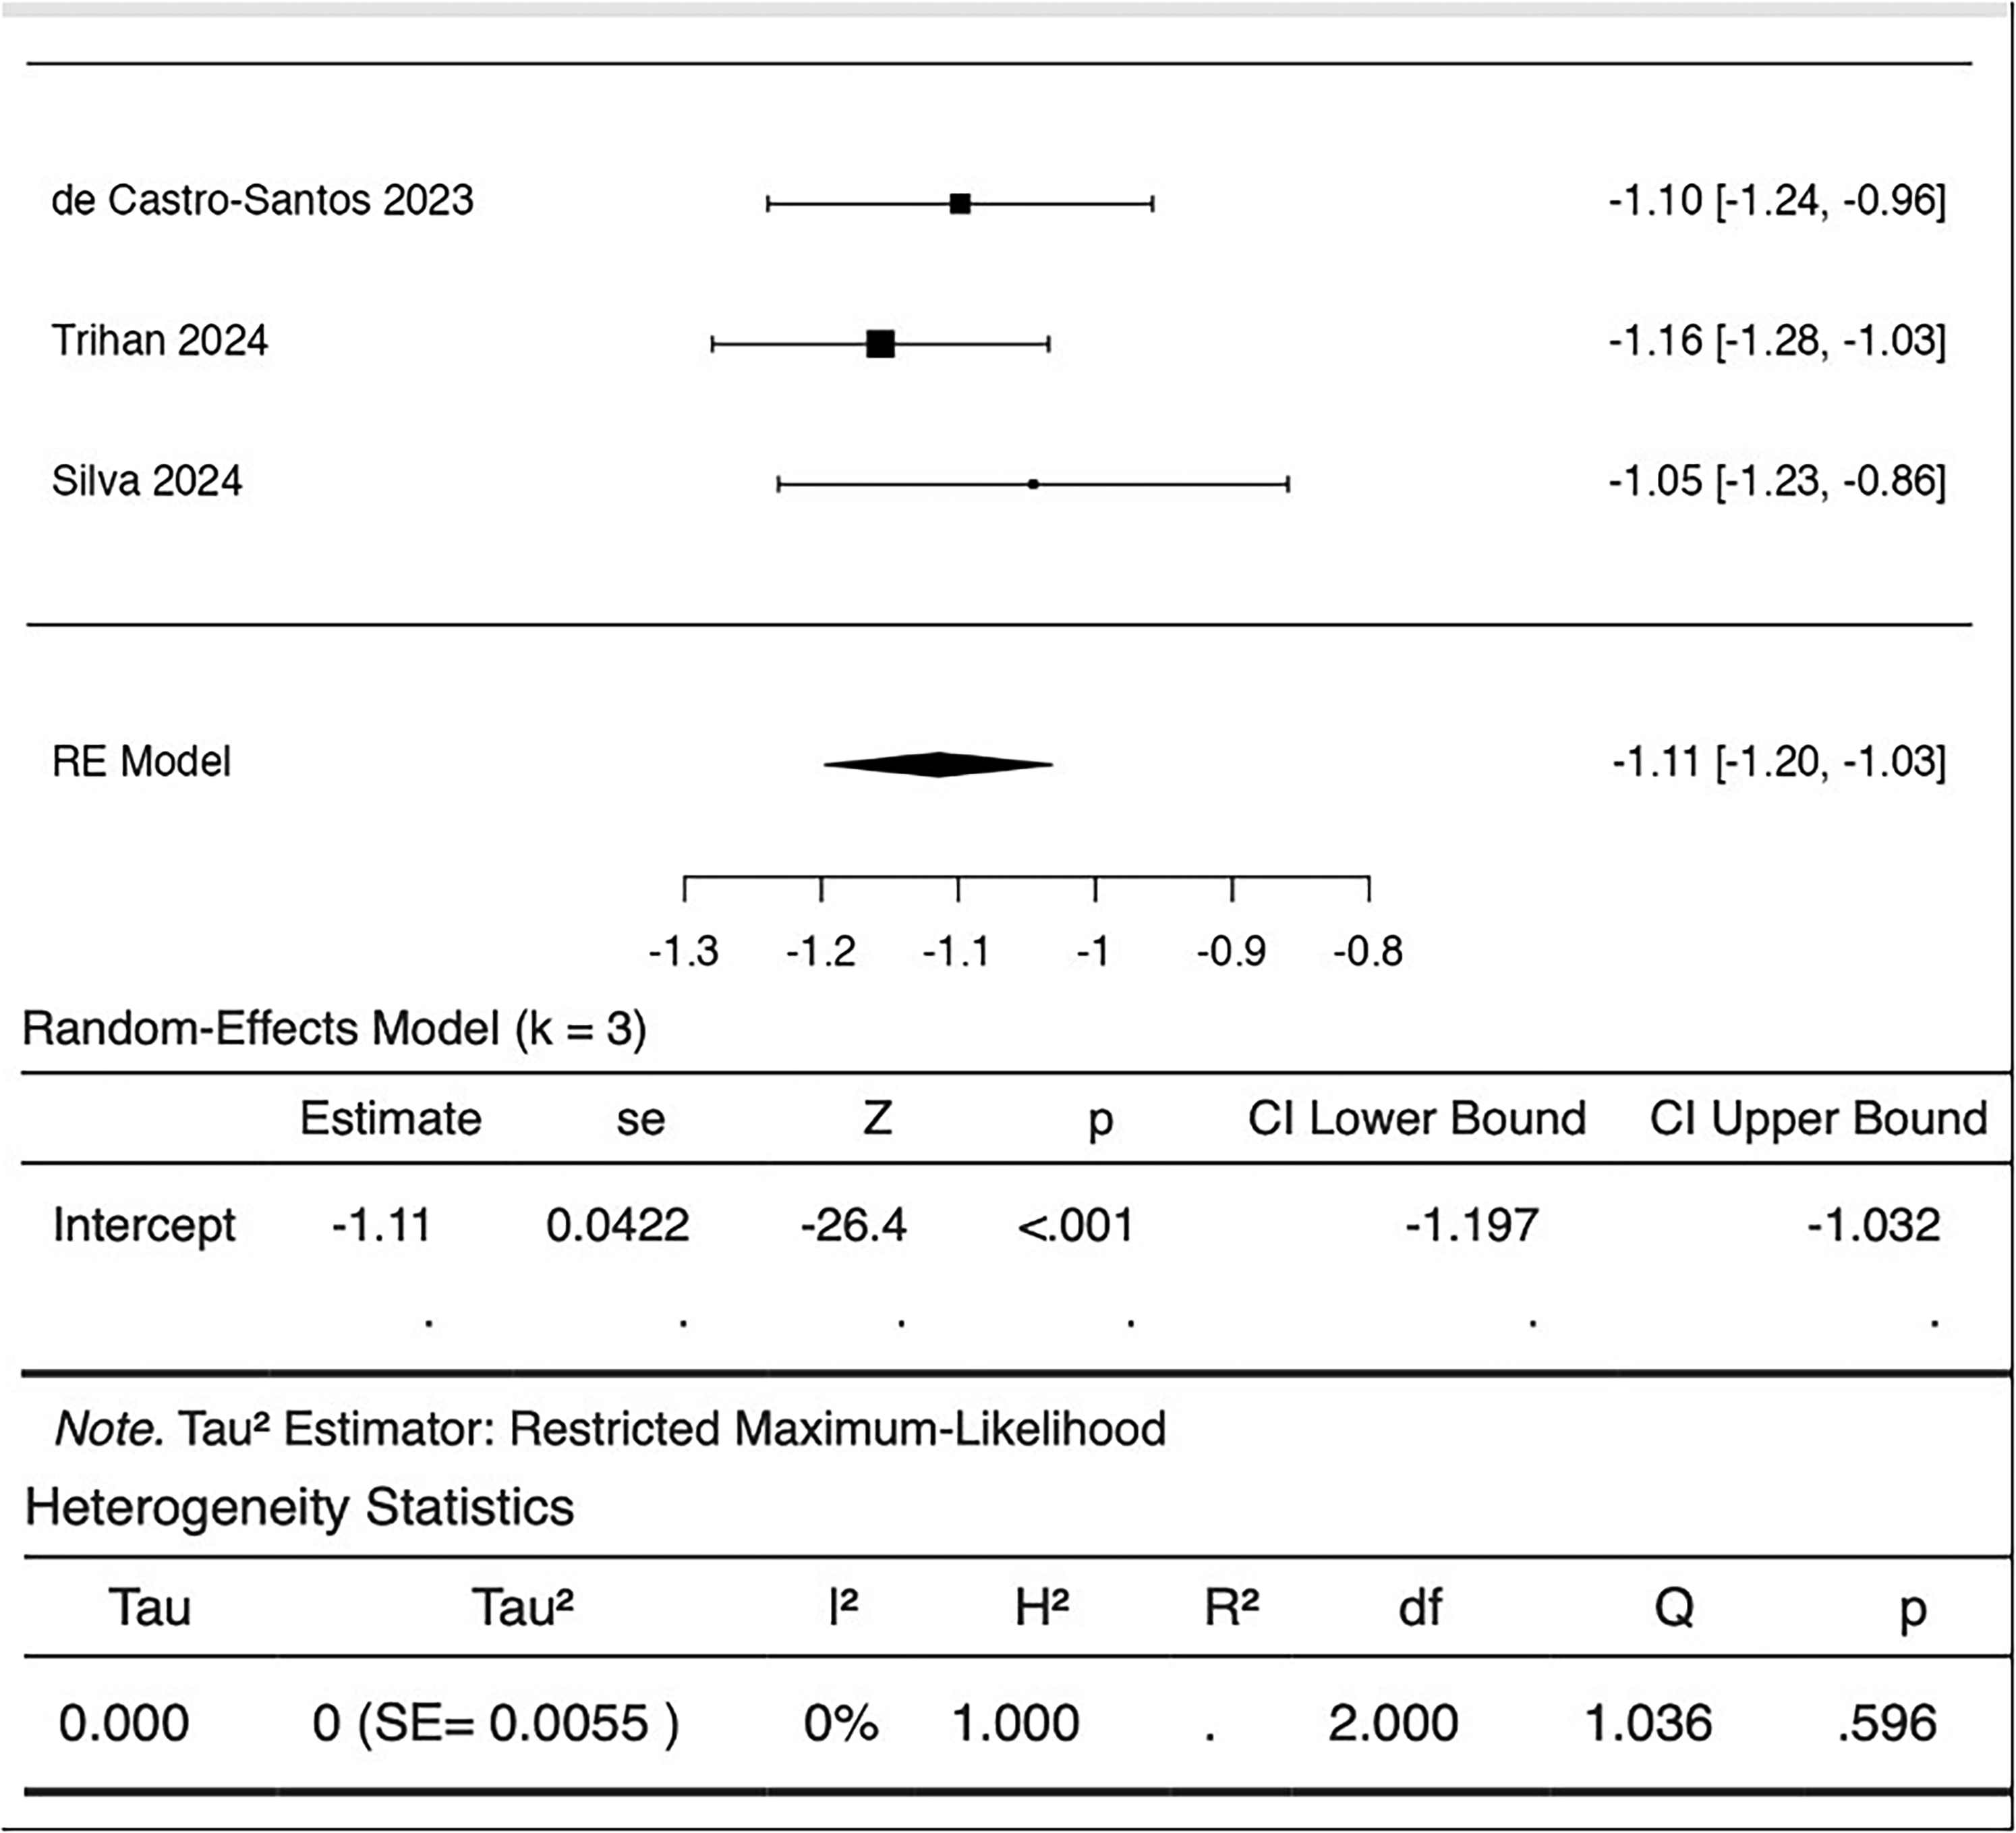
Forest plot of fisher's z-transformed correlations between PAT and ABI with pooled random-effects estimate.
Correlation Between PAT and TBI
The pooled analysis for the correlation between acceleration time and TBI covered three studies for a total of 573 limbs.13,19,30 A strong inverse association was observed, with a sum of Fisher's z of −1.00 (95% CI −1.51 to −0.48; p < 0.001). After back transformation, the pooled correlation coefficient was r = −0.76. Concerning TBI analysis, significant between-study variance was found (I2 = 97.2%, p < 0.001). Though the inverse direction of the relationship was the same for all the data, the magnitude of the relationship was much different in the cases of two studies, ranging from a moderate correlation of −0.48 to an excellent correlation of −0.89 (Figure 3).
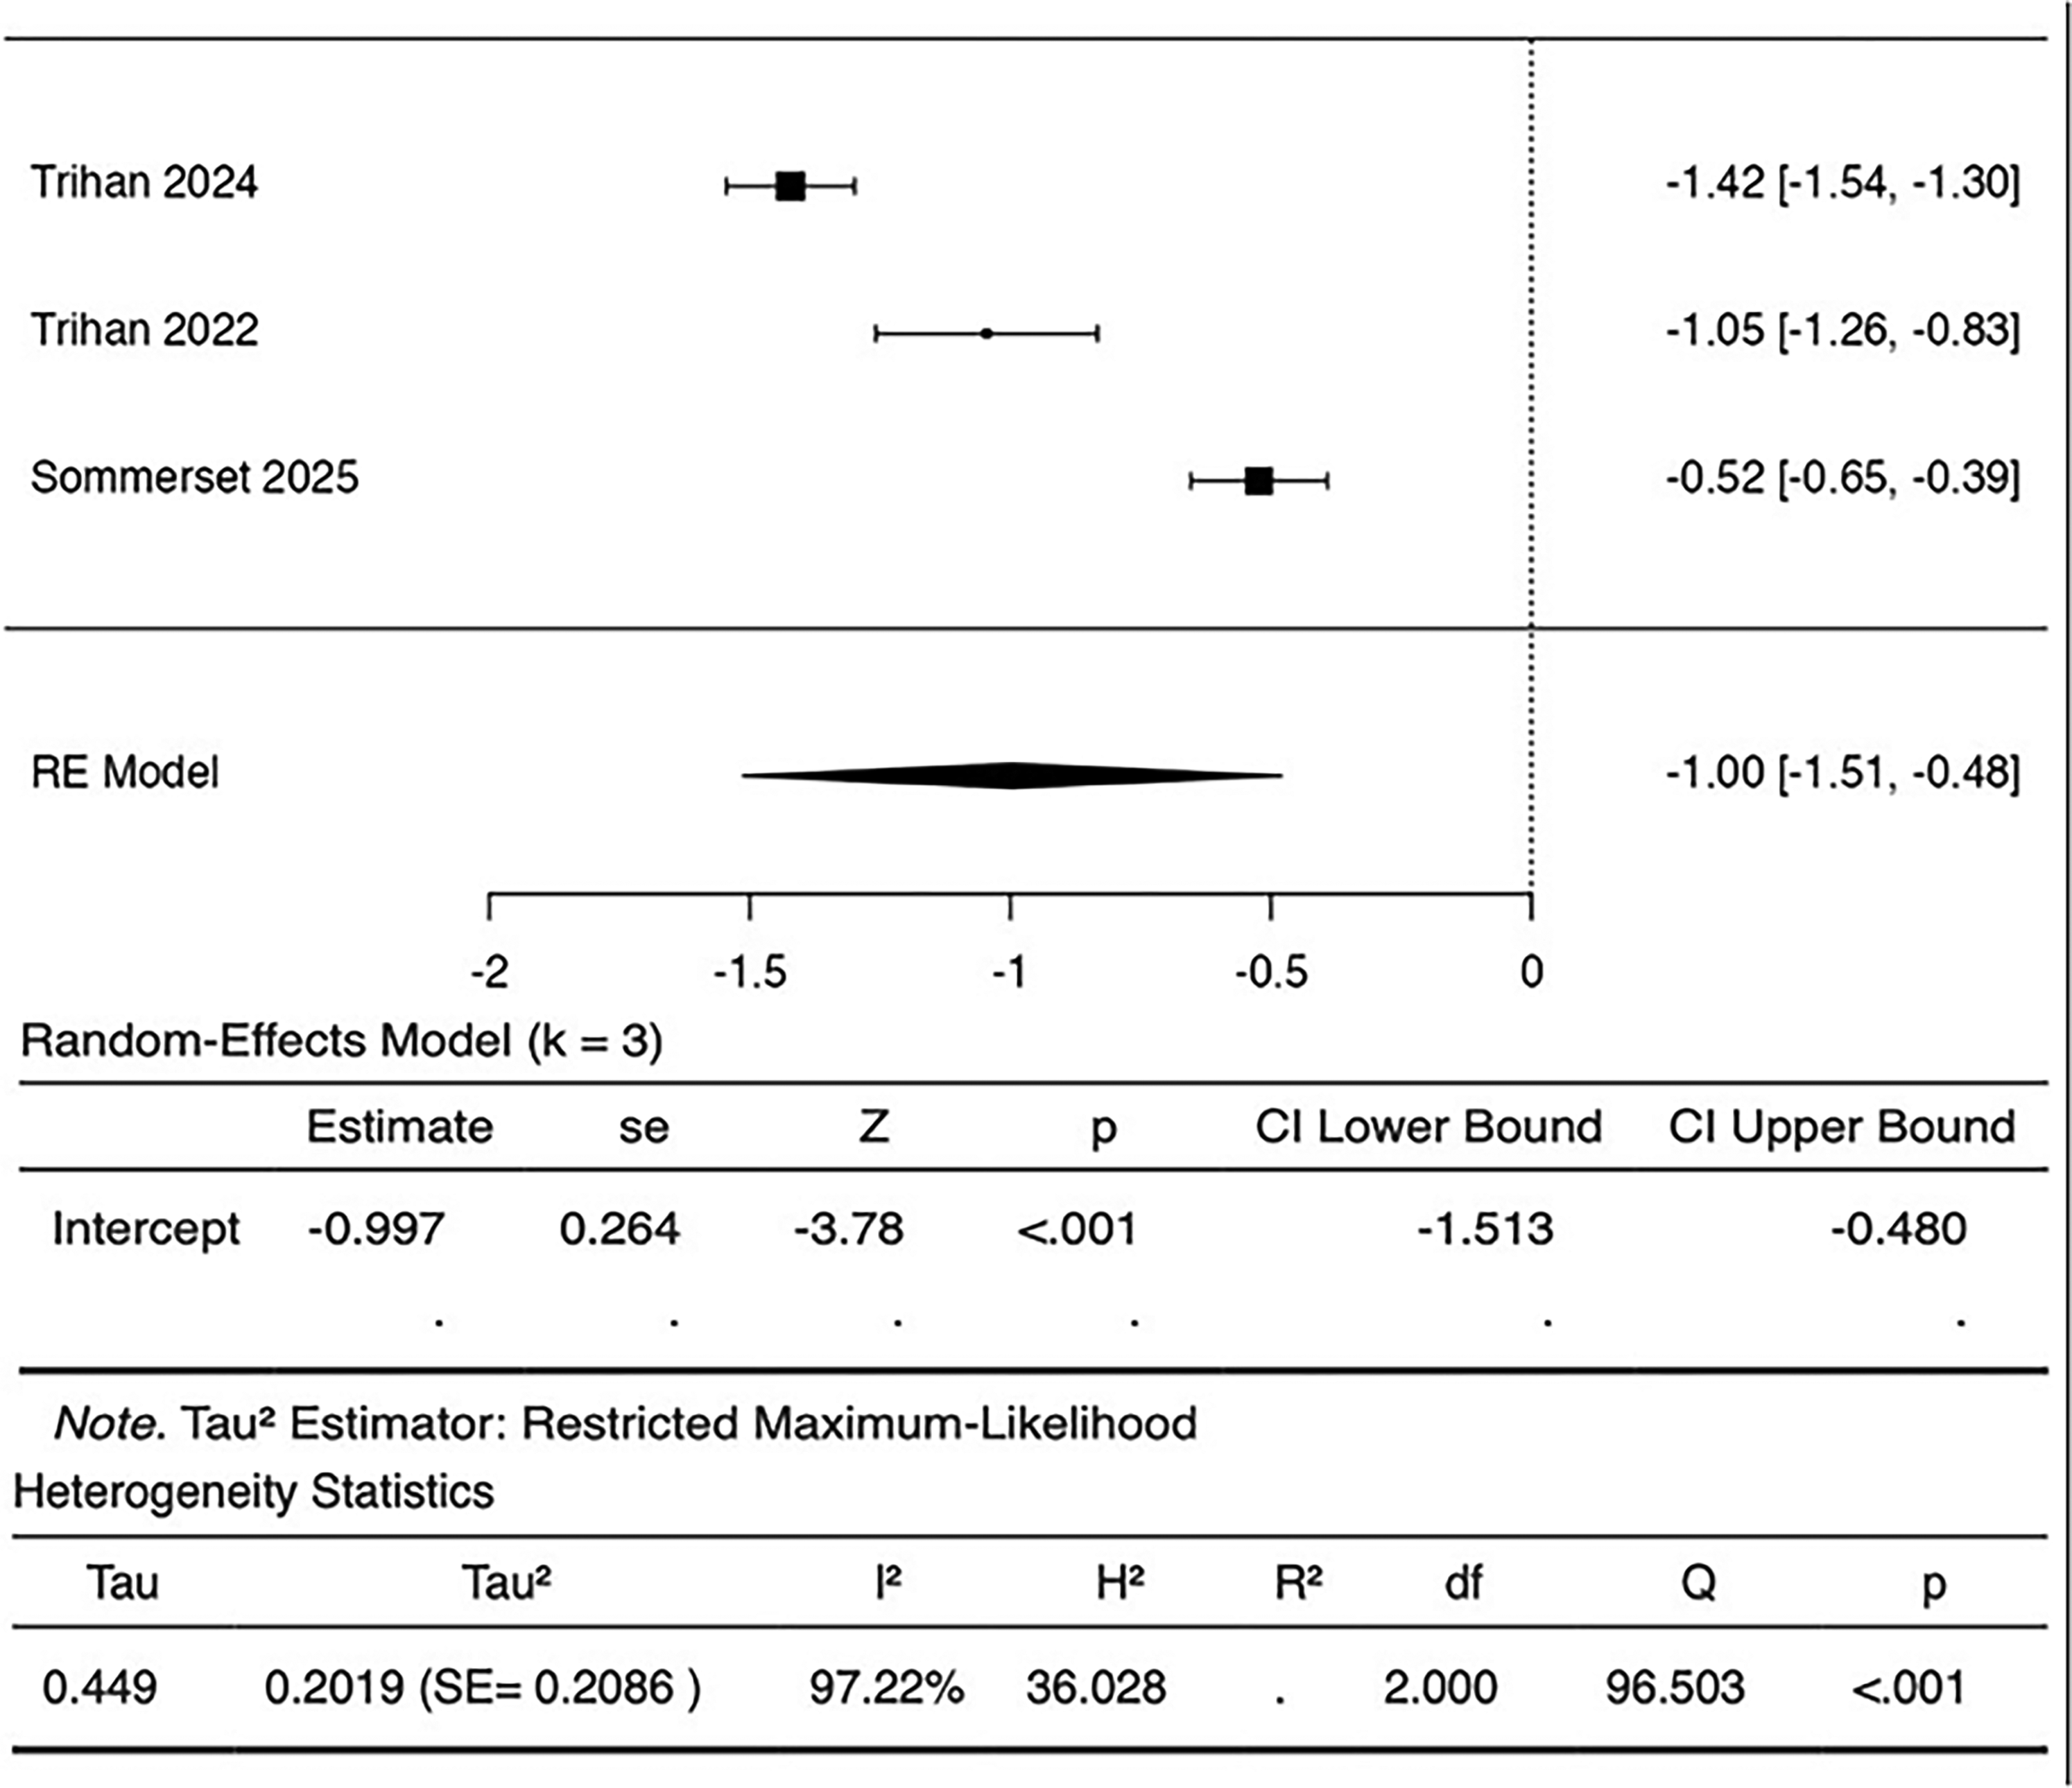
Forest plot of fisher's z-transformed correlations between PAT and TBI with pooled random-effects estimate.
Correlation Between PAT and Toe Pressure
Two studies, involving 278 limbs, showed correlations of PAT and toe pressure.18,19 An inverse correlation was found in both studies, with correlation coefficients of −0.74 and −0.41. Formal pooled meta-analysis was not deemed reliable due to the small number of studies and varying measurement methods.
Risk of Bias Assessment
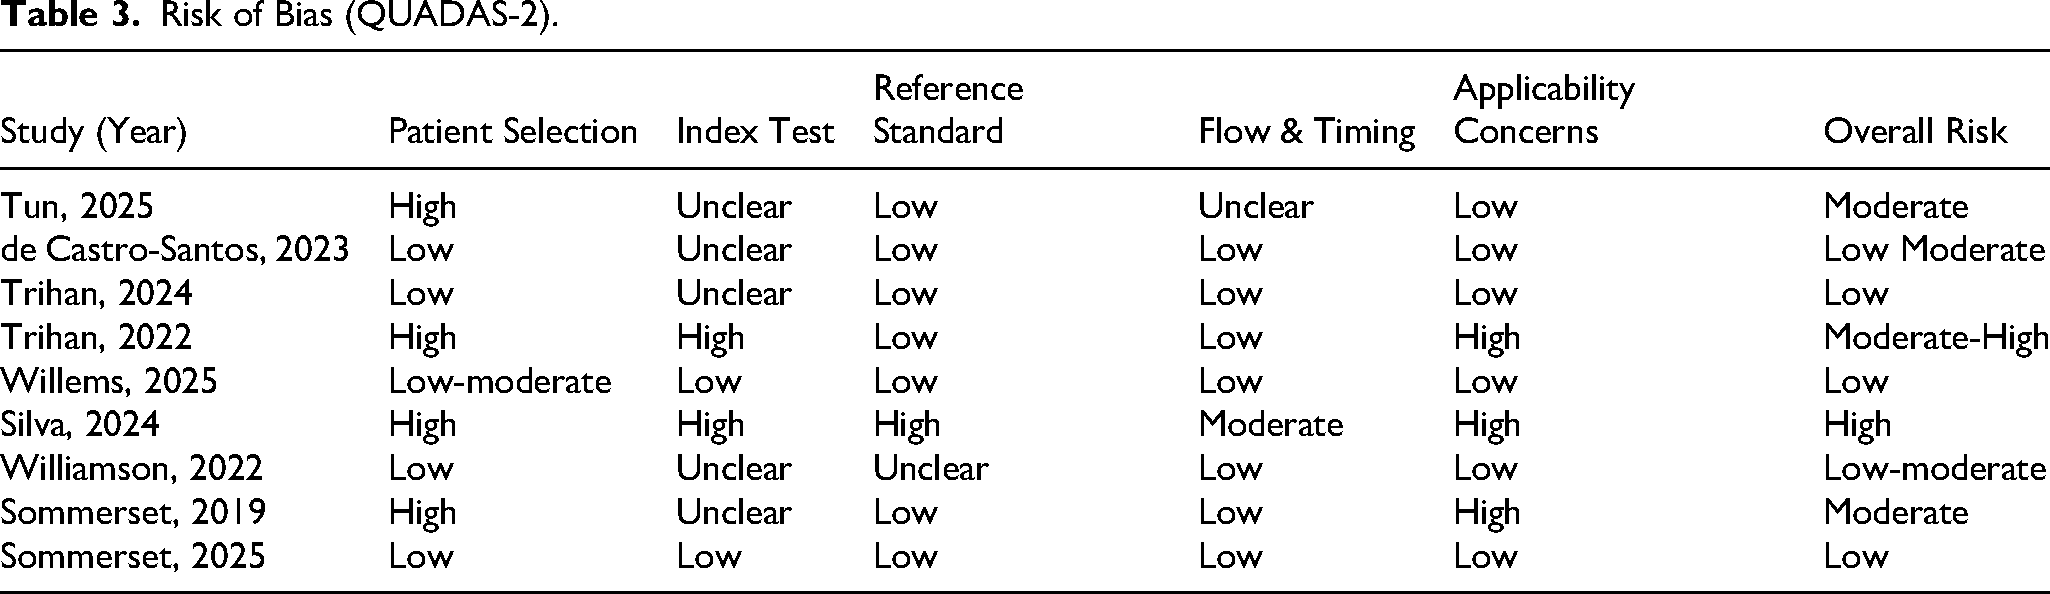
The quality of the included studies’ methods was assessed using QUADAS-2 (Table 3). Three studies were judged as having an overall low risk of bias, due to adequate patient selection, clearly defined reference standards, and adequate control of flow and timing between index testing and reference testing.17,19,30 De Castro Santos et al (2023) and Williamson et al (2022) were rated as low-moderate risk, mainly owing to poor reporting of blinding in the index test domain, whereas Tun et al (2025) and Sommerset et al (2019), whose retrospective designs and patient selection and applicability issues resulted in moderate risk in judgment.1,18,29,31 Trihan et al (2022) showed medium to high risk of bias, in part due to limited inclusion criteria and insufficient blinding. Silva et al (2024) was judged as having a high risk of bias due to limitations in the reference standard and selection criteria.13,21 Overall, the most common methodological constraint was the lack of complete reporting of the blinding procedure for the index test; however, flow and timing between testing were mostly well managed.
Risk of Bias (QUADAS-2).
Discussion
The results of this review suggest that PAT acts as a functionally significant marker of distal limb perfusion with good diagnostic performance in all stages of PAD up to CLTI. Higher values of PAT were consistently associated with impaired perfusion and advanced clinical stage in all studies. Rather than acting as a standalone Doppler metric, PAT appears to provide a cumulative hemodynamic presentation of upstream stenosis.
PAT exhibited a significant inverse relationship with ABI across studies by De Castro Santos et al (2023), Trihan et al (2024), and Silva et al (2024), and minimal between-study heterogeneity was reported.21,29,30 Although study design and patient characteristics differed between the studies, the consistency of this association supports the finding that acceleration time represents haemodynamic impairment, as captured by standard pressure-based indices.
Similarly, an inverse association was found between PAT and TBI, although with substantial variability across studies.13,19,30 Moreover, Tun et al (2025) and Sommerset et al (2025) reported inverse correlations between PAT and absolute toe pressure, indicating that a prolonged PAT means a decrease in distal perfusion.18,19
The most significant factor underlying the observed differences in correlation strength between Trihan et al (2024) and Sommerset et al (2025) lies in their distinct patient populations and the physiological nuances of the indices used.19,30 While ABI and PAT are primarily large vessel testing methods, toe-based indices like TP and TBI reflect both large and small vessel perfusion. This fundamental difference likely explains why PAT and ABI consistently show strong and stable correlations across studies, as both capture upstream macrovascular impairment. 19
In the study by Trihan et al (2024), which focused on patients with advanced hemodynamic impairment and CLTI, using a toe pressure threshold ⩽ 30 mm Hg as the reference criterion for advanced disease, the macrovascular disease is often so severe that it dominates both large and small vessel indices, yielding a statistically outstanding correlation (r = −0.89). 30 On the contrary, Sommerset et al (2025) evaluated a mixed population with 32.4% claudicants and earlier stages of disease. In such cohorts, the independent variability of small vessel disease (especially in patients with diabetes or microangiopathy) can ‘decouple’ the TBI from macrovascular PAT measurements, thereby attenuating the linearity of the correlation (r = −0.48). 19
Despite these nuances, the results demonstrate that PAT maintains a comparable or higher overall accuracy than what is reported in the literature for ABI, especially in populations where medial arterial calcification (MAC) renders pressure-based measurements unreliable.
Among the included studies, diagnostic performance was highest in those with more severe ischaemia. Trihan et al (2024) report an AUC of 0.99 for toe pressure ≤30 mm Hg, a common threshold for the determination of CLTI. 30 Willems et al (2025) reported strong diagnostic accuracy of acceleration-based parameters when hemodynamically significant tibial stenosis (>50%) was targeted, with AUC values of 0.96 for the posterior tibial artery (PTA) and 0.92 for the anterior tibial artery (ATA). 17 In a broader examination of disease from the iliac to pedal arteries, Sommerset et al (2025) reported that a worst-case PAT strategy provided good discrimination for significant stenosis. 19
Proposed cut-off values were heterogeneous and depended on the clinical endpoint used in each study. Clinical thresholds of ≥215 ms were consistently associated with CLTI in independent cohorts,13,26 whereas prior and parallel cohorts reported marginally higher values on similar study populations. 1 On the contrary, for the detection of generalized PAD or tibial stenosis greater than 50%, lower thresholds, typically 85 to 120 ms, depending on the arterial segment, were shown to optimize sensitivity and specificity.19,30
Collectively, these data indicate that PAT represents a gradual hemodynamic adaptation to arterial compromise, suggesting that it should be used considering the severity of each patient rather than adopting one standard cut-off. Accordingly, lower thresholds (>85 ms) should be applied to optimize sensitivity in screening for general PAD, 19 while higher thresholds (≥215 ms) are most appropriate for confirming critical limb-threatening ischemia. 30
An emerging body of evidence, primarily led by the work of Willems et al (2025) and Williamson et al (2022), suggests that maximal systolic acceleration (ACCmax) offers significant methodological and clinical advantages over traditional acceleration time metrics (PAT/ATmax).16,17,31 In comparative analyses, ACCmax demonstrated superior diagnostic accuracy for detecting ≥50% stenosis and maintained its performance in populations with diabetes and chronic kidney disease, where arterial calcification often limits pressure-based indices.17,31
Specifically, Williamson et al (2022) highlighted the clinical efficiency of this metric, noting that ACCmax can be acquired significantly faster than traditional ABI (4 min 10 s vs 13.7 min) with excellent reliability in diabetic patients. From a pathophysiological standpoint, ACCmax represents the instantaneous systolic acceleration onset, making it less influenced by systemic factors (eg, heart failure) or reflected waves that can dampen the systolic peak. While PAT remains a sensitive and well-validated marker for advanced ischemia (CLTI), its measurement is inherently dependent on waveform interpretation. In contrast, ACCmax, as a slope-based parameter, provides more consistent results across operators. 31 Although currently derived from a smaller number of studies, the current evidence suggests that future research should prioritize ACCmax as a primary parameter, potentially through a simultaneous reporting strategy with PAT to standardize measurement protocols.
A major source of heterogeneity across studies was the variability in arterial segments used for PAT acquisition, particularly between the dorsal pedal artery (DPA) and lateral plantar artery (LPA).1,13,19,30 From a physiological standpoint, both vessels reflect distal perfusion; however, they may be differentially affected depending on the distribution and severity of upstream arterial disease.1,18,30 Furthermore, evidence from the included studies suggests that no single arterial segment consistently demonstrated superiority across all clinical scenarios.18,19 Instead, segment-specific variability appears to be driven by disease pattern, collateralization, and technical feasibility of Doppler acquisition.1,18,19
Importantly, studies using a worst-case PAT approach, defined as the highest acceleration time recorded among the pedal arteries, reported more consistent diagnostic performance in identifying hemodynamically significant disease across different vascular territories. Specifically, Sommerset et al. 2025 demonstrated that this strategy yielded the highest diagnostic accuracy (AUC 0,79) for identifying PAD compared to relying on any single arterial segment. 19 This method likely reflects the most flow-limiting lesion within the arterial tree and helps avoid perfusion deficits.
This study has several limitations. The majority of studies were small, single-centre, and observational. Reference standards differed between studies, including imaging stenosis defined based on pathology criteria and hemodynamic thresholds, limiting direct comparability. In addition, measurement protocols were not standardized, and differences in the types of arterial segments measured and definitions of parameters (PAT, ATmax, SRT) were likely to have contributed to heterogeneity. Methodologically, pooling correlation coefficients has in-built limitations when underlying population effects differ. Although relevant statistical procedures were used , residual heterogeneity cannot be ruled out.25–27 All eligible studies were retained for inclusion and transparent synthesis based on PRISMA guidelines. QUADAS-2 was used not as an exclusion criterion but as a method to frame the clinical weight of the individual findings. To adjust for methodological heterogeneity, a random-effects model was employed in the pooling process; notably, the PAT–ABI correlation demonstrated zero heterogeneity (I2 = 0%), suggesting robustness across settings. Higher-risk studies like Silva et al (2024) and Trihan et al (2022) enhanced the debate by demonstrating the influence of spectrum bias and corroborating that PAT is most effective when used with respect to the clinical endpoints for which it was validated — in this case, advanced ischaemia — rather than as an inclusive screening tool.13,21 Future studies should aim to standardize acquisition protocols, including multi-artery assessment strategies and consistent parameter definitions, to improve comparability and reproducibility across investigations.
Conclusions
PAT demonstrates strong correlations with established measures of limb perfusion and consistent diagnostic accuracy for PAD and CLTI. These observations are hampered by variability in measurement protocols, arterial segment selection, diagnostic thresholds, and reference quality among trials that complicate direct comparison between studies. Additional research should be done to delineate PAT with vascular diagnosis and to establish how it can be implemented in routine clinical management. In addition, emerging evidence indicates that maximal systolic acceleration (ACCmax) offers improved reproducibility and may represent a more suitable candidate for standardization in future diagnostic protocols.
Supplemental Material
sj-docx-1-ijl-10.1177_15347346261459550 - Supplemental material for Pedal Acceleration Time as a Marker of Limb Perfusion: A Systematic Review and Correlation Meta-Analysis
Supplemental material, sj-docx-1-ijl-10.1177_15347346261459550 for Pedal Acceleration Time as a Marker of Limb Perfusion: A Systematic Review and Correlation Meta-Analysis by Nikolaos Papatheodorou, Pavle Pavlovic, Jose Salcedo and Mihaela Ioana Maris in The International Journal of Lower Extremity Wounds
Footnotes
List of Abbreviations
Funding
The authors received no financial support for the research, authorship, and/or publication of this article.
Declaration of Conflicting Interests
The authors declared no potential conflicts of interest with respect to the research, authorship, and/or publication of this article.
Supplemental Material
Supplemental material for this article is available online.
References
Supplementary Material
Please find the following supplemental material available below.
For Open Access articles published under a Creative Commons License, all supplemental material carries the same license as the article it is associated with.
For non-Open Access articles published, all supplemental material carries a non-exclusive license, and permission requests for re-use of supplemental material or any part of supplemental material shall be sent directly to the copyright owner as specified in the copyright notice associated with the article.