
Abstract
Outbreak Summaries is a Canadian enteric, food, and waterborne outbreak surveillance system designed to support the collection and analysis of Canadian outbreak data. This analysis summarizes the foodborne outbreak investigations submitted between 2008 and 2023. Finalized reports of foodborne outbreak investigations submitted by all participating jurisdictions were extracted and characterized by pathogen, outcomes, food vehicles, and pathogen-food vehicle pairs. Annual trends in submissions and jurisdictional scope were explored. A total of 452 foodborne outbreaks were submitted by 11 participating provinces and territories alongside the Public Health Agency of Canada included in the analysis. A total of 14,650 illnesses, 1268 hospitalizations, and 68 deaths were reported. Almost 70% of all submitted outbreaks were caused by bacteria, and viruses accounted for 20%. Salmonella was the most common cause of outbreaks (184/434, 42% of outbreaks with a known pathogen) and outbreak-associated illnesses (7003/14,418, 48%), followed by Norovirus outbreaks (72/434, 16%) and outbreak-associated illnesses (2599/14,418, 18%). The highest absolute number of hospitalizations was attributed to Salmonella (n = 796), followed by Escherichia coli (n = 249), and Listeria monocytogenes (n = 97). L. monocytogenes had the highest hospitalization rate (94%, n = 97), and case fatality rate (17%, n = 35). A confirmed or suspected food vehicle was identified in 230 outbreaks (51%), accounting for 10,587 outbreak-associated cases (72%). The most frequently identified food vehicles were raw vegetables (n = 36, 15.7%), chicken (n = 29, 12.6%), and fresh shellfish (n = 17, 7.4%). The pathogen-food pairs associated with the most outbreaks were Salmonella in chicken (26/221) and whole eggs (15/221) and E. coli in raw vegetables (13/221). Analysis of foodborne outbreaks in the context of pathogens and food vehicles supports the investigative work of public health authorities in Canada. The expansion of program participants and more than 15 years of surveillance data provide a more comprehensive understanding of the foodborne outbreak landscape in Canada.
Introduction
Illnesses associated with foodborne disease are a significant source of morbidity in Canada. The Public Health Agency of Canada (PHAC) estimates that one in eight Canadians experience domestically acquired foodborne illness each year, resulting in approximately four million cases annually (Thomas et al., 2013), including an estimated 11,600 hospitalizations and 238 deaths (Thomas et al., 2015). In the context of an increasingly globalized food supply, outbreaks associated with widely distributed contaminated products may affect multiple jurisdictions, crossing local, provincial/territorial, and national boundaries (Public Health Agency of Canada, 2017). As a result, foodborne disease outbreaks are investigated by local, regional, provincial, territorial, and federal public health authorities. In 2008, Outbreak Summaries (OS) was created to support the systematic collection and analysis of Canadian outbreak investigations.
A summary of foodborne outbreak investigations submitted to OS between 2008 and 2014 was published in 2015 (Bélanger et al., 2015). Since then, an additional 9 years of data have been submitted, and participation has expanded from 6 to 12 jurisdictions. This article describes foodborne outbreaks in Canada submitted to OS between 2008 and 2023, including pathogens, implicated food vehicles, notable pathogen-food vehicle pairs and annual trends.
Methods
Data sources
The Canadian Network for Public Health Intelligence (CNPHI) provides a web-based platform used by public health authorities in Canada to summarize and share outbreak investigation results. Participating jurisdictions submit outbreak investigations to OS, though the scope (local/regional, provincial/territorial, multijurisdictional) varies by jurisdiction. Upon implementation, jurisdictions can upload historical data, effectively altering the annual level of participation in previous surveillance years. PHAC submits all multijurisdictional outbreak investigations led by the Agency. In 2023, 11 P/Ts and PHAC participated in OS. Outbreaks submitted with a foodborne mode of transmission (with or without a food vehicle identified) and an investigation start date from 2008 through 2023, inclusive, were extracted on March 18, 2025, from OS.
Exclusion criteria
The following outbreaks were excluded prior to analysis:
Duplicate submission from multiple jurisdictions (e.g., PHAC and a province or territory); the report from the lead jurisdiction was retained. Retrospectively submitted outbreaks (2008–2014) identified by the submitting jurisdiction as having incomplete or inconsistent data elements and designated by the submitter as not for formal analysis; retained for reference only. Outbreaks that did not meet the OS case definitions:
Community outbreak: Two or more unrelated cases with similar illness, epidemiologically linked by time and/or place and/or exposure. Institutional outbreak: Three or more cases with similar illness, epidemiologically linked within a 4-day period in an institutional setting.
Analysis
Data were analyzed using Stata 16 (StataCorp, 2019) to describe outbreaks, cases, hospitalizations, and deaths by pathogen and food vehicles. Outbreak submissions were summarized across four pre-defined time periods based on program evolution and submission practices. Phase 1 (2008–2011) saw PT participation increase from four to eight jurisdictions. In phase 2 (2012–2015), participation reached 11 jurisdictions. Phase 3 (2016–2019) had steady participation with 12 jurisdictions, and phase 4 (2020–2022) had continued steady participation but reflects the COVID-19 pandemic period. Outbreak submissions were analyzed by time period to assess changes in submissions throughout the duration of the program, while also considering the level of participation across Canada.
Results
There were 586 finalized outbreaks with foodborne transmission and investigation start dates between January 1, 2008, and December 31, 2023, submitted to OS by March 18, 2025. In total, 134 outbreaks were excluded: 116 duplicates, 12 retrospective outbreaks, and 6 not meeting the case definition. After applying the exclusion criteria, 452 foodborne outbreaks were included for analysis, representing a total of 14,650 lab-confirmed and clinical cases.
Submission trends
The number of foodborne outbreaks submitted each year ranged from a low of 13 in 2009 to a high of 42 in 2015 and averaged 28 outbreaks annually between 2008 and 2023 (Fig. 1). The number of jurisdictions represented within the dataset increased over time, from 4 in 2008, up to 12 in 2016, and has since remained unchanged. The median number of annual submissions increased from 21.5 outbreaks in phase 1 to 37 outbreaks in phase 3. Despite stable participation, there was a noticeable decrease, with a median of 21 outbreaks submitted annually during phase 4, amounting to a 43% decrease in submissions as compared with phase 3. In the most current data year (2023), only 15 outbreaks were submitted, aligning with the trend observed in phase 4.
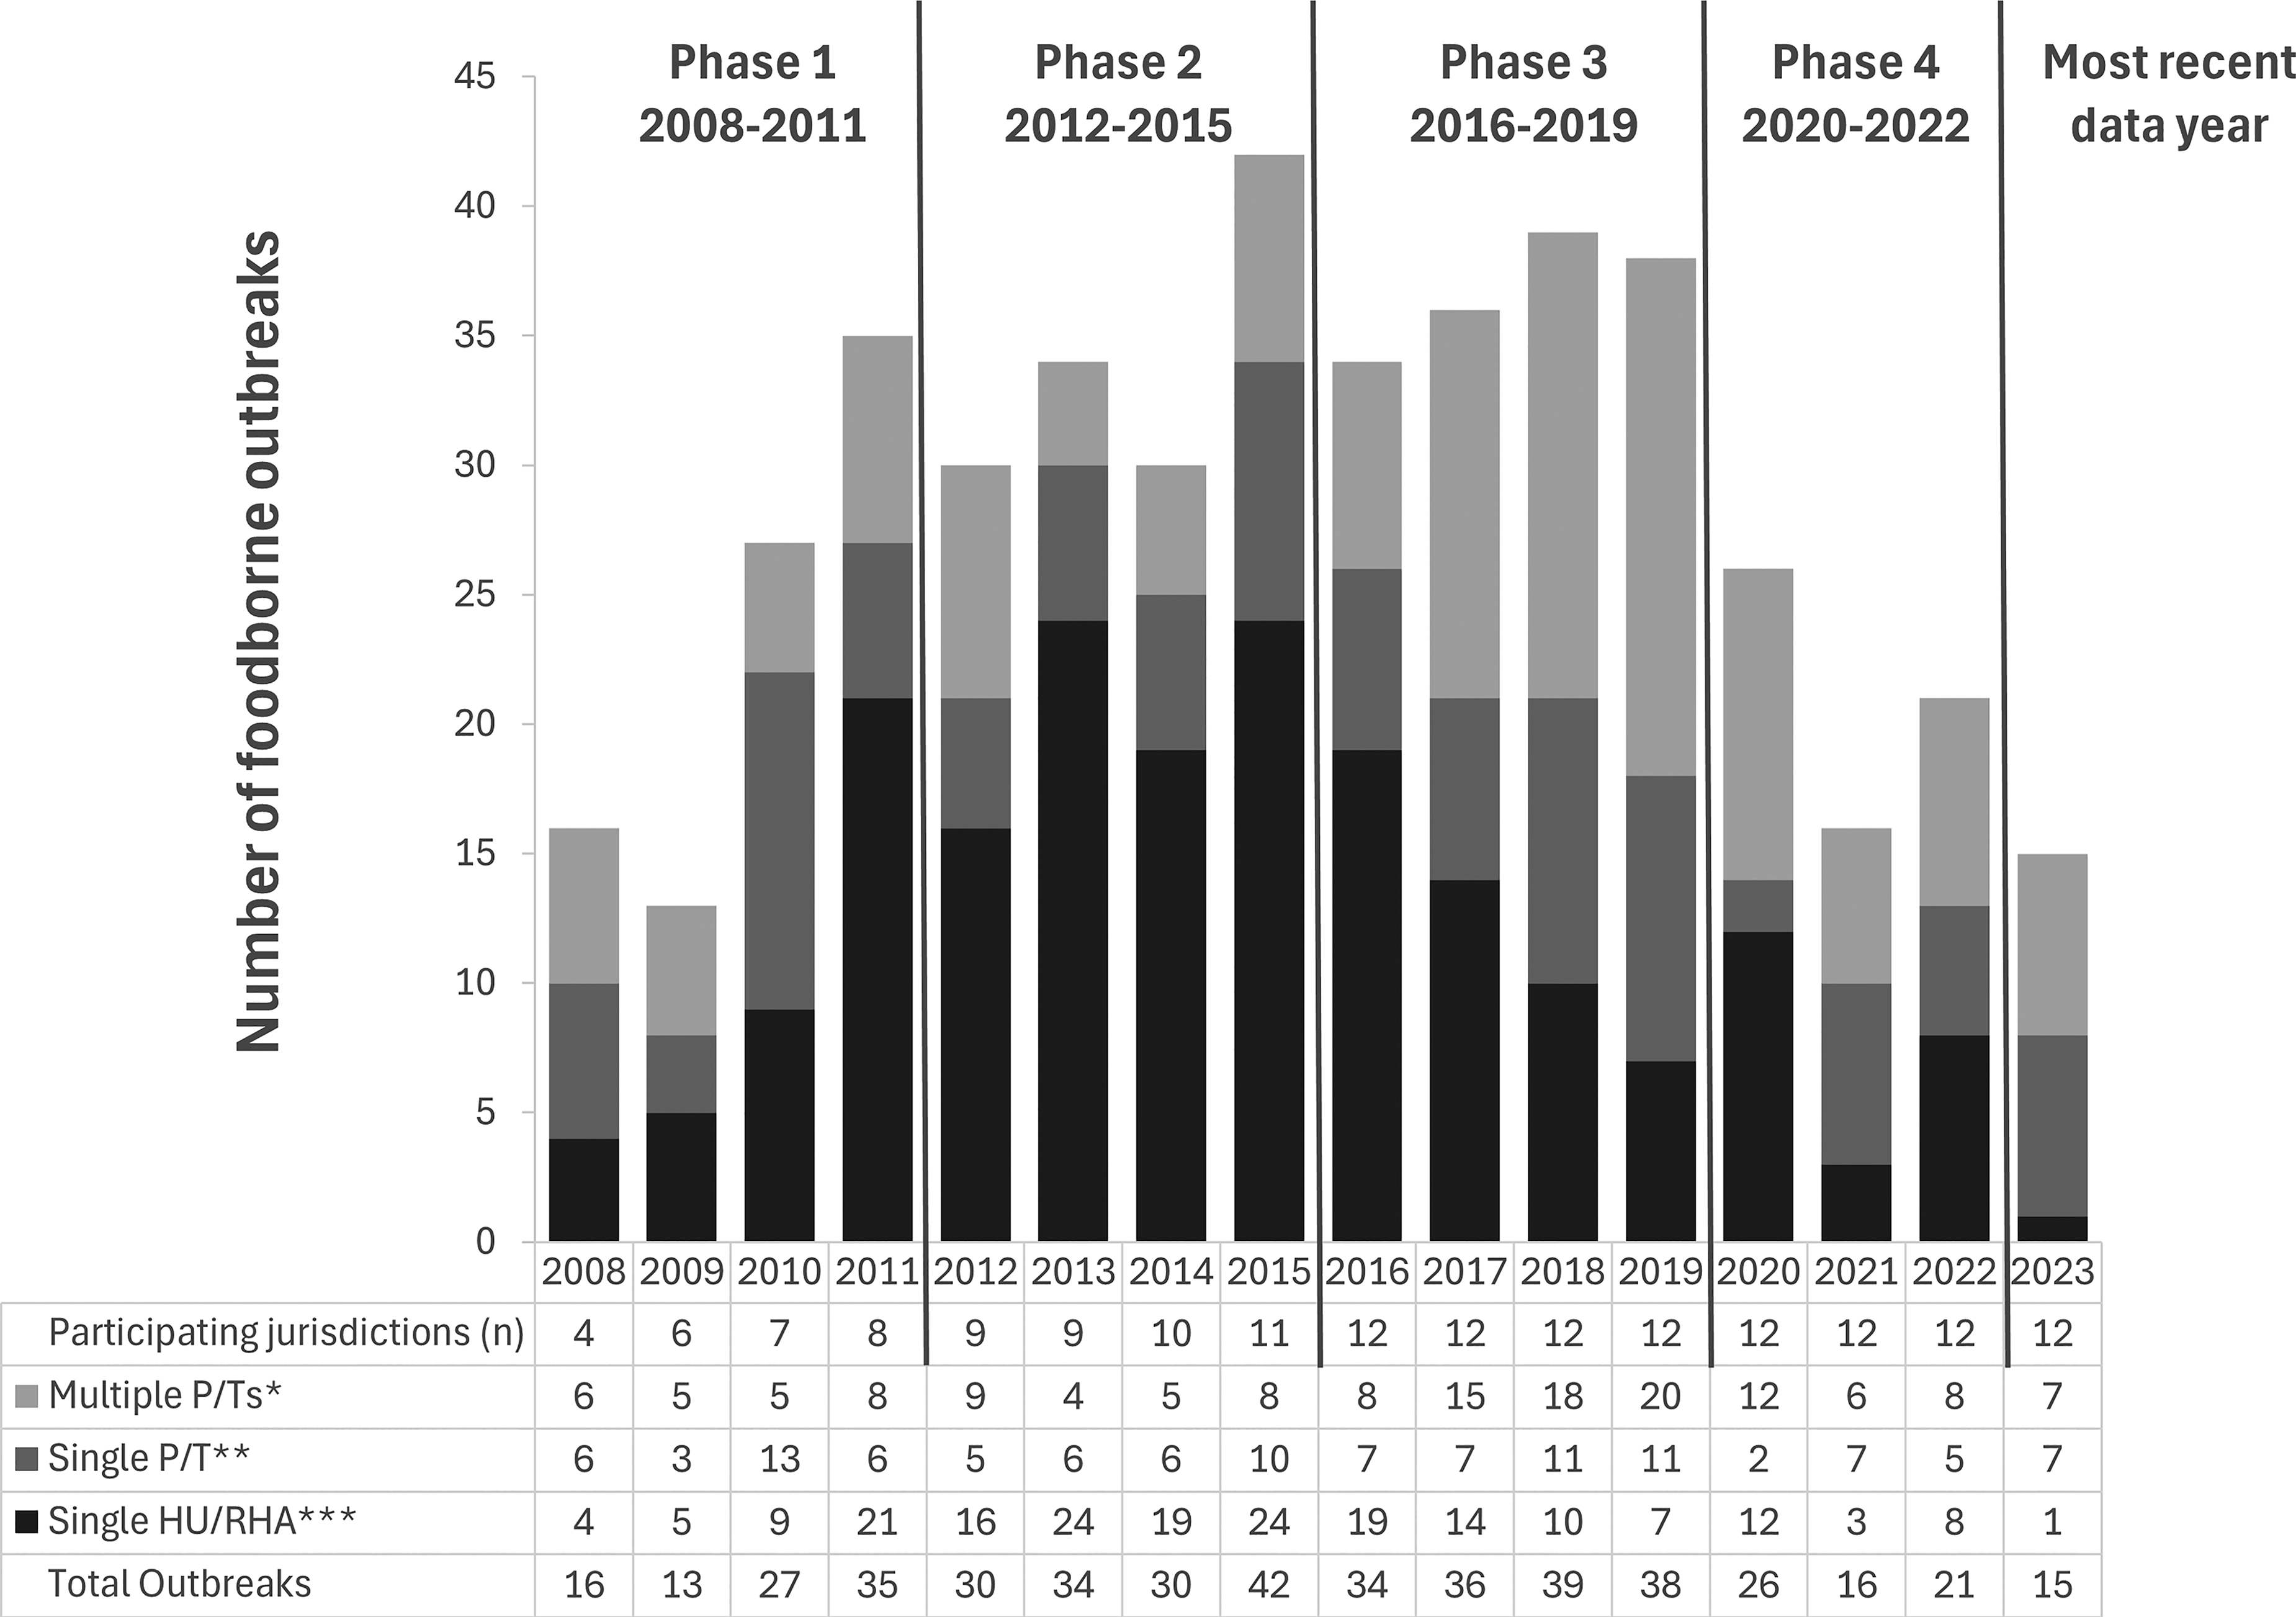
Annual number of foodborne outbreaks by jurisdictional distribution of cases submitted to Outbreak Summaries (2008–2023) and number of participating jurisdictions in Canada. *involves more than one province and/or territory (multijurisdictional). **involves more than one health unit or regional health authority within a single province or territory. ***involves only a single health unit or regional health authority.
Outbreaks by jurisdictional scope
Among the 452 foodborne outbreaks, 196 outbreaks (43%) involved cases within a single health unit (HU) or regional health authority (RHA), 112 outbreaks (25%) involved multiple HUs or RHAs within a single P/T, and 144 outbreaks (32%) were multijurisdictional, where multiple P/Ts in Canada were involved (Fig. 1). The median annual number of outbreaks submitted by single HUs and RHAs peaked in phase 2 (2012–2015), decreased in phase 3 (2016–2019), and decreased further in phase 4 (2020–2022). Only a single outbreak was reported at this jurisdictional level in 2023, with no notifications of changes to program participation by any participating province or territory. The median annual number of outbreaks submitted by single P/Ts peaked during phase 3, declined in phase 4, and subsequently increased in 2023 to an intermediate level between the two phases. Submissions of multijurisdictional outbreaks also peaked in phase 3, decreased by 50% during phase 4, and remained consistent with phase 4 levels in 2023.
Outbreaks by pathogen
Between 2008 and 2023, 452 foodborne outbreaks were submitted, of which 96% (n = 434) identified a lab-confirmed (n = 372) or suspected (n = 62) pathogen (Table 1). Bacterial pathogens accounted for more than 70% of submitted outbreaks (n = 316), while viral pathogens accounted for 20% (n = 89). The proportion of outbreaks attributed to the three most common pathogens by year is shown in Figure 2. Since 2008, Salmonella has accounted for the greatest proportion of annual foodborne outbreaks in most years, followed by Norovirus and Escherichia coli. The proportion of Salmonella outbreaks peaked in 2020 and 2023, while E. coli outbreaks peaked in 2019 and 2021.
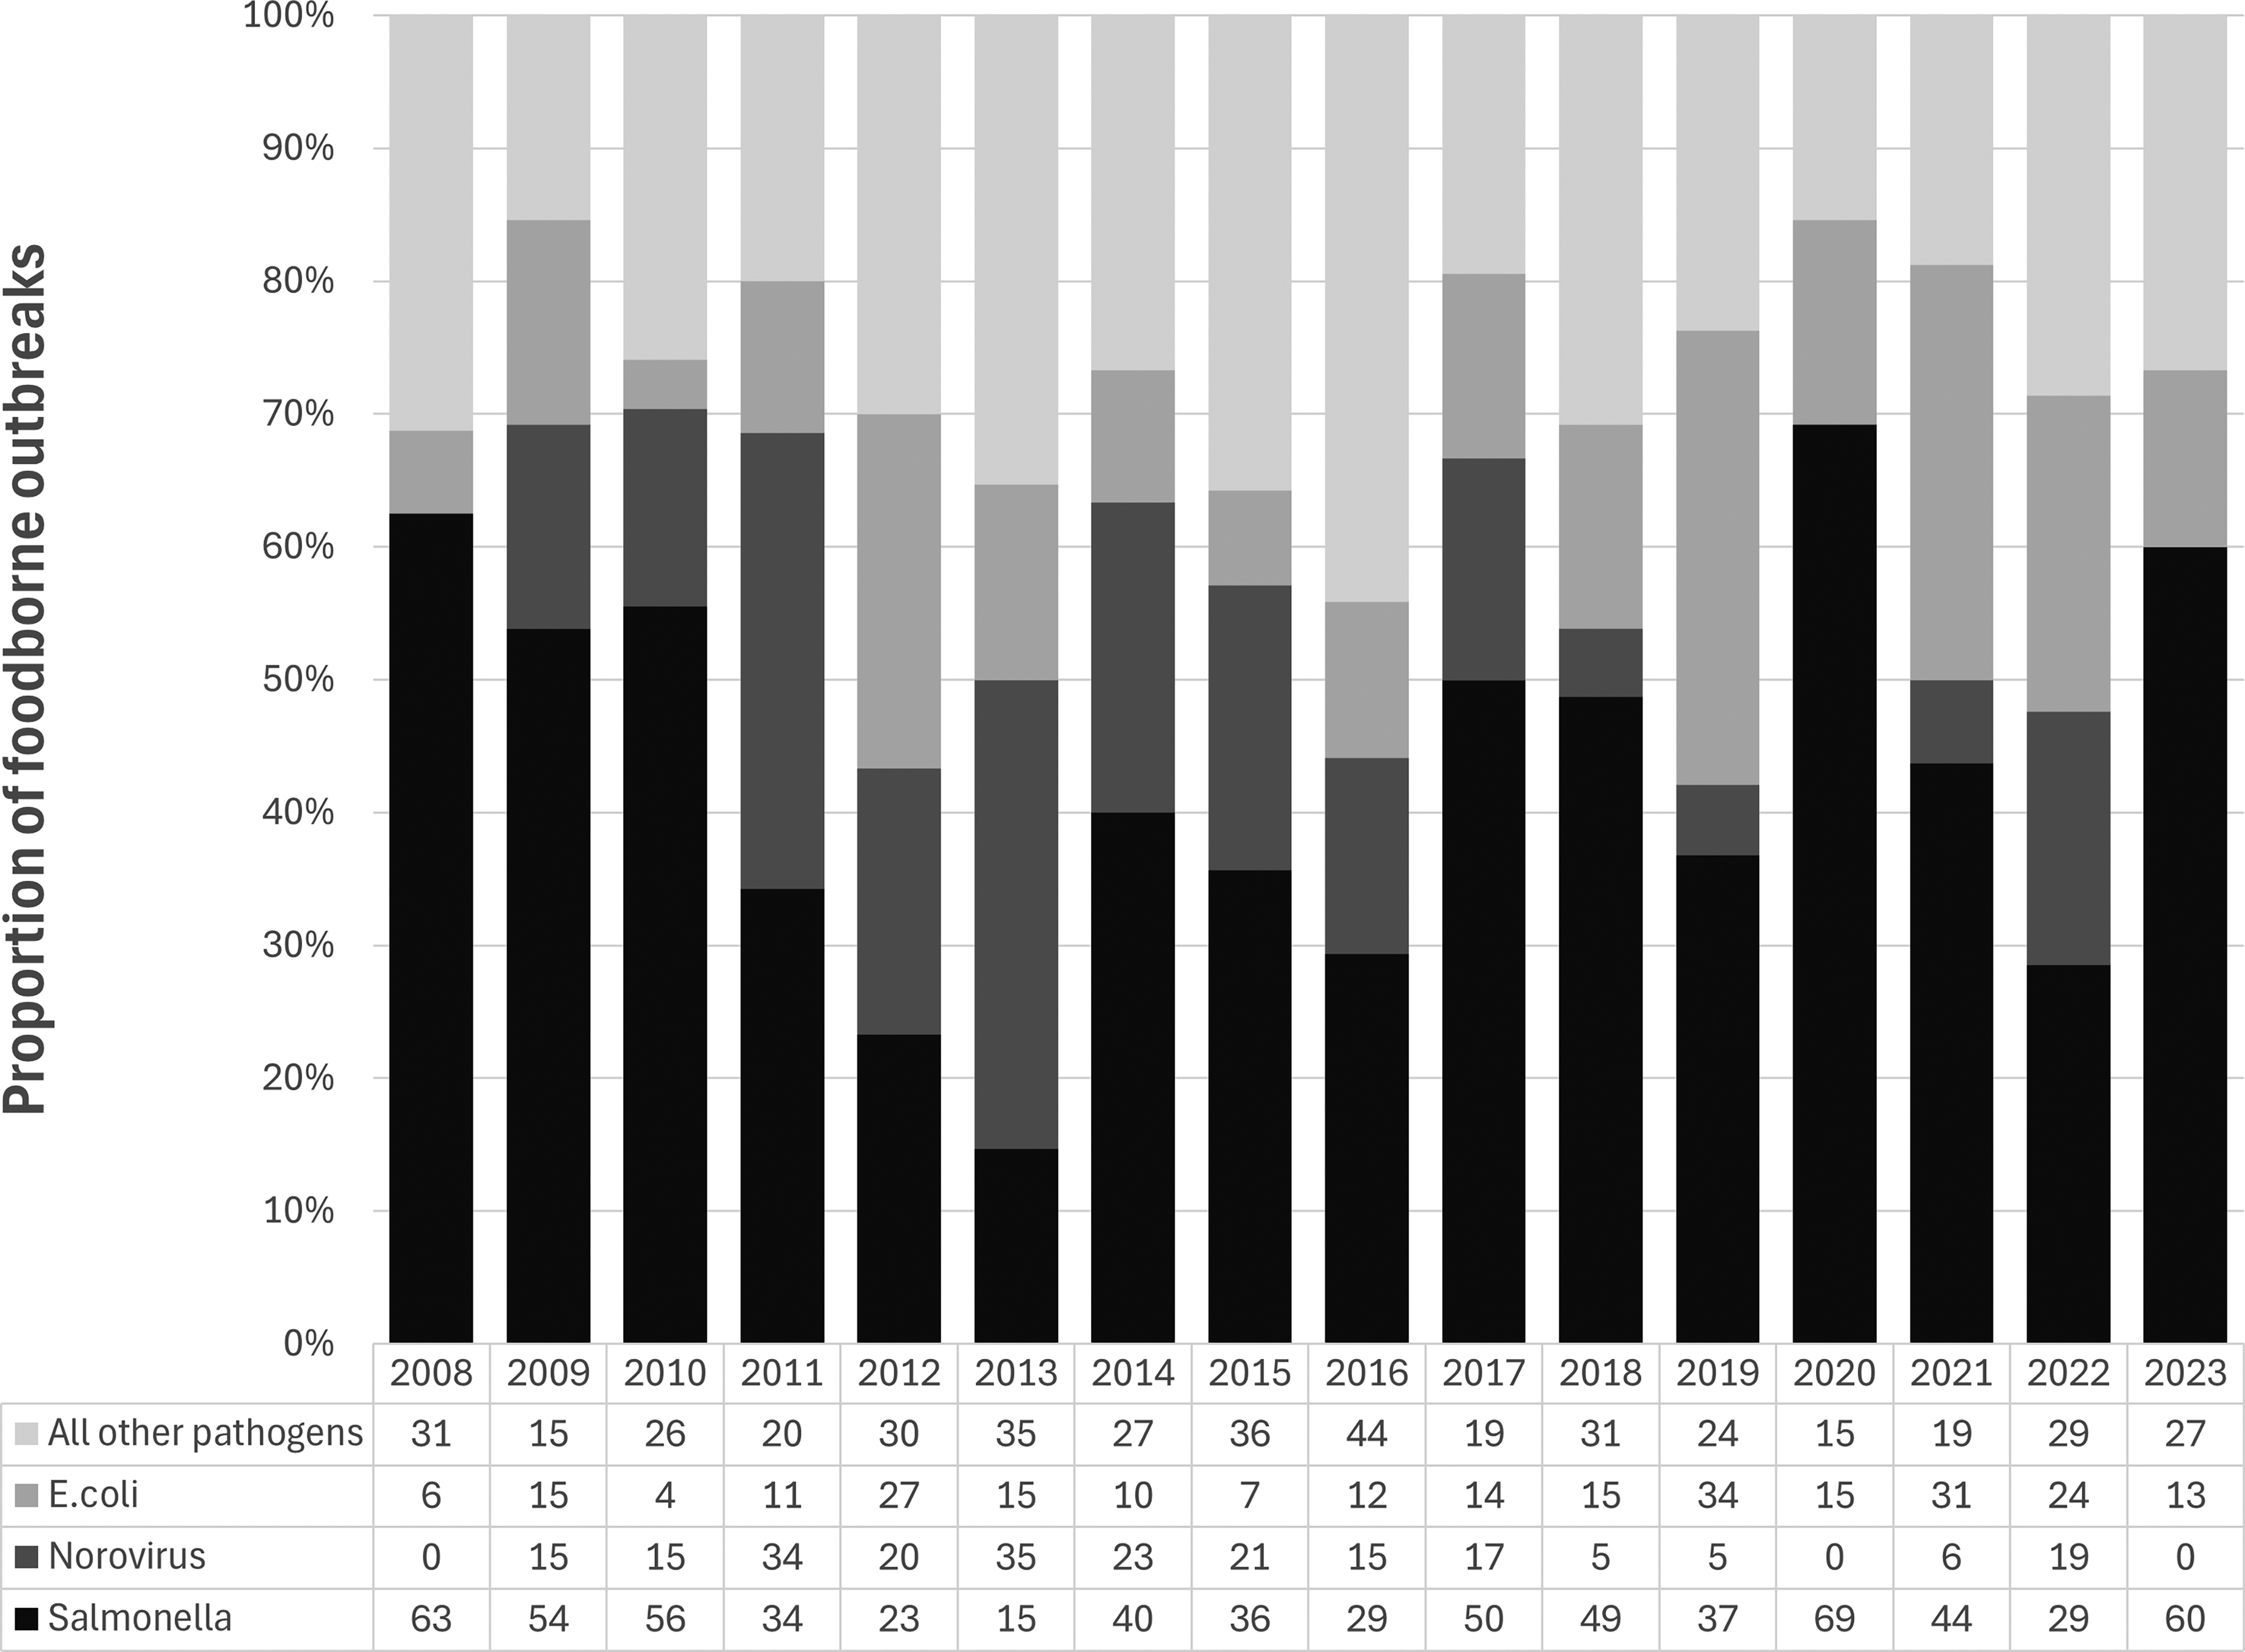
Proportion of outbreaks of Salmonella, Escherichia coli, Norovirus, and all other pathogens by year, 2008–2023.
Number of Foodborne Outbreak Investigations, Cases, Hospitalizations, and Deaths, by Pathogen, Outbreak Summaries, 2008–2023
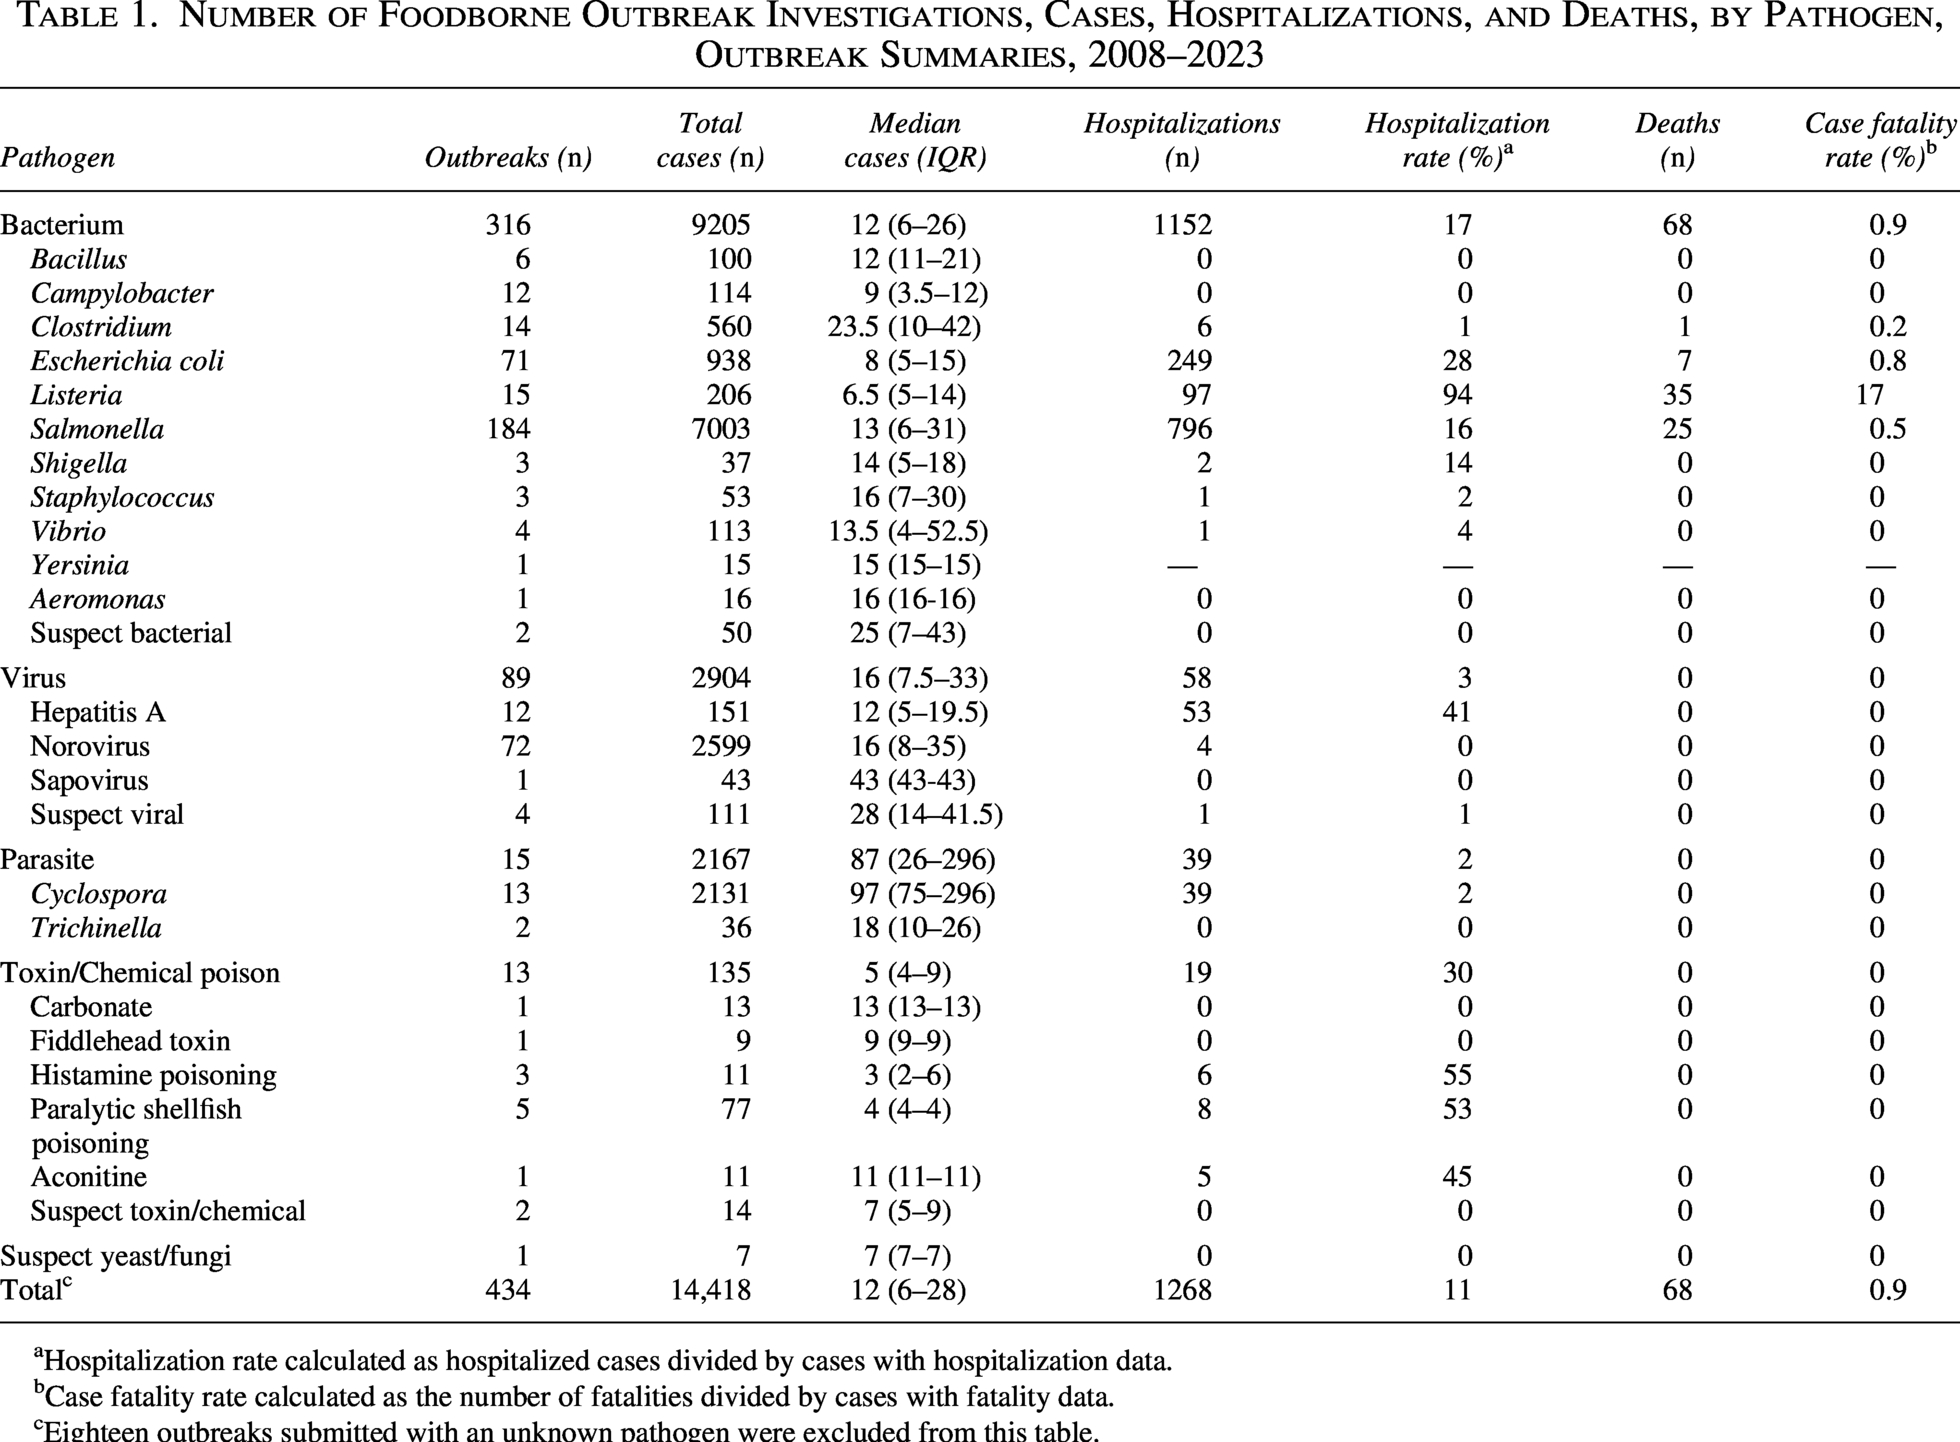
Hospitalization rate calculated as hospitalized cases divided by cases with hospitalization data.
Case fatality rate calculated as the number of fatalities divided by cases with fatality data.
Eighteen outbreaks submitted with an unknown pathogen were excluded from this table.
Among bacterial outbreaks, Salmonella, E. coli, and Listeria monocytogenes were most frequently reported. A serovar was submitted for 77% of Salmonella outbreaks (n = 141); Enteritidis was the most common serovar (43%, n = 61), followed by Typhimurium (6%, n = 9) and Heidelberg (5%, n = 7). Serogroup information was available for 83% of E. coli outbreaks (n = 59), predominantly O157 (83%, n = 49), followed by O121 and O103 (5%, n = 3 each) and O26 (3%, n = 2). Norovirus accounted for 81% (n = 72) of viral outbreaks, while foodborne Hepatitis A represented 13% (n = 12). While not considered an enteric pathogen, Hepatitis A with foodborne transmission was the second most common viral pathogen (13%, n = 12). Outbreaks of parasites were less frequently submitted, although seasonal increases in domestically acquired Cyclosporiasis have been investigated annually in the summer months since 2013.
Outcomes by pathogen
A total of 14,650 illnesses were reported from all foodborne outbreaks between 2008 and 2023 (median 862 cases per year; range: 278–1708). Of these, 7003 (48%) illnesses were identified in Salmonella outbreaks. Norovirus accounted for 2599 (18%) illnesses, with the vast majority being clinical cases with no laboratory confirmation. Cyclosporiasis accounted for the third-highest case count (2131 cases, 14%), driven by seasonal increases in domestically acquired illness, but represented less than 3% of all submitted foodborne outbreaks. Among the 1268 cases hospitalized, the highest absolute number was attributed to Salmonella (n = 796, 63%), followed by E. coli (n = 249, 20%), and L. monocytogenes (n = 97, 8%). However, L. monocytogenes accounted for the highest hospitalization rate, at 94% (97/103), followed by Hepatitis A at 41% (53/128), and histamine poisoning and paralytic shellfish poisoning at 55% (6/11) and 53% (8/15), respectively. Among the 68 case fatalities, the highest absolute number was attributed to L. monocytogenes (n = 35, 51%), followed by Salmonella (n = 25, 37%), and E. coli (n = 7, 10%). L. monocytogenes had the highest case fatality rate at 17% (n = 35/201), and no other pathogen exceeded 1%.
Food vehicles and pathogen-food pairs
A confirmed or suspected food vehicle was identified in 230 outbreaks (51%), for a total of 10,587 outbreak-associated cases (72%) (Table 2). The food categories implicated most often were raw vegetables (n = 36, 15.7%), followed by chicken (n = 29, 12.6%) and fresh shellfish (n = 17, 7.4%). These three food categories, along with whole eggs (n = 15, 6.5%), were linked to more than 60% of all outbreak-associated cases included in the foodborne outbreaks submitted to OS. The pathogen-food pairs associated with the most outbreaks were Salmonella in chicken (n = 26) and in whole eggs (n = 15) and E. coli in raw vegetables (n = 13), where leafy greens were implicated in 92% (n = 12/13) of those outbreaks (Table 3). The most outbreak-associated illnesses were caused by Salmonella in whole eggs (n = 1349) and Norovirus (n = 1184) in fresh shellfish (primarily oysters consumed raw). Salmonella in chicken and in raw vegetables contributed to the most hospitalizations (n = 142 and n = 112, respectively). The top two pathogen-food pairs that resulted in the most deaths were L. monocytogenes in lunch meats (n = 22 fatalities in a single outbreak) and Salmonella in raw fruit (n = 10).
Number and Percentage of Foodborne Outbreak Investigations and Cases by Food Vehicle, Outbreak Summaries, 2008–2023 a
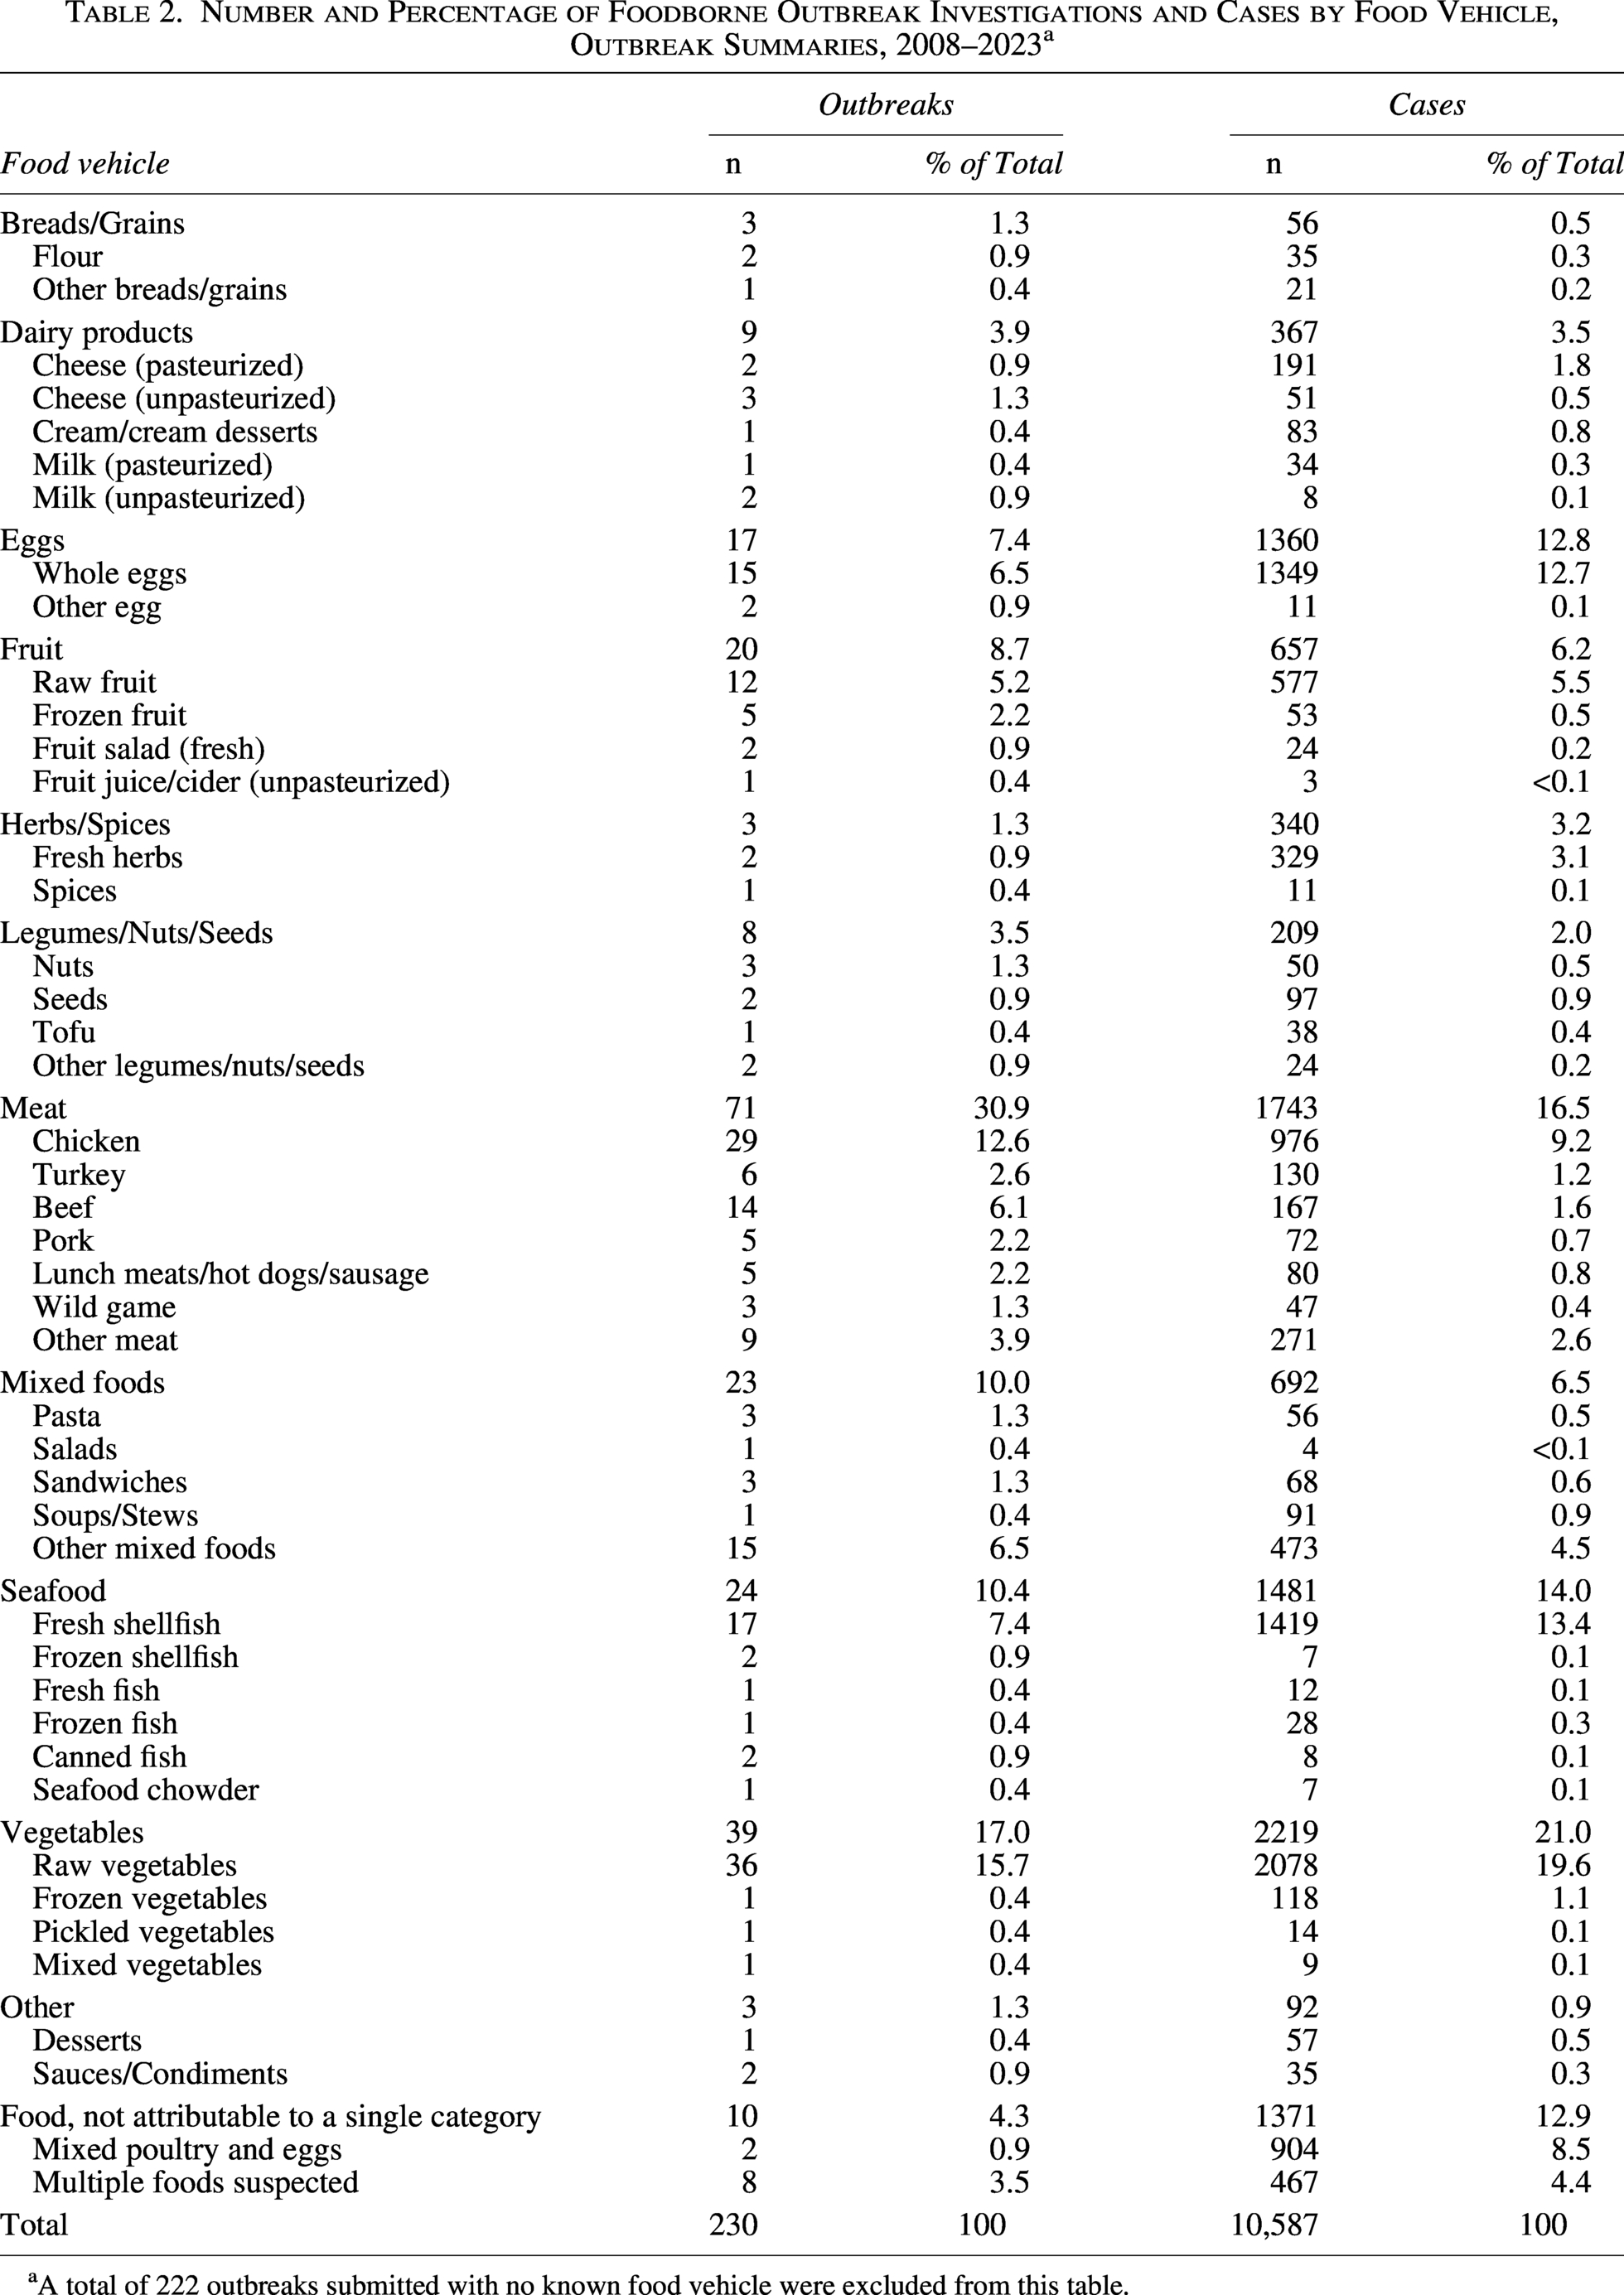
A total of 222 outbreaks submitted with no known food vehicle were excluded from this table.
Most Common Pathogen-Food Pairs a by Number of Outbreaks, Number of Cases, Hospitalization, and Case Fatality, Outbreak Summaries, 2008–2023
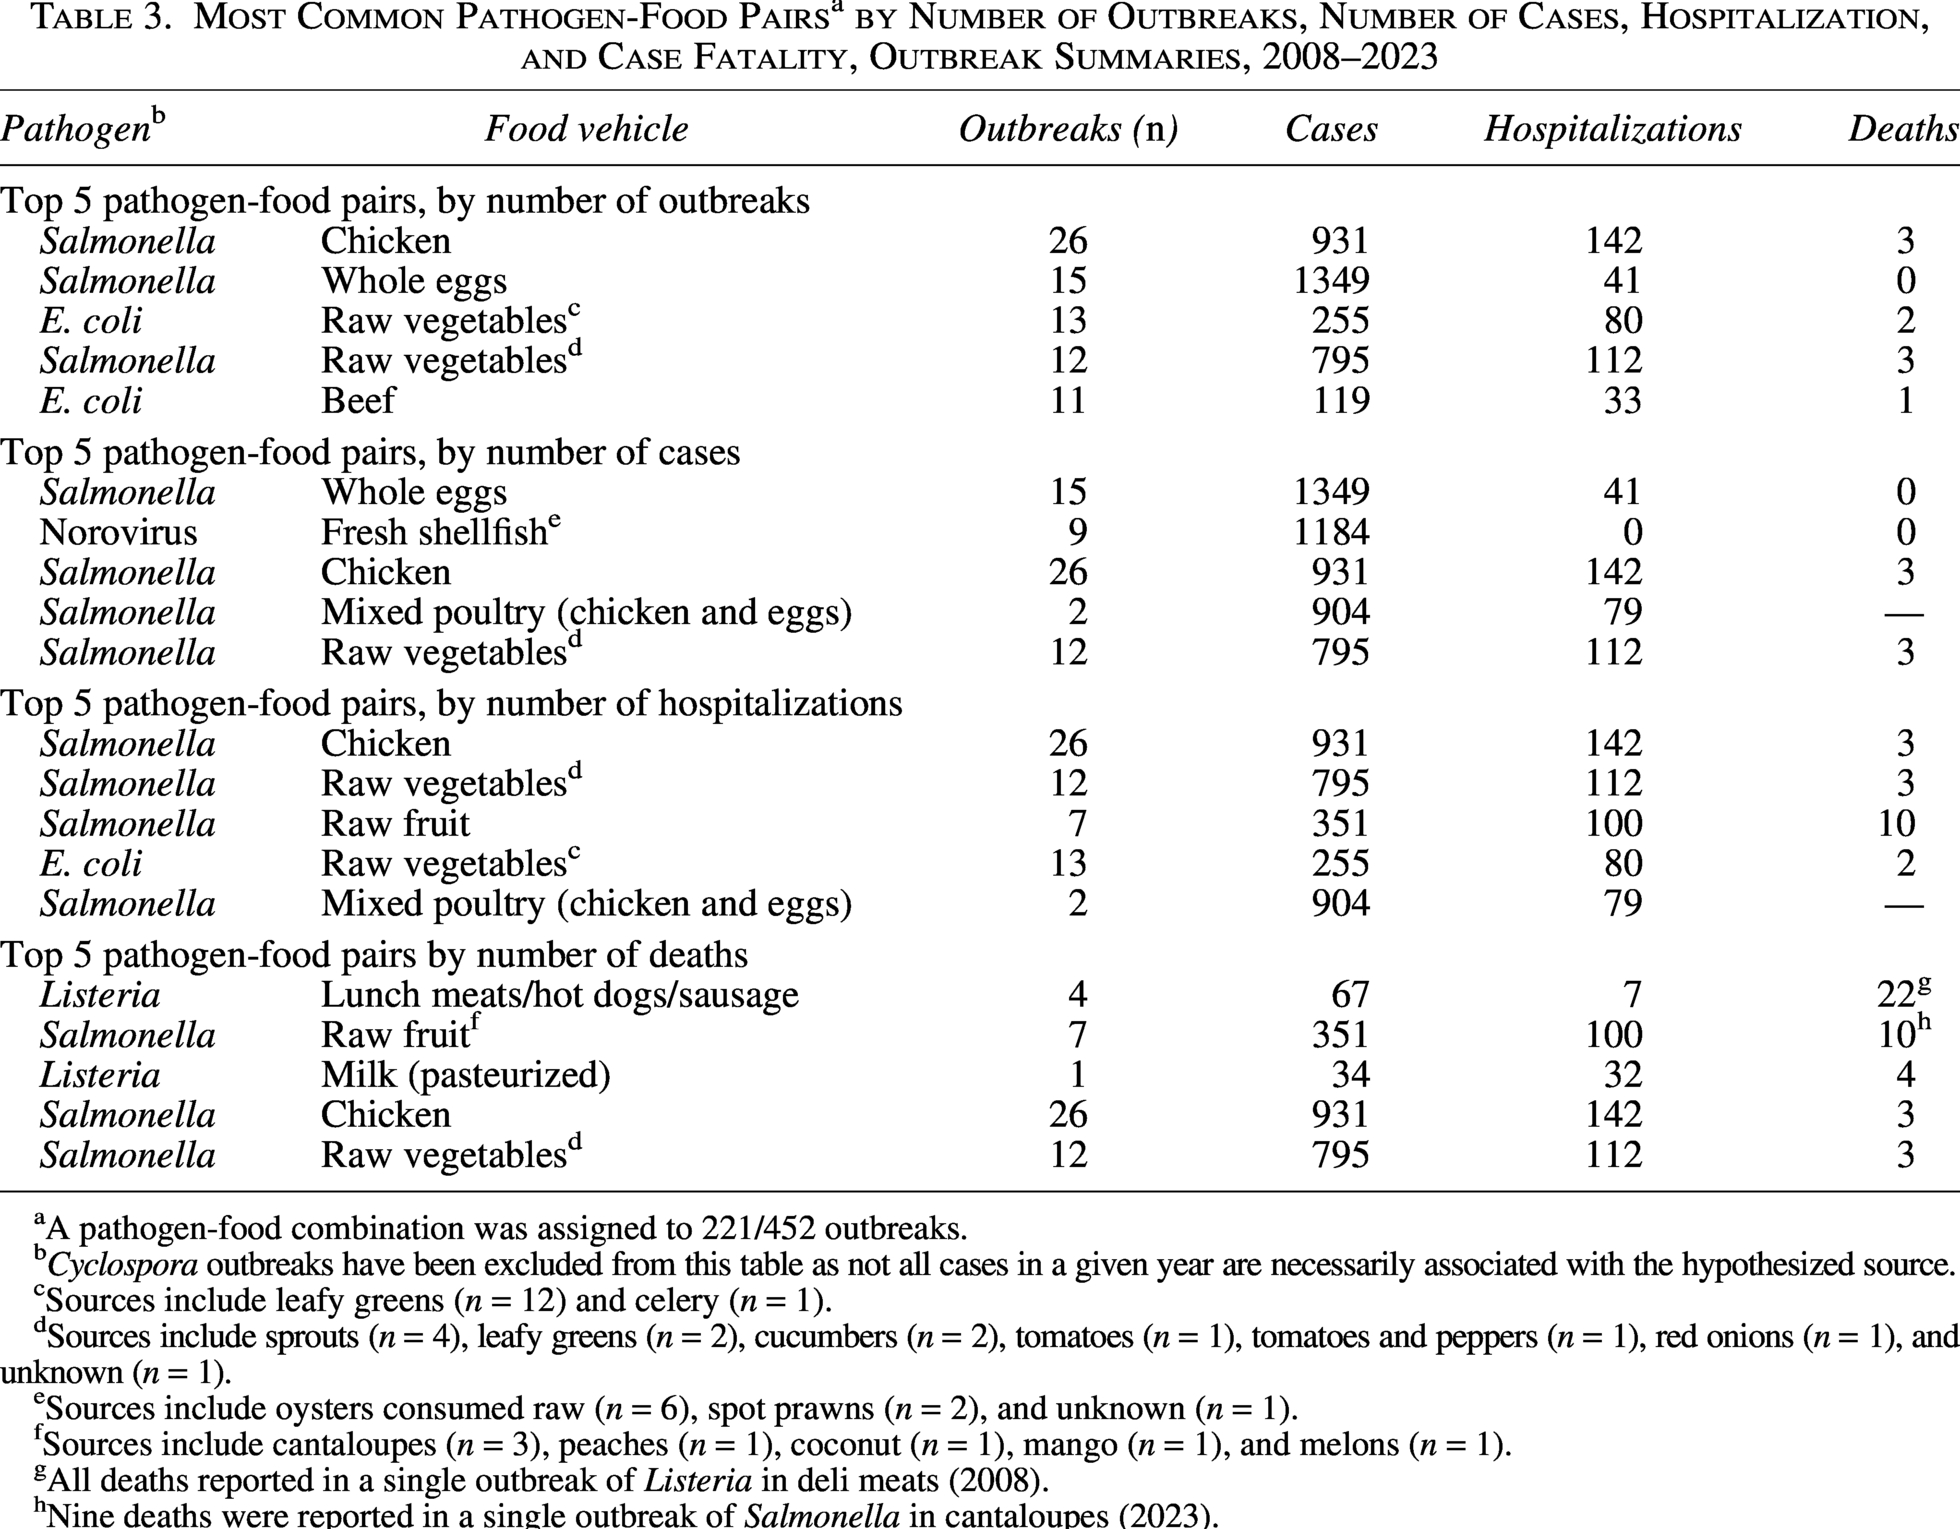
A pathogen-food combination was assigned to 221/452 outbreaks.
Cyclospora outbreaks have been excluded from this table as not all cases in a given year are necessarily associated with the hypothesized source.
Sources include leafy greens (n = 12) and celery (n = 1).
Sources include sprouts (n = 4), leafy greens (n = 2), cucumbers (n = 2), tomatoes (n = 1), tomatoes and peppers (n = 1), red onions (n = 1), and unknown (n = 1).
Sources include oysters consumed raw (n = 6), spot prawns (n = 2), and unknown (n = 1).
Sources include cantaloupes (n = 3), peaches (n = 1), coconut (n = 1), mango (n = 1), and melons (n = 1).
All deaths reported in a single outbreak of Listeria in deli meats (2008).
Nine deaths were reported in a single outbreak of Salmonella in cantaloupes (2023).
Discussion
Since 2008, submissions of foodborne outbreaks to OS have increased with expanding provincial and territorial participation. Since 2016, participation remained steady, but submissions declined during the COVID-19 pandemic, consistent with reduced capacity for outbreak investigation and submission to OS. This decline likely reflects fewer cases being reported, fewer outbreaks detected, and additional pressure on public health authorities across Canada. A Canadian study reported a 33% reduction in cases of enteric pathogens reported nationally by the provincial public health laboratories compared with the average number of cases reported in the previous 5 years (Dougherty et al., 2023). The reduction was attributed to public health measures implemented to reduce COVID-19 transmission, changes in health care–seeking behaviors, and restrictions on international travel. Ultimately, resources were devoted to the COVID-19 pandemic, and surveillance and response to other pathogens were impacted across Canada.
Observed changes in submission patterns, particularly at the local level, should be interpreted in the context of known reporting variability across jurisdictions. However, as all multijurisdictional outbreak investigations coordinated by PHAC are submitted to OS, trends in these outbreaks are less likely to be influenced by reporting bias. The increase in single P/T and multijurisdictional submissions in phase 3 (2016–2019) could be attributed to the transition from pulsed-field gel electrophoresis (PFGE) to whole genome sequencing (WGS) for identifying enteric disease clusters in Canada between 2017 and 2019. Using WGS, an increased number of Salmonella and Shiga toxin–producing E. coli (STEC) clusters were noted, and increased resolution to identify discrete clusters of Salmonella Enteritidis (Morton et al., 2024). Although the number of submissions in 2023 aligns with trends observed in phase 4, additional post-pandemic data are required to determine whether this pattern reflects the continuation of phase 4 or the onset of a new phase.
Salmonella remains the most common pathogen among foodborne illness outbreaks submitted to OS, accounting for 42% of all outbreaks with a known pathogen, consistent with previous findings (Bélanger et al., 2015). This aligns with findings from the National Enteric Surveillance Program, where Salmonella accounted for 44% of the reported isolates from 2008 to 2023 (Public Health Agency of Canada, 2025). Salmonella outbreaks submitted to OS have largely been associated with poultry products, including raw chicken and whole eggs. This association reflects a period of advancements in laboratory methods while also underestimating the true burden of the Salmonella-poultry pathogen-food pair. Following Canada’s implementation of WGS for clinical and nonclinical Salmonella isolates in 2017, the ability to determine the genetic relatedness of Salmonella isolates (especially among common serovars like Salmonella Enteritidis) was enhanced. With this increased discrimination, there was a period of intensified public health focus and investigations targeting specific frozen raw breaded chicken products (FRBCPs). Between 2017 and 2019, certain FRBCPs were implicated in 16 multijurisdictional outbreaks with more than 485 laboratory-confirmed cases of Salmonella (Morton et al., 2019). In response, the Canadian Food Inspection Agency (CFIA) implemented new control measures in 2019 to address the risk of Salmonella in certain FRBCP (Canadian Food Inspection Agency, 2019), after which no further outbreaks of Salmonella associated with the aforementioned FRBCP have been identified in Canada (Kerr et al., 2024). Apart from these targeted investigations, multijurisdictional clusters of Salmonella consistent with poultry exposure are generally not investigated due to limited exposure specificity provided by cases and the absence of clear product-level public health actions available in Canada. This likely explains the observed association driven by FRBCP-targeted investigations and the underestimation across all years due to the lack of investigation of Salmonella clusters where poultry is the suspected source.
Outbreaks of STEC in raw vegetables, particularly leafy greens, are well-documented (Kozak et al., 2013; Marshall et al., 2020). These investigations are challenging due to the short shelf life of produce, limited branding and traceability, storage requirements, seasonality, and cross-border distribution (Kozak et al., 2013). Outbreaks of a recurring strain of E. coli O157 were investigated in Canada each fall season from 2016 through 2019 and were ultimately linked to romaine lettuce traced back to specific growing regions in California, USA. The CFIA first introduced temporary import requirements for romaine lettuce in 2019, and enhanced requirements were implemented in 2020. Since then, CFIA has applied Safe Food for Canadians license conditions on romaine lettuce imported from the United States annually between September and December (Canadian Food Inspection Agency, 2025). These measures reflect coordinated investigative efforts among PHAC, CFIA, and Health Canada, and no outbreaks of that strain of E. coli O157 have been detected in Canada since their implementation.
Outbreaks of L. monocytogenes are rare in Canada, accounting for only one percent of total outbreak illnesses, but contribute disproportionately to the morbidity and mortality associated with foodborne illness outbreaks in Canada. While lunch meats/hot dogs/sausage contaminated with L. monocytogenes was the pathogen-food pair with the highest absolute number of outbreak-related fatalities (n = 22) and a case-fatality rate of 32%, this represents only a single outbreak in 2008 associated with ready-to-eat deli meat (Currie et al., 2015). Other notable L. monocytogenes outbreaks in Canada since 2008 include a provincial outbreak associated with the postpasteurization contamination of chocolate milk in Ontario (Hanson et al., 2019), and a multistate (the United States), multijurisdictional (Canada) outbreak associated with packaged leafy green salads (Self et al., 2019). The implementation of WGS for L. monocytogenes in 2017 reduced the number of genetically related clusters detected (Morton et al., 2024). From 2019 to 2023, only three outbreaks were submitted to OS; one with a likely source of cooked diced chicken (Public Health Agency of Canada, 2019) and two with no confirmed source.
Seasonal increases in Cyclospora were investigated annually between 2013 and 2022, primarily based on epidemiological data, due to the absence of a validated laboratory subtyping method (Morton et al., 2025). Retrospective genotyping of Canadian Cyclospora cayetanensis isolates revealed multiple genetic clusters within the national investigations (Yanta et al., 2022), suggesting that multiple food vehicles account for the seasonal increase observed in Canada. Investigations within single provinces have identified various fresh produce vehicles, including Thai basil, basil, and sugar snap peas (Hoang et al., 2005; Milord et al., 2012; Shah et al., 2009; Whitfield et al., 2017).
Since the inception of OS in 2008, several Canadian outbreaks involving novel food vehicles have been documented. These include a 2014 multiserotype Salmonella outbreak linked to sprouted chia seed powder produced in Canada with associated illnesses in the United States (Harvey et al., 2017); a 2016 outbreak of E. coli O121 linked to raw flour (Morton et al., 2017); a 2021 outbreak of Salmonella Typhimurium associated with tofu across multiple health districts in Ontario (Osasah et al., 2023); and the first Canadian outbreak of E. coli O157 associated with kimchi in 2022, which was also the first reported outbreak outside of East Asia (Smith et al., 2023). In 2022, three aconitine poisoning events in two provinces were traced to mislabeled Aconitum sold as Kaempferia galanga powder, prompting updates to outbreak response protocols (McIntyre et al., 2025). Collectively, these examples demonstrate how systematic documentation of implicated food sources can inform hypothesis generation during future outbreak investigations.
Several limitations must be considered when interpreting the OS dataset. As a voluntary national program, OS relies on outbreak investigations conducted by local, regional, provincial, and territorial public health authorities. While all multijurisdictional outbreaks investigated by PHAC are submitted to OS, participation varies by jurisdiction, and not all outbreaks are submitted by participating P/Ts. At their discretion, P/Ts may submit only local/regional outbreaks, only province/territory-wide outbreaks, or both, and some exclude the submission of certain types of outbreaks (e.g., institutional), reflecting differences in resources, prioritization, and data-sharing practices. Given the voluntary nature of participation and variability in data-sharing across jurisdictions, the dataset does not represent all outbreaks and varies in completeness and level of detail. As a result, OS should not be treated as a comprehensive estimate of outbreak incidence in Canada. OS is a dynamic program, in which outbreak summaries can be submitted or updated at any time. Therefore, these results may differ from previous or future analyses. There are inherent challenges pertaining to data quality, completeness, and consistency within and between jurisdictions. Some outbreaks have an unknown food vehicle or pathogen, and must be excluded from specific analyses, limiting dataset representativeness. Outbreaks submitted to OS without a determined or designated mode of transmission were also excluded. Although some of these outbreaks may be foodborne, this dataset assumes the mode of transmission assigned by the submitting public health authority is accurate and is used without modification.
Conclusion
OS continues to serve as a national platform for the systematic collection of standardized outbreak investigation data across participating jurisdictions, capturing information on implicated pathogens, food vehicles, and outbreak characteristics. This analysis examined more than 15 years of enteric foodborne outbreak investigation data in Canada, a dataset that has grown substantially since the previous overview published in 2015. These data support the work of public health authorities by informing outbreak investigations, identifying trends in foodborne illness outbreaks, and guiding policy development to protect public health. Continued increases in participation in OS will support achieving a more comprehensive characterization of foodborne illness outbreaks in Canada.
Authors’ Contributions
E.S.: Conceptualization, data curation, formal analysis, investigation, methodology, project administration, validation, visualization, writing—original draft, and writing—review and editing. E.T.: Conceptualization, data curation, formal analysis, investigation, methodology, validation, visualization, writing—original draft, and writing—review and editing. L.C.: Data curation, methodology, validation, and writing—review and editing. A.-M.L.: Conceptualization, data curation, methodology, validation, and writing—review and editing. M.P.: Conceptualization, project administration, resources, supervision, validation, writing—original draft, and writing—review and editing.
Data Availability Statement
The data analyzed during the current study are not publicly available due to privacy and legislative requirements. Data requests may be submitted to the corresponding author for consideration.
Footnotes
Acknowledgments
The authors acknowledge the investigative efforts of public health authorities locally, regionally, provincially, and territorially and the collaborative contribution of their investigations to OS. The authors thank the CNPHI team for the development and maintenance of the OS reporting platform.
Disclosure Statement
The authors declared no potential conflicts of interest with respect to the research, authorship, and/or publication of this article.
Funding Information
The authors received no financial support for the research, authorship, and/or publication of this article.