
Abstract
Background
This study aimed to evaluate the diagnostic performance of magnetic resonance imaging (MRI)-based radiomics for predicting pathological complete response (pCR) after neoadjuvant chemoradiotherapy in patients with locally advanced rectal adenocarcinoma.
Methods
Eligible studies developed MRI-based radiomics or deep learning models to predict pCR and reported sufficient data to reconstruct 2 × 2 contingency tables. Only validation cohorts were included in the quantitative synthesis. Study quality was assessed using Quality Assessment of Diagnostic Accuracy Studies-2 and the Radiomics Quality Score. Pooled sensitivity, specificity, positive likelihood ratio (PLR), negative likelihood ratio (NLR), and diagnostic odds ratio were estimated using a bivariate random-effects model. Hierarchical summary receiver operating characteristic (HSROC) analysis was performed.
Results
Thirty-eight studies were included. The pooled sensitivity and specificity were 0.82 (95% CI, 0.71-0.90) and 0.86 (95% CI, 0.80-0.91), respectively. The pooled PLR and NLR were 6.0 (95% CI, 4.0-8.9) and 0.21 (95% CI, 0.12-0.35), corresponding to a diagnostic odds ratio of 29 (95% CI, 14-61). HSROC analysis showed an area under the curve of 0.846. Subgroup analyses suggested improved performance for deep learning and combined clinical–radiomic models.
Conclusion
MRI-based radiomics demonstrates good diagnostic accuracy for predicting pCR after neoadjuvant chemoradiotherapy in rectal cancer, although methodological heterogeneity and limited prospective validation remain challenges.
Keywords
Introduction
Rectal cancer remains a major global health burden and represents a substantial proportion of colorectal malignancies worldwide. 1 According to GLOBOCAN 2020 data, colorectal cancer ranks among the most frequently diagnosed cancers and is a leading cause of cancer-related mortality globally. 1 A significant proportion of patients present with locally advanced rectal cancer (LARC), for which neoadjuvant chemoradiotherapy (nCRT) followed by total mesorectal excision (TME) has been established as the standard treatment strategy. 2
Despite advances in multimodal therapy, tumor response to nCRT is highly heterogeneous. 3 Pathological complete response (pCR), defined as the absence of viable tumor cells in the resected specimen (ypT0N0), occurs in ∼15% to 30% of patients. 4 Importantly, patients achieving pCR demonstrate excellent long-term oncologic outcomes, including lower local recurrence rates and improved survival. 5 These findings have supported the development of organ-preserving strategies, such as local excision or a nonoperative “watch-and-wait” approach, in carefully selected complete responders. 6 Avoiding radical surgery may significantly reduce morbidity, including bowel dysfunction, urinary and sexual impairment, and permanent stoma formation. 7 Therefore, accurate preoperative identification of patients who achieve pCR is of paramount importance for individualized treatment planning. 8
Magnetic resonance imaging (MRI) plays a central role in both primary staging and posttreatment assessment of rectal cancer due to its superior soft-tissue contrast resolution and its ability to evaluate tumor extent, circumferential resection margin involvement, extramural vascular invasion, and nodal status. 9 MRI-based tumor regression grading (mrTRG) has been proposed to assess response after nCRT. 10 However, conventional qualitative MRI assessment remains limited by interobserver variability and insufficient accuracy in distinguishing complete from incomplete responders. 11 Thus, reliable noninvasive imaging biomarkers capable of predicting pCR before surgery remain an unmet clinical need. 12
Radiomics has emerged as a promising quantitative imaging approach that enables high-throughput extraction of mineable features from standard medical images. 13 These features, including first-order intensity statistics, shape descriptors, and higher-order texture metrics, may reflect tumor heterogeneity and underlying biological characteristics that are not visually appreciable. 14 By integrating radiomic features with machine learning (ML) or deep learning (DL) algorithms, predictive models can be developed to estimate treatment response and prognosis. 15
In rectal cancer, MRI-based radiomics has been investigated for multiple clinical applications, including tumor staging, prediction of nodal involvement, distant metastasis, molecular status, and response to neoadjuvant therapy. 16 Over the past decade, numerous studies have specifically evaluated artificial intelligence (AI)-based MRI models for predicting pCR after nCRT. 17 Although many individual studies report encouraging diagnostic performance, their results are heterogeneous, and the overall pooled accuracy remains unclear. 18
Furthermore, radiomics research is methodologically complex and susceptible to bias, particularly in relation to feature selection, model overfitting, lack of external validation, and limited reproducibility. 19 The Radiomics Quality Score (RQS) was introduced to standardize the evaluation of methodological rigor in radiomics studies. 20 The Quality Assessment of Diagnostic Accuracy Studies-2 (QUADAS-2) tool allows structured assessment of bias in diagnostic accuracy studies. 21
Although previous systematic reviews have examined AI-assisted imaging in rectal cancer, the rapid expansion of MRI-based radiomics and DL studies in recent years necessitates an updated and focused metaanalysis specifically addressing the prediction of pathological complete response.
Methods
This systematic review and metaanalysis was conducted in accordance with the PRISMA 2020 guidelines for systematic reviews of diagnostic test accuracy studies. The study protocol was prospectively registered in the PROSPERO database (International Prospective Register of Systematic Reviews; registration number: CRD420261334791). The reporting of diagnostic accuracy measures followed principles outlined in the STARD guidelines where applicable. The methodological approach was specifically designed for diagnostic test accuracy metaanalyses and incorporated hierarchical modeling of sensitivity and specificity using established bivariate and hierarchical summary receiver operating characteristic (HSROC) frameworks.
Search Strategy
A comprehensive literature search was performed in PubMed, Web of Science Core Collection, and Scopus from database inception to February 10, 2026. The search strategy combined controlled vocabulary (MeSH and Emtree terms) with free-text keywords using Boolean operators. Search terms were adapted for each database. No initial language restrictions were applied during database searching. The full electronic search strategy for each database is provided in Supplemental Table S1. In addition, reference lists of included studies and relevant review articles were manually screened to identify potentially eligible publications not captured in the electronic search. Although Embase and the Cochrane Library were included in the search strategy, no additional eligible studies were identified from these databases after deduplication.
Eligibility Criteria
Studies were considered eligible if they included patients with histologically confirmed locally advanced rectal adenocarcinoma (clinical stage T3–T4 and/or node-positive disease) who underwent neoadjuvant chemoradiotherapy followed by surgical resection. Both standard long-course chemoradiotherapy regimens and protocol-based treatment strategies were accepted. Magnetic resonance imaging had to be used as the primary imaging modality for model development. In studies employing multimodal imaging, MRI-based results were required to be reported separately.
Eligible studies were required to develop MRI-based radiomics or artificial intelligence models, including ML or DL approaches, for the purpose of predicting pathological complete response. Pathological complete response had to be defined according to histopathological examination of the surgical specimen, typically as ypT0N0 or absence of viable tumor cells. For the purposes of this metaanalysis, MRI-based radiomics was broadly defined to include conventional handcrafted radiomics, DL-based feature extraction, and hybrid models combining both approaches. This conceptual heterogeneity was acknowledged in the interpretation.
Furthermore, studies were required to provide sufficient diagnostic performance data to enable reconstruction of 2 × 2 contingency tables. Studies were required to report a validation strategy, including internal validation or external validation. Full-text articles published in English were included.
Studies were excluded if they enrolled fewer than 10 patients, lacked a validation cohort, or did not report pathological complete response as a distinct outcome. Review articles, systematic reviews, metaanalyses, case reports, editorials, and conference abstracts were excluded. Studies evaluating neoadjuvant chemotherapy alone or radiotherapy alone were not considered eligible. Additionally, studies that reported treatment response only as “responder” versus “nonresponder” without explicit pathological complete response data were excluded. Reports with overlapping patient cohorts or duplicate populations were carefully assessed, and only the most comprehensive or recent dataset was included. Studies lacking sufficient data to reconstruct contingency tables were also excluded.
To identify overlapping cohorts, we systematically cross-checked author lists, institutional affiliations, recruitment periods, and study settings. When potential overlap was suspected, the most comprehensive or recent dataset was retained. Due to the lack of author contact in most cases, overlap identification relied on detailed comparison of reported study characteristics.
Data Extraction
Data extraction was independently performed by two reviewers using a predefined standardized data collection form. For each eligible study, information regarding study characteristics was recorded, including the first author, year of publication, country of origin, study design (prospective or retrospective), and total sample size.
Clinical and treatment-related data were also collected, including details of the neoadjuvant chemoradiotherapy protocol and surgical management. The definition of pathological complete response used in each study was documented to ensure consistency with the reference standard (ypT0N0 or absence of viable tumor cells).
MRI acquisition parameters were extracted, including field strength, imaging sequences, and timing of posttreatment imaging relative to surgery. Details of the radiomics workflow were recorded, including region-of-interest segmentation strategy (two-dimensional (2D) or three-dimensional (3D); manual, semiautomatic, or automatic), feature extraction software, number and type of radiomic features, feature selection approaches, and modeling algorithms. Validation strategies (internal split-sample, cross-validation, or external validation) and the inclusion of clinical variables in combined models were also documented.
For diagnostic accuracy analysis, sensitivity, specificity, and area under the receiver operating characteristic curve (AUC) were extracted. When necessary, true-positive, false-positive, true-negative, and false-negative values were reconstructed from reported performance metrics to generate 2 × 2 contingency tables for metaanalytic pooling. When multiple models or thresholds were reported within a single study, we predefined a selection hierarchy prioritizing (1) external validation results, (2) clinically relevant models, and (3) models with prespecified thresholds. This approach minimized selective reporting bias. Discrepancies between reviewers were resolved through discussion until consensus was achieved.
Quality Assessment
The methodological quality and risk of bias of the included studies were independently evaluated using the QUADAS-2 tool and the RQS framework.
QUADAS-2 was applied to assess the risk of bias and applicability concerns in diagnostic accuracy studies across four domains: patient selection, index test, reference standard, and flow and timing. Each domain was judged as having low, high, or unclear risk of bias according to predefined signaling questions. Applicability concerns were evaluated for the first three domains. The detailed assessment criteria are provided in Supplemental Table S2.
Methodological rigor of the radiomics workflow was evaluated using the RQS. The RQS, introduced by Lambin et al, 22 was specifically developed to assess the robustness, reproducibility, and clinical relevance of radiomics studies. The scoring system consists of 16 items encompassing multiple stages of the radiomics pipeline, including data selection, image acquisition and segmentation, feature extraction, model development, validation, biological correlation, and clinical utility. RQS values were calculated as absolute scores and expressed as percentages of the maximum achievable score.
Quality assessment was performed independently by two reviewers. Any discrepancies were resolved through discussion until consensus was reached. When necessary, a third senior reviewer was consulted to adjudicate disagreements.
Statistical Analysis
All statistical analyses were performed using RStudio (R Foundation for Statistical Computing, Vienna, Austria) with the mada package for diagnostic test accuracy metaanalysis. For each included study, 2 × 2 contingency tables (true positives, false positives, true negatives, and false negatives) were extracted or reconstructed when necessary to calculate study-specific sensitivity and specificity.
Pooled estimates of sensitivity, specificity, positive likelihood ratio (PLR), negative likelihood ratio (NLR), and diagnostic odds ratio (DOR) were obtained using the bivariate random-effects model of Reitsma, which jointly synthesizes sensitivity and specificity while accounting for their potential correlation and between-study variability. Summary receiver operating characteristic (SROC) curves were generated using the HSROC framework, and the AUC was calculated to summarize the overall diagnostic performance of the models.
Forest plots of sensitivity and specificity were constructed to visualize interstudy variability. Between-study heterogeneity was evaluated using the variance components of the bivariate model and I2 estimates derived from the Zhou–Dendukuri and Holling approaches. I2 values > 50% were considered indicative of substantial heterogeneity. In addition, visual inspection of the SROC curve, along with the corresponding confidence and prediction regions, was performed to further assess variability across studies.
To explore potential sources of heterogeneity, predefined subgroup analyses were conducted according to modeling methodology (radiomics algorithms vs DL), sample size (<100 vs ≥100), radiomics feature extraction software (PyRadiomics vs other platforms), segmentation strategy (2D vs 3D), validation approach (split/internal validation vs external validation), and model type (radiomics-only models vs combined models incorporating clinical variables).
Potential threshold effects were assessed by calculating the Spearman correlation coefficient between the logit of sensitivity and the logit of (1 − specificity). A statistically significant positive correlation suggested the presence of a threshold effect.
Publication bias in diagnostic accuracy studies was evaluated using Deeks’ funnel plot asymmetry test, with P < .10 indicating significant asymmetry. All statistical tests were two-sided, and P < .05 was considered statistically significant unless otherwise specified.
Results
Literature Search and Study Selection
The literature search identified a total of 795 records across PubMed, Web of Science Core Collection, and Scopus databases. After removal of 70 duplicate records, 725 studies remained for title and abstract screening. Following initial screening, 640 records were excluded based on irrelevance to the study objective. The full texts of 85 articles were subsequently assessed for eligibility. Of these, 47 studies were excluded for the following reasons: review articles or systematic reviews (n = 12), absence of pathological complete response as an endpoint (n = 9), nonisolated MRI radiomics analyses (n = 12), insufficient diagnostic performance data (n = 6), and overlapping patient cohorts (n = 8). Ultimately, 38 studies met the predefined eligibility criteria and were included in the qualitative and quantitative synthesis. The detailed study selection process is illustrated in Figure 1. A total of 32 non-English articles were identified during full-text screening and were excluded due to language restrictions.
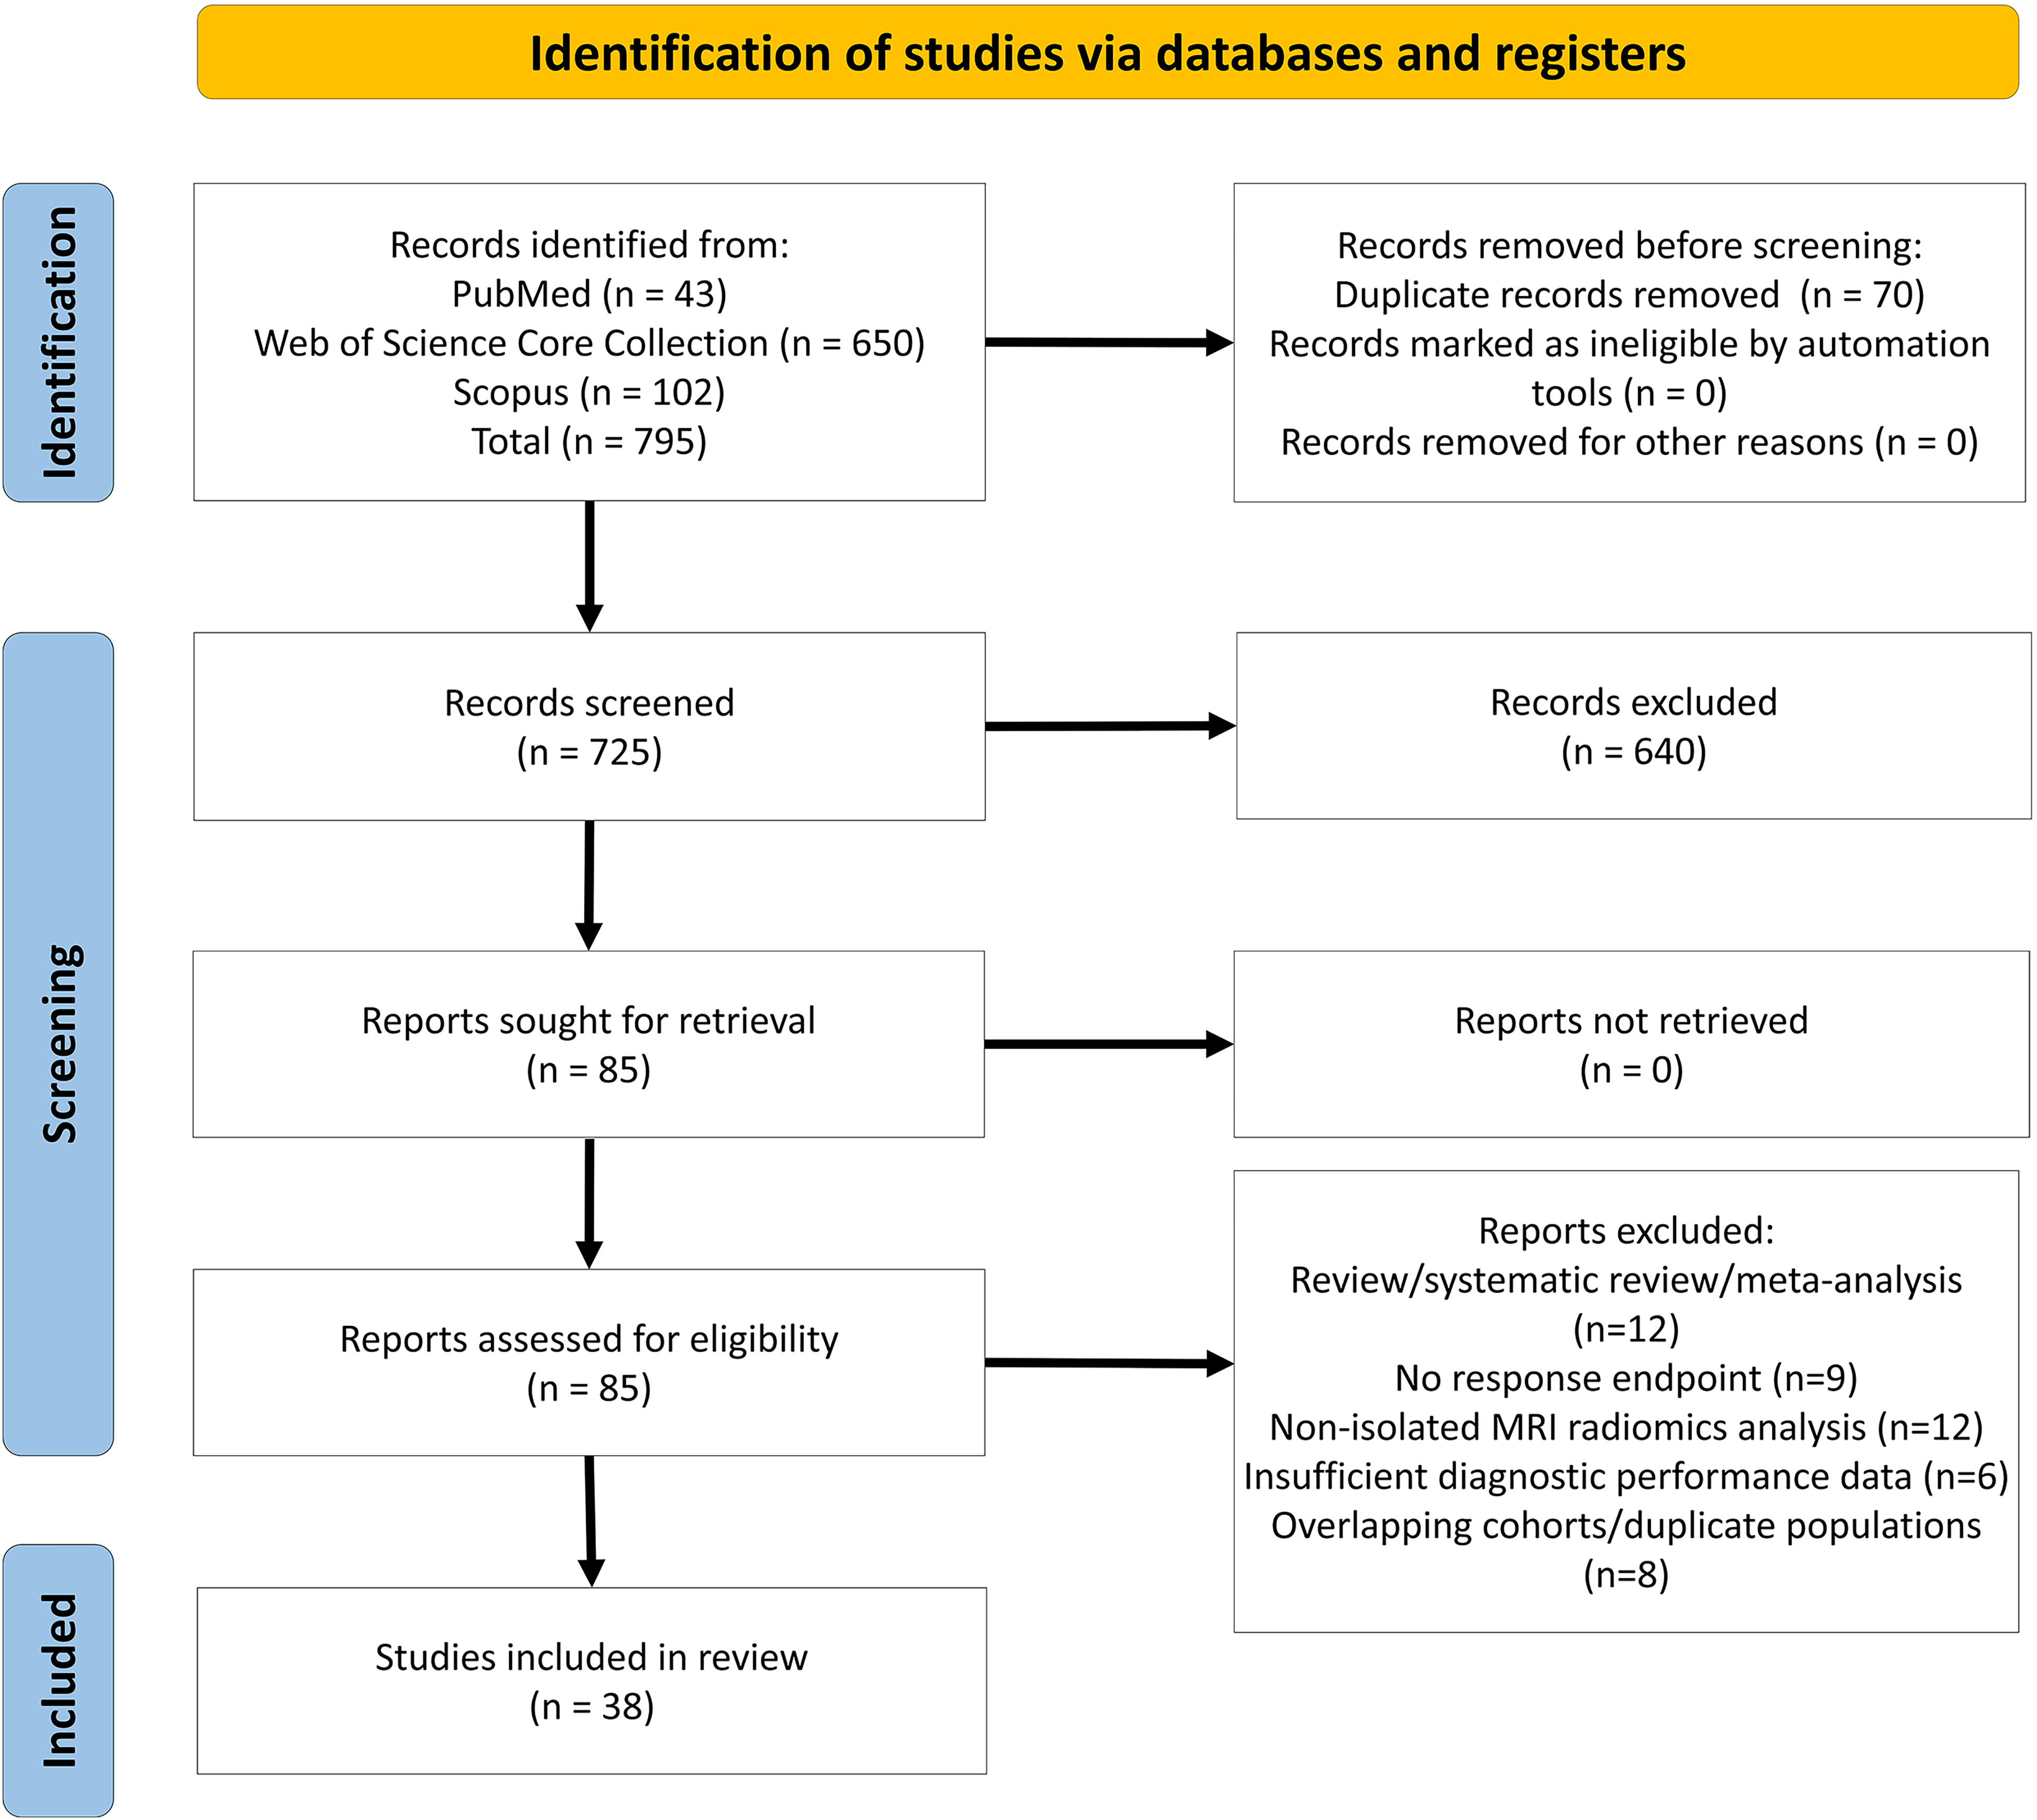
PRISMA 2020 flow diagram illustrating the study selection process for the systematic review of magnetic resonance imaging (MRI) radiomics studies.
Characteristics of Included Studies
The 38 included studies were published between 2018 and 2026 and reflected the rapidly expanding interest in MRI-based radiomics for treatment response prediction in rectal cancer. Most investigations were retrospective in design, while a smaller proportion were prospective cohort studies. Together, these studies evaluated patients with locally advanced rectal adenocarcinoma treated with neoadjuvant chemoradiotherapy followed by surgical resection.
Across the included studies, pathological complete response (pCR) was generally defined as ypT0N0 or absence of viable tumor cells in the resected specimen, in accordance with internationally accepted pathological staging systems. Minor variations in wording were observed, but the reference standard consistently relied on histopathological examination.
Neoadjuvant treatment protocols primarily consisted of long-course chemoradiotherapy with total radiation doses typically ranging between ∼41 and 50 Gy, administered concurrently with fluoropyrimidine-based chemotherapy, with or without oxaliplatin. Surgical management was based on total mesorectal excision principles, consistent with established oncologic standards.
MRI acquisition parameters varied across institutions. Both 1.5-T and 3.0-T scanners were used, either exclusively or in combination. The majority of studies incorporated multiparametric MRI, commonly including high-resolution T2-weighted imaging and diffusion-weighted imaging, while a subset additionally used contrast-enhanced sequences. Variability in slice thickness, acquisition protocols, and timing of posttreatment imaging relative to surgery was observed, reflecting real-world heterogeneity in clinical practice.
Segmentation strategies demonstrated methodological diversity. Manual region-of-interest delineation was the most frequently applied approach, although semiautomatic and automatic segmentation methods were reported in several studies. Both 2D and 3D segmentation techniques were utilized. Radiomic feature extraction was performed using established platforms such as PyRadiomics as well as in-house or commercial software, consistent with current radiomics standards.
The number of extracted radiomic features varied substantially among studies, often exceeding several hundred features per model. Consequently, dimensionality reduction techniques—such as Pearson correlation filtering, least absolute shrinkage and selection operator (LASSO) regression, and other regularization methods—were routinely applied to mitigate overfitting risk. Most predictive models were constructed using conventional ML algorithms, including logistic regression, support vector machines, and random forest classifiers. A subset of studies employed DL architectures, reflecting the growing integration of neural networks in oncologic imaging research.
Validation strategies included internal split-sample validation, cross-validation, and external validation cohorts. Several studies developed combined models integrating clinical parameters with radiomic features, consistent with recommendations to enhance predictive robustness and clinical applicability. A detailed overview of study characteristics and modeling approaches is presented in Tables 1 and 2.
Summary of General Study Characteristics.
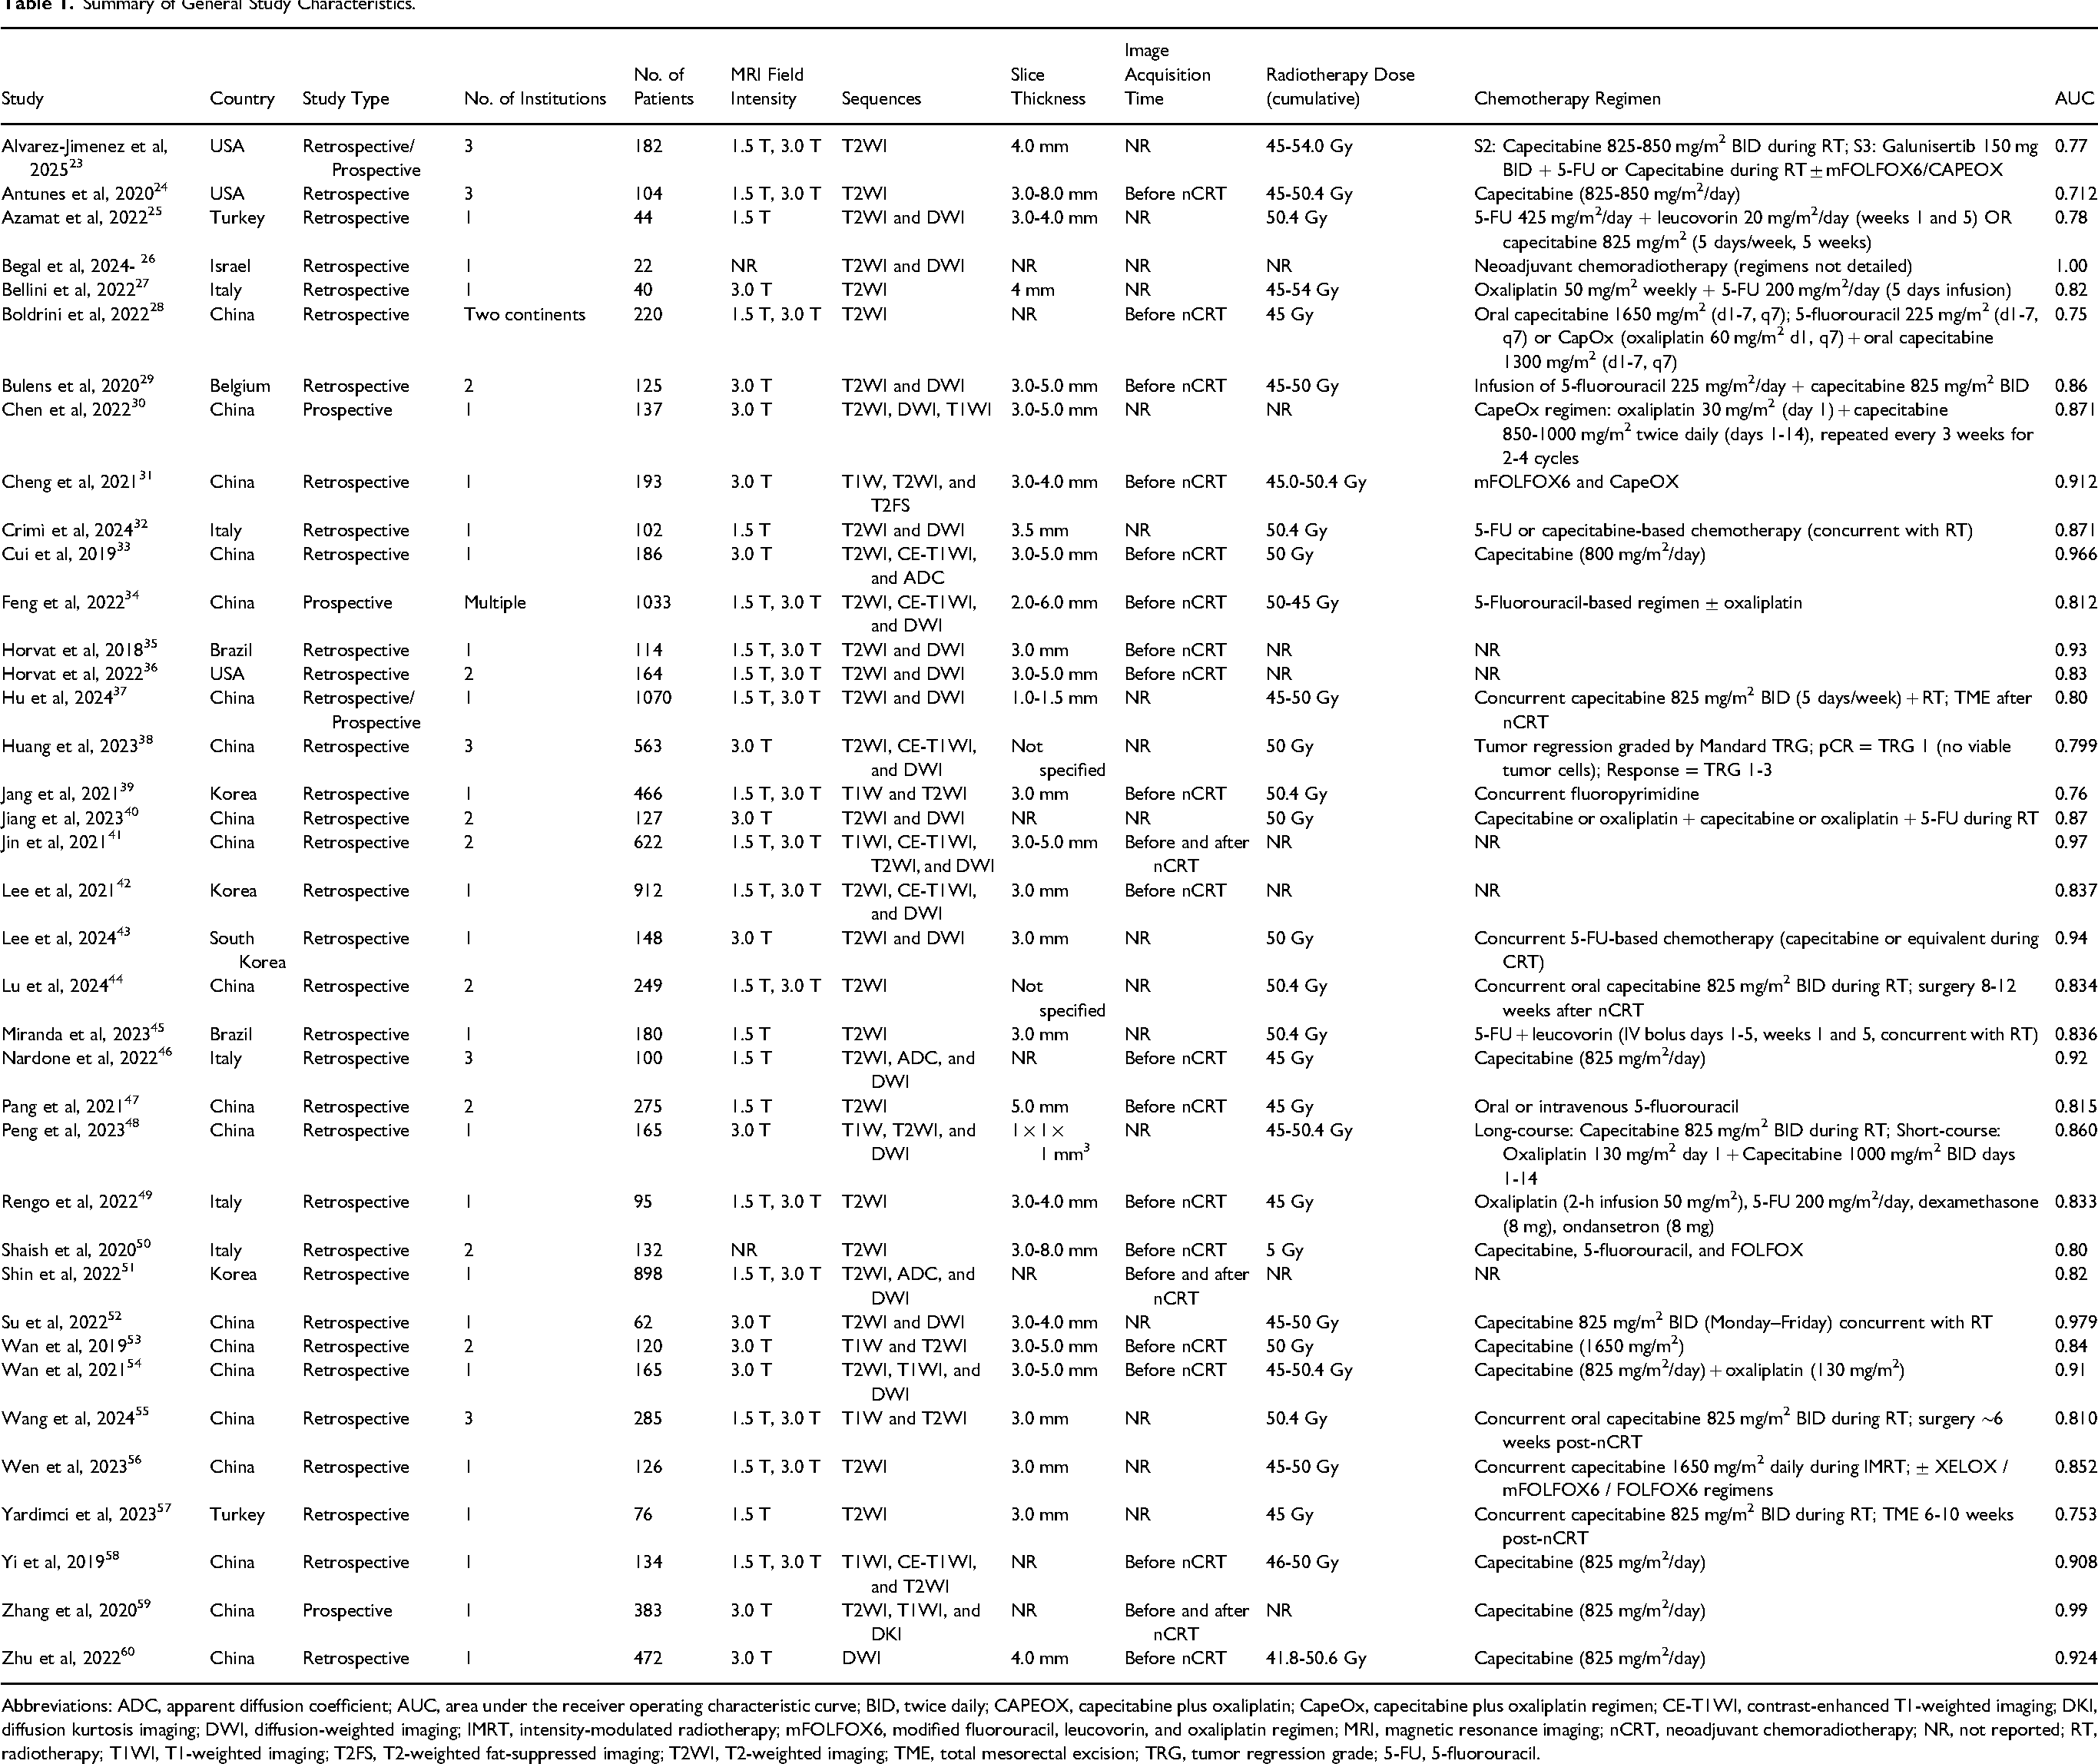
Abbreviations: ADC, apparent diffusion coefficient; AUC, area under the receiver operating characteristic curve; BID, twice daily; CAPEOX, capecitabine plus oxaliplatin; CapeOx, capecitabine plus oxaliplatin regimen; CE-T1WI, contrast-enhanced T1-weighted imaging; DKI, diffusion kurtosis imaging; DWI, diffusion-weighted imaging; IMRT, intensity-modulated radiotherapy; mFOLFOX6, modified fluorouracil, leucovorin, and oxaliplatin regimen; MRI, magnetic resonance imaging; nCRT, neoadjuvant chemoradiotherapy; NR, not reported; RT, radiotherapy; T1WI, T1-weighted imaging; T2FS, T2-weighted fat-suppressed imaging; T2WI, T2-weighted imaging; TME, total mesorectal excision; TRG, tumor regression grade; 5-FU, 5-fluorouracil.
Characteristics of Artificial Intelligence-Based Predictive Models in the Included Studies.
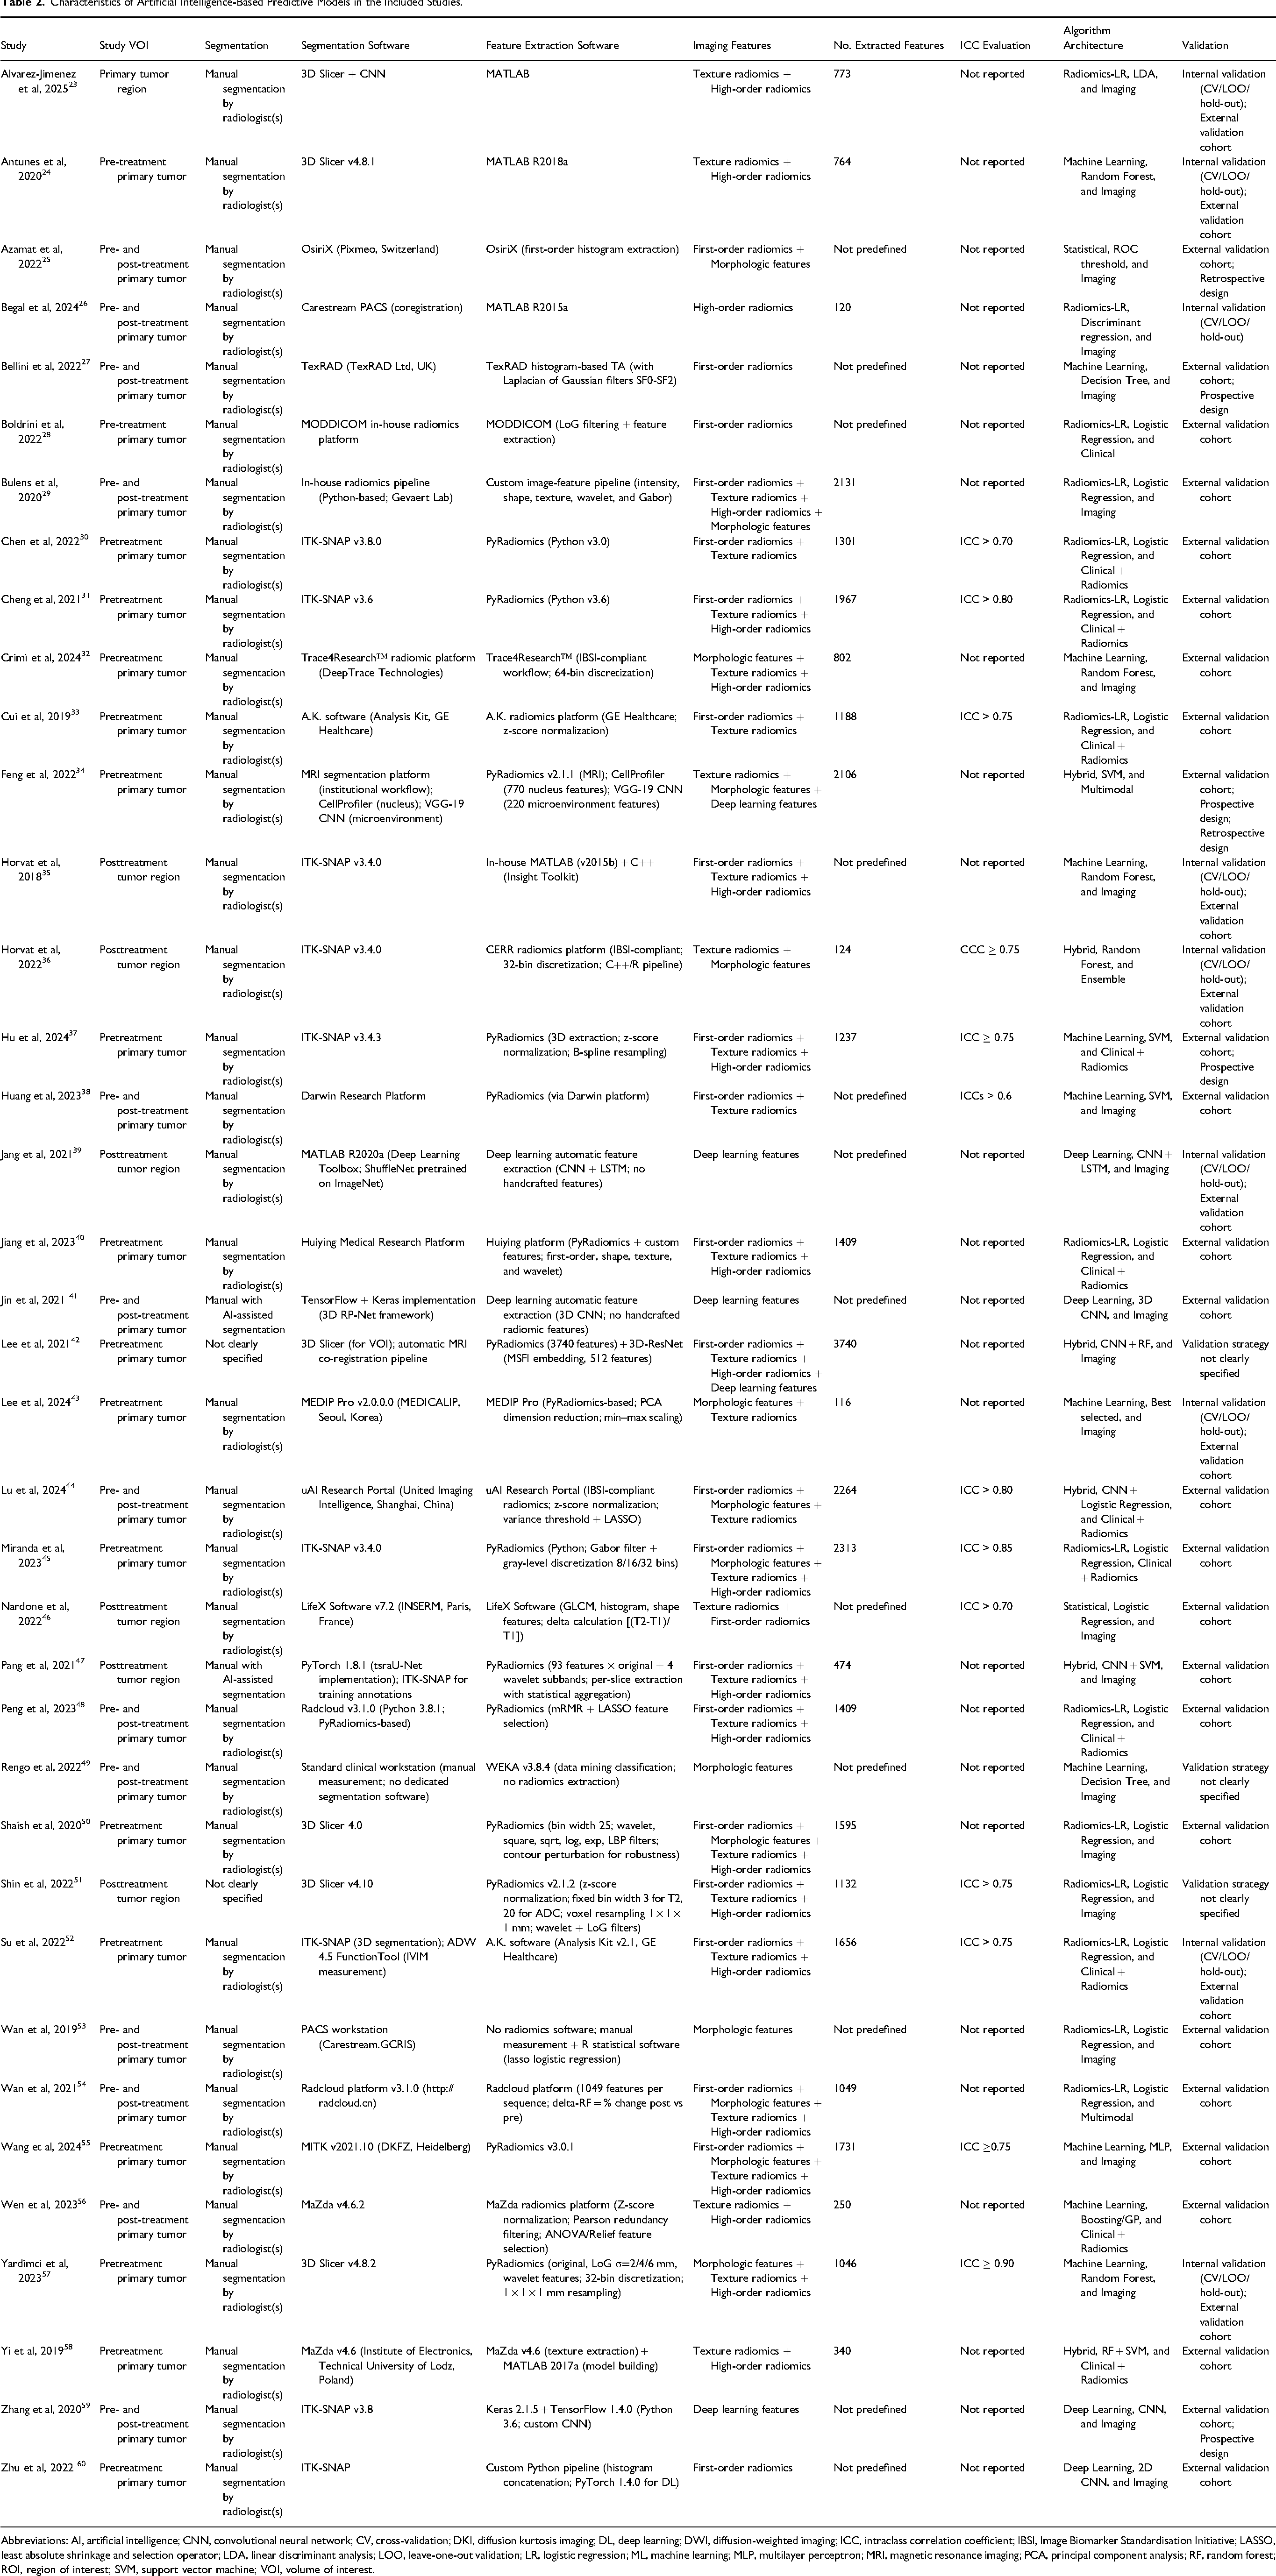
Abbreviations: AI, artificial intelligence; CNN, convolutional neural network; CV, cross-validation; DKI, diffusion kurtosis imaging; DL, deep learning; DWI, diffusion-weighted imaging; ICC, intraclass correlation coefficient; IBSI, Image Biomarker Standardisation Initiative; LASSO, least absolute shrinkage and selection operator; LDA, linear discriminant analysis; LOO, leave-one-out validation; LR, logistic regression; ML, machine learning; MLP, multilayer perceptron; MRI, magnetic resonance imaging; PCA, principal component analysis; RF, random forest; ROI, region of interest; SVM, support vector machine; VOI, volume of interest.
RQS and Risk of Bias Assessment
Methodological quality of the included studies was assessed using the RQS framework. The overall RQS analysis demonstrated moderate methodological rigor, with substantial variability across studies. While most investigations adequately described imaging protocols and feature extraction procedures, critical components such as phantom studies for scanner harmonization, prospective validation, cost-effectiveness analysis, and open science practices were rarely implemented.
Items related to feature reduction, internal validation, and reporting of model performance were more consistently fulfilled. However, external validation remained limited to a subset of studies, underscoring persistent challenges in the reproducibility and generalizability of radiomics models. Biological correlation analyses and prospective study designs were infrequently reported, consistent with previously identified limitations in radiomics research.
Risk of bias and applicability concerns were evaluated using the QUADAS-2 tool. In the patient selection domain, several studies were judged to have unclear or high risk of bias due to retrospective enrollment or insufficient reporting of inclusion procedures. In the index test domain, risk of bias was frequently categorized as unclear because model thresholds were not prespecified or insufficiently detailed, a common limitation in diagnostic AI research. The reference standard domain was generally rated as low risk of bias, as histopathological evaluation after surgical resection represents the accepted gold standard for pCR determination. In the flow and timing domain, some studies demonstrated unclear risk due to incomplete reporting of the interval between MRI and surgery.
Overall, while diagnostic performance was promising, methodological heterogeneity and incomplete adherence to radiomics quality standards highlight the need for standardized imaging protocols, prospective validation, and transparent reporting in future investigations. A comprehensive summary of the RQS item analysis and QUADAS-2 assessment is provided in Figures 2 and 3. The median RQS score was 11 (range: 4-18), corresponding to 30.6% (range: 11.1%-50.0%) of the maximum achievable score.
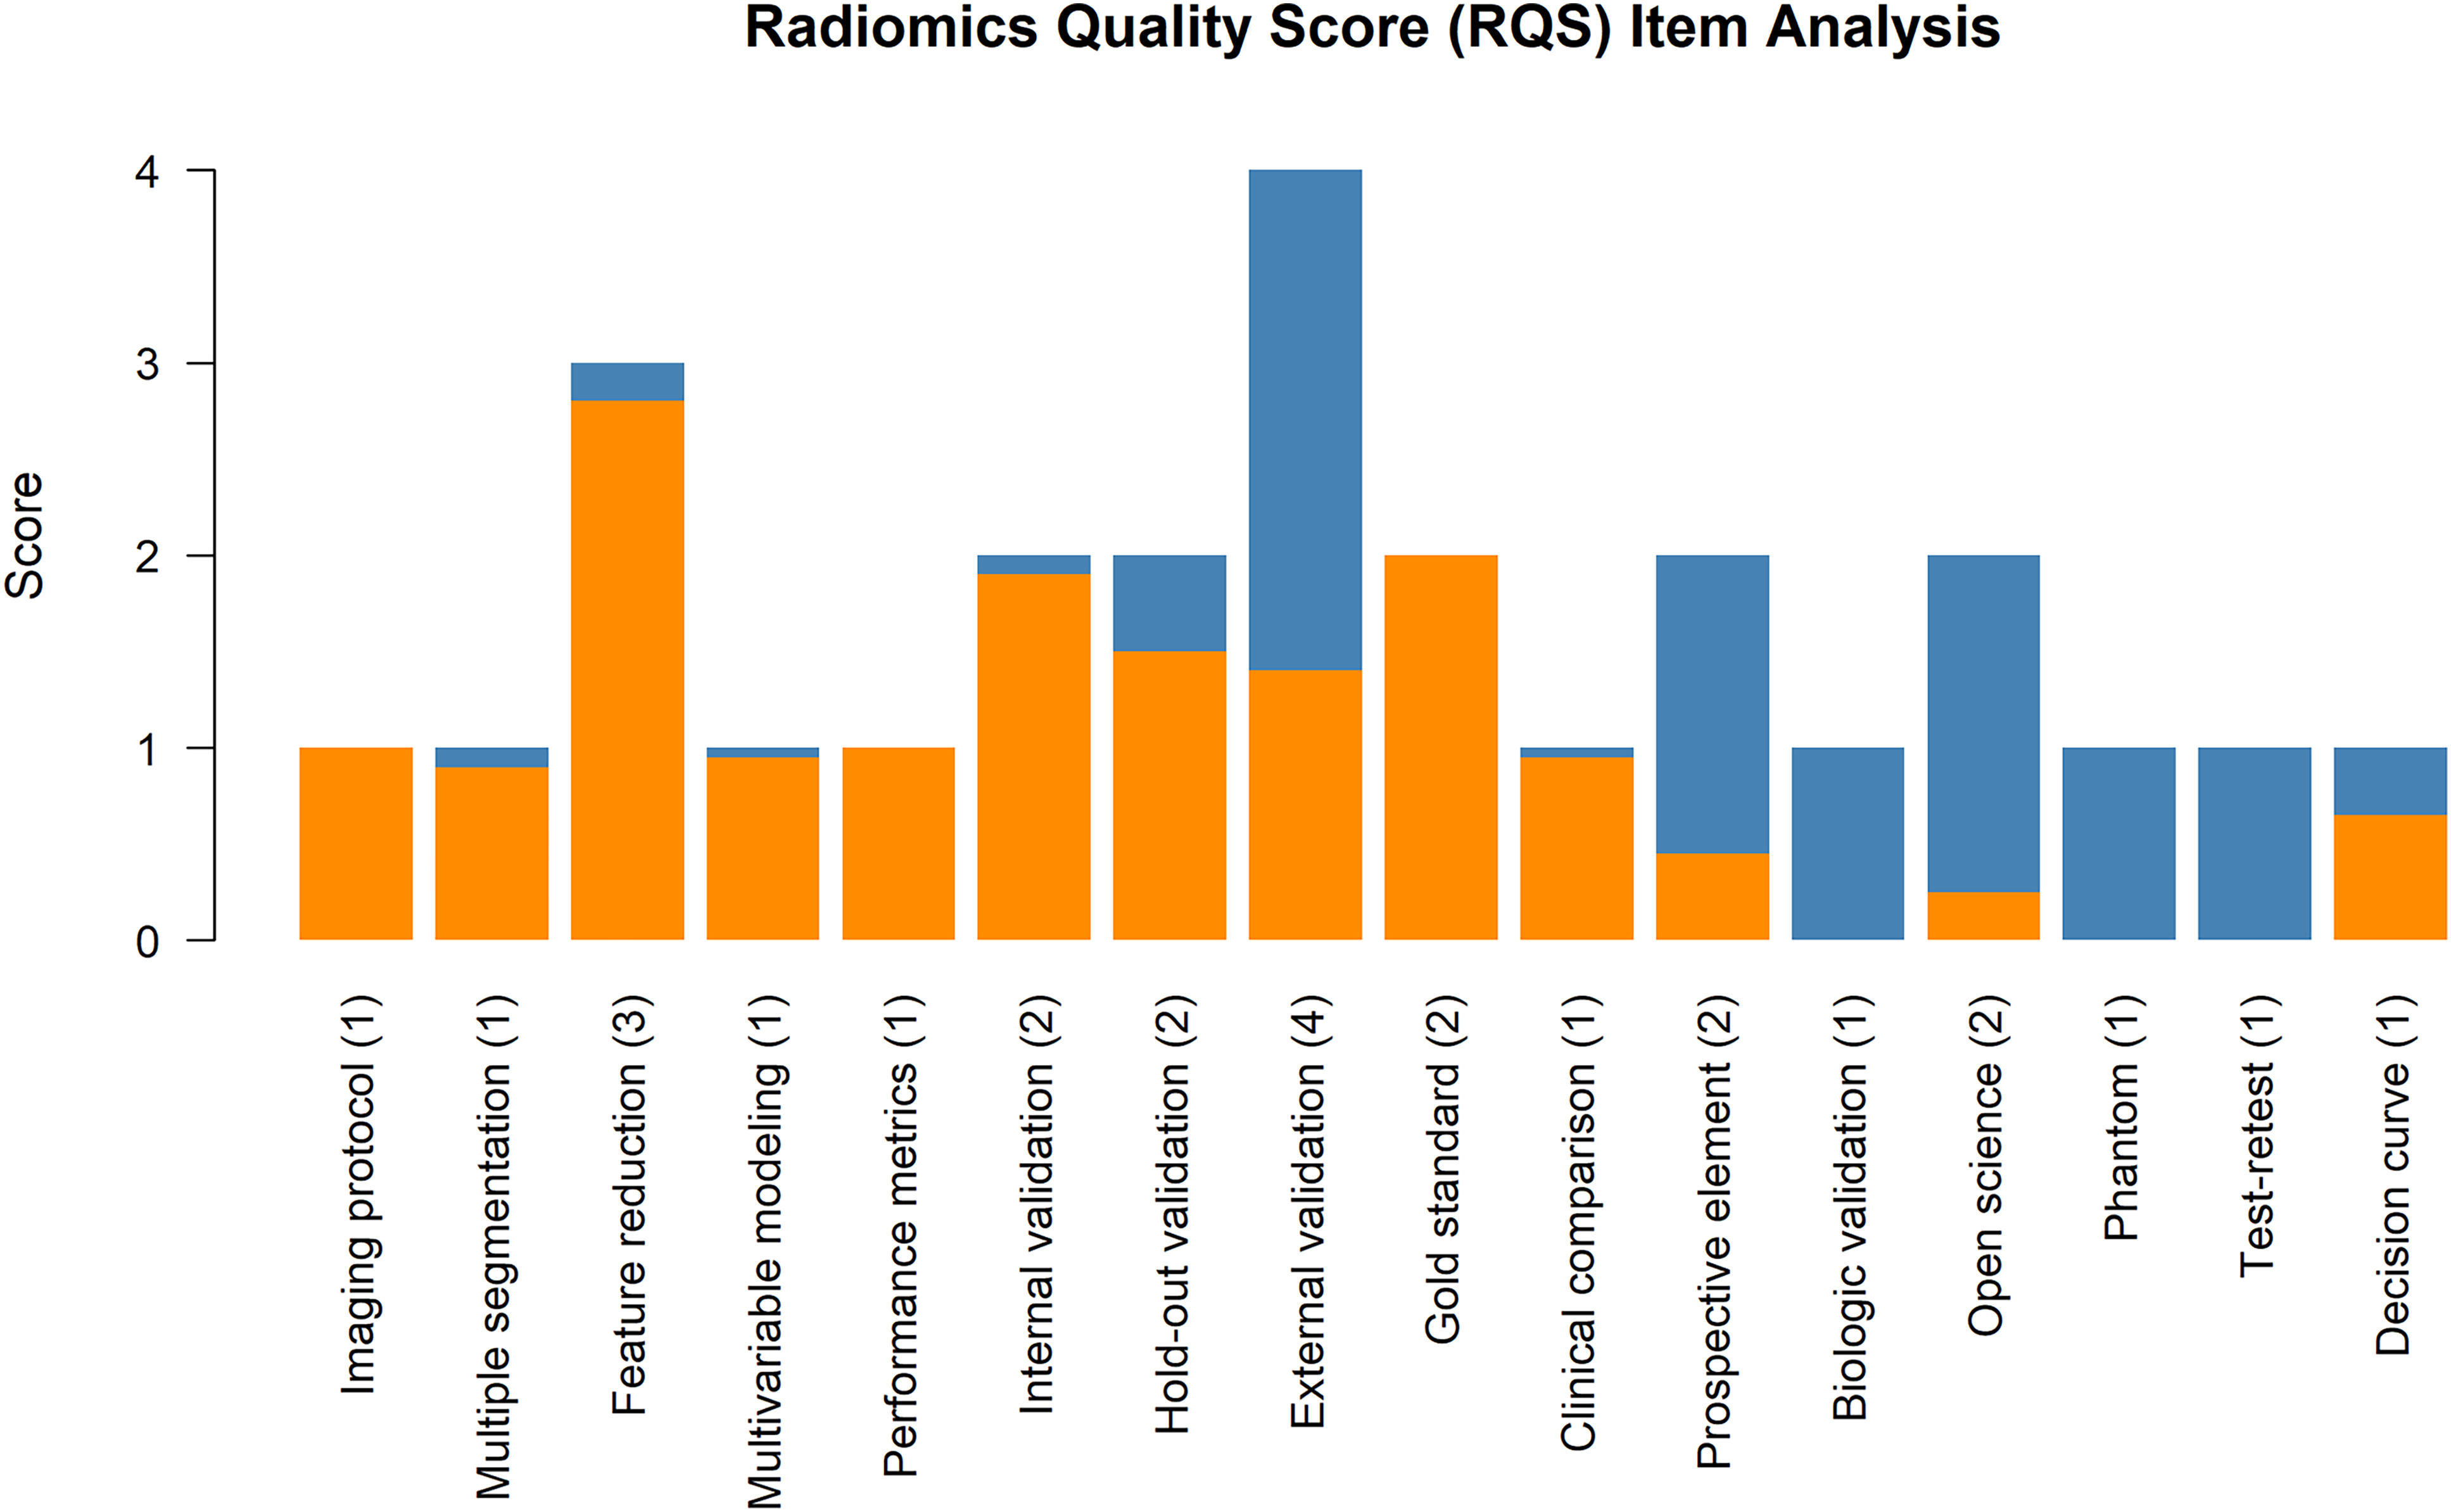
Radiomics Quality Score (RQS) item analysis. Bar chart showing the distribution of achieved scores across individual RQS items. Higher scores were most frequently observed for feature reduction and validation domains, whereas items related to prospective validation, biological correlates, phantom studies, test–retest analysis, and decision curve analysis were less commonly fulfilled.
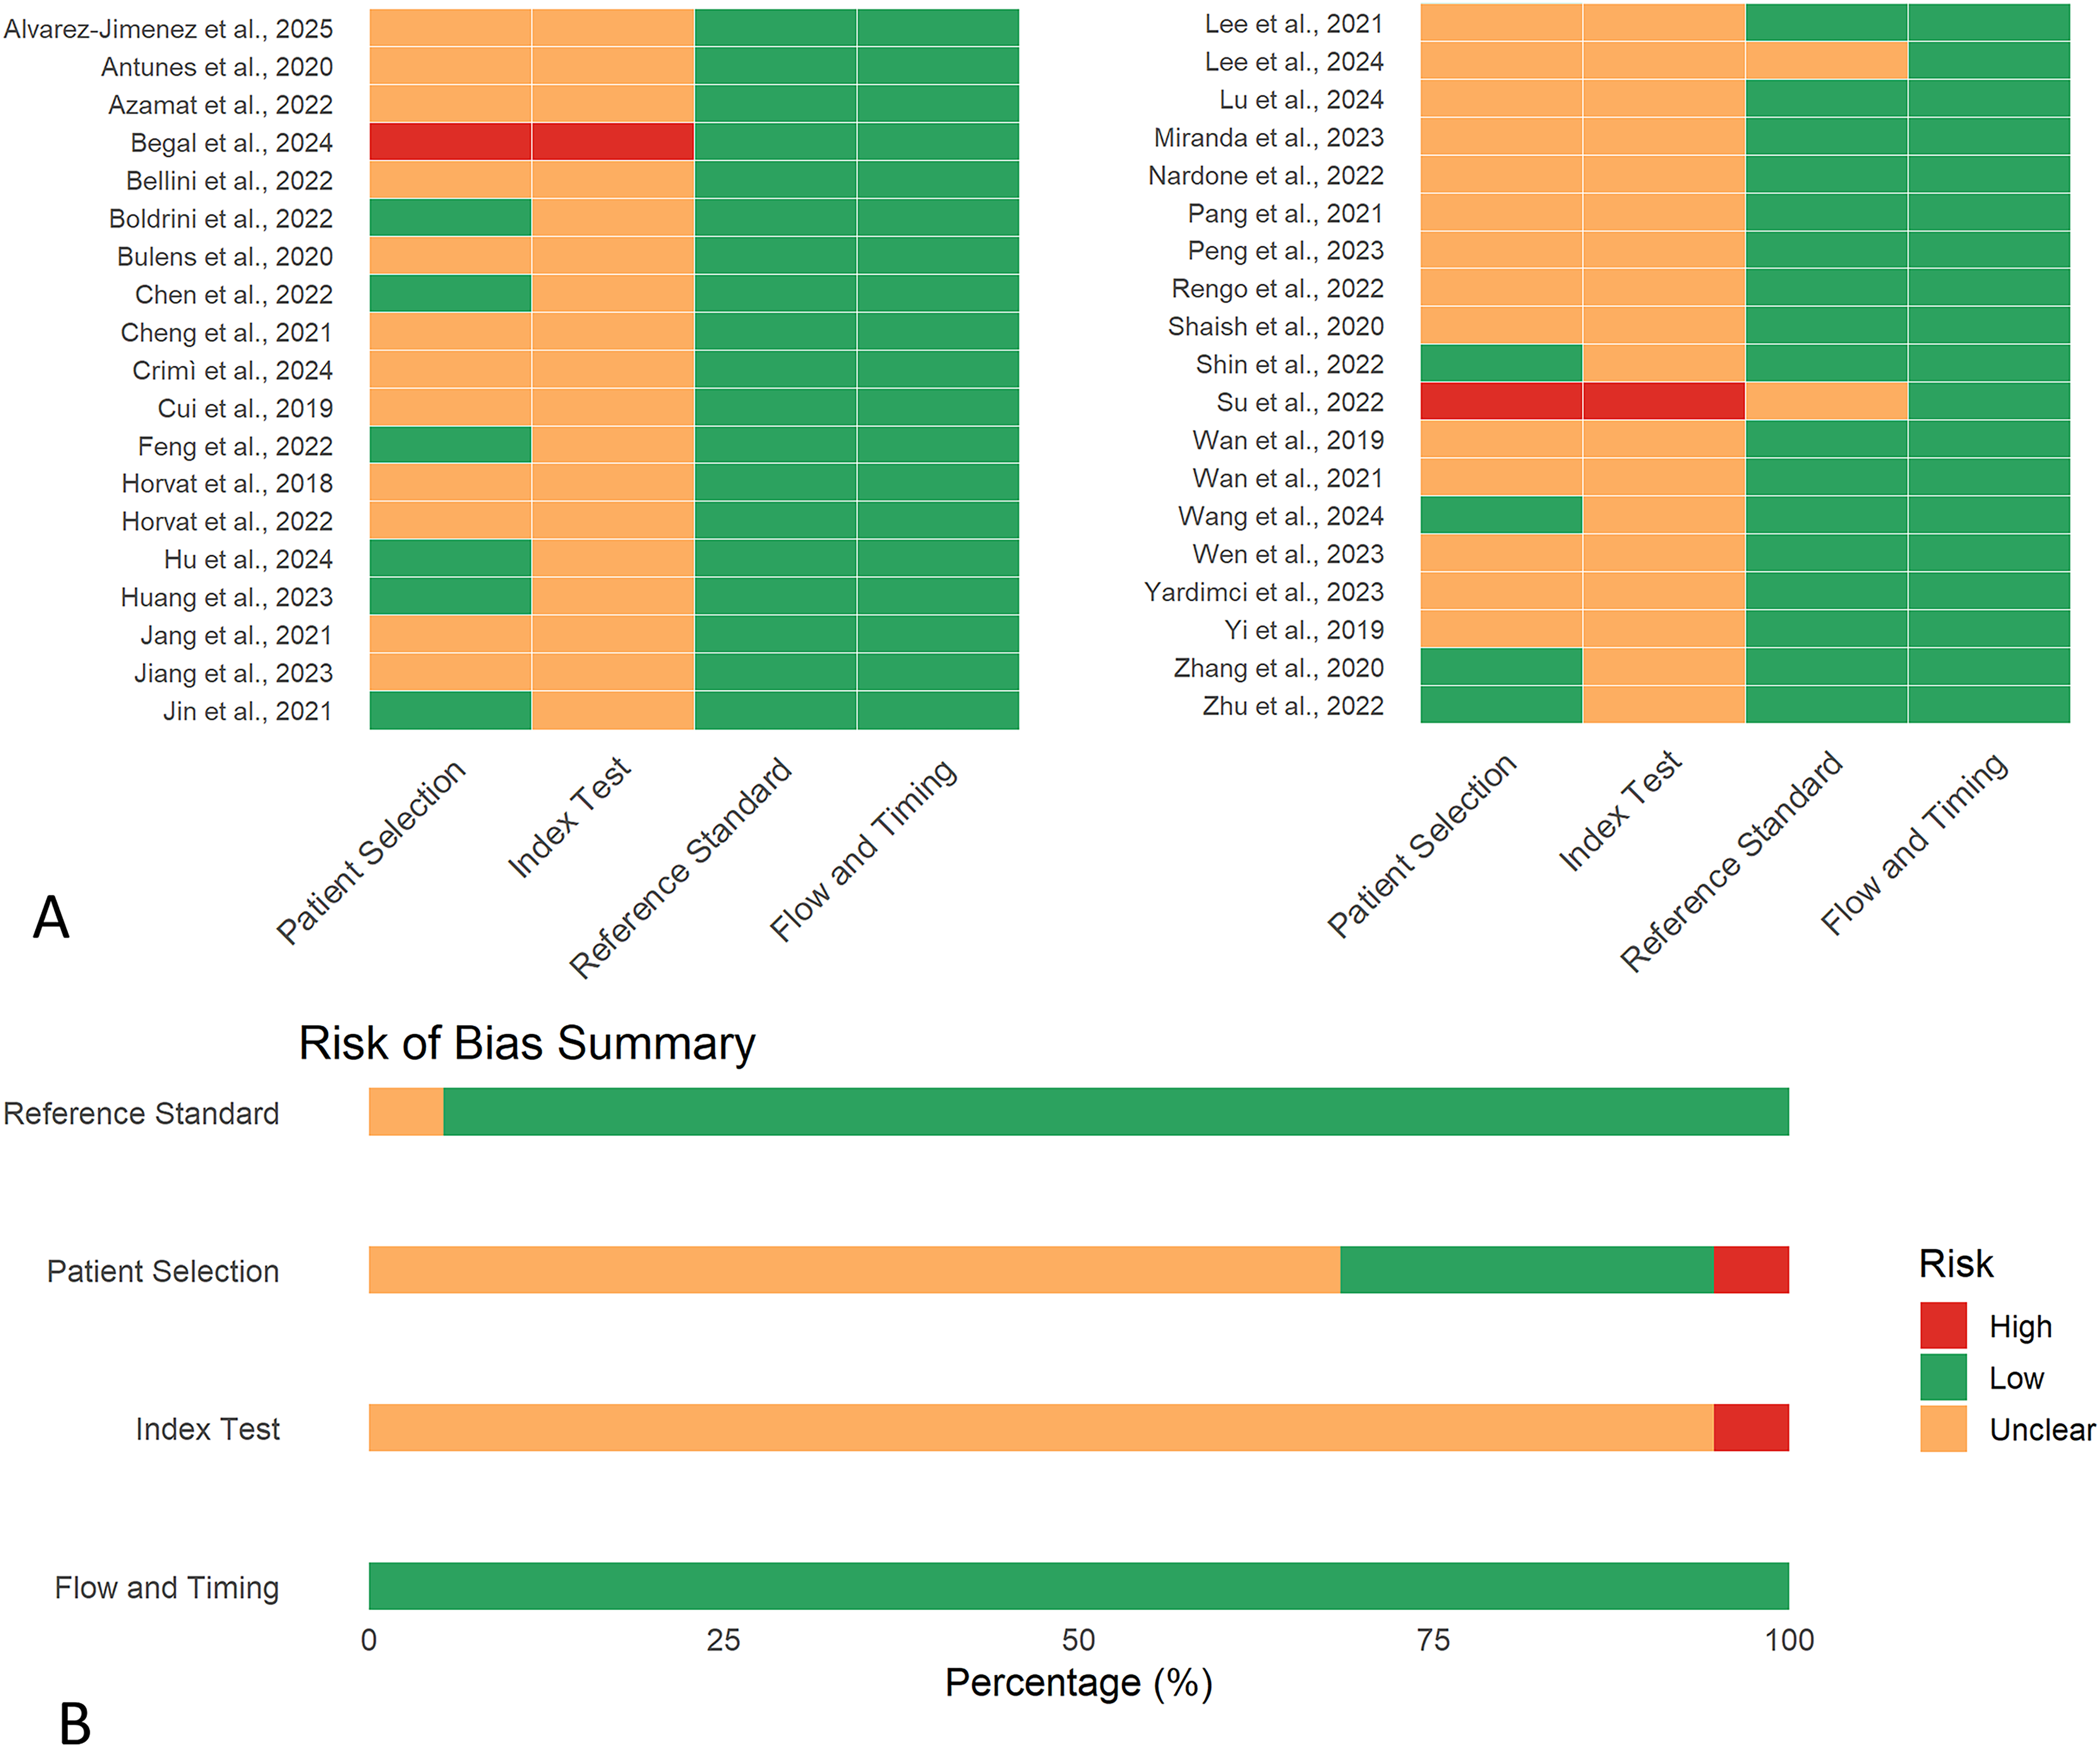
Quality Assessment of Diagnostic Accuracy Studies-2 (QUADAS-2) risk of bias assessment. (A) The traffic light plot shows the risk of bias judgement for each individual study across the four QUADAS-2 domains (Patient Selection, Index Test, Reference Standard, and Flow and Timing). (B) The summary plot presents the overall proportion of studies rated as low (green), unclear (yellow), or high (red) risk of bias within each domain.
Metaanalysis of Diagnostic Performance
A total of 38 studies were included in the quantitative synthesis. For studies reporting both training and validation results, only data from validation cohorts were incorporated into the metaanalysis to reduce overfitting bias and better reflect real-world model performance.
Using a bivariate random-effects model, the pooled sensitivity of MRI-based radiomics for predicting pathological complete response after neoadjuvant chemoradiotherapy was 0.82 (95% CI, 0.71-0.90), and the pooled specificity was 0.86 (95% CI, 0.80-0.91). The pooled PLR was 6.0 (95% CI, 4.0-8.9), and the pooled NLR was 0.21 (95% CI, 0.12-0.35). The corresponding pooled DOR was 29 (95% CI, 14-61), indicating strong discriminatory capacity. The HSROC analysis demonstrated an overall pooled AUC of 0.846, indicating good overall diagnostic performance (Figure 4).

Forest plots of pooled sensitivity and specificity. (A) Sensitivity. Pooled sensitivity estimated using a random-effects model (logit transformation, machine learning [ML]). Squares represent individual studies (size proportional to weight), lines show 95% CI, and the diamond indicates the pooled estimate with 95% CI. Heterogeneity is expressed as I2. (B) Specificity. Pooled specificity estimated using a random-effects model (logit transformation, ML). Squares represent individual studies (size proportional to weight), lines show 95% CI, and the diamond indicates the pooled estimate with 95% CI. Heterogeneity is expressed as I2.
However, substantial heterogeneity was observed across studies. The I2 statistic indicated significant variability in pooled sensitivity (I2 = 78.76%) and specificity (I2 = 90.92%). Forest plots of sensitivity and specificity are presented in Figure 4. The HSROC curve (Figure 5) demonstrates a clear separation between the 95% confidence region and the 95% prediction region, reflecting considerable between-study heterogeneity and indicating that diagnostic performance may vary across different clinical settings. These findings suggest that although MRI-based radiomics models show high overall accuracy, methodological and clinical heterogeneity among studies may influence their generalizability. The Spearman correlation coefficient between logit sensitivity and logit (1 − specificity) was 0.03 (P = .86), indicating no significant threshold effect.

HSROC curve (Reitsma bivariate random-effects model). The HSROC curve summarizes diagnostic accuracy across studies. Dots represent individual studies, the ellipse indicates the 95% confidence region, and the dashed line shows the prediction region. The overall discriminative performance is expressed by the area under the curve (AUC = 0.846).
Subgroup Analysis
To explore potential sources of between-study heterogeneity, predefined subgroup analyses were conducted according to six methodological and clinical factors: modeling approach (radiomics-based ML vs DL), sample size (<100 vs ≥100 patients), feature extraction software (PyRadiomics vs other platforms), segmentation strategy (2D vs 3D), validation approach (external vs internal validation), and model composition (radiomics-only models vs combined models incorporating clinical variables).
Across subgroups, MRI-based radiomics models consistently demonstrated moderate to high diagnostic performance in predicting pathological complete response. However, variations in pooled sensitivity, specificity, and AUC were observed depending on modeling strategy and validation design.
Models developed using DL architectures showed comparable or slightly improved diagnostic performance relative to conventional radiomics-based ML approaches, although heterogeneity remained substantial. Studies with larger sample sizes (≥100 patients) tended to demonstrate more stable pooled estimates, suggesting improved model robustness and reduced small-study effects.
Regarding feature extraction software, studies employing standardized platforms such as PyRadiomics demonstrated similar diagnostic performance compared with those using other software tools, indicating that performance differences were likely attributable to modeling strategy and validation rigor rather than software selection alone.
3D segmentation approaches generally yielded comparable or slightly improved discriminatory capacity compared with 2D analyses, potentially reflecting more comprehensive tumor heterogeneity characterization. External validation cohorts were associated with slightly lower but more conservative performance estimates compared with internal validation studies, underscoring the importance of independent validation for clinical translation.
Combined models integrating clinical variables with radiomic features demonstrated improved diagnostic performance relative to imaging-only models, supporting the added value of multimodal risk stratification. Detailed pooled estimates for each subgroup are summarized in Table 3.
Subgroup Analysis of Pooled Diagnostic Performance of Radiomics-Based Models According to Modeling Method, Sample Size, Software Platform, Segmentation Strategy, Validation Approach, and Model Type.
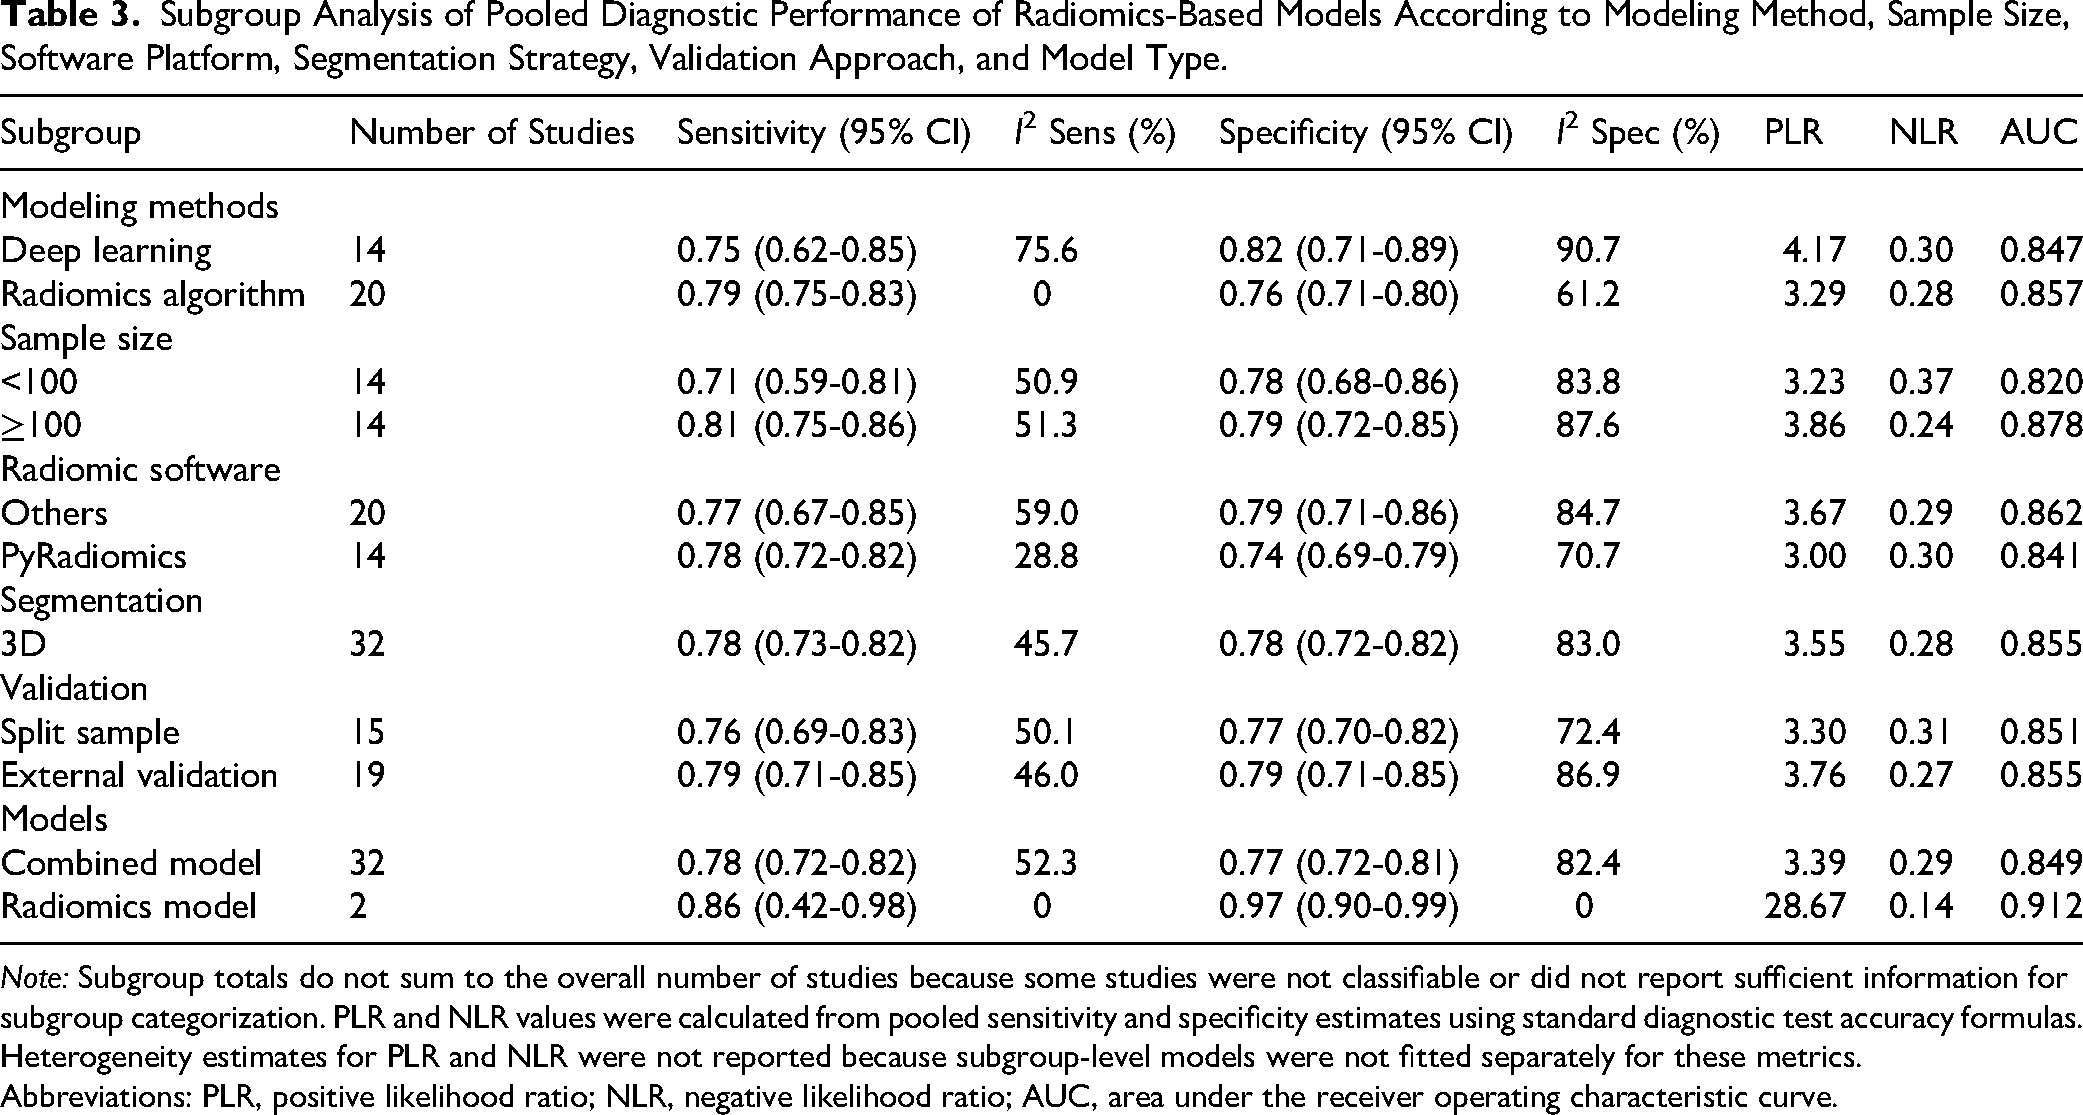
Note: Subgroup totals do not sum to the overall number of studies because some studies were not classifiable or did not report sufficient information for subgroup categorization. PLR and NLR values were calculated from pooled sensitivity and specificity estimates using standard diagnostic test accuracy formulas. Heterogeneity estimates for PLR and NLR were not reported because subgroup-level models were not fitted separately for these metrics.
Abbreviations: PLR, positive likelihood ratio; NLR, negative likelihood ratio; AUC, area under the receiver operating characteristic curve.
Publication Bias
Potential publication bias was assessed using Deeks’ funnel plot asymmetry test for diagnostic accuracy metaanalyses. Visual inspection of the funnel plot did not reveal marked asymmetry. Formal statistical testing using Deeks’ regression analysis demonstrated evidence of potential publication bias (P = .0009). The corresponding funnel plot is presented in Figure 6. These findings suggest the presence of potential publication bias and small-study effects, which may have led to overestimation of pooled diagnostic performance.
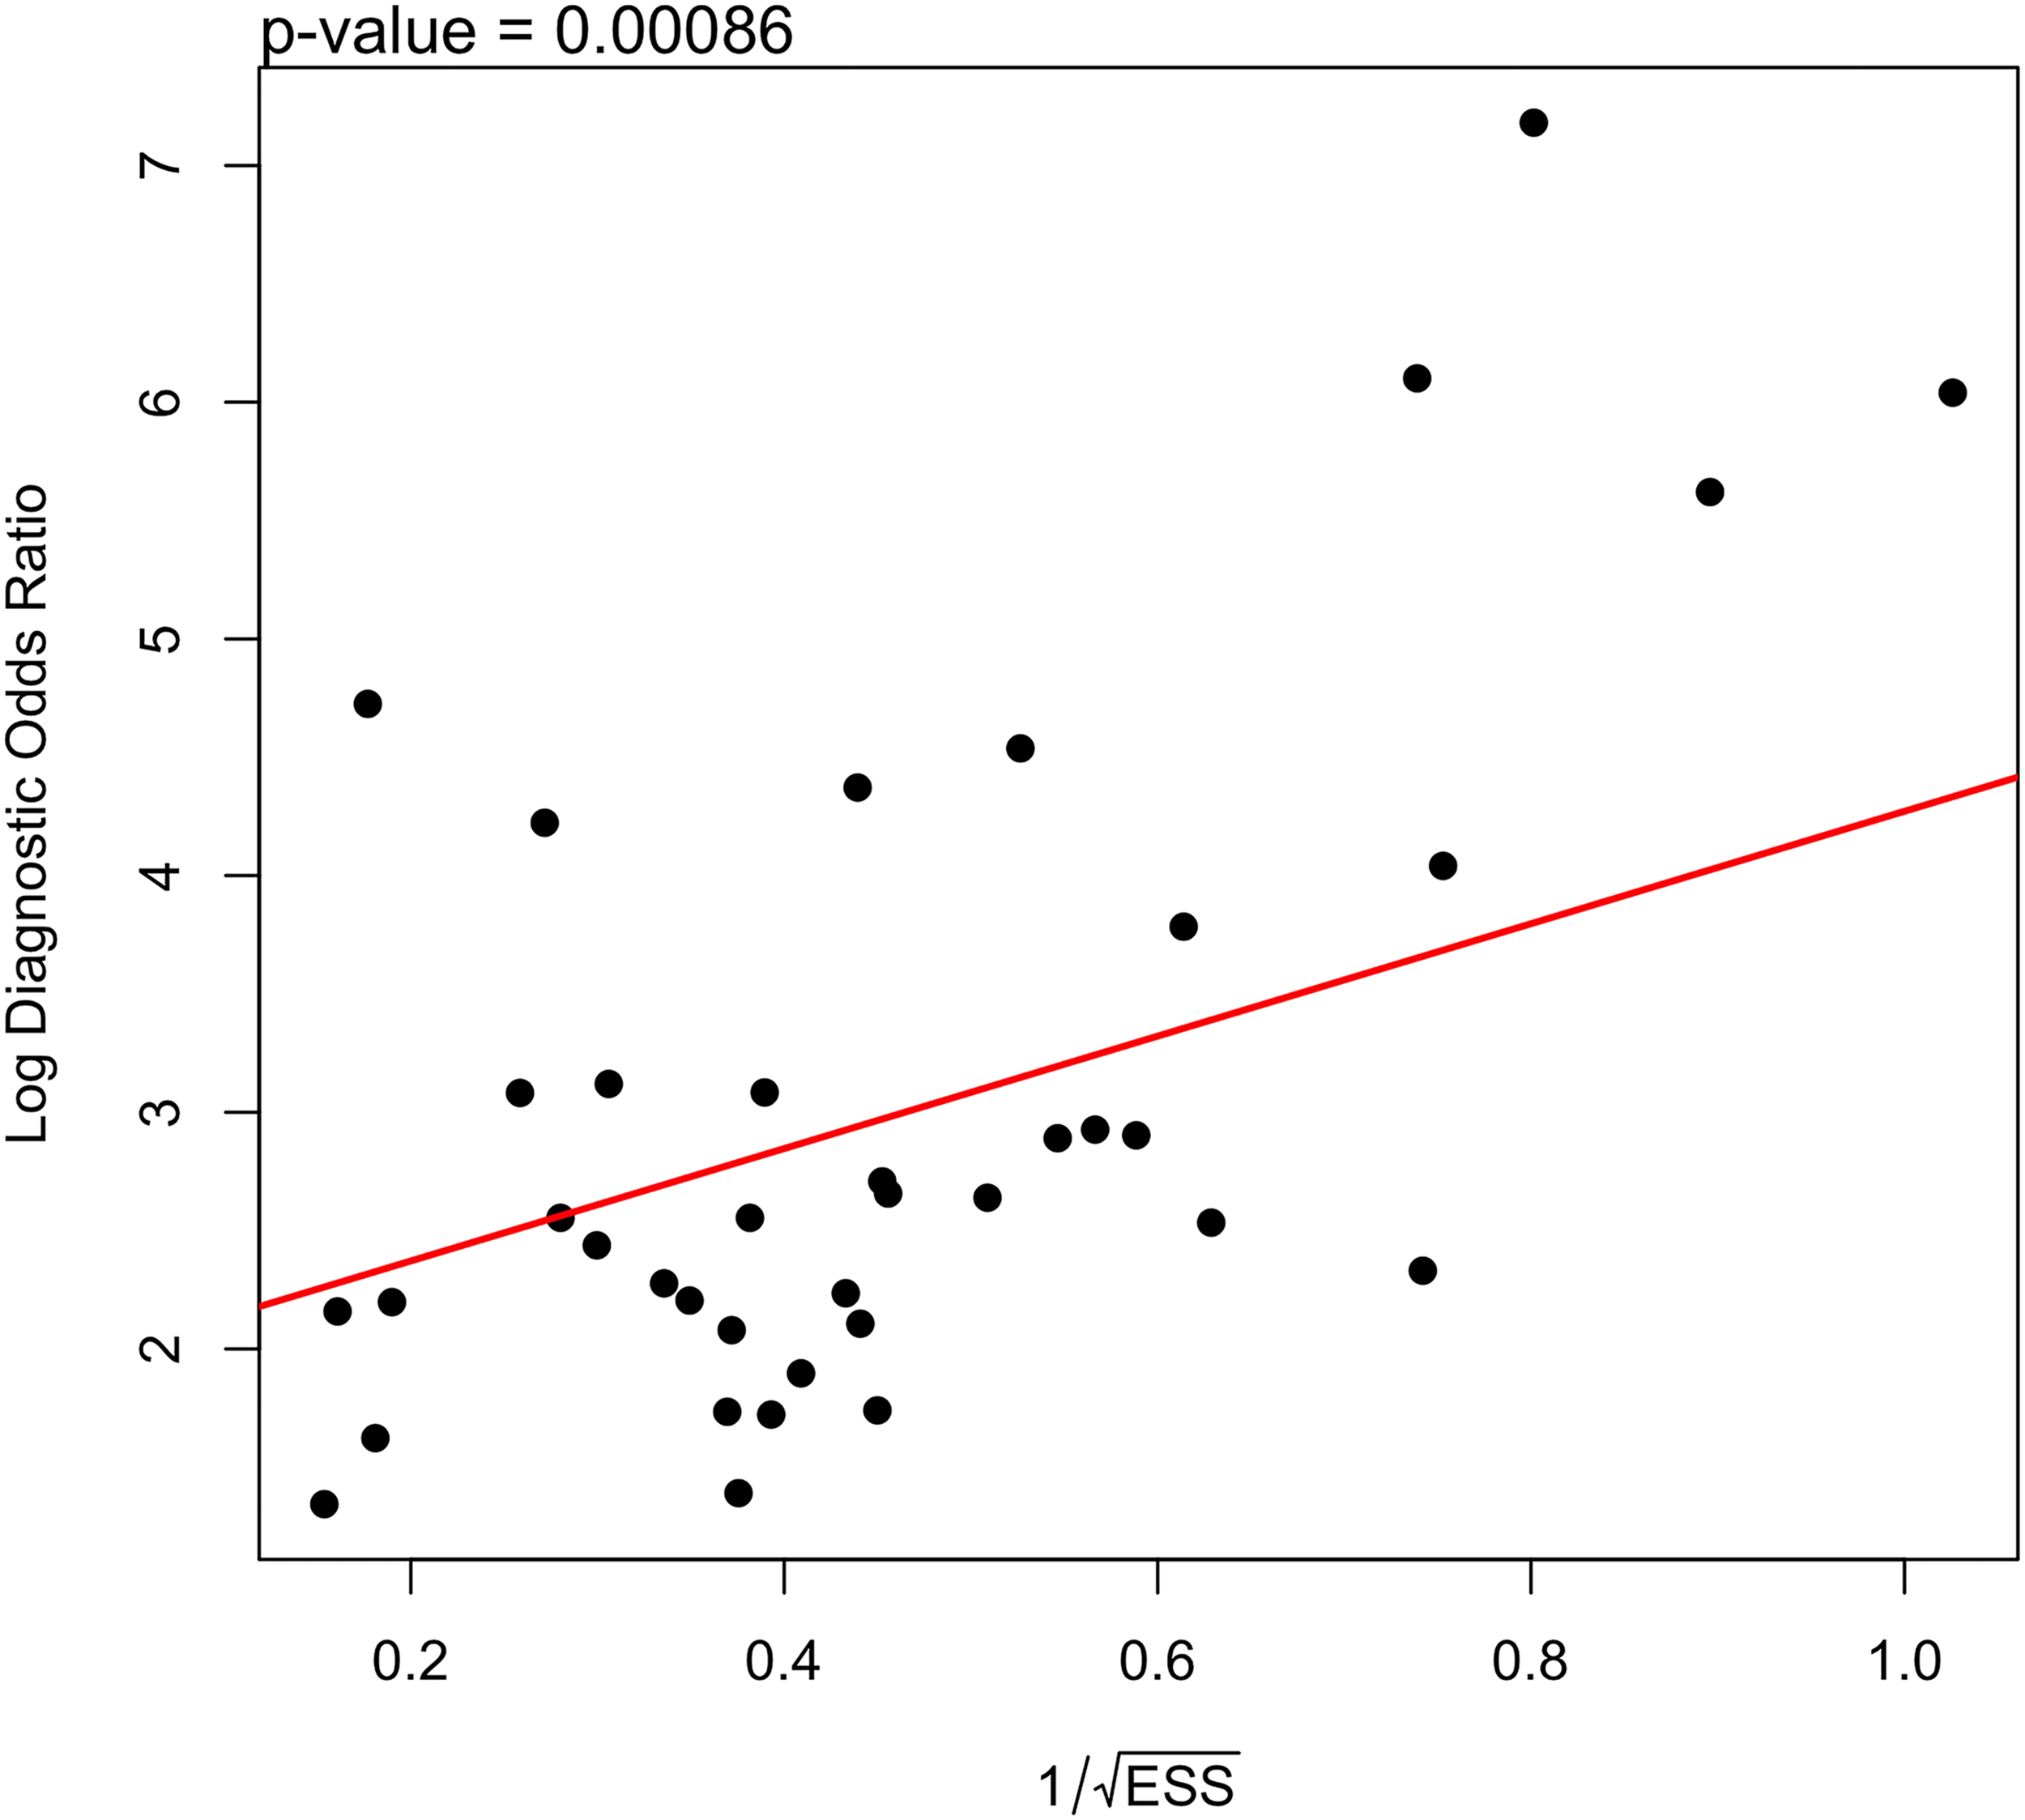
Deeks’ funnel plot for publication bias. The funnel plot shows log diagnostic odds ratio (logDOR) against 1/√(ESS). The red regression line represents Deeks’ test for asymmetry. A significant slope (P = .0009) suggests potential publication bias.
Discussion
This systematic review and metaanalysis evaluated the diagnostic performance of MRI-based radiomics models for predicting pathological complete response (pCR) after neoadjuvant chemoradiotherapy in patients with locally advanced rectal adenocarcinoma. Based on 38 included studies and analysis of validation cohorts only, the pooled sensitivity was 0.82, and the pooled specificity was 0.86, with an overall AUC of 0.846. These findings indicate excellent discriminatory capacity and suggest that radiomics-based models may provide clinically meaningful noninvasive biomarkers for treatment response assessment. 61
Accurate preoperative identification of pCR is of major clinical importance. Patients achieving pCR after neoadjuvant chemoradiotherapy demonstrate favorable long-term outcomes and may be candidates for organ-preserving strategies, including nonoperative “watch-and-wait” management. Avoidance of total mesorectal excision may substantially reduce morbidity related to bowel, urinary, and sexual dysfunction, as well as permanent stoma formation. Therefore, reliable imaging-based prediction tools could facilitate personalized therapeutic decision-making and optimize risk–benefit assessment. 62
Radiomic features capture intratumoral heterogeneity, which has been associated with treatment resistance and adverse oncologic outcomes. 63 Tumors failing to achieve pCR frequently demonstrate increased imaging heterogeneity, potentially reflecting residual viable tumor and microenvironmental complexity. 64 Similar associations between imaging heterogeneity and poor therapeutic response have been reported across solid tumors, supporting the biological plausibility of radiomics-based response prediction. 65
Our subgroup analyses suggested that DL models showed numerically comparable or slightly higher performance; however, no formal statistical comparison was conducted, and therefore these findings should be interpreted cautiously. DL architectures enable automated hierarchical feature learning directly from raw imaging data and can capture complex nonlinear relationships beyond handcrafted descriptors. 66 However, the number of DL studies remains limited, and many lack external validation. 67 Larger multicenter investigations are required to confirm these findings. The interpretation of subgroup analyses has been revised to reflect that observed differences between modeling approaches are descriptive and should be interpreted cautiously in the absence of formal statistical comparison.
Models integrating radiomic features with clinical variables demonstrated improved diagnostic performance compared with imaging-only models. 68 This observation aligns with the principle that tumor response is influenced by multiple biological and clinical factors. Multivariable predictive models combining imaging and nonimaging data may therefore provide superior risk stratification.
Despite encouraging diagnostic accuracy, methodological limitations were evident. Scanner variability and protocol heterogeneity may affect feature reproducibility, particularly in multicenter settings. 69 External validation remains inconsistently implemented in radiomics research. 70 Risk of bias assessment using QUADAS-2 identified concerns primarily in the index test domain. In many studies, model thresholds were not prespecified, increasing the potential for optimistic performance estimates. 71 These findings underscore the importance of adherence to standardized reporting guidelines such as STARD. 72 Although a formal quantitative sensitivity analysis stratified by risk of bias was not performed due to limited reporting consistency, studies judged as having lower risk of bias—particularly those with external validation and clearer threshold specification—tended to report more conservative performance estimates. This suggests that inclusion of studies with unclear or high risk of bias may have contributed to overestimation of pooled diagnostic accuracy. The presence of significant publication bias indicates that studies with favorable results may be overrepresented, potentially inflating pooled estimates of sensitivity and specificity.
Substantial heterogeneity was observed in pooled sensitivity and specificity. Heterogeneity is common in diagnostic test accuracy metaanalyses and may arise from differences in imaging protocols, segmentation strategies, feature selection procedures, and validation design. 73 Although subgroup analyses identified potential contributors, residual heterogeneity remained, highlighting the need for workflow standardization before clinical implementation. In addition to statistical heterogeneity, several methodological and clinical factors likely contributed to variability in diagnostic performance. Differences in MRI acquisition protocols, including field strength, sequence selection, and timing of posttreatment imaging, may influence radiomic feature stability and reproducibility. Furthermore, segmentation strategies (manual vs semi-automatic; 2D vs 3D) introduce variability in feature extraction, potentially affecting model performance. Variations in pCR definitions, although generally based on ypT0N0, may also contribute to inconsistencies across studies. These factors collectively limit comparability and highlight the need for standardized radiomics pipelines.
Emerging approaches such as delta radiomics, which quantify temporal changes in imaging features during treatment, may further enhance response prediction. 74 By capturing dynamic tumor alterations, delta models may provide additional biological insight beyond single-time-point imaging.
This study has several limitations. First, substantial heterogeneity persisted despite subgroup exploration. Second, although only validation cohorts were included to reduce overfitting bias, external validation remains limited. Third, only pCR was evaluated as the outcome of interest. In conclusion, MRI-based radiomics demonstrates high diagnostic performance for predicting pathological complete response after neoadjuvant chemoradiotherapy in rectal adenocarcinoma. However, methodological heterogeneity and limited prospective validation currently constrain clinical translation. Future standardized, multicenter, prospectively validated studies are essential to establish radiomics as a reliable decision-support tool in personalized rectal cancer management. The exclusion of non-English studies may have introduced language bias, potentially limiting the generalizability of the findings.
Future studies should incorporate standardized imaging protocols, multicenter external validation cohorts with adequate sample sizes (preferably >200 patients), adherence to Image Biomarker Standardization Initiative (IBSI) guidelines, transparent model reporting, and prospective study designs to ensure clinical applicability.
Conclusions
This systematic review and metaanalysis demonstrates that MRI-based radiomics provides promising diagnostic accuracy but is not yet ready for routine clinical implementation. The pooled results indicate that radiomics has substantial potential as a noninvasive imaging biomarker to support individualized treatment strategies. Subgroup analyses suggest that DL-based models may achieve superior predictive performance compared with conventional radiomics-based ML approaches, and that integration of clinical variables further enhances diagnostic accuracy. These findings highlight the value of multimodal and data-driven predictive frameworks in rectal cancer management. However, methodological heterogeneity, limited prospective validation, and incomplete adherence to radiomics quality standards currently restrict routine clinical implementation.
Supplemental Material
sj-doc-1-mix-10.1177_15353508261462778 - Supplemental material for Radiomic Analysis of MRI for Assessing Response to Neoadjuvant Chemoradiotherapy in Rectal Adenocarcinoma: A Systematic Review and Metaanalysis
Supplemental material, sj-doc-1-mix-10.1177_15353508261462778 for Radiomic Analysis of MRI for Assessing Response to Neoadjuvant Chemoradiotherapy in Rectal Adenocarcinoma: A Systematic Review and Metaanalysis by Murat Jakipov, MD, MSc, PhD, Amin Tamadon, PhD, Zhandos Burkitbayev, MD, PhD, Bayram Kochiev, MD, Aslan Karimov, MD, Aigerim Temirbayeva, MD, Yerbolat Iztleuov, MD, PhD, Prashant Jamwal, PhD, Keivan Daneshvar, MD, Nadiar M. Mussin, MD, PhD and Ramazon Safarzoda Sharoffidin, PhD in SAGE Publications
Footnotes
Acknowledgments
Not applicable.
Institutional Review Board Statement
Not applicable.
Informed Consent
Not applicable.
Author Contributions
MJ, AT, and RSS: conceptualization; MJ, AT, PJ, and KD: methodology; PJ, KD, and RSS: formal analysis; MJ, ZB, BK, AK, and AT: investigation; MJ, ZB, BK, AK, AT, YI: data curation; AT and YI: validation; AT and MJ: writing–original draft; PJ, ZB, BK, AK, KD, YI, NMM, and RSS: writing–review and editing; YI and AT: supervision; AT: project administration.
Funding
The authors received no financial support for the research, authorship, and/or publication of this article.
Declaration of Conflicting Interests
The authors declared no potential conflicts of interest with respect to the research, authorship, and/or publication of this article.
Data Availability Statement
The datasets generated and analyzed during the current study are derived from publicly available studies included in this systematic review and metaanalysis. All relevant data supporting the findings of this study are included within the article and its Supplemental materials. Additional extracted data used for the metaanalysis are available from the corresponding author upon reasonable request.
Supplemental Material
Supplemental material for this article is available online.
References
Supplementary Material
Please find the following supplemental material available below.
For Open Access articles published under a Creative Commons License, all supplemental material carries the same license as the article it is associated with.
For non-Open Access articles published, all supplemental material carries a non-exclusive license, and permission requests for re-use of supplemental material or any part of supplemental material shall be sent directly to the copyright owner as specified in the copyright notice associated with the article.