
Abstract
Potent STING agonists are among the most promising strategies for reversing immunosuppression in “cold” tumors, but in vivo antitumor efficacy is frequently limited by dose-limiting systemic toxicity and inadequate tumor selectivity. To achieve localized STING activation and robust systemic immunity, we combined STING agonism with photodynamic therapy (PDT), creating a carrier-free nanoplatform (Ce6&SR717 NPs) through self-assembly of SR717 (STING agonist) and Ce6 (chlorin e6, photosensitizer). This excipient-free design achieves maximum drug loading, alleviates carrier-related safety issues, and realizes the spatiotemporally synchronized activation of PDT-induced immunogenic cell death and STING signaling through irradiation, which establishes an auto-amplifying cycle of on-site antigen release and systemic immune priming. In the murine breast cancer model, Ce6&SR717 NPs plus laser irradiation dramatically increased CD8+ T-cell infiltration within the tumor, triggered strong systemic antitumor immunity, and suppressed both primary and distant tumors. Collectively, these results identify Ce6&SR717 NPs as a safe and efficient modality for synergistic photo-immunotherapy of immunologically cold tumors.
Introduction
The advent of cancer immunotherapy has shifted the therapeutic paradigm towards harnessing the host immune system for tumor-specific eradication.1‐4 A core challenge in tumor immunotherapy lies in overcoming the immunosuppressive tumor microenvironment (TME), characterized by dendritic cell (DC) maturation dysfunction and defective antigen presentation.5,6 This suppression hinders T-cell infiltration and activation, contributing to the “cold” tumor phenotype observed in clinical settings. 7 Diverse strategies aim to reverse this immunosuppression.8,9
Pharmacological modulation of the stimulator of interferon genes (STING) pathway, a pivotal innate immune signaling axis, has garnered significant interest due to its potent capacity to activate DCs and bridge innate and adaptive immunity.10‐14 STING agonism causes TBK1-IRF3 signaling which mainly induces IFN-β and upregulates pro-inflammatory cytokines (TNF-α, IL-6).15,16 This signaling pathway then reactivates DC cross-priming function and delivers essential signals to activate T cells.1,17 Accordingly, the design and application of cGAS–STING small-molecule agonists have advanced substantially, spanning non-nucleotide chemotypes such as amidobenzimidazoles (diABZI series), 18 dimeric activators (MSA-2), 19 the benzothiophene-based SR717, 20 and legacy murine-selective agents (DMXAA),21,22 collectively showing potent STING-TBK1-IRF3 engagement, robust type I interferon induction, and reproducible in vivo antitumor activity. However, systemic administration of STING agonists frequently provokes broad immune stimulation and surges of pro-inflammatory cytokines, resulting in collateral toxicities and a constrained therapeutic index.23‐25 Therefore, achieving potent, tumor-localized activation of cGAS-STING while eliciting a robust abscopal effect is pivotal for advancing the practical and clinical translation of STING agonists.
To meet the imperative of tumor-localized cGAS-STING activation with a robust abscopal response, photodynamic therapy (PDT) offers precise spatial control: photosensitizers such as chlorin e6 (Ce6) generate cytotoxic reactive oxygen species under laser irradiation and induce immunogenic cell death (ICD),26‐29 releasing damage-associated molecular patterns and tumor antigens that seed adaptive immunity.30,31 Yet PDT alone rarely reverses systemic immunosuppression, and the intrinsic hydrophobicity, aggregation tendency, and suboptimal tumor selectivity of most conventional photosensitizers further attenuate their immunogenic potential. Mechanistically, PDT-driven antigen release and STING-mediated dendritic-cell licensing act through orthogonal but synergistic pathways,32,33 enabling an “antigen-release/immune-priming” cascade that converts immune-excluded (“cold”) tumors into T cell-inflamed (“hot”) lesions.28,34‐36 Realizing this synergy requires spatiotemporally coordinated delivery of both components. 37 However, conventional carrier-dependent platforms (e.g., liposomes, PLGA particles, metal-organic frameworks) often suffer from low drug loading, manufacturing complexity, batch variability, and excipient-related immunotoxicity—limitations that constrain clinical translation. 38 These gaps motivate a minimalist, carrier-free strategy that co-assembles a photosensitizer with a potent small-molecule STING agonist to maximize loading, eliminate extraneous excipients, and synchronize intratumoral activation.
Thus, this work develops a carrier-free Ce6&SR717 nanomedicine that integrates PDT with cGAS-STING agonism, achieving tumor-restricted activation and abscopal photoimmunotherapy in breast cancer. The design in this work leverages π-π stacking and hydrophobic interactions between the novel STING agonist SR717 and photosensitizer Ce6, enabling single-step fabrication of uniform nanoparticles (248.7 ± 8.2 nm, PDI = .25) with ultrahigh dual-drug loading (as illustrated in Scheme 1). Compared to traditional nanocarriers, this system exhibits transformative advantages: (1) Elimination of exogenous carriers reduces biocompatibility risks and enhances clinical translation feasibility; (2) Spatiotemporally controlled drug release kinetics allow Ce6 to generate reactive oxygen species (ROS) under 660 nm laser irradiation, inducing tumor cell killing and ICD, while synchronously released SR717 activates the STING pathway to promote DC maturation and macrophage polarization. This establishes a self-reinforcing “in situ antigen release-systemic immune activation” feedback loop. In breast cancer-bearing murine models, Ce6&SR717 NPs combined with laser irradiation increased tumor-infiltrating CD8+ T-cell proportions and elicited a systemic antitumor immune response that suppressed distal metastatic growth. This study provides direct evidence for the synergistic mechanism between STING agonists and PDT and pioneers an efficient, carrier-free co-delivery strategy, thereby offering a technological prototype for effective and safe immuno-photodynamic therapies.
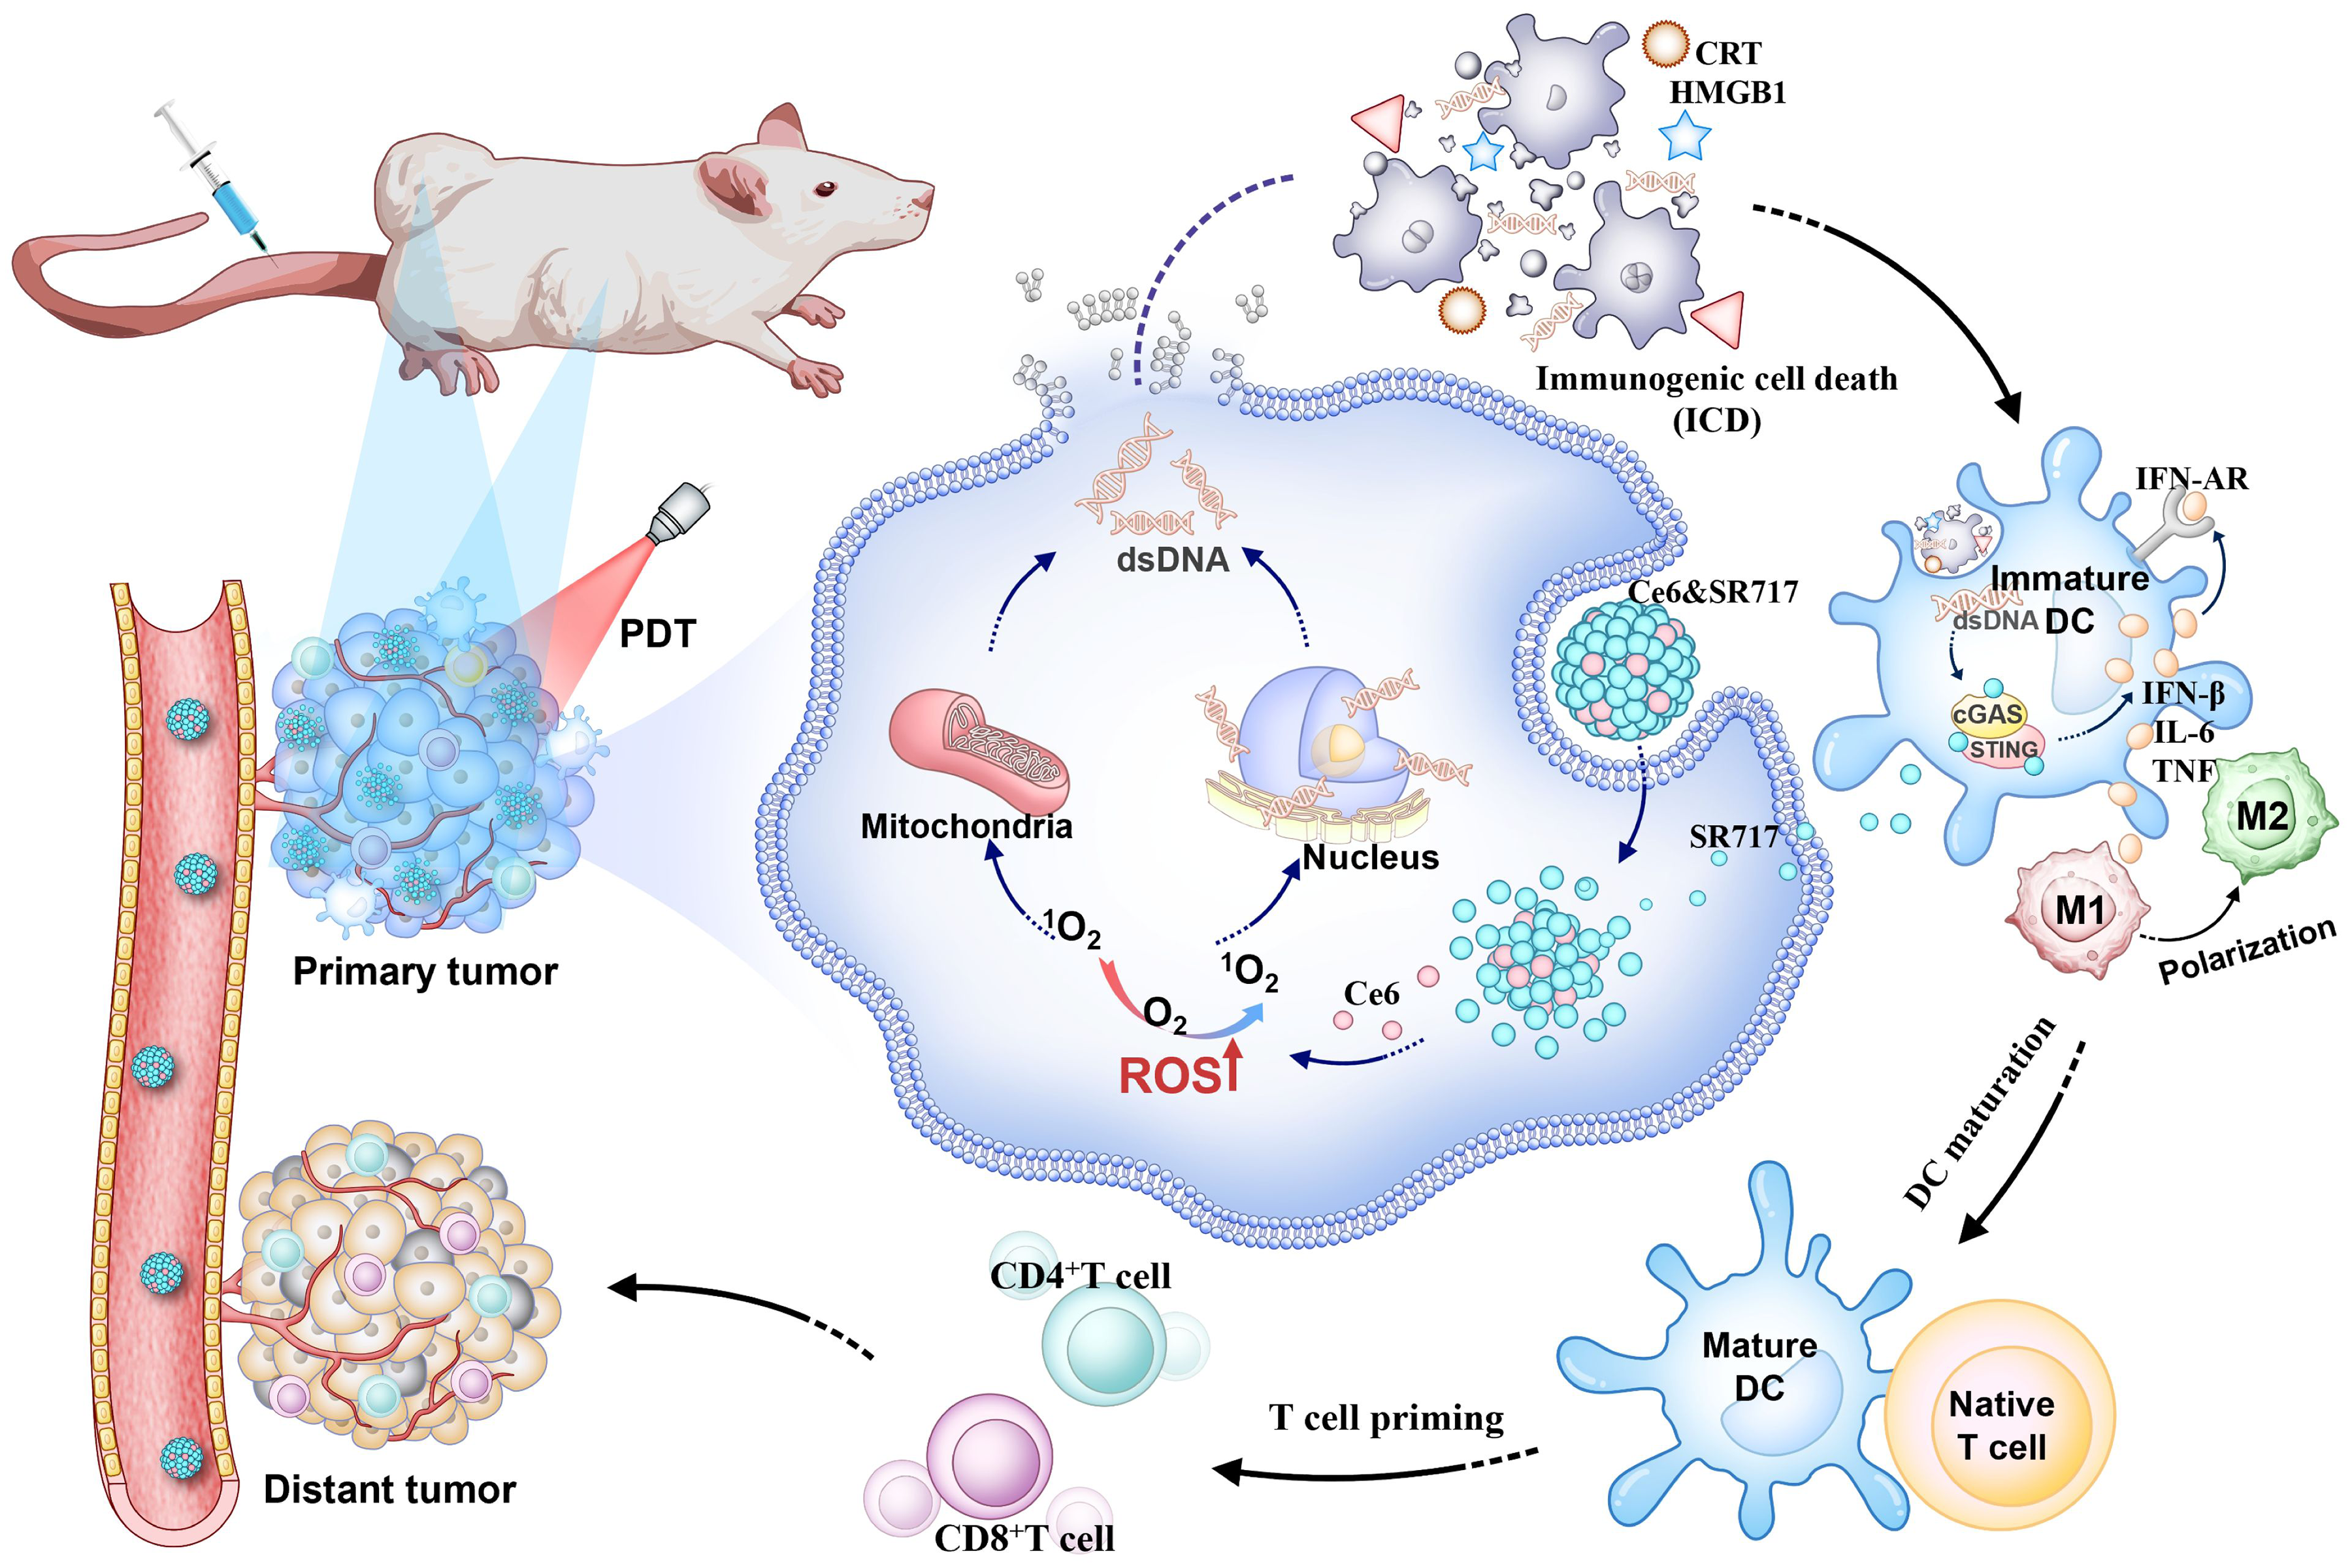
Schematic illustration of antitumor synergistic immunotherapy mediated by Ce6&SR717 NPs with laser irradiation via increasing tumor immunogenicity and reversing immunosuppressive tumor microenvironment. (A) The self-assembly of Ce6 and SR717. (B) Ce6&SR717-mediated PDT induces immunogenic cell death (ICD) in tumor cells. Simultaneously released SR717 activates the STING pathway to promote DC maturation and macrophage polarization, establishing a self-reinforcing cascade of in situ antigen release and systemic immune activation, thereby inhibiting both primary and distal tumors.
Materials and Methods
Materials
Chlorin e6 (Ce6) was obtained from Macklin Biochemical Technology Co., Ltd (Shanghai, China). Bovine serum albumin (BSA) and small molecule agonist SR-717 were purchased from Shanghai Aladdin Biochemical Technology Co., Ltd (Shanghai, China). Cell Counting Kit-8 was obtained from TargetMol (USA). The Calcein-AM/PI Cell Viability/Cytotoxicity Assay Kit and Annexin V-FITC/PI apoptosis detection kit were purchased from Jiangsu KeyGEN BioTECH Co., Ltd (Nanjing, China). 2′,7′-dichlorofluorescein diacetate (DCFH-DA) was acquired from MedChemExpress (Monmouth Junction, NJ, USA). Mouse IL-6 and TNF-α ELISA kits were purchased from Thermo Fisher Scientific (USA). Phosphorylation-specific antibodies including Phospho-STING, Phospho-NF-κB p65, Phospho-IRF3, and Phospho-TBK1 were procured from Cell Signaling Technology (Danvers, MA, USA), with corresponding total protein antibodies IRF3 and TBK1 from the same vendor. GAPDH antibody was sourced from Abclonal (Wuhan, China). Flow cytometry antibodies from BD Biosciences (San Jose, CA, USA) included: FITC-CD86, PE-CD206, APC-CD80, APC-CD4, PE-CD8, BBV515-CD3, BV421-F4/80, APC-CD11b, FITC-CD45, APC-A700-CD11b, and PE-Cy7-CD11c, along with Fixable Viability Stain 780 and Purified Rat Anti-Mouse CD16/CD32 blocking antibody.
Preparation of Ce6&SR717
Stock solutions of SR717 and Ce6 (10 g/L each) were prepared by dissolving them in dimethyl sulfoxide (DMSO). Subsequently, 140 μL of SR717 solution was thoroughly mixed with 59.6 μL of Ce6 solution under continuous ultrasonication (40 kHz, 100 W). The resulting mixture was then gradually introduced into 2 mL of deionized water through dropwise addition accompanied by simultaneous ultrasonication (40 kHz, 100 W). The blended solution underwent dialysis purification (3500 Da) for 4 h under light-protected conditions at room temperature to obtain Ce6&SR717 nanoparticles (NPs)
Characterizations
The morphological characteristics of the nanoparticles were analyzed using transmission electron microscopy (TEM) performed on a Hitachi HT7700 instrument (Tokyo, Japan) operating at an accelerating voltage of 100 kV. The colloids stability is assessed by the hydrodynamic size and surface charge (zeta-potential) by means of a ZetaPals instrument from Brookhaven instruments, Holtsville, NY. The optical absorption properties of the Ce6&SR717 nanoparticles were measured using a UV-Visible Spectroscopy with a PerkinElmer Lambda 365 spectrophotometer (Billerica, MA, USA) as a tool for UV-vis spectra. Content of Ce6 was determined through UV-visible spectroscopy. Content of SR717 was measured with HPLC on Shimadzu LC-20A.
Cellular Uptake Assay
4T1 cells were plated in confocal dishes and incubated for 12 h at 37 °C in 5% CO2. The cells were then incubated with free Ce6 or Ce6&SR717 NPs (with a constant Ce6 concentration of 1 mg/L) for 1, 3, and 6 h. The cells were washed three times with PBS after incubation to remove the extracellular ones. Uptake efficiency detected by FCM; intracellular distribution detected by laser scanning confocal microscope (CLSM).
Cell viability assay
The 4T1 cells were planted in 96-well plates and cultivated for 12 h. The cells were divided into 4 groups: (1) Ce6, (2) Ce6&SR717 NPs, (3) Ce6 + Laser, (4) Ce6&SR717 + Laser. All groups were treated with the same Ce6 gradient concentration (.1, .125, 0.25, 1 mg/L). Groups 5 and 6 were treated with a 660 nm laser (0.1 W/cm2, 1 min) following 12 h incubation. All groups were then incubated for another 12 h, and cell viability was assessed using the CCK-8 assay according to the manufacturer's instructions.
Cell Apoptosis Assay
Cell apoptosis was evaluated by Annexin V-FITC/PI staining. 4T1 cells were seeded in 6-well plates and cultured for 12 h. The cells were divided into 6 groups: (1) PBS, (2) Ce6, (3) SR717, (4) Ce6&SR717 NPs, (5) Ce6 + Laser, and (6) Ce6&SR717 NPs + Laser. The Ce6 concentration was fixed at 1 mg/L for all relevant groups. After 12 h of incubation, groups 5 and 6 were exposed to a 660 nm laser (0.1 W/cm2, 1 min). All groups were then cultured for another 12 h. Cells were collected, washed with PBS and stained with Annexin V-FITC and PI according to the manufacturer's instructions. Apoptotic cells were counted by flow cytometry, and FlowJo was used to analyze the data.
Live/Dead Cell Staining
4T1 cells were treated in the same 6 conditions as in the apoptosis assay. After treatment, the cells were incubated with calcein-AM (2 µg/mL) and PI (1 µg/mL) at 37 °C in the dark for 20 min to label the live (green) and dead (red) cells. Washing with PBS to remove the excess dye, CLSM was used to take fluorescence images.
In Vitro ROS Detection
ROS generation was assessed with DCFH-DA in 4T1 cells grouped into the same six treatments. Relevant groups had Ce6 fixed at 1 mg/L. After 12 h of incubation, groups 5 and 6 received 660 nm laser irradiation (0.1 W/cm2, 1 min), followed by 30 min of dark incubation with 10 μM DCFH-DA in serum-free medium.ROS levels were quantified via flow cytometry and visualized using CLSM, with fluorescence intensity analyzed in FlowJo and ImageJ.
In Vitro Detection of ICD Markers
Immunogenic cell death (ICD) markers were assessed in 4T1 cells seeded in 12-well plates. After 12 h of culture, cells were divided into the same six experimental groups as previously described. Following 12 h of drug incubation, groups 5 and 6 were irradiated with a 660 nm laser (0.1 W/cm2, 1 min), and all groups were then incubated for another 2 h. Cells were fixed with 4% PFA for 10 min, permeabilized with 0.125% Triton X-100 for 10 min, and blocked with 5% BSA for 1 h at room temperature. Subsequently, cells were incubated overnight at 4 °C with primary antibodies against CRT, HMGB1, and γ-H2AX. After washing with PBS, cells were stained with an FITC-conjugated secondary antibody for 1 h at 25 °C in the dark. Nuclei were counterstained with DAPI (1 μg/mL) for 10 min. Images were acquired by CLSM, and fluorescence intensity was quantified using ImageJ software.
Assessment of STING Pathway Activation
4T1 cells (1 × 10⁵/well) were cocultured separately with bone marrow-derived dendritic cells (BMDCs) or RAW264.7 macrophages (5 × 10⁴/well) in 0.4 μm Transwell plates. The cells were treated under the same six conditions. The Ce6 concentration was maintained at 1 mg/L for all relevant groups. After 12 h, groups 5 and 6 were irradiated with a 660 nm laser (0.1 W/cm2, 1 min), followed by 6 h of continued coculture. Cells in the lower chamber were lysed for Western blot analysis of phosphorylated and total proteins in the STING pathway (p-STING, p-TBK1, TBK1, p-IRF3, IRF3) and p-P65. GAPDH served as the loading control. All antibodies were obtained from Cell Signaling Technology (CST).
Immune Cell Phenotyping and Cytokine Analysis
For flow cytometric analysis, BMDCs and RAW264.7 cells were harvested and stained. BMDCs were assessed for maturation markers (CD80-APC, CD86-FITC, MHC II-PE). RAW264.7 macrophages were analyzed for M1/M2 polarization markers (CD86-FITC, CD206-PE). The concentrations of IL-6, TNF-α, and IFN-β in the culture supernatants were measured by ELISA. Data were analyzed using FlowJo for cytometry, and absorbance at 450 nm was read for ELISA. Protein band intensities from Western blots were quantified with ImageLab software.
Biodistribution and Tumor Accumulation
All animal experiments in this study were approved by Nanjing Drum Tower Hospital's Ethics Committee and conducted under the guidelines of its Animal Care Committee. Female BALB/c mice (SPF-grade, 6 weeks old) were subcutaneously inoculated in the right forelimb with 2 × 10⁶ 4T1 tumor cells. Tumor volume was monitored daily using a caliper and calculated as (length × width2)/2. When tumors reached approximately 200 mm3, mice (n = 3 per group) were intravenously injected with either Ce6&SR717 NPs or free Ce6 (100 μL, 4.8 mg kg−1 Ce6 equivalent). In vivo fluorescence imaging was performed at 2, 4, 6, and 24 h post-injection under isoflurane anesthesia using an IVIS Lumina XR imaging system (excitation: 660 nm, emission: 690 nm). At 24 h, mice were euthanized via cervical dislocation after isoflurane anesthesia, and major organs (heart, liver, spleen, lungs, kidneys) and tumors were harvested for ex vivo fluorescence imaging under the same parameters.
Primary Tumor Therapeutic Intervention
Female BALB/c mice (SPF-grade) were subcutaneously injected with 1 × 10⁶ 4T1 cells in the right inguinal region. When tumors reached ≈100 mm3 (volume = 0.5 × length × width2), mice were randomized into six groups (n = 5/group): G1 (PBS control), G2 (Ce6 alone), G3 (SR717 monotherapy), G4 (Ce6&SR717 NPs), G5 (Ce6 + Laser), and G6 (Ce6&SR717 NPs + Laser). Ce6 and SR717 were intravenously administered at equivalent doses (SR717: 10 mg/kg) on days 0, 3, and 6. Laser irradiation (660 nm, 0.5 W/cm2, 5 min) was applied locally to + Laser groups 2 h post-injection. Tumor volumes were monitored every 2 days until sacrifice on day 14 for tumor weight measurement, flow cytometry (immune cell profiling), and H&E staining of major organs.
Abscopal Tumor Response Evaluation
Mice received 1 × 10⁶ 4T1 cells in the right inguinal region (day 0) and left side (day 5). When bilateral tumors reached ≈100 mm3, mice were grouped and treated identically to the primary model. Both tumor volumes and body weight were recorded every 2 days. Excised tumors were analyzed for morphology and immune infiltration.
In Vivo Immune Profiling and Toxicity
Tumor and spleen tissues were digested for flow cytometry (T cells, macrophages, DCs, and activation markers). Heart, liver, spleen, lung, and kidney sections underwent H&E staining to assess systemic toxicity. CLSM fluorescence intensity was semi-quantified using ImageJ (≥3 samples/group, triplicate experiments).
Sample Preparation for Comparative Proteomics
The collected mouse tumor tissues were washed by PBS, homogenized using 8 M urea in SDC buffer (1% SDC in 0.1 M TEAB), sonicated for 30 s to further extract proteins. The protein concentration was measured by Pierce BCA Protein Assay Kit. Proteins were reduced by 8 mM DTT at 56 °C for 30 min, followed by alkylation with 16 mM IAA at room temperature for 30 min in dark. Next, the alkylated proteins were diluted by 100 mM ABC buffer to 1.6 M urea and digested by trypsin at 37 °C (1/50, w/w) for 20 h. Peptides were desalted using C18 tips.
Mass Spectrometric Analysis
The desalted peptides were redissolved into 0.1% formic acid (FA) in 2% acetonitrile (ACN) and injected into a nano-liquid chromatography (nanoLC) system at a flow rate of 0.3 μL/min, which was coupled to an Orbitrap Fusion Lumos mass spectrometer. Solvent A was 0.1% (v/v) FA, and solvent B was 0.1% (v/v) FA in 80% ACN. Peptides were separated using a home-made C18 nano-capillary analytical column. Solvent B started with 2%, increased to 25% at 100 min, to 35% at 120 min, and finally to 95% at 125 min. Using data-independent acquisition (DIA) mode, MS1 parameters were set as follows: Orbitrap resolution at 60,000 FWHM, m/z scan range in 350‒1,500, maximum injection time at 50 ms, and AGC target at 4 × 10⁵. MS2 parameters were set as follows: isolation window of 7.5, Orbitrap resolution at 30,000 FWHM, higher-energy collisional dissociation (HCD) at 30%, m/z scan range in 200‒1,600, maximum injection time at 50 ms, AGC target at 4 × 10⁵.
Proteomics Data Analysis
The proteomics data were analyzed by DIA-NN 39 with precursor FDR at 1% using the reviewed Mus musculus proteome database and the universal contaminant database. The quantitative proteomics was performed by Perseus software. 40 Gene ontology (GO) enrichment analyses were performed by clusterProfiler. 41
Statistical Analysis
Data are expressed as mean ± SD. Comparisons used independent t-tests (two groups) or one-way ANOVA with Tukey's test (multi-group) in GraphPad Prism 9. Significance levels: *p < .05, **p < .01, ***p < .001, ****p < .0001. Ethical endpoints (tumor volume >2000mm3 or >20% weight loss) were strictly followed.
Results and Discussion
Preparation and Characterizations of Ce6&SR717
The sensitizer Ce6 molecule exhibits potential for interacting with hydrophobic bioactive compounds through its hydrophobic conjugated porphyrin skeleton. The STING agonist SR717, featuring a benzothiophene-derived aromatic core, serves as a representative hydrophobic partner capable of drug-drug interactions. Leveraging the π-π stacking between the planar porphyrin structure of Ce6 and the aromatic benzothiophene moiety of SR-717, along with hydrogen bonding involving the carboxyl groups of Ce6 and the sulfonamide/hydroxyl functionalities of SR-717, a carrier-free nanomedicine (denoted as Ce6&SR717 NPs) was fabricated via self-assembly using the nanoprecipitation method (Figure 1A). This process relies on the intrinsic molecular compatibility of the two components in the aqueous phase, bypassing the need for exogenous stabilizers. To achieve optimal nanoparticle formulation, systematic variation of the molar feeding ratios between SR-717 and Ce6 was necessitated to rationally tailor their self-assembly dynamics (Figure S1‒2 in the supplementary materials). TEM analysis revealed that SR717 and Ce6 at a stoichiometric ratio of 4:1 spontaneously assembled into monodisperse spherical nanoparticles with an average diameter of approximately 230 nm, while DLS measurements provided hydrodynamic dimensions of 248.7 ± 8.2 nm and a PDI of 0.25 ± 0.01, underscoring the efficacy of this formulation in achieving nanoscale homogeneity (Figure 1B). The stability of Ce6&SR717 NPs was assessed by monitoring their hydrodynamic size and polydispersity index (PDI) in various media. As shown in Figure 1C‒E, the NPs maintained consistent size and PDI over seven days in both water and phosphate-buffered saline (PBS). Notably, the presence of 10% fetal bovine serum (FBS) elicited a marginal augmentation in the diameter of Ce6&SR717 NPs, potentially attributable to protein corona formation on the nanoparticle surface. In addition, the zeta potential of Ce6&SR717 was measured to be stable at −39.37 ± 2.6 mV over a seven-day period, and the negative surface charge may facilitate prolonged circulation within the bloodstream. The self-assembly mechanism was investigated by characterizing the UV−vis absorbance spectra of Ce6&SR717 under different conditions. When compared to the absorption spectrum of unbound Ce6, the Ce6&SR717 complex exhibited a moderate red shift, a phenomenon attributable to hydrophobic interactions and π−π stacking between the SR717 and Ce6 molecules. (Figure 1G). Furthermore, the SDS treatment of Ce6&SR717 manifested in blue spectral shifts, evidencing π−π stacking and hydrophobic forces and implying surfactant-induced electronic structural changes within the complex (Figure 1H). The drug loading content of Ce6 in Ce6&SR717 was determined to be 86.9% via a standard calibration curve established by UV-Vis spectroscopic analysis (Figure S3 in the supplementary materials). In addition, based on HPLC-derived calibration data, the drug loading capacity of SR717 in Ce6&SR717 was quantified as 73.9% (Figure S4 in the supplementary materials).
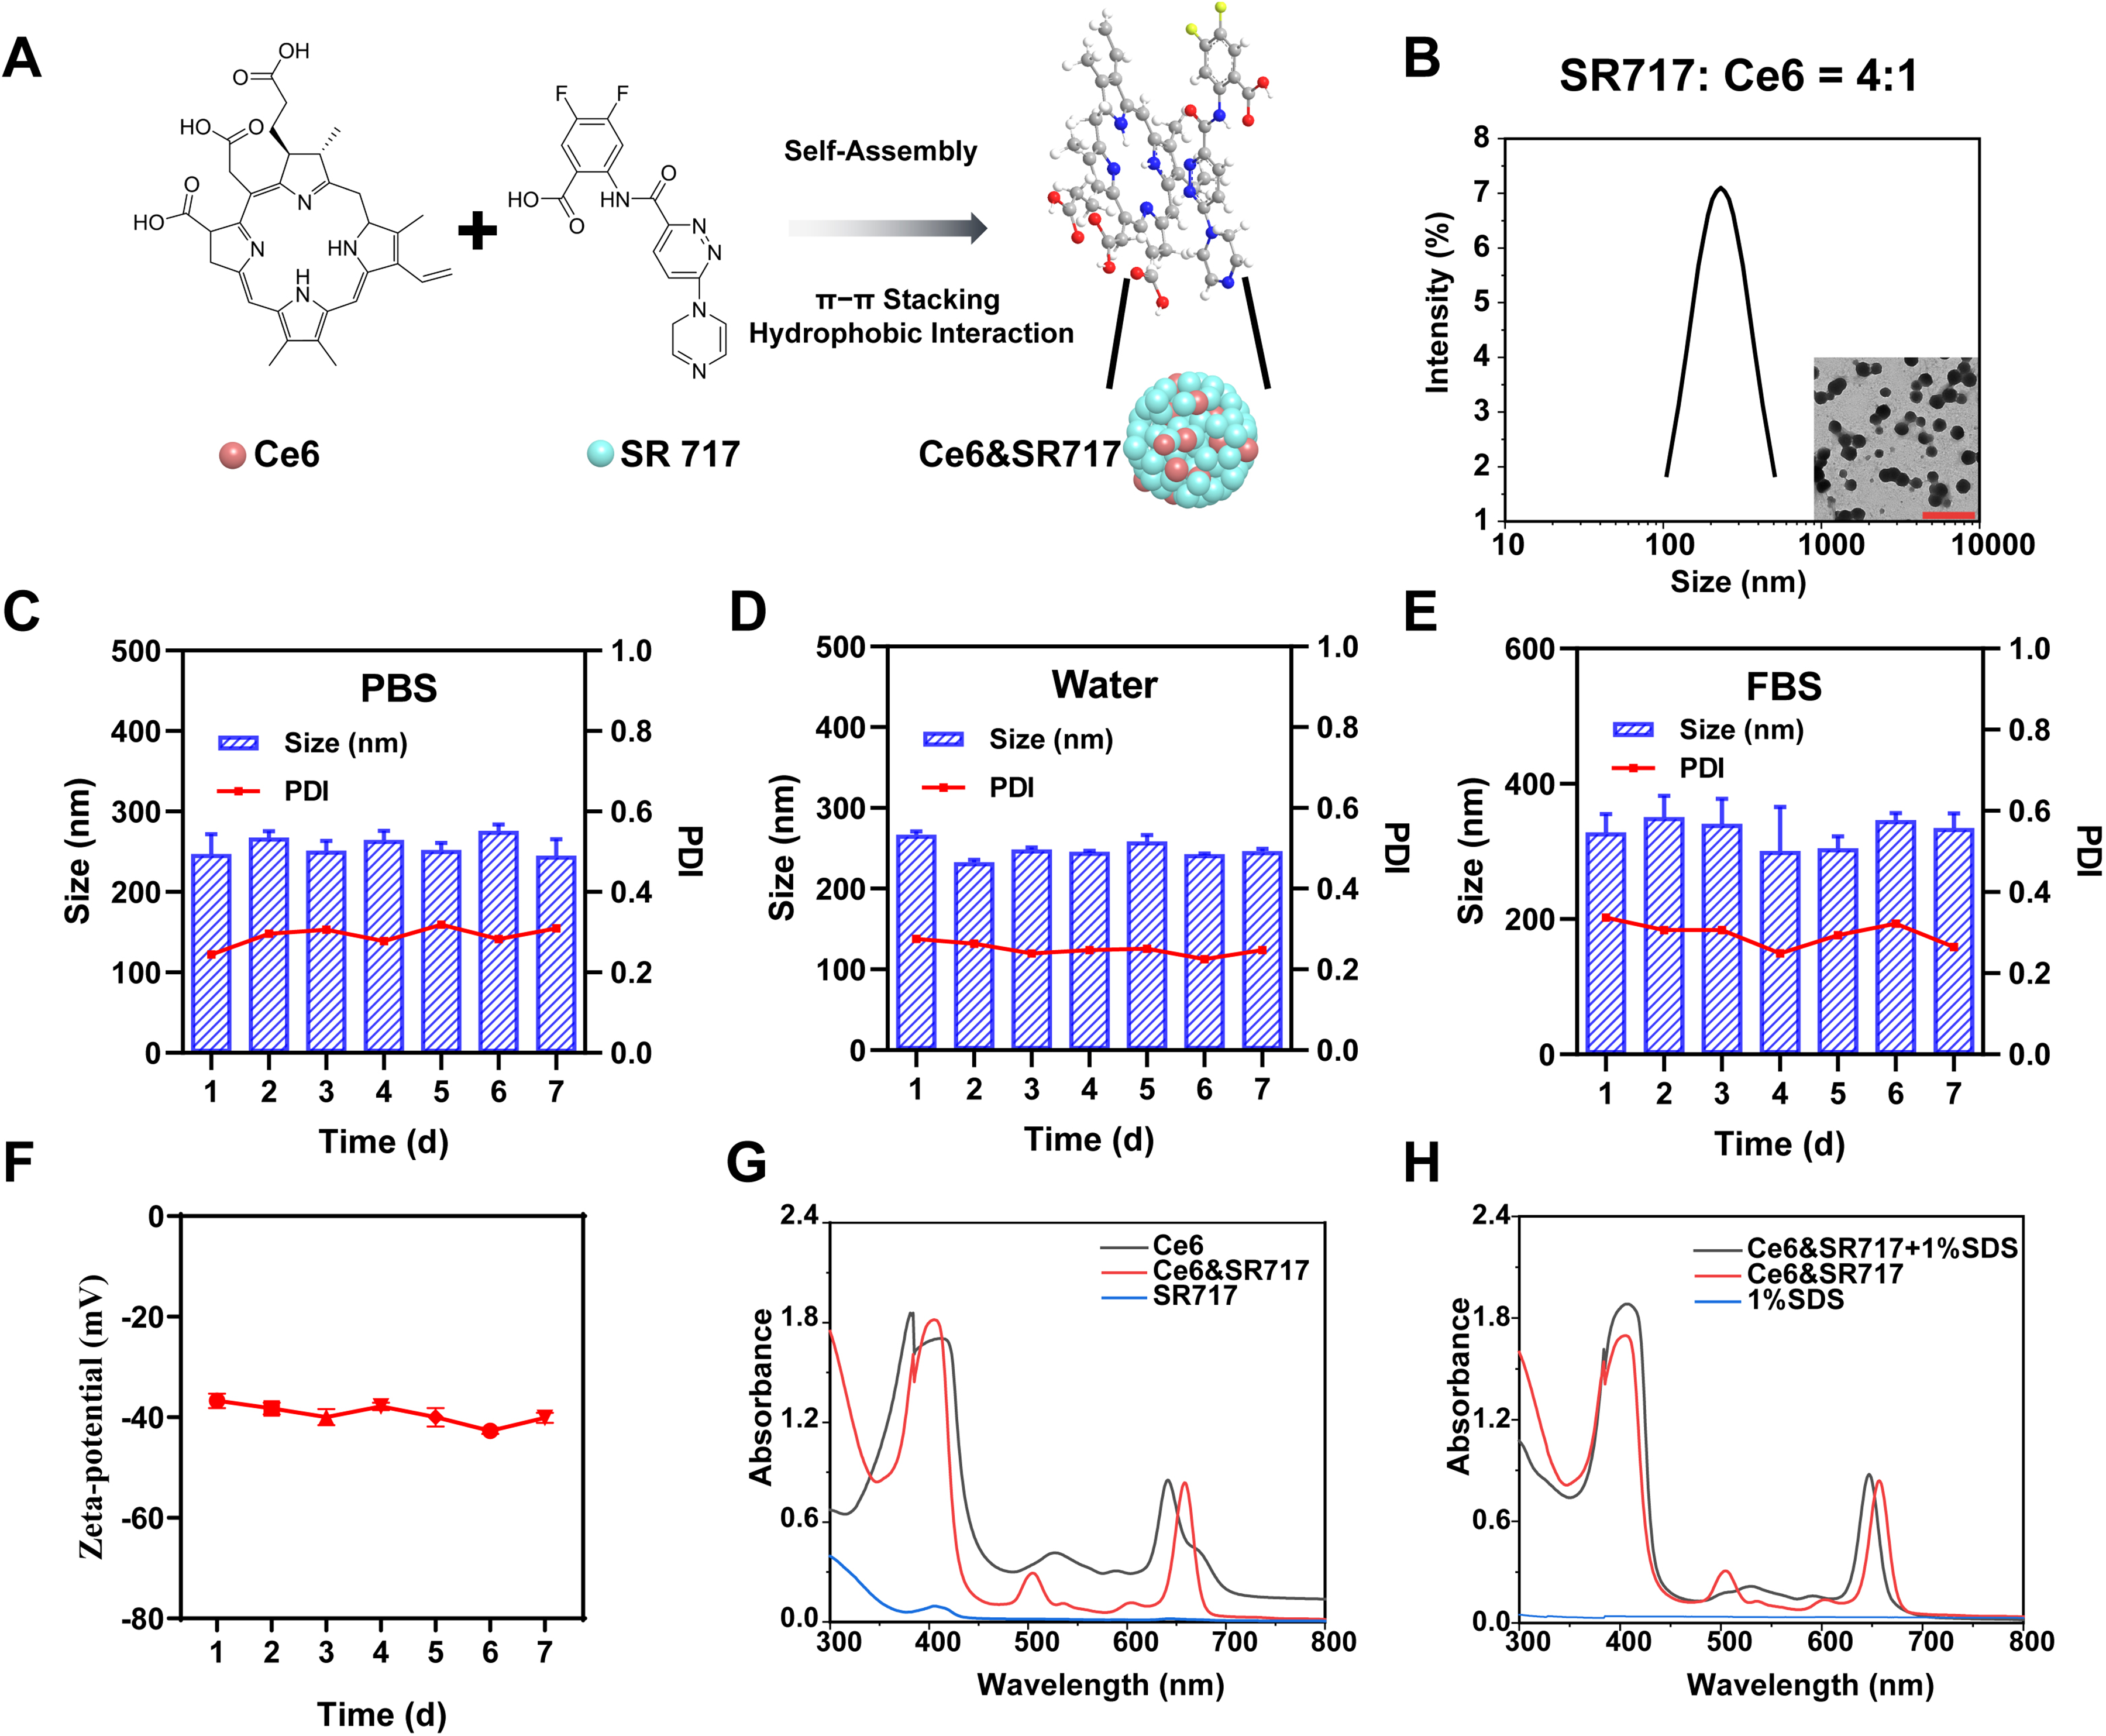
Preparation and characterization. (A) Schematic illustration of the self-assembly of Ce6&SR717 NPs through π-π stacking and hydrophobic interactions. (B) The size and TEM image (Insert) of Ce6&SR717 NPs at the feeding ratio 4:1. Scale bar: 1 μm. Hydrodynamic size and polydispersity (PDI) variations of Ce6&SR717 NPs in PBS (C), water (D), and FBS (E) within 7 days. (F) Zeta potential of Ce6&SR717 NPs within 7 days. (G) UV-vis absorbance spectrum of Ce6, Ce6&SR717 NPs, and SR717. (H) UV-vis absorbance spectrum of Ce6&SR717 NPs in the presence or absence of 1% SDS.
Molecular Dynamics Simulation of Ce6&SR717 NPs
To elucidate the formation mechanism of the co-assembled nanoparticles (NPs) composed of Ce6 and SR717, we conducted a molecular dynamics (MD) simulation study. The simulations were performed using Gromacs 2025.3 software with the CGENFF force field and the TIP3P water model. After energy minimization and equilibration under NVT/NPT ensembles, a 50 ns production run was carried out at 300 K and 1 atm. Key structural, dynamical, and interaction metrics from the simulation are presented in Figure 2. The root-mean-square deviation (RMSD) stabilized after 30 ns (Figure 2A), indicating that the system reached equilibrium. The radius of gyration (Rg) and the solvent-accessible surface area (SASA) decreased continuously throughout the simulation (Figure 2B‒C), collectively revealing a process of increasing molecular aggregation and structural compaction. Further analysis of intermolecular forces showed that the system formed an average of 1.94 ± 1.47 hydrogen bonds (Figure 2D). The van der Waals and Coulombic interaction energies reached −873.7 ± 222.8 kJ/mol (Figure 2E) and −201.8 ± 69.2 kJ/mol (Figure 2F), respectively. Detailed interaction analysis (Figure 2G‒H) indicated that conventional hydrogen bonds, π-π stacking, and hydrophobic alkyl interactions were the primary non-covalent forces driving and stabilizing the co-assembly.
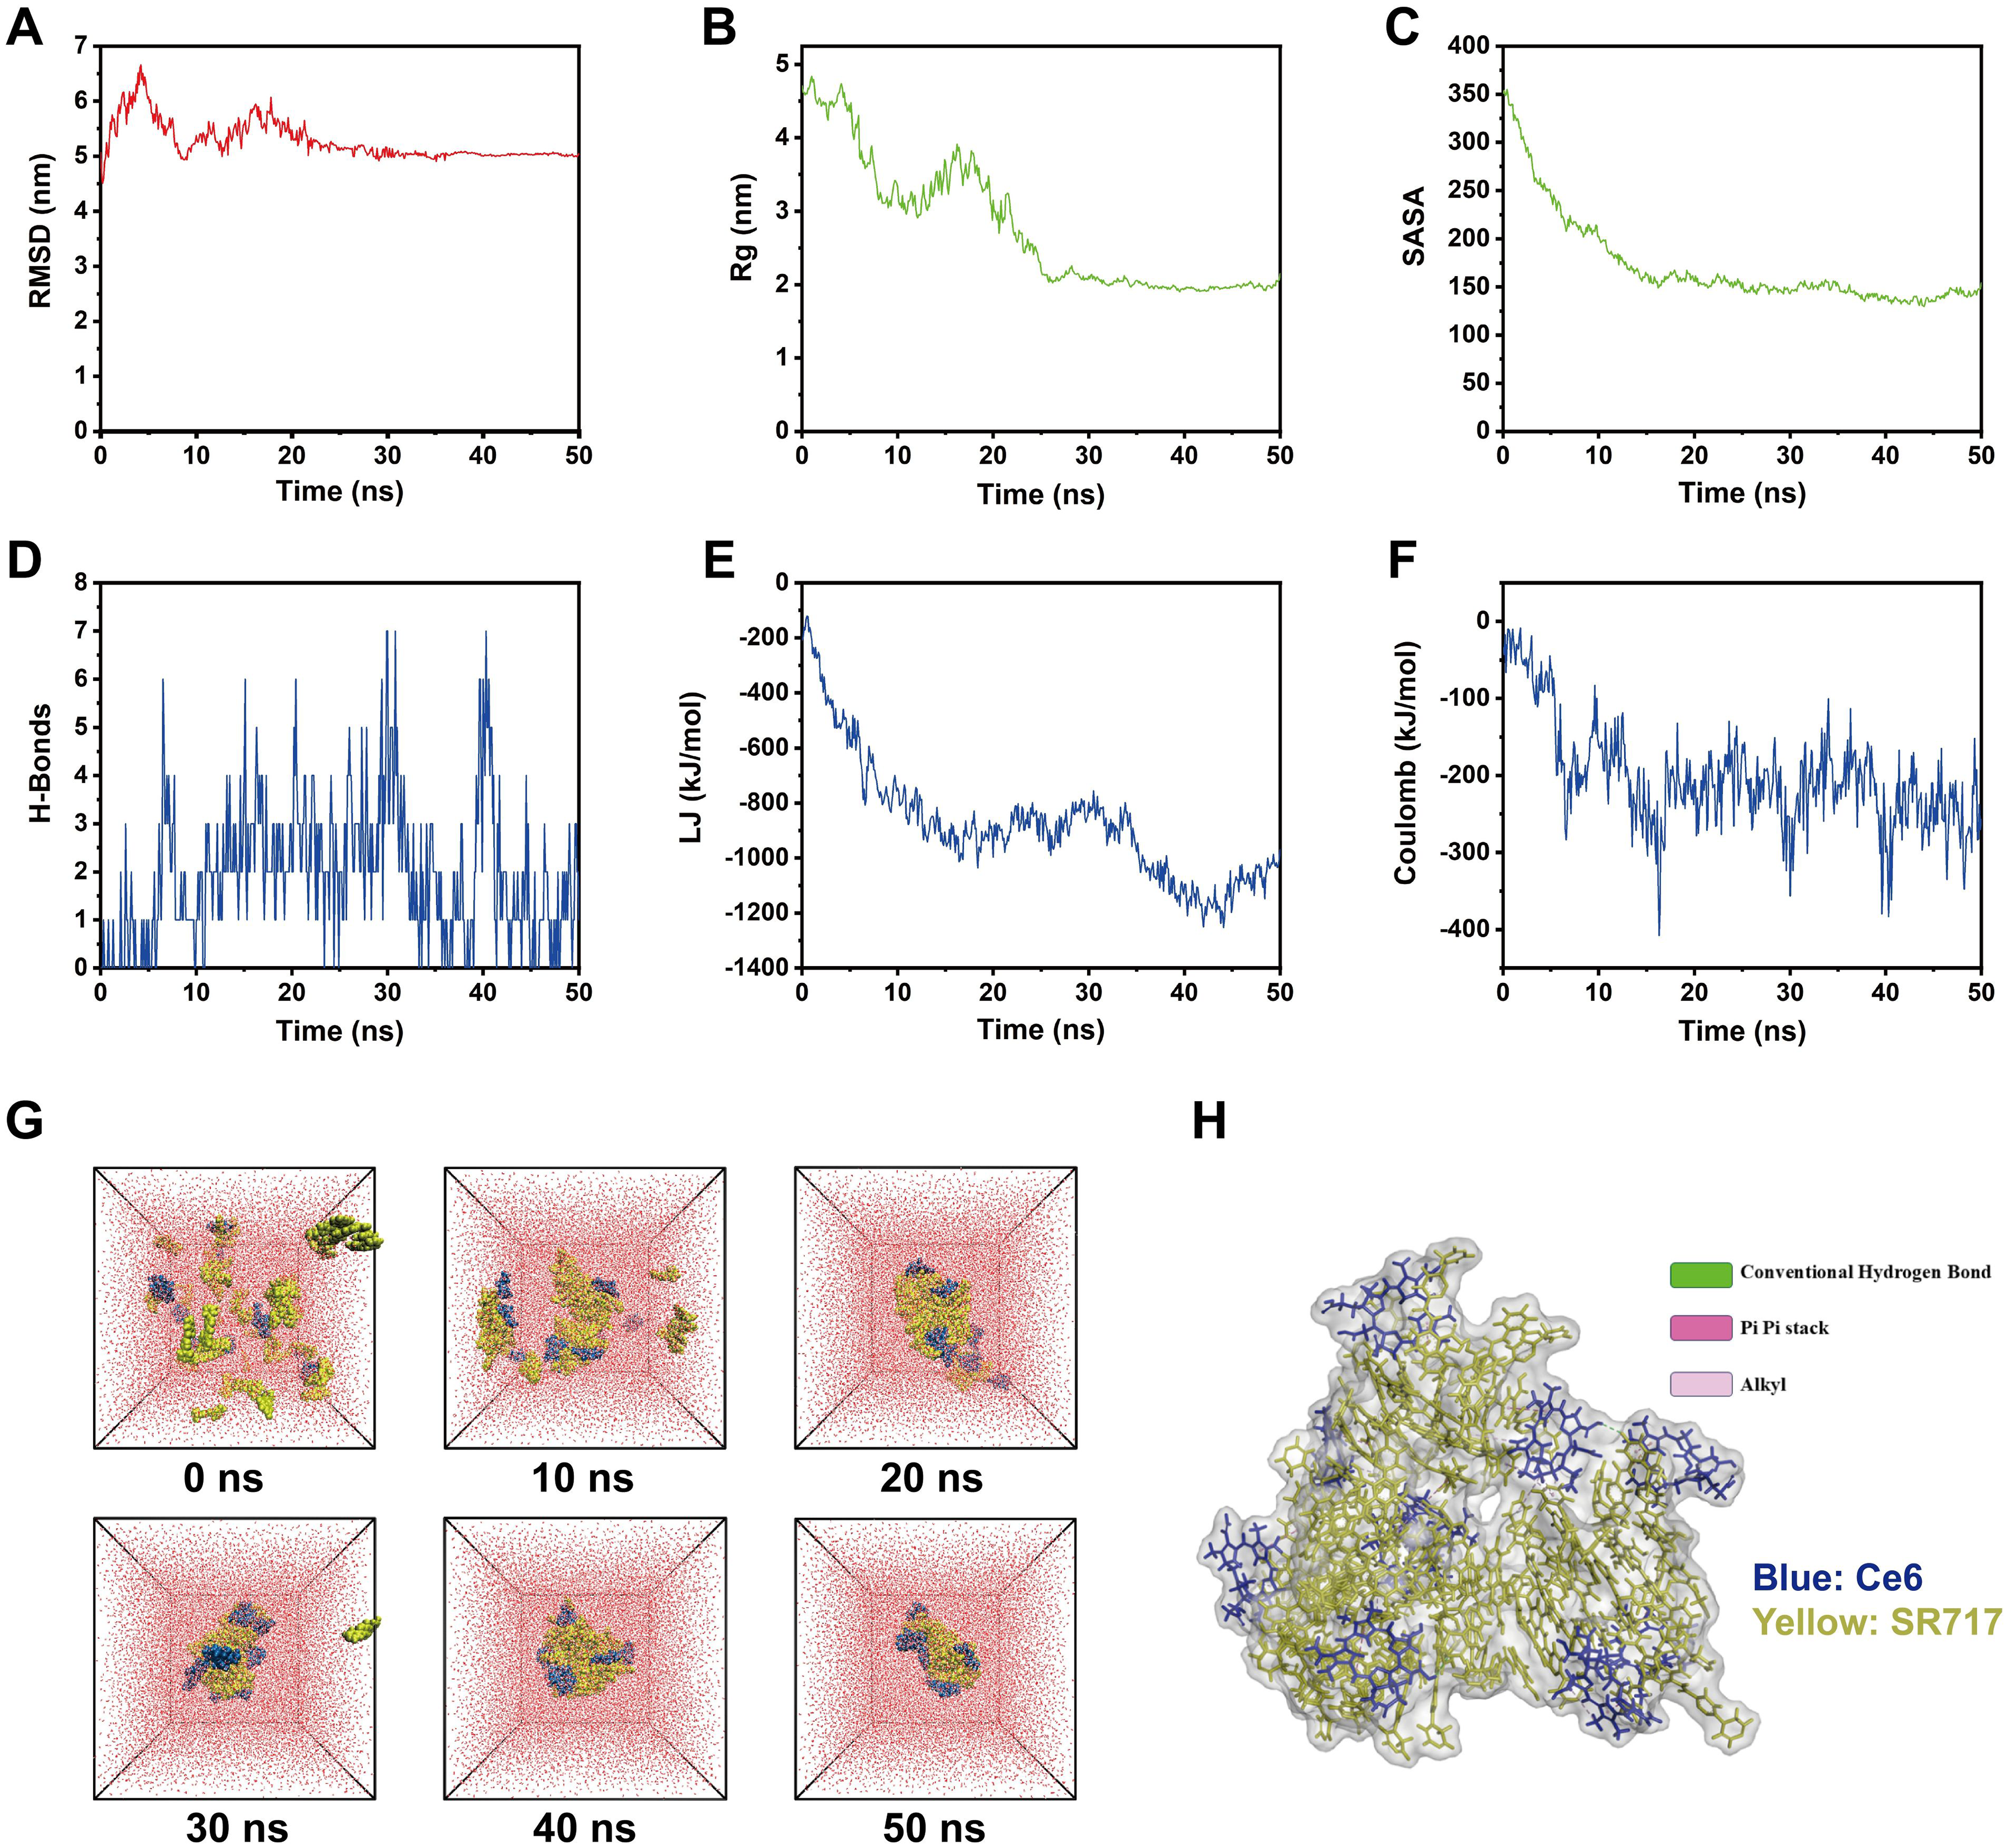
Molecular dynamics simulation of Ce6&SR717 NPs. (A) Root-mean-square deviation (RMSD) of the Ce6 and SR717 system during the simulation. (B) Radius of gyration of the Ce6 and SR717 system during the simulation. (C) Solvent-accessible surface area of the Ce6 and SR717 system during the simulation. (D) Number of hydrogen bonds in the Ce6 and SR717 system. (E) van der Waals interactions between Ce6 and SR717 molecules. (F) Coulombic interactions between Ce6 and SR717 molecules. (G) Simulation snapshots of the Ce6 and SR717 system taken every 20 nanoseconds. (H) Molecular interactions between the two molecules in the Ce6 and SR717 system.
In summary, the molecular dynamics simulation results demonstrate that Ce6 and SR717 spontaneously co-assemble into structurally compact and dynamically stable nanoparticles through the synergistic effects of multiple non-covalent interactions. Although the self-assembly process is the result of synergistic non-covalent interactions, the hydrophobic effect serves as the initial and dominant thermodynamic driving force in the aqueous (highly polar) preparation environment. To minimize the thermodynamic free energy of the system, Ce6 and SR717 molecules must aggregate via their hydrophobic backbones to reduce contact with surrounding water molecules. Subsequently, once the molecules are in close proximity, the strong and directional π-π stacking between the large planar porphyrin ring of Ce6 and the aromatic ring of SR717 becomes the most critical force for locking and maintaining the ultimate structural stability of the nanoparticles. These forces complement each other perfectly to achieve highly efficient, carrier-free co-assembly.
In Vitro Antitumor Efficacy
Sufficient cellular internalization is a prerequisite for generating robust in vitro antitumor efficacy. Ce6&SR717 NPs were conceptualized to overcome the free membrane penetration barriers of Ce6 through supramolecular assembly-enhanced endocytic pathways. To evaluate the efficacy of this strategy, we first tracked cellular uptake by leveraging the intrinsic fluorescence of Ce6 via confocal laser scanning microscopy (CLSM). Time-course imaging in 4T1 cells revealed a time-dependent increase in red fluorescence across all groups (Figure 3A). Critically, the fluorescence signal was markedly more intense for Ce6&SR717 NPs than for free Ce6 at every matched time point, visually demonstrating the enhanced internalization capacity of the nano-formulation. The qualitative observation of enhanced internalization was further validated through quantitative flow cytometry analysis, which demonstrated that Ce6&SR717 NPs exhibited 3.9-fold and 3.3-fold increases in mean fluorescence intensity relative to free Ce6 in 4T1 cells at 3 h and 6 h post co-incubation, respectively (Figure 3B). These findings robustly demonstrate the superior cellular uptake efficiency of the Ce6&SR717 nano-formulation.
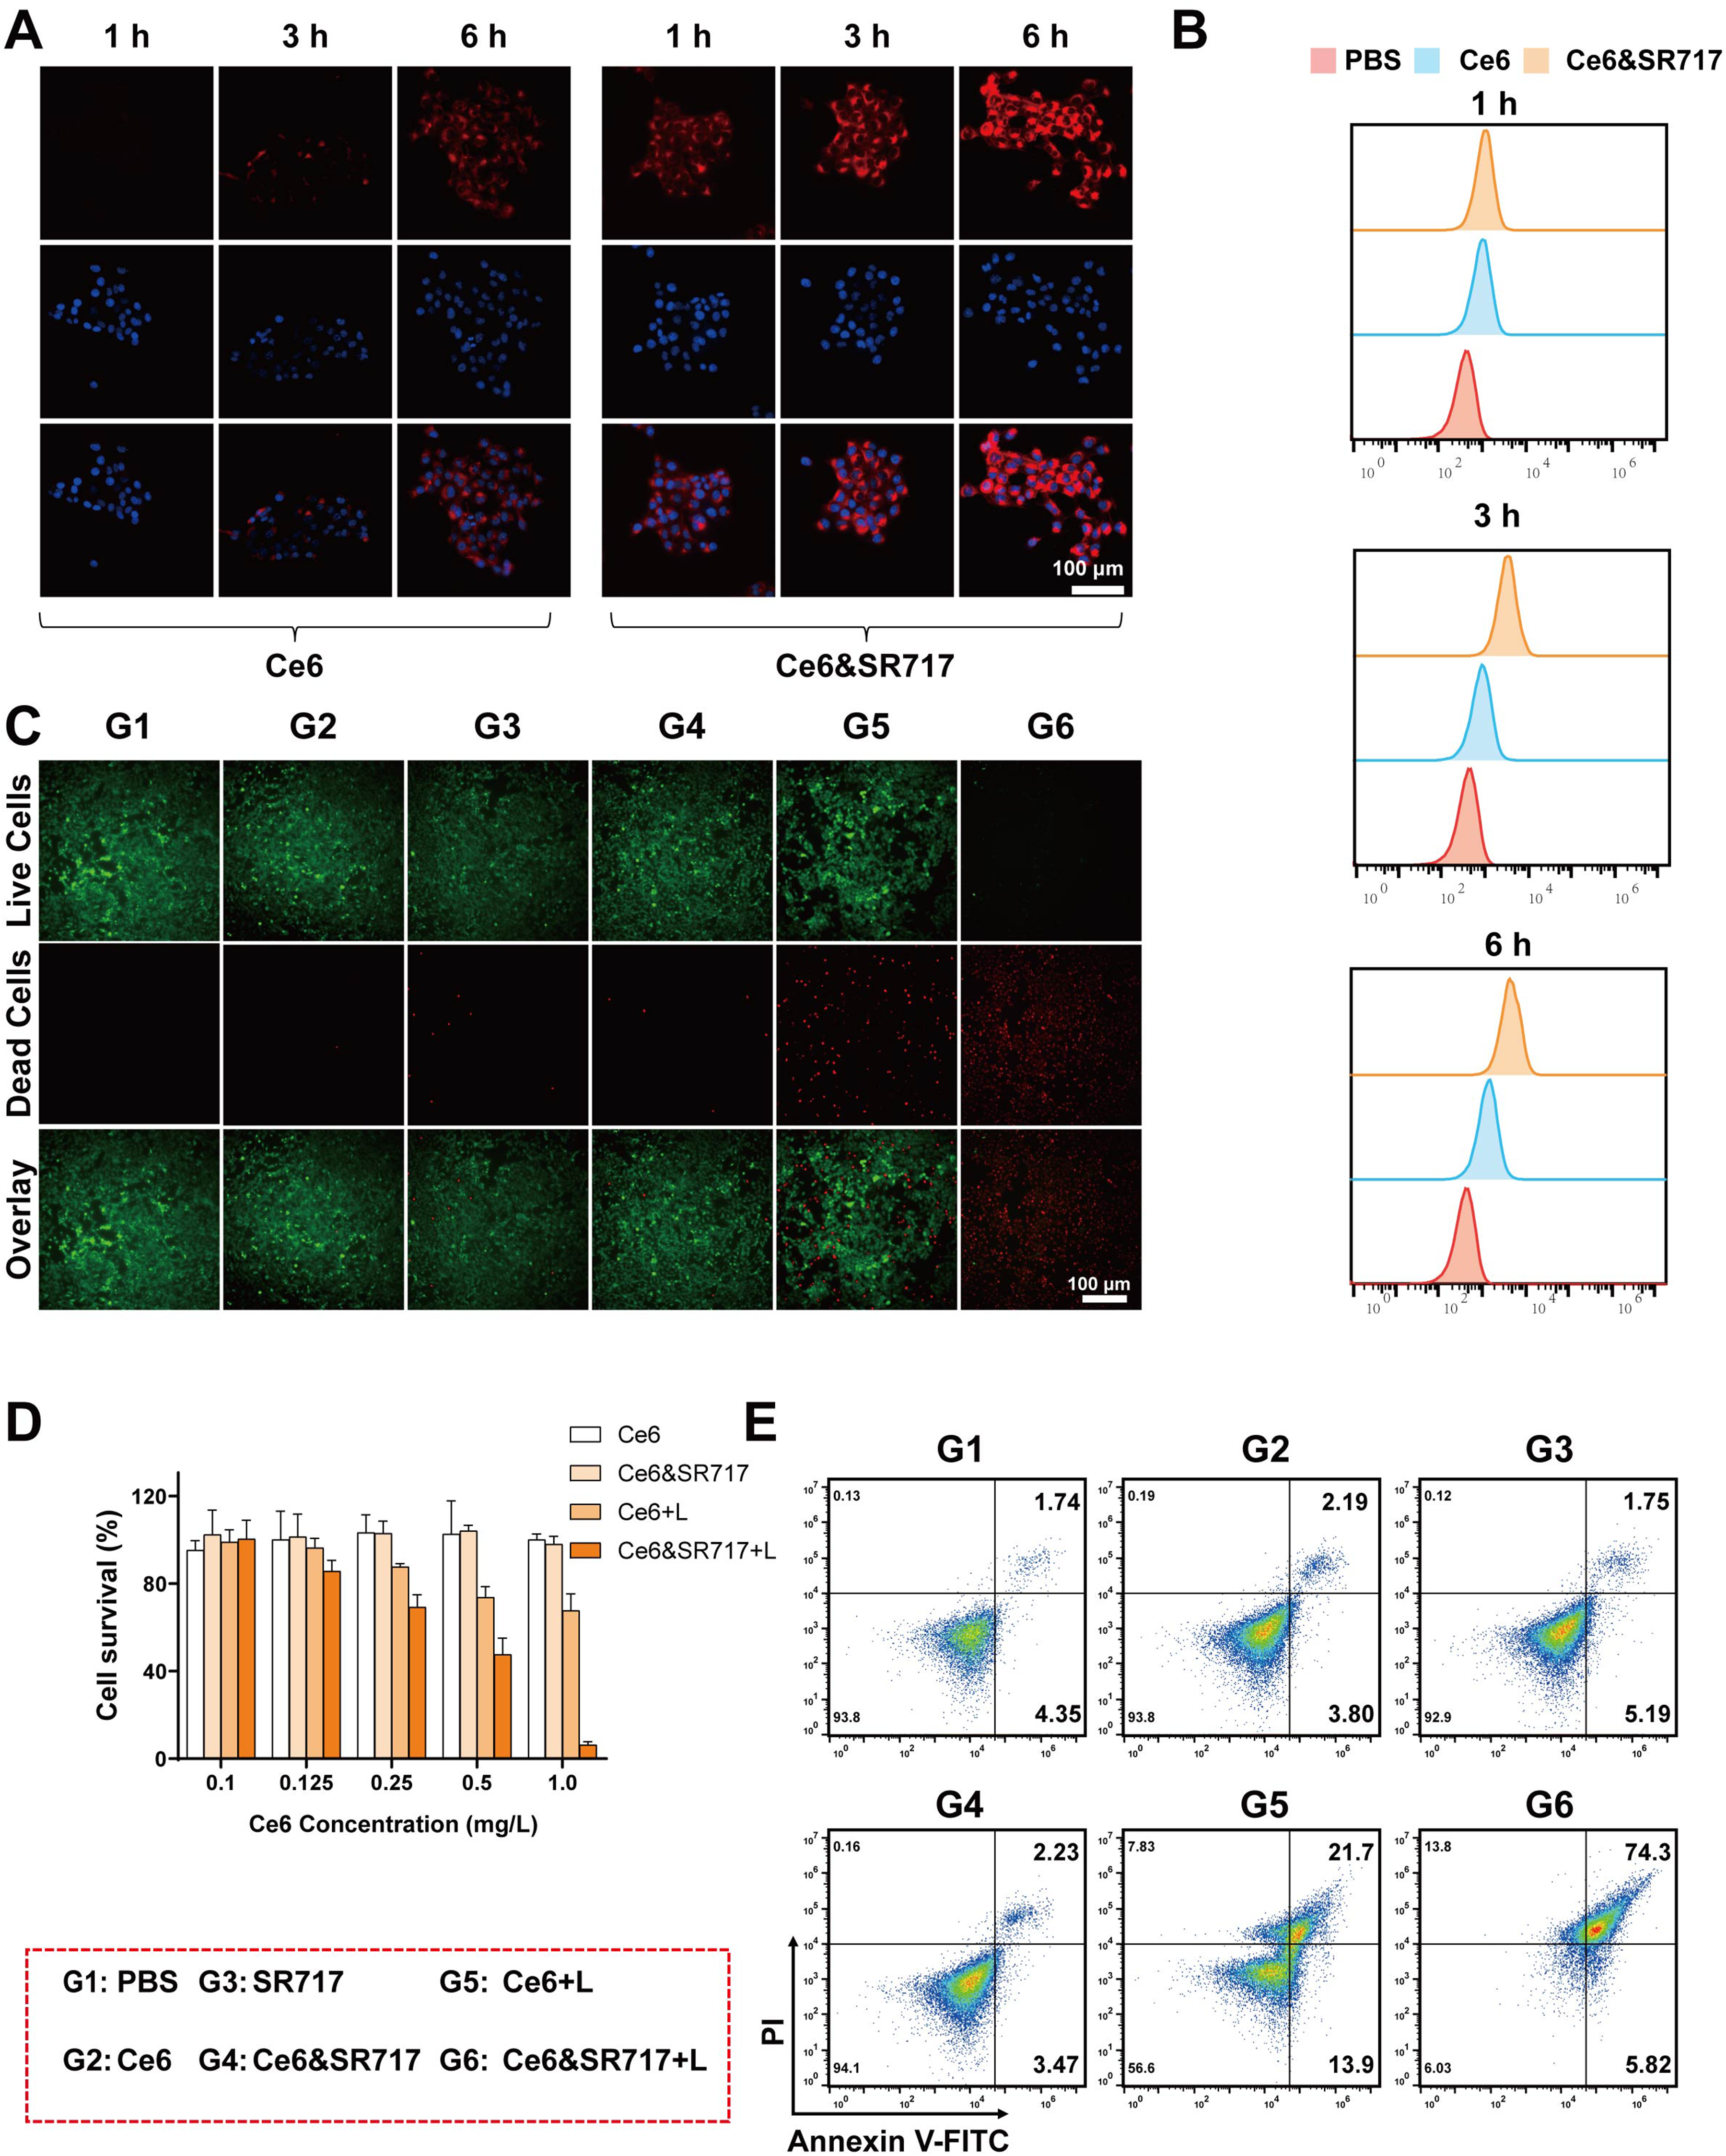
Cellular uptake behavior and cell cytotoxicity of Ce6&SR717 NPs. (A) CLSM images and (B) quantitative flow cytometry analysis of cellular uptake of Ce6 and Ce6&SR717 in 4T1 cells at different times. Scale bar: 100 μm. (C) Live-dead staining of 4T1 cells after different treatments. Scale bar: 100 μm. (D) CCK8 analysis of Ce6 and Ce6&SR717 NPs with or without light irradiation. (E) Annexin V-FITC/Propidium iodide (PI) apoptosis detection of 4T1 cells after different treatments. Groups: G1: PBS; G2: Ce6; G3:SR717; G4: Ce6&SR717 NPs; G5: Ce6 + L; G6: Ce6&SR717 NPs + L.
Subsequently, the in vitro therapeutic efficacy of Ce6&SR717 NPs and free Ce6 was systematically evaluated in 4T1 cells under dark and laser conditions via live/dead staining, CCK-8 assays, and Annexin V/PI flow cytometry. Initial live/dead staining revealed that both formulations were non-toxic in the dark, as evidenced by predominantly green fluorescence (Figure 3C). Upon laser irradiation, however, a stark contrast emerged: cells treated with Ce6&SR717 NPs showed intense red fluorescence with minimal green, indicating widespread cell death, whereas the free Ce6 group exhibited only sporadic red signals against a background of viable (green) cells. This qualitative visualization of superior photodynamic killing by Ce6&SR717 NPs was subsequently quantified by CCK-8 assays. In the dark, both agents maintained high cell viability (>90%), confirming minimal dark toxicity. After a 1-min light exposure, free Ce6 showed limited cytotoxicity, consistent with its poor cellular uptake. In contrast, Ce6&SR717 NPs mediated potent, concentration-dependent cell killing, reducing viability to below 50% at 0.5 μg/mL and to less than 10% at 1 μg/mL (Figure 3D). Subsequently, cell apoptosis was further detected using FCM and Annexin V-FITC/propidium iodide (PI) staining (Figure 3E). The Ce6&SR717 + laser treatment resulted in the highest proportion of apoptotic cells (74.3%), exhibiting the best therapeutic effect. These findings signified an augmented photodynamic therapeutic potency of the Ce6&SR717 NPs relative to free Ce6. Taken together, these findings demonstrate that the strategic design of Ce6&SR717 NPs, which overcomes cellular penetration barriers through supramolecular assembly-enhanced endocytosis, achieves significantly enhanced in vitro antitumor efficacy by enabling superior photodynamic killing and inducing a high proportion of apoptotic cell death compared to free Ce6.
In Vitro PDT and ICD Induction
To further evaluate the PDT efficacy of Ce6&SR717 NPs against 4T1 cells and its potential to induce immunogenic cell death (ICD), fluorescence imaging was systematically employed to assess intracellular reactive oxygen species (ROS) generation, detect DNA double-strand breaks (γ-H2AX foci), and monitor the extracellular exposure of calreticulin (CRT) and release of high-mobility group box 1 (HMGB1). Specifically, to assess light-activated ROS generation, 4T1 cells under different conditions (G1-G6) were stained with DCFH-DA. As shown in Figure 4A‒B, the non-irradiated groups (G1-G4) showed no detectable green fluorescence. Upon laser irradiation, however, cells treated with Ce6&SR717 NPs exhibited pronounced green fluorescence, demonstrating robust ROS generation. In contrast, free Ce6 under identical irradiation displayed substantially weaker signals, highlighting the superior ROS production of Ce6&SR717 NPs. In addition, immunofluorescence detection of γ-H2AX foci served as a sensitive metric for comparative DNA double-strand break (DSB) analysis across experimental conditions. As a phosphorylated histone H3AX variant, γ-H3AX rapidly accumulates at DSB sites, serving as a highly sensitive biomarker for DNA damage response. Confocal microscopy analysis of immunofluorescence staining (Figure 4C‒D) demonstrated negligible γ-H2AX foci formation in non-irradiated control groups. Strikingly, the Ce6&SR717 with laser irradiation group exhibited intense red fluorescence signals corresponding to γ-H2AX clusters, indicating extensive DSB induction. In contrast, free Ce6 with laser irradiation treatment displayed significantly attenuated γ-H2AX foci density, consistent with limited DNA fragmentation under equivalent irradiation conditions. These results highlight the nano-assembled Ce6&SR717 system's superior capacity to induce DNA double-strand breaks compared to free Ce6 under equivalent PDT conditions.

Ce6&SR717 NPs-mediated PDT induces robust immunogenic cell death (ICD) in 4T1 cells. (A, B) Detection and quantification of intracellular ROS production. Scale bar: 100 μm. (C, D) Immunofluorescence staining and quantification of γ-H3AX foci, indicating DNA double-strand breaks. Scale bar: 100 μm. (E, F) CRT immunofluorescence staining in 4T1 cells post-treatment and quantitative analysis. (G, H) HMGB1 immunofluorescence staining in 4T1 cells post-treatment and quantitative analysis. Scale bar: 100 μm. Groups: G1: PBS; G2: Ce6; G3:SR717; G4: Ce6&SR717; G5: Ce6 + L; G6: Ce6&SR717 + L.
Subsequently, the induction of ICD was specifically confirmed by evaluating the extracellular exposure of CRT and HMGB1 via fluorescence imaging. ICD is characterized by two hallmark events: (1) CRT translocation from the endoplasmic reticulum to the outer cell membrane, serving as an early “eat-me” signal to recruit dendritic cells (DCs), and (3) nuclear-to-extracellular release of HMGB1, a chromatin-binding protein critical for DNA organization, which occurs during later ICD stages. Fluorescence labeling of CRT revealed significantly enhanced membrane-proximal signals in Ce6&SR717 with laser irradiation-treated cells compared to controls (Figure 4E and F), indicative of surface CRT exposure. Concurrently, HMGB1 underwent a distinct spatiotemporal re-localization: unirradiated controls exhibited strong nuclear HMGB1-DAPI co-localization (green/blue overlap), whereas free Ce6 with laser treatment reduced both signal intensity and nuclear co-localization. Notably, the Ce6&SR717 NPs with laser irradiation group nearly abolished nuclear HMGB1 fluorescence, confirming robust extracellular release and indicating a pronounced ICD effect (Figure 4G‒H). These results demonstrate that the nano-assembled Ce6&SR717 system significantly amplifies PDT-induced immunogenic cell death by enhancing ROS production, DNA double-strand breaks, extracellular exposure of CRT, and release of HMGB1.
In Vitro STING Activation Induces DC Maturation and Macrophage Polarization
Conceptually, Ce6&SR717 integrates PDT with STING agonism and may thereby synergistically potentiate antitumor immune responses (Figure 5A). As an evolutionarily conserved cytosolic DNA sensor, the cGAS-STING pathway detects tumor-derived DNA released during PDT-induced damage, where cGAS catalyzes its conversion into the second messenger cGAMP. This cyclic dinucleotide activates STING in antigen-presenting cells (APCs), particularly dendritic cells and macrophages, within tumor microenvironments, subsequently triggering inflammatory cytokine production and initiating antitumor immunity through downstream signaling cascades. Notably, Ce6&SR717 can serve as a direct STING agonist, enhancing STING activation, creating a dual mechanism of action through both endogenous DNA sensing and exogenous ligand stimulation. To investigate the capacity of Ce6&SR717 to amplify cGAS-STING-dependent APC priming, we implemented a Transwell coculture paradigm to dissect dendritic cell activation biomarkers and macrophage M1-polarization dynamics. Western blot analysis revealed that Ce6&SR717 combined with light irradiation significantly upregulated the expression levels of cGAS and phosphorylated STING (p-STING) in bone marrow-derived dendritic cells (BMDCs) and Raw 264.7 macrophages compared to control groups, thereby activating downstream signaling cascades (Figure 5B‒C). The STING-dependent pathway triggered phosphorylation of TANK-binding kinase 1 (p-TBK1) and interferon regulatory factor 3 (p-IRF3), facilitating their nuclear translocation to initiate transcriptional activity. Concurrently, phosphorylation of P65 (p-P65), a hallmark of NF-κB pathway activation, was markedly enhanced in Ce6&SR717 + L-treated cells, further demonstrating the dual activation of STING-mediated innate immune signaling. Quantitative Western blot analysis revealed that the Ce6&SR717 NP-based PDT (G6) robustly activated the STING signaling pathway in immune cells. The levels of key STING pathway proteins were markedly higher in this group compared to controls: they were 2.9- to 9.3-fold greater than those induced by free Ce6-based PDT, and 1.8- to 6.3-fold greater than those achieved with SR717 monotherapy (Figure 5D‒K). Activation of the STING signaling pathway triggers the production of downstream pro-inflammatory cytokines and promotes immune cell maturation. Thus, we used ELISA to quantify the secretion of interleukin-6 (IL-6) and tumor necrosis factor-alpha (TNF-α) in both BMDCs and RAW 264.7 macrophages, as well as type I interferon (IFN-β) in BMDCs, across treatment groups. The quantification revealed that Ce6&SR717 NPs upon laser irradiation potently amplified the secretion of these cytokines, which in turn mediated the maturation of dendritic cells and M1 polarization of macrophages (Figure 5L‒O and Figure S5 in the supplementary materials).
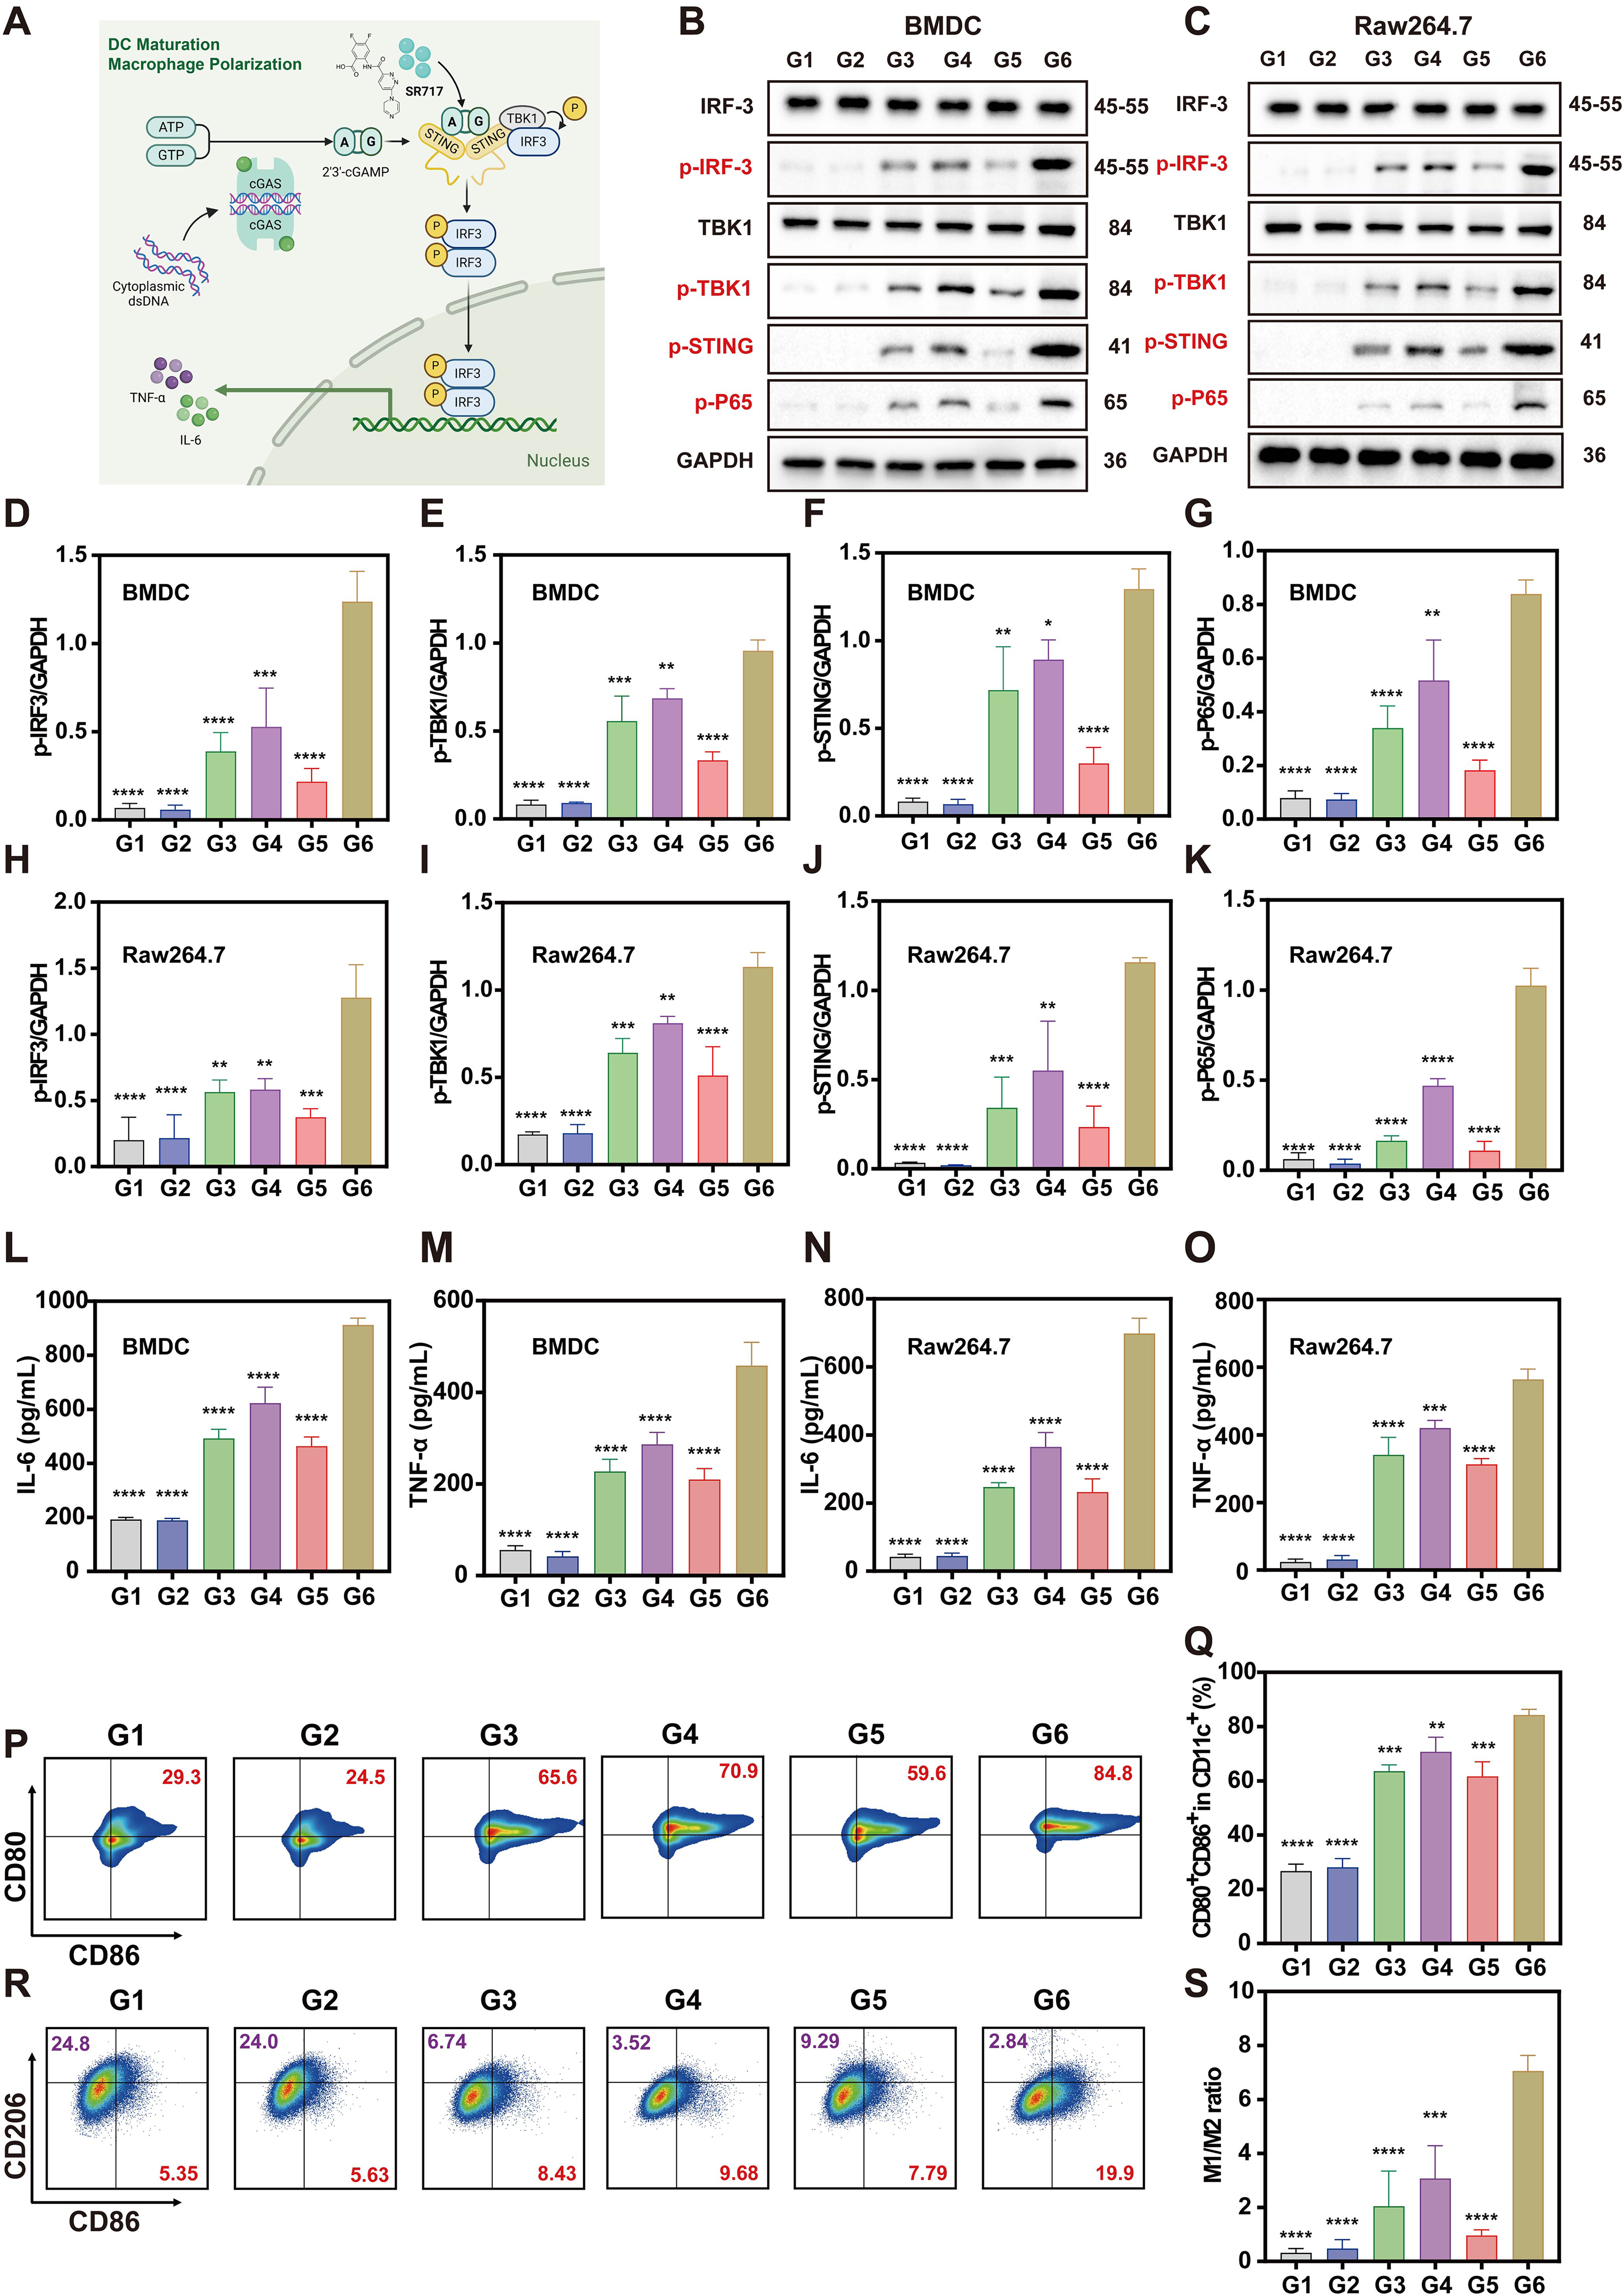
Ce6&SR717 NPs-induced DC maturation and macrophage M1 polarization via cGAS-STING signaling pathway activation. (A) Schematic illustration of the signaling pathway underlying Ce6&SR717-mediated immune activation. (B, C) Immunoblot analysis of cGAS and STING expression in (B) BMDCs and (C) RAW 264.7 macrophages across treatment groups. (D-K) Quantification of phosphorylated protein levels in the cGAS-STING-NF-κB axis in (D–G) BMDCs and (H–K) RAW 264.7 cells. (L–O) ELISA measurement of pro-inflammatory cytokines (IL-6 and TNF-α) in (L, M) BMDC and (N, O) macrophage supernatants. (P–S) Flow cytometric analysis of (P, Q) BMDC maturation and (R, S) macrophage M1/M2 polarization. Groups: G1: PBS; G2: Ce6; G3:SR717; G4: Ce6&SR717; G5: Ce6 + L; G6: Ce6&SR717 + L.
Furthermore, we evaluated the effects of different treatment groups on the expression of surface markers in BMDCs and RAW 264.7 cells within the Transwell co-culture system using flow cytometry. As demonstrated in Figure 5P‒Q, the combination of Ce6&SR717 NPs and laser phototherapy synergistically enhanced CD80+CD86+ co-expression on BMDCs, yielding 84.33% ± 2.04% dual-positive cells. This represented a substantial increase of approximately 30 percentage points compared to SR717 monotherapy (63.60% ± 2.39%) or Ce6-mediated phototherapy alone (61.70% ± 5.37%). These results demonstrate that the combined application of a STING agonist and PDT-induced ICD potently enhances DC maturation. The elevated levels of co-stimulatory molecules (CD80/CD86) provide sufficient secondary signals for T-cell activation, thereby effectively initiating antigen-specific immune responses. For RAW 264.7 cells, CD86 and CD206 were used as markers for M1-like and M2-like macrophage phenotypes, respectively. In the Transwell co-culture system, 4T1 cells treated with Ce6&SR717 NPs and exposed to laser irradiation exhibited a significant increase in the proportion of M1 macrophages (CD86+/CD206−) and a decrease in M2 macrophages (CD86−/CD206+), as evidenced by an elevated M1/M2 ratio (Figure 5R‒S). Specifically, a marked shift in macrophage polarization towards the M1 phenotype was observed in the Ce6&SR717 NPs with laser irradiation group, as evidenced by the highest M1/M2 ratio (7.05 ± 0.58). This value was substantially higher than those in the Ce6 with laser group (0.96 ± 0.21) and the SR717 monotherapy group (2.05 ± 1.3).
Biodistribution and Tumor Accumulation
As a crucial first step toward efficient therapy, the in vivo distribution of Ce6&SR717 NPs was evaluated. Both the Ce6&SR717 NPs and free Ce6 control were intravenously administered via tail vein to 4T1 tumor-bearing mice. In vivo near-infrared imaging was performed at selected time points (2 h, 4 h, 6 h, and 24 h) post-injection to monitor real-time tissue distribution (Figure S6 in the supplementary materials). At 24 h post-injection, the mice were sacrificed and their tumors and major organs were collected and subjected to IVIS Lumina XR system Notably, at different time points, in vivo imaging at 2 h post-injection showed a relatively stronger fluorescence signal in the tumor region for the Ce6&SR717 group, with the average fluorescence intensity at the tumor site being nearly twice that of the free Ce6 group. After 24 h, when mice were sacrificed, ex vivo measurements of tumor fluorescence intensity still showed a 21% higher value in the Ce6&SR717 group compared to the free Ce6 group. These results demonstrate that tumor accumulation of Ce6&SR717 nanodrug is significantly higher than that of the free Ce6 counterparts, likely due to the passive targeting benefits of Ce6&SR717 facilitated by the EPR effect and its markedly improved colloidal stability.
In Vivo Antitumor Effect
Then in vivo antitumor evaluation was conducted in BALB/c mice bearing 4T1 tumors randomized into six groups (n = 5/group): G1 (PBS control), G3 (Ce6 group), G3 (SR717 group), G4 (Ce6&SR717 NPs group), G5 (Ce6 with laser), and G6 (Ce6&SR717 NPs with laser). Ce6 and SR717 were intravenously administered at equivalent doses (SR717: 10 mg/kg) on days 0, 3, and 6. Laser groups (G5‒6) received localized irradiation (0.5 W/cm2, 5 min) at 2 h post-injection. The Ce6&SR717 with laser group demonstrated marked synergistic antitumor efficacy, as evidenced by significant reductions in both tumor volume and weight (Figure 6A‒C, Figure S7 in the supplementary materials). At day 14, mice treated with Ce6&SR717 NPs + L exhibited a tumor volume of 306.3 ± 74.1 mm3, representing a 77.2% suppression compared to the PBS control (1342.5 ± 140.2 mm3). The tumor volume in this combination group was 2.5-fold and 2.7-fold lower than that in the SR717 monotherapy (779.0 ± 191.6 mm3) and Ce6-based PDT alone (814.3 ± 314.7 mm3) groups, respectively. Terminal tumor dissection confirmed these findings. Tumor mass in Ce6&SR717 + L group was reduced to 0.2466 ± 0.03 g (vs 1.100 ± 0.03 g in controls), achieving 89.1% mass reduction, corroborated by macroscopic necrotic regions in excised tumors. This enhanced therapeutic outcome stemmed from the synergistic interplay of Ce6-mediated ROS generation under laser irradiation (660 nm, 0.5 W/cm2, 5 min) and SR717-driven STING pathway activation, collectively inducing potent tumor eradication. Biosafety assessments showed stable body weight fluctuations (<5% variation) across all groups during the 14-day regimen (Figure S8 in the supplementary materials), indicating minimal systemic toxicity. Histopathological analysis of major organs (heart, liver, spleen, lungs, kidneys) via H&E staining revealed no treatment-related pathological abnormalities, confirming good biocompatibility (Figure S9 in the supplementary materials).
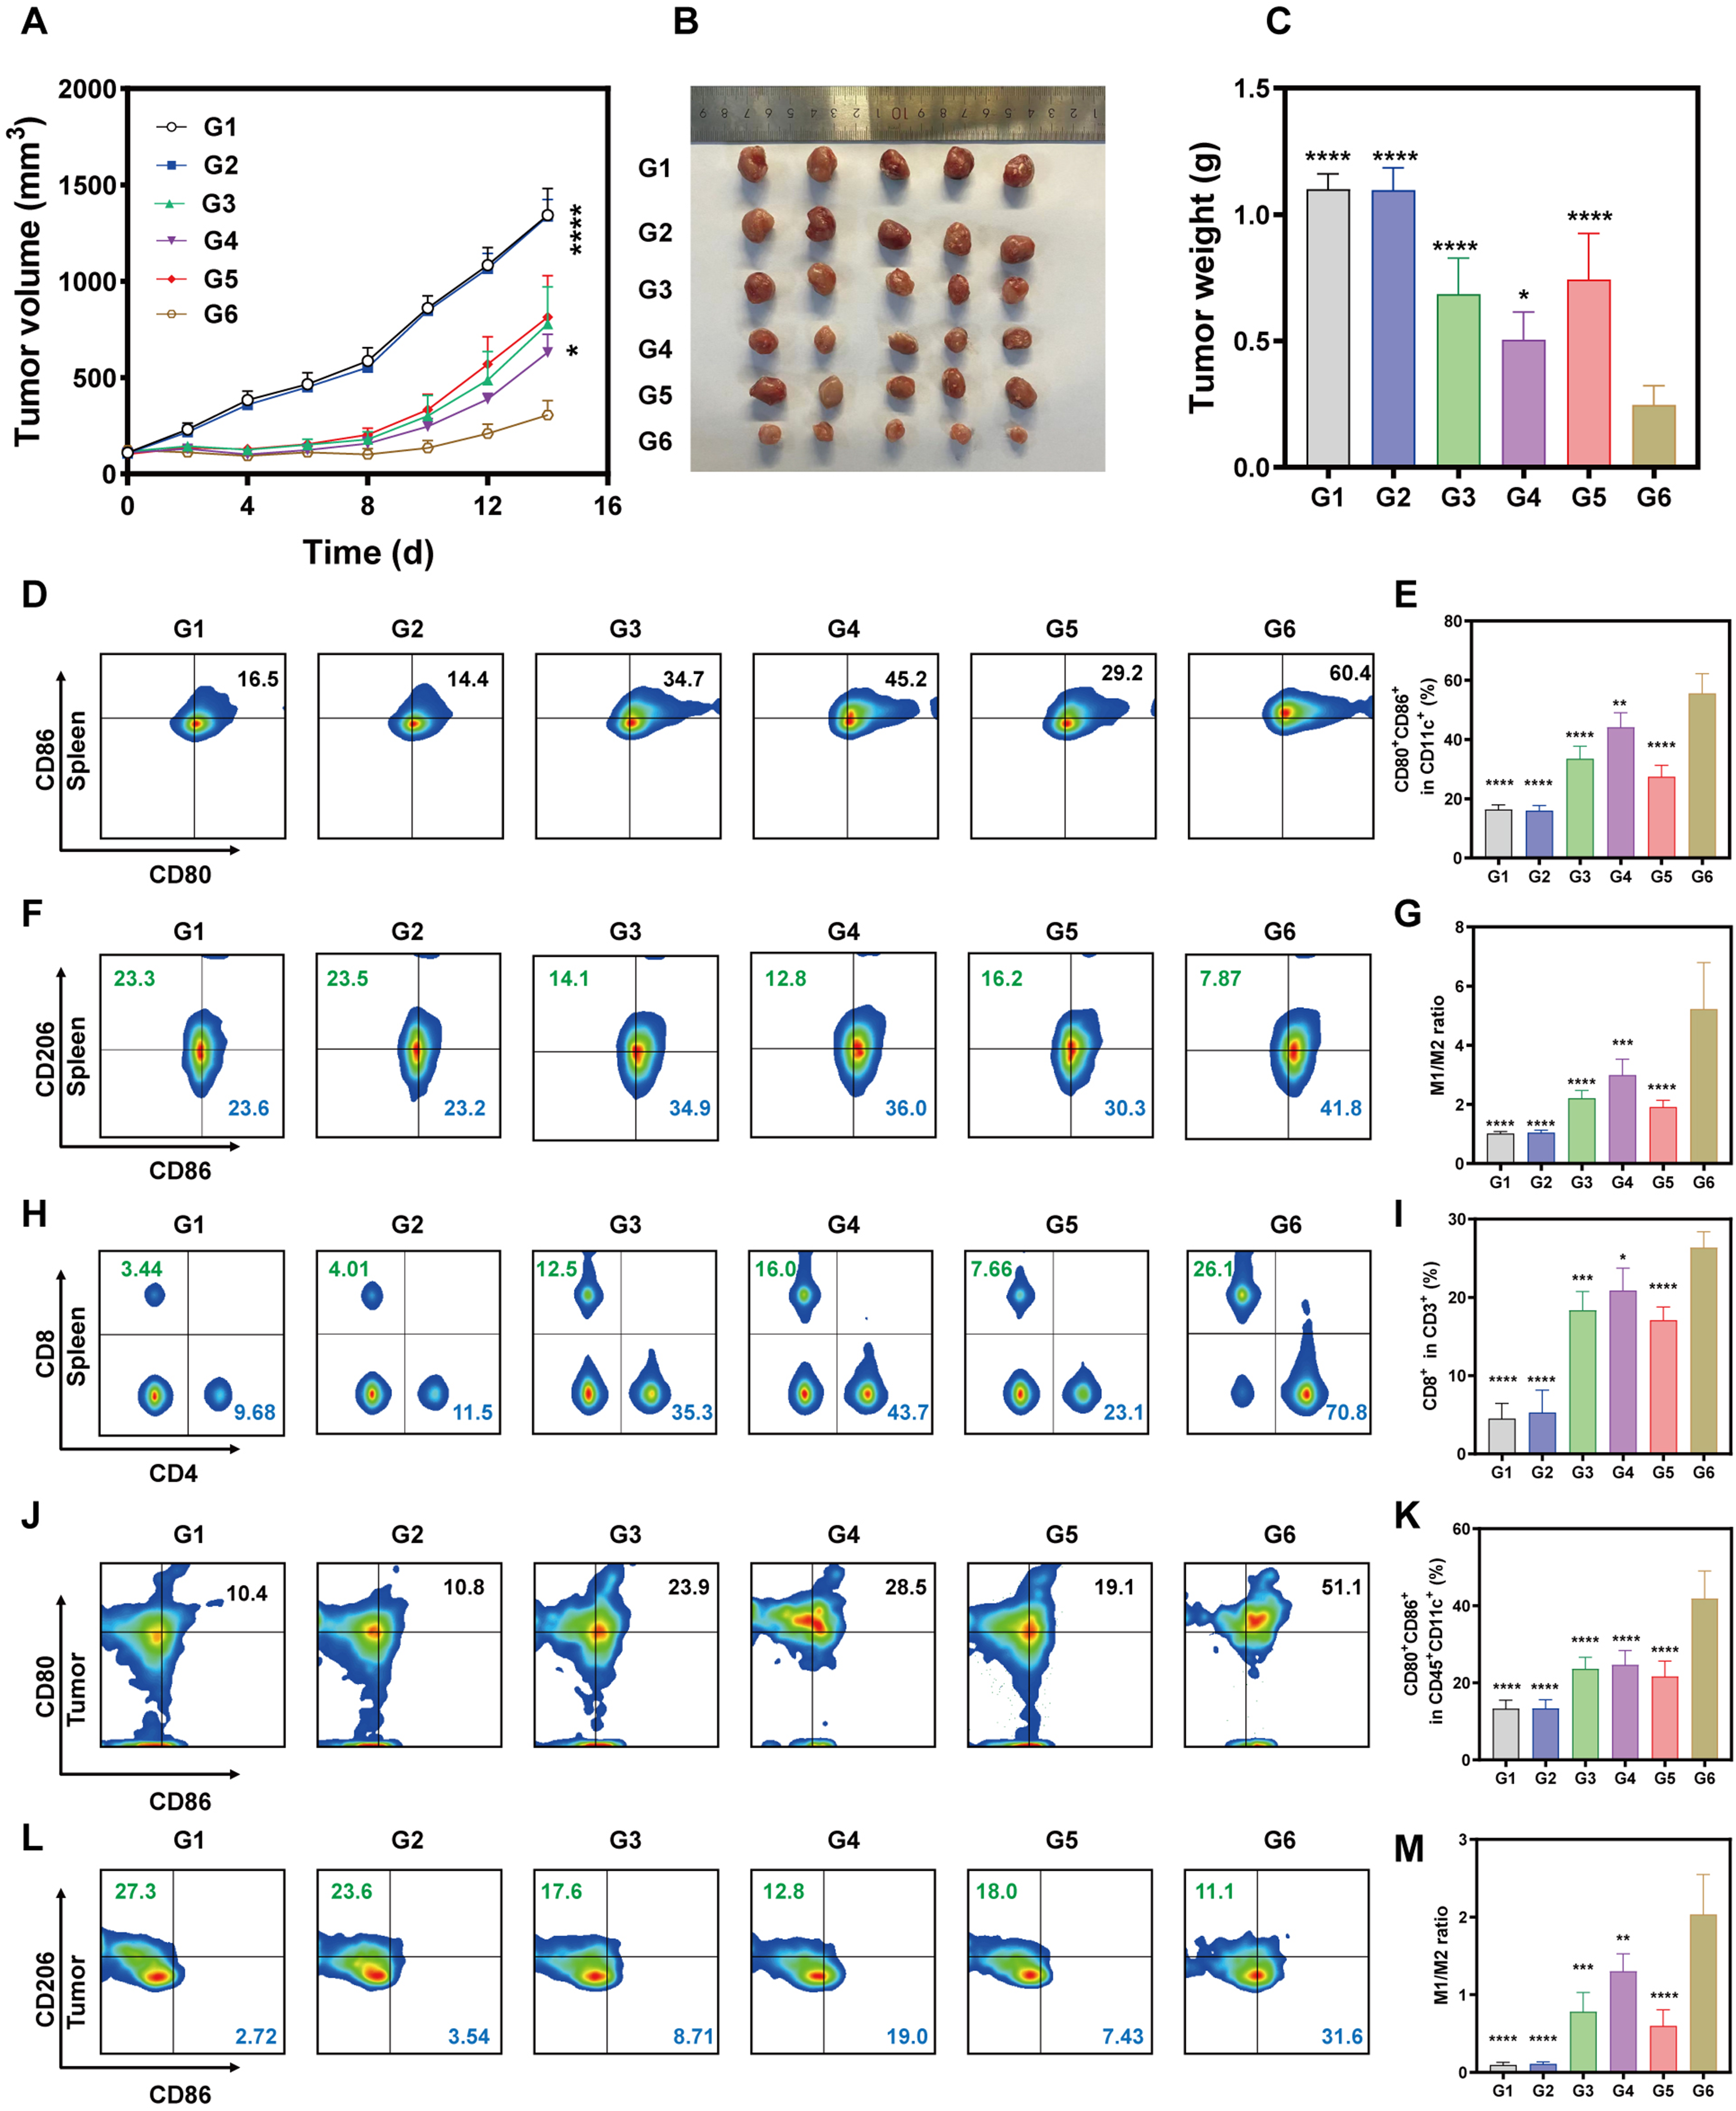
In vivo antitumor efficacy and immune activation elicited by Ce6&SR717-based therapy. (A) Tumor volume curves of 4T1 subcutaneous tumors after different treatments. (B, C) Representative photographs of tumors harvested and statistical analysis of tumor weights at the experimental endpoint. (D, E) Flow cytometric analysis and quantification of matured BMDCs (CD80+/CD86+) in the spleen. (F, G) Flow cytometric profiling and quantitative analysis of CD86 and CD206 expression in the spleen. (H, I) Flow cytometric analysis and quantification of CD4+ and CD8+ T cells in the spleen. (J, K) Flow cytometric analysis and quantification of matured BMDCs (CD80+/CD86+) within tumor tissues. (L, M) Flow cytometric analysis and quantification of M1 and M2 macrophage populations within tumor tissues. Groups: G1: PBS; G2: Ce6; G3:SR717; G4: Ce6&SR717; G5: Ce6 + L; G6: Ce6&SR717 + L.
In Vivo Immune Response
Motivated by the robust antitumor efficacy of the Ce6&SR717 NPs plus laser regimen, we systematically investigated the underlying immune response to uncover the mechanisms driving this therapeutic synergy. To elucidate the in vivo immune dynamics, comprehensive analyses of immune cell profiles in both splenic and tumor tissues from treated mice were conducted, aiming to correlate the observed therapeutic outcomes with immune cell activation and infiltration patterns. Specifically, the spleen, as a primary immune organ, facilitates dendritic cell (DC)-mediated antigen capture, processing, and presentation to initiate T-cell immunity. At experimental endpoints, splenic single-cell suspensions were prepared from treated mice and stained with fluorescence-conjugated antibodies. As shown in Figure 6D‒E, the Ce6&SR717 NPs plus laser group (G6) induced a synergistic enhancement of dendritic cell maturation, evidenced by a 3.1-fold increase in CD80+/CD86+ DC proportions over the PBS control (G1). Notably, the maturation level in G6 was significantly higher than all other groups, showing nearly two-fold greater activation than the SR717 (G3), Ce6&SR717 (G4), or Ce6 with laser (G5) monotherapies. These findings establish that the Ce6&SR717 NPs plus laser (G6) regimen delivers optimal efficacy by concurrently activating the STING pathway (via SR717) and inducing Ce6-mediated PDT. Macrophages play dual roles in tumor immunity: M1-polarized macrophages exert potent antitumor activity, whereas M2 macrophages foster immunosuppression. Flow cytometric analysis revealed that the Ce6&SR717 NPs with laser group (G6) exhibited a 5.1-fold higher M1/M2 ratio compared to the PBS control (G1), and significantly enhanced macrophage polarization relative to other experimental groups, with 2.4-fold, 1.7-fold, and 3.7-fold increases over SR717 (G3), Ce6&SR717 (G4), and Ce6 with laser (G5), respectively (Figure 6F‒G and Figure S10 in the supplementary materials). These data suggest that Ce6&SR717 nanoparticles effectively reprogram the immunosuppressive microenvironment toward an immunostimulatory phenotype.
Given the critical role of mature DCs and M1 macrophages in activating adaptive immunity, we then quantified CD4+ and CD8+ T-cell populations. Ce6&SR717 NPs combined with laser irradiation increased tumor-infiltrating CD4+ and CD8+ T-cell counts by 1.3 to 1.6-fold relative to SR717, Ce6&SR717 NPs alone, and Ce6 with laser irradiation alone (Figure 6H‒1 and Figure S11 in the supplementary materials), confirming enhanced T-cell priming. Parallel analyses of tumor-infiltrating immune cells corroborated these findings. Flow cytometry analysis demonstrated that Ce6&SR717 NPs with laser treatment robustly elevated tumor-infiltrating CD80+CD86+ dendritic cell (DC) proportions within CD45+CD11c+ cells by 3.1-fold, 1.8-fold, and 1.9-fold compared to PBS control, SR717 alone, and Ce6 with laser irradiation, respectively. Concurrently, the M1/M2 macrophage ratio surged by 21.3-fold, 2.6-fold, and 3.4-fold versus PBS, SR717, and Ce6 + L group (Figure 6J‒M). Moreover, immunofluorescence staining (Figure S12 in the supplementary materials) revealed that tumors from the combined therapy group (G6) exhibited dense and spatially diffuse CD8+ T cell clusters at 14 days post-treatment. It was also evident that CD8+ T cell infiltration in tumor tissues was most markedly enhanced by the Ce6&SR717 NPs with laser irradiation. Ce6&SR717 with laser combination therapy synergistically enhanced dendritic cell maturation, M1 macrophage polarization, and CD8+ T cell infiltration through integrated STING pathway activation and photodynamic effects, effectively reprogramming the immunosuppressive tumor microenvironment into an immunostimulatory phenotype.
Antitumor Efficacy Against Primary and Distant Tumors
Building on the established capacity of Ce6&SR717 NPs with laser to reprogram the tumor microenvironment, we next evaluated whether this therapeutic synergy could be extended to systemic antitumor immunity. To delineate the systemic immune-mediated antitumor effects from direct photodynamic cytotoxicity, a bilateral 4T1 tumor-bearing model was established in BALB/c mice. Tumor cells were subcutaneously inoculated into the right inguinal region to establish primary lesions, followed by contralateral implantation of distant tumors 5 days later to create spatially segregated lesions, thereby excluding potential local diffusion artifacts (Figure 7A). Following the completion of the bilateral model, mice (n = 5/group) received intravenous administration of therapeutic agents on days 0, 3, and 6, according to prior protocols. Mice in laser groups (G5‒6) then received localized 660 nm irradiation (0.5 W/cm2, 5 min), selectively applied to primary tumors at 2 h post-injection. Over the 14-day observation period, an integrated analysis of primary and distal tumor volume and weight confirmed that the combination of Ce6&SR717 NPs with laser irradiation (G6) exerted the most potent antitumor efficacy (Figure 7B‒G), achieving primary tumor volume and weight inhibition rates of 73.6% and 71.9% respectively compared to the PBS control group (G1), while distal tumor volume and weight inhibition rates reached 78.1% and 75.3%. In contrast, the other treatment groups (G3-G5) induced only modest levels of tumor suppression. Strikingly, the primary and distal tumor weights in G6 were reduced to only 57.1% and 38.7%, respectively, of those in the next most effective group (G4, Ce6&SR717 NPs), robustly supporting the conclusion that the Ce6&SR717 NPs with laser irradiation effectively suppress primary tumors and potently inhibit distal tumor growth. Furthermore, body weights of mice in all experimental groups showed no significant changes throughout the study, indicating the good safety profile (Figure S13 in the supplementary materials). H&E staining revealed varying degrees of necrosis in the bilateral tumors from groups G3 to G6, with the most severe necrosis observed in group G6 (Ce6&SR717 NPs with laser). TUNEL assays quantified apoptosis induction, displaying a significant increase in nucleic acid fragmentation, which strongly correlated with CD8+ T-cell infiltration density (Figure 7H and Figure S14 in the supplementary materials). Ki-67 immunohistochemistry demonstrated near-abrogation of proliferative activity in the Ce6&SR717 with laser group, indicative of dual mechanisms targeting both tumor proliferation and apoptosis. These findings collectively demonstrate that the PDT-STING synergistic strategy remodels the immunosuppressive tumor microenvironment through cytotoxic T-cell recruitment, thereby eliciting abscopal effects against non-irradiated lesions. The spatiotemporal resolution of therapeutic responses underscores the translational potential of this combinatorial approach for managing distant malignancies.

(A) Schematic illustration of primary and distant tumor establishment and therapeutic regimen. (B–G) Growth profiles, terminal ex vivo tumor photographs, and weight quantification of primary (B–C) and distant tumors (E–G) after different treatments at an equivalent SR-717 dose of 10 mg/kg; mean ± SD, n = 5. (H) H&E, TUNEL, Ki67 and CD8 immunofluorescence staining images of distant tumors harvested 14 d post-intravenous injection across treatment groups. Sale bars: 200 μm. Groups: G1: PBS; G2: Ce6; G3:SR717; G4: Ce6&SR717; G5: Ce6 + L; G6: Ce6&SR717 + L.
Quantitative Proteomics Reveals the Antitumor Effects
High-throughput quantitative proteomic analysis was performed using the tumor tissues collected from Ce6&SR717 NPs with laser irradiation (G6) and PBS (G1) groups to further understand the antitumor effects (Figure 6B‒C). In total, 9038 proteins were quantified from two groups of tumor tissues in our dataset acquired by nanoLC-MS/MS system. By principal component analysis (PCA), these two groups of proteomics datasets were separated clearly (Figure 8A), which shows the significantly differential landscape of proteins expressed in tumor tissue during the Ce6&SR717 NPs with laser irradiation therapeutic strategy. Totally, we found that 402 differentially expressed proteins (DEPs) between the above two groups (fold-change (FC) > 1.5, p < .05) (Figure 8B), including 309 upregulated and 93 downregulated species in Ce6&SR717 NPs with laser irradiation group compared to PBS group. Clustering the DEPs showed similar expression levels among biological replicates in each group and distinctive levels between Ce6&SR717 NPs with laser irradiation and PBS groups, demonstrating Ce6&SR717 NPs with laser irradiation changed the protein expression (Figure 8C).
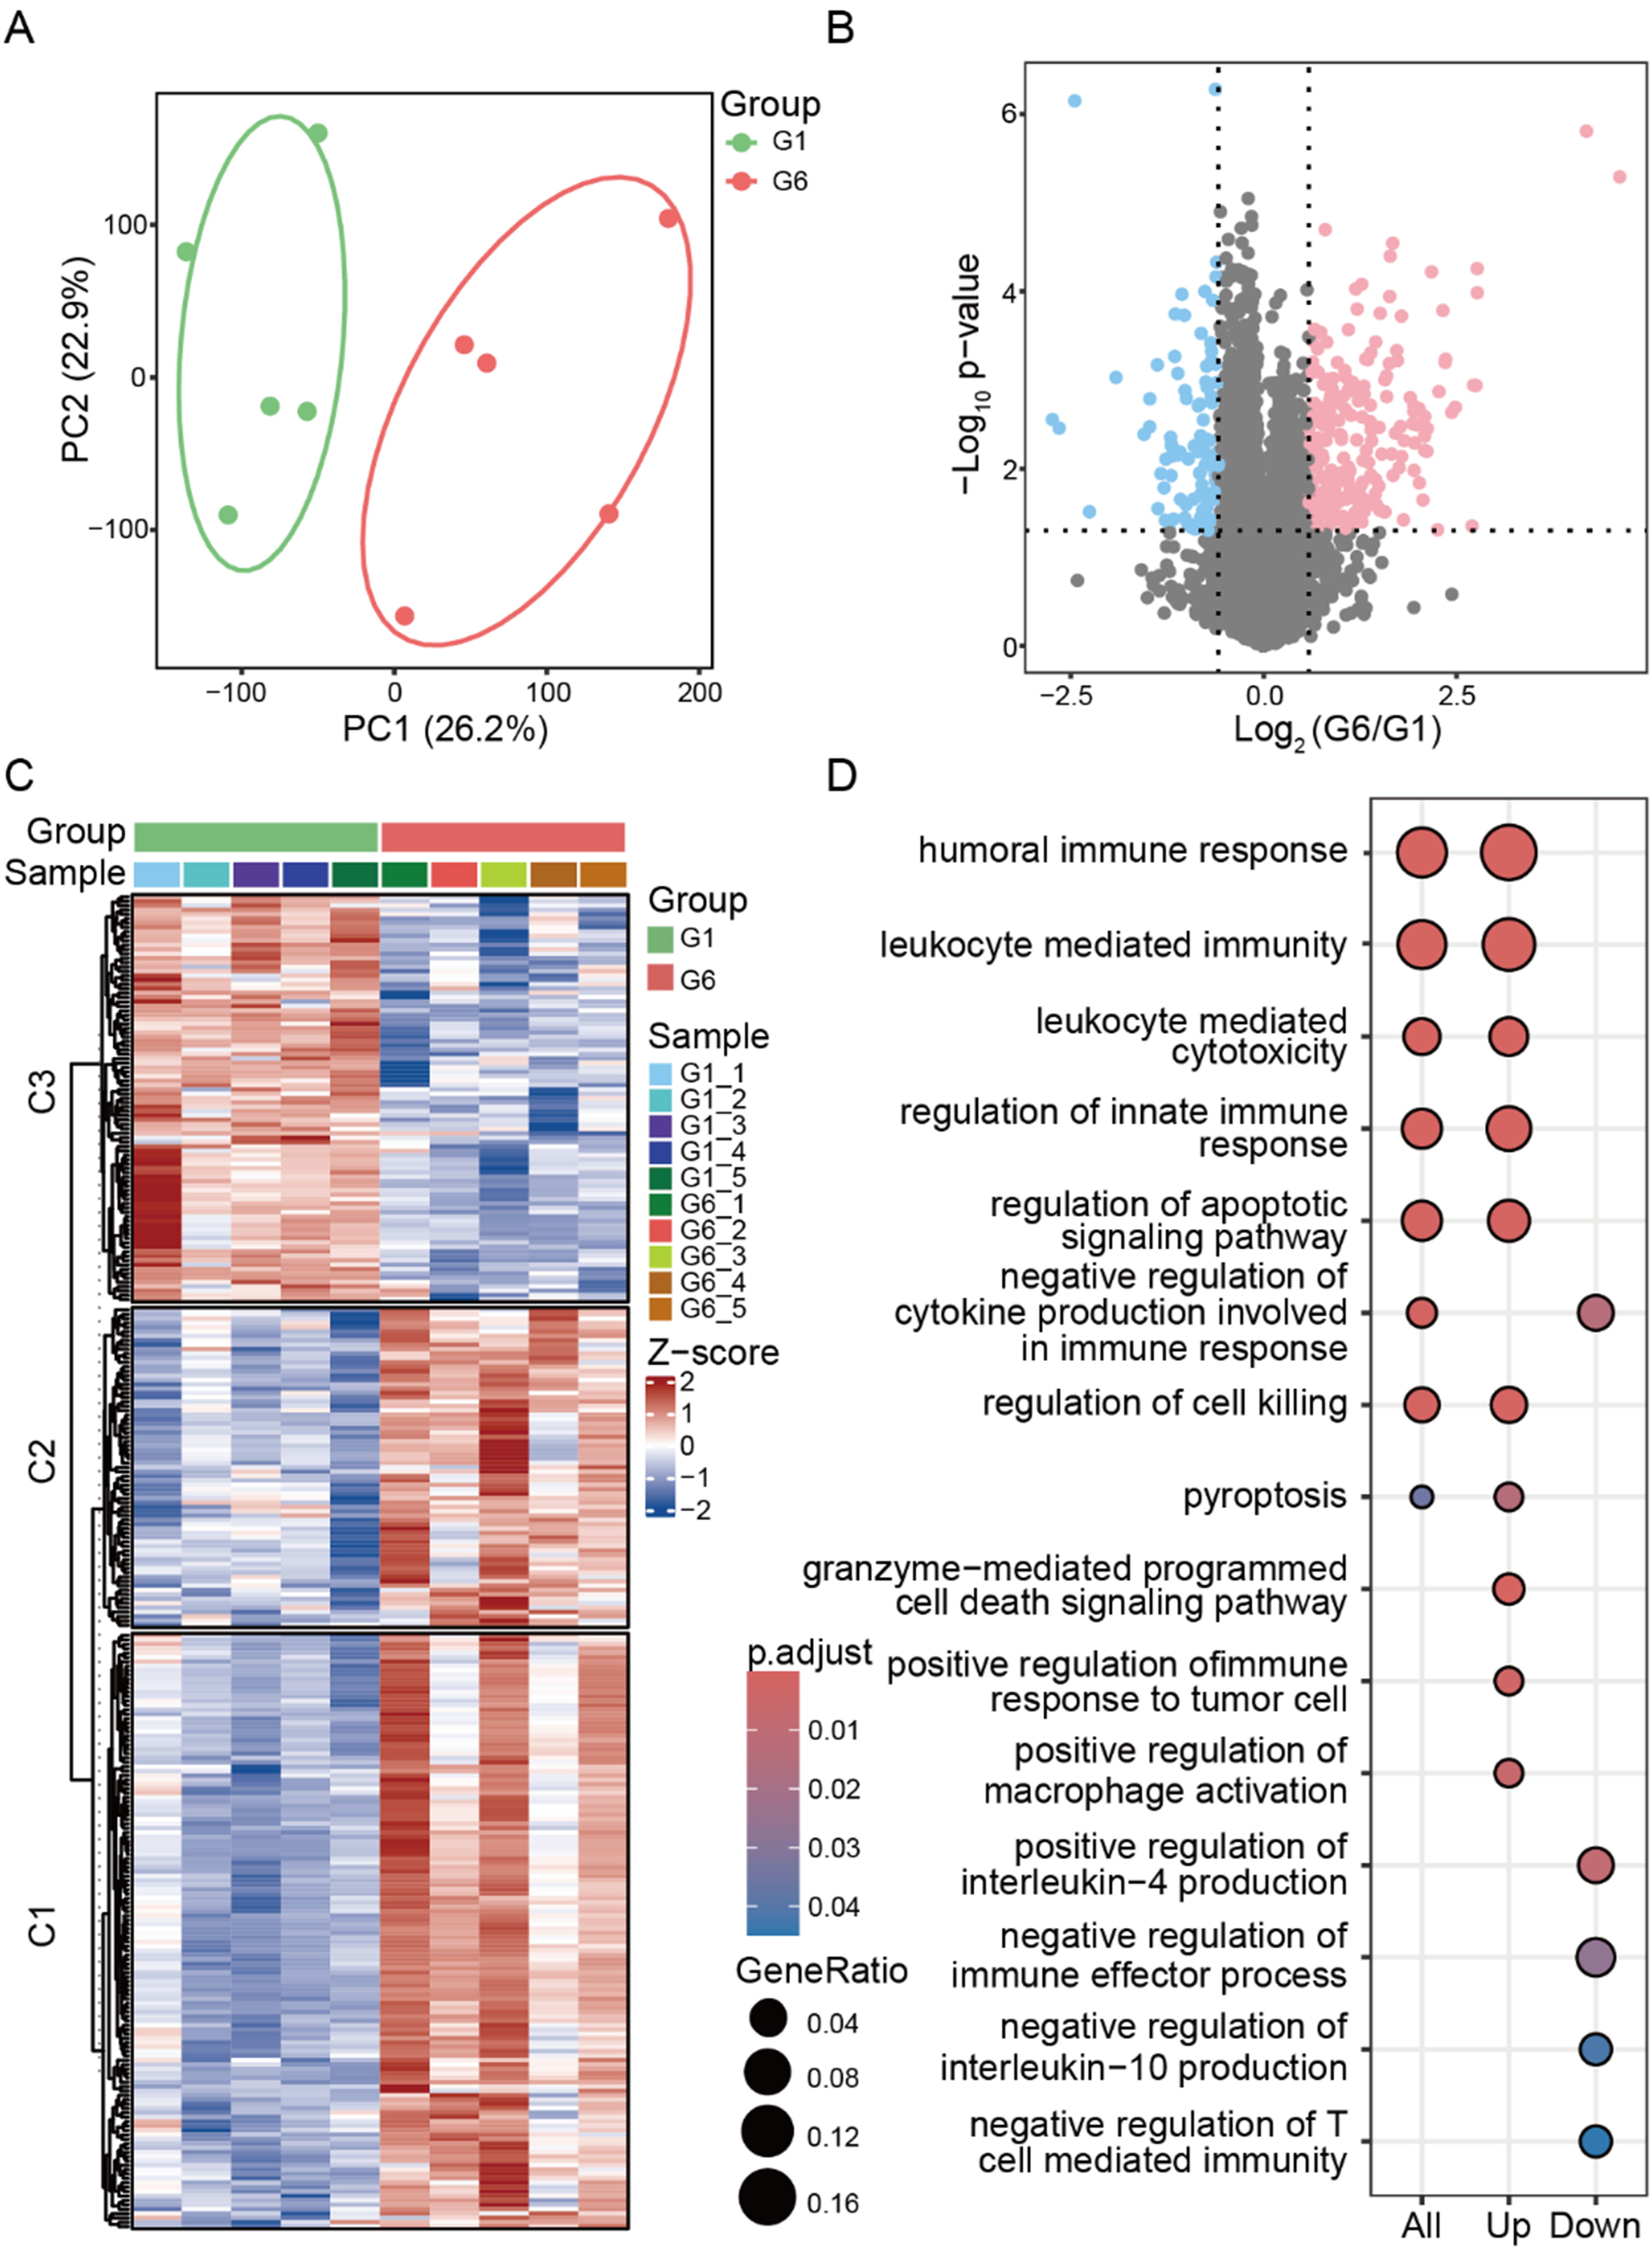
Comparative proteomic analysis between Ce6&SR717 NPs with laser irradiation (G6) and PBS (G1) groups. (A) The principal component analysis (PCA) of Ce6&SR717 NPs with laser irradiation and PBS groups. (B) The volcano plot of DEPs between Ce6&SR717 NPs with laser irradiation and PBS groups (FC > 1.5, p < .05). (C) Clustered heatmap of DEPs between Ce6&SR717 NPs with laser irradiation and PBS groups. (D) GO enrichment analysis of DEPs in biological process.
GO enrichment analysis of the DEPs in the term of biological process revealed several pathways that are closely related to systemic immune response and the cell death (Figure 8D). Focusing on the upregulated pathways, systemic immune response, mainly including humoral immune response, 42 leukocyte mediated immunity, and regulation of innate immune response, 43 were enriched in the group from Ce6&SR717 NPs with laser irradiation, which demonstrated the controllable effects of immuno-photodynamic combination therapies and resisted the development of tumors. Additionally, upregulated cell death was also found, such as granzyme-mediated programmed cell death signaling pathway, regulation of apoptotic signaling pathway and pyroptosis. 44 It showed Ce6&SR717 NPs with laser irradiation would promote the death of tumor cells. Endogenous interleukin-4 (IL-4) has been demonstrated to promote tumor growth previously, 45 while the downregulation of positive regulation of IL-4 production was found in Ce6&SR717 NPs with laser irradiation group, potentially inhibiting tumor growth. In addition, the downregulated negative regulation of interleukin-10 (IL-10) production might contribute the high level of IL-10. However, to clarify this effect of the pathway, further investigation should be required due to its diverse regulatory roles in immune responses.46,47 Thus, the comparative proteomics showed Ce6&SR717 NPs with laser irradiation mainly promoted systemic immune response to inhibit the tumor development.
Conclusions
In summary, this study establishes a carrier-free Ce6&SR717 nanoplatform through molecular co-assembly, which synchronizes photodynamic immunotherapy with STING-mediated innate immune activation. This strategy effectively overcomes the limitations of conventional monotherapies and carrier-dependent systems, and mitigates the systemic toxicity of STING agonists by enabling precise spatiotemporal control. The nanoplatform achieves ultrahigh drug loading and tumor-localized activation, synchronously inducing immunogenic cell death via PDT and activating the STING pathway. This dual activation initiates a self-reinforcing cycle that reprograms the immunosuppressive tumor microenvironment, enhancing dendritic cell maturation, macrophage M1 polarization, and CD8+ T-cell infiltration. As a result, the combination effectively converts “cold” tumors into “hot” phenotypes, demonstrating potent suppression of both primary and distal tumor growth. This work provides a clinically translatable and scalable strategy for combinatorial photo-immunotherapy, highlighting the synergy between localized PDT and STING activation in promoting systemic antitumor immunity.
Supplemental Material
sj-docx-1-mix-10.1177_15353508261464127 - Supplemental material for Carrier-Free Ce6&SR717 Nanomedicine Enables Abscopal Photoimmunotherapy via cGAS-STING Activation in Breast Cancer
Supplemental material, sj-docx-1-mix-10.1177_15353508261464127 for Carrier-Free Ce6&SR717 Nanomedicine Enables Abscopal Photoimmunotherapy via cGAS-STING Activation in Breast Cancer by Xin Peng, MS, Yi Sun, MS, Yudong Guan, PhD, Tong Su, MS, Xu Yang, MS, Yanqiu Zhang, MS, Youzhi Qi, MS, Xiaoli Mai, MD, Xuzhi Shi, MS, Yongkang Dai, PhD, Guang Li, MD, Yunmeng Bai, PhD, Pu Zhang, MD and Xiaoyan Xin, MD in Molecular Imaging
Footnotes
Author Contributions
Xin Peng, Yi Sun, and Yudong Guan contributed equally to this work. They designed the study, conducted the experiments, wrote the initial draft of the manuscript. Tong Su : Data curation, Funding acquisition. Yanqiu Zhang, Xu Yang and Youzhi Qi: Methodology, Data curation. Xiaoli Mai and Guang Li: Software, Validation. Xuzhi Shi and Yongkang Dai: Methodology, Data curation. Yunmeng Bai, Pu Zhang, and Xiaoyan Xin: Conceptualization, Funding acquisition. Yunmeng Bai: Review and editing.
Funding
The authors disclosed receipt of the following financial support for the research, authorship, and/or publication of this article: This work was supported by grants from the Affiliated Drum Tower Hospital, Medical School of Nanjing University (3033-LCYJ-PY-36), Key Projects for the Development of New Medical Technologies from the Affiliated Drum Tower Hospital, Medical School of Nanjing University (XJSFZLX303313), State Key Laboratory of Analytical Chemistry for Life Science (5431ZZXM26), National Natural Science Foundation of China (33101189), Special Support Program for High-level Talents of Zhongzhou Laboratory (3034TZ0001), Science and Technology Research Project of Henan Province (353103311189), Science and Technology Innovation Program of Hunan Province (3034RC3333), Hunan Provincial Department of Education Scientific Research Project (34C0185) and Changsha Natural Science Foundation (kq3307014).
Declaration of Conflicting Interests
The authors declared no potential conflicts of interest with respect to the research, authorship, and/or publication of this article.
Data Availability
All data relevant to the study are included in the article or uploaded as supplementary information.
Supplemental Material
Supplemental material for this article is available online.
References
Supplementary Material
Please find the following supplemental material available below.
For Open Access articles published under a Creative Commons License, all supplemental material carries the same license as the article it is associated with.
For non-Open Access articles published, all supplemental material carries a non-exclusive license, and permission requests for re-use of supplemental material or any part of supplemental material shall be sent directly to the copyright owner as specified in the copyright notice associated with the article.