
Abstract
Despite the increased water content in fibrotic livers, numerous studies reported a decrease in apparent diffusion coefficient (ADC) in liver fibrosis. We argue that the ADC decrease in fibrotic livers is due to the “T2 shine-through” of ADC, as the longer T2 in liver fibrosis leads to less signal decay between the low and high b-value images. The metric slow diffusion coefficient (SDC), predominantly measuring Brownian motion of water molecules, was proposed to mitigate the difficulties associated with this “T2 shine-through” of ADC. This study calculated ADC and SDC of 1 rat study with liver fibrosis induced by biliary duct ligation (BDL), and 3 sets of human liver fibrosis data. To tease out the menopausal effect on liver SDC, only the results of men's livers were analyzed for the human datasets. The rat study showed that liver ADC decreased stepwise (in weeks after BDL procedure) following fibrosis induction, and SDC increased stepwise. In human studies, all 3 datasets consistently showed that advanced fibrosis had a liver ADC lower than that of earlier stage fibrosis; advanced fibrosis had a liver SDC higher than that of earlier stage fibrosis.
Patients with advanced liver fibrosis show an abnormal regulation of extracellular fluid volume, resulting in the accumulation of sodium and water retention, ascites, edema, and pleural effusion. Ascites commonly occurs in diseases causing sinusoidal portal hypertension, such as liver cirrhosis (ie, stage 4 liver fibrosis).1,2 Schober et al 3 reported that, compared with control subjects, extracellular water (ECW), total body water (TBW), intracellular water, and plasma volume all increased in patients with cirrhosis. For magnetic resonance imaging (MRI) T2 relaxometry, with a 1.5T scanner, Mesropyan et al 4 reported that, compared with those of healthy controls, cirrhotic livers with portal hypertension had longer T2 (53.72 ± 7.56 ms vs 48.58 ± 8.41 ms) and higher extracellular volume fraction values (45 ± 18.55% vs 26.14 ± 2.31%). Higher liver water extent can also be seen in earlier stages of liver fibrosis. In a human study, Guimaraes et al 5 described that liver T2 value (1.5 T) was: control 65.4 ± 2.9 ms; mild fibrosis (Ishak grades 1 and 2) 66.7 ± 1.9 ms; moderate fibrosis (Ishak grades 3 and 4) 71.6 ± 1.7 ms; and severe fibrosis (Ishak grades 5 and 6) 72.4 ± 1.4 ms. In an animal study where diethylnitrosamine (DEN) was used to include fibrosis in rats, Guimaraes et al 5 described a monotonic increase in T2 (4.7T) between each rat subgroup, with phosphate buffer solution rats 25.2 ± .8 ms, DEN 5-week exposure rats 31.1 ± 1.5 ms, and DEN 8-week exposure rats 49.4 ± .4 ms. Liver fibrosis is associated with elevated relative ECW. Applying bioimpedance analysis for viral hepatitis related liver diseases, Nishikawa et al 6 reported that the median of the ECW/TBW ratio was: .381 in fibrosis stages 0 and 1, .384 in fibrosis stage 3, .389 in Child-Pugh A, and .395 in Child-Pugh B or C. Kishino et al 7 reported that the ECW/TBW ratio was positively correlated with Fibrosis-4 index and aspartate aminotransferase-to-platelet ratio index and negatively correlated with albumin value and prothrombin time.
Despite the increased water content in fibrotic livers and particularly in cirrhotic livers, it is paradoxical that numerous studies reported a decrease in apparent diffusion coefficient (ADC) in liver fibrosis and particularly in liver cirrhosis.8-12 Girometti et al 9 described that liver ADC was significantly lower in cirrhotic livers than in controls (1.11 ± .16 vs 1.54 ± .12 × 10−3 mm2/s). In the study reported by Kahraman et al, 10 patients with chronic liver disease were classified as group 1, group 2, and group 3 according to the absence of ascites, the presence of minimal ascites, and the presence of massive ascites, respectively. In the control group, liver ADC value was 1.04 ± .11 × 10−3 mm2/s. In patients with chronic liver disease, liver ADC was .90 ± .10 × 10−3 mm2/s for Group 1, .87 ± .09 × 10−3 mm2/s for Group 2, and .79 ± .09 × 10−3 mm2/s for Group 3. Subbiah et al 11 also reported that the model for end-stage liver disease (MELD) score was negatively correlated with liver ADC.
Recently, the “T2 shine-through” effect of ADC has been described (also see the discussion section).13-16 The application of diffusion gradients leads to the tissue demonstrating shorter “apparent” (or “measured”) T2 relative to the T2 measured when b = 0 s/mm2. In a study of breast cancer tissues (3.0 T), Egnell et al 17 reported that the “apparent” T2 value at b = 50 s/mm2 was around 8% lower than at b = 0 s/mm2 (68.7 ms vs 74.5 ms). This phenomenon can be more apparent when the actual T2 of a tissue is short (such as <70 ms), and this can explain many of the puzzling observations. For example, solid cartilage has a high ADC (1.5 × 10⁻³ mm2/s) due to its very short T2 (37 ms, 3.0 T), allowing a fast signal decay between the low b-value image and the high b-value image.14,16 The spleen (with a T2 of around 60 ms at 3.0 T, ADC of only around .8 × 10−3 mm2/s) and parotid gland Warthin’ tumors (with a T2 of around 80 ms at 3.0 T) have low ADCs despite having rich blood perfusion.16,18 This “T2 shine-through” effect of ADC is observed regardless of whether a b = 0 mm2/s image is included for ADC calculation or not.13,14 The new diffusion weighted imaging (DWI) metric, slow diffusion coefficient (SDC), predominantly measuring Brownian motion of water molecules, was proposed to mitigate the difficulties associated with this “T2 shine-through” of ADC. 19 In its basic form, SDC is derived from the subtraction of a high b-value DWI image (eg, b = 400 s/mm2) and a higher b-value DWI (eg, b = 600 s/mm2). It is known that the spleen has a lower ADC than the liver, hepatocellular carcinoma (HCC) has a lower ADC than liver parenchyma, and liver hemangiomas have a lower ADC than simple liver cysts. With SDC analysis, the spleen has a faster diffusion than the liver, HCC has a faster diffusion than liver parenchyma, and liver hemangiomas have a faster diffusion than simple liver cysts. 19 The liver and spleen have a similar amount of blood perfusion; the spleen is more watery than the liver. HCCs are mostly associated with increased blood supply and increased proportion of arterial blood supply, and with edema. It is more reasonable with SDC results that spleen and HCC have a faster diffusion than liver parenchyma. Due to the “flushing” of blood flow inside the hemangioma, it is also more reasonable with SDC results that the diffusion of hemangioma liquid is faster than the more “static” liquid of the cysts.
In this study, we demonstrate that while advanced liver fibrosis is associated with a lower ADC, it is associated with an elevated SDC. The SDC result is consistent with the known pathophysiology that advanced liver fibrosis is associated with higher water content and, more so, with higher ECW content and thus with faster tissue diffusion.
Materials and Methods
This study reutilized 1 previously published animal liver intravoxel incoherent motion (IVIM) study dataset, 20 2 published human liver IVIM study datasets,21,22 and 1 newly acquired human liver IVIM study dataset. All MRI data acquisitions were approved by the local institutional ethical committees, and informed consent was obtained for all the human subjects. The animal experiment was approved by the local animal research committee. In a recent healthy volunteer study, we noted that the SDC measure is highly sensitive to the iron-related susceptibility effect. 23 Healthy women have a higher liver SDC measure than healthy men, and postmenopausal women have a lower liver SDC measure than premenopausal women. Note that men's liver has a higher liver iron level than that of women, and postmenopausal women have a higher liver iron level than that of premenopausal women. On the other hand, men's liver SDC measures remain relatively stable across age groups. 23 Thus, in the current study, only the results of men's livers were analyzed and presented. Due to the lack of sufficient patient numbers for each fibrosis stage, in this study, stages 1 and 2 in human datasets 1 and 2, and liver fibrosis but without MRI visible cirrhosis were termed “early stage” liver fibrosis; stages 3 and 4 in human datasets 1 and 2, and MRI visible cirrhosis were termed “advanced stage” liver fibrosis.
Rat Fibrosis Model Induced by Biliary Duct Ligation (BDL)
The study for this animal data has been described earlier. 20 For the BDL model, Sprague–Dawley rats (weight: 300 ± 20 g) were anesthetized, and an upper abdominal incision was made, and the lower segment of the common bile duct was ligated. Recanalization was performed in rats having BDL for 7 days. Via a laparotomy, the ligated distal end of the common bile duct was dissected, and an anastomosis was established between the common bile duct and the jejunum, which was sectioned 5 cm from the duodenojejunal angle. Magnetic resonance images were acquired with a clinical 3.0 T magnet (Ingenia, Philips Healthcare, Best, Netherlands) using a 4-channel small animal coil. The IVIM type of diffusion scan was based on a single-shot spin-echo type echo-planar sequence, and the parameters were as follows: time of repetition (TR)/time of echo (TE) = 2000/55 ms; field of view (FOV) = 50 × 50 mm, slice thickness = 3 mm, number of slices = 9, matrix = 64 × 63. Spectral presaturation with inversion-recovery (SPIR) technique was used for fat suppression. DWI images with b-values of 0, 800, and 1000 s/mm2 were used in the current study. The number of excitations (NEX) was 3 and 4, respectively, for images of b = 800 and b = 1000, while NEX was 1 for images of b = 0 s/mm2. In addition to 9 control rats, the rat numbers were 5, 6, 5, and 3, respectively, for the timepoints of 1 week, 2 weeks, 3 weeks, and 4 weeks post-BDL surgery. Recanalization was performed in rats having BDL for 7 days. MRI for recanalization rats was performed with 1 week (n = 5) or 2 weeks (n = 6) after the recanalization procedure. Each animal was MRI scanned once. Animals were sacrificed within 4 h after MRI, and liver specimens were taken for the histological assessment of liver fibrosis. 20
Human Viral B Hepatitis-Related Fibrosis Data 1
The human dataset 1 has been described earlier. 21 The IVIM type of diffusion scan was based on a single-shot spin-echo type echo-planar sequence using a 1.5-T magnet (Achieva, Philips Healthcare, Best, Netherlands). The SPIR technique was used for fat suppression. Respiratory-gating was applied. The TR was 1600 ms, and the TE was 63 ms, with 1 TR per respiratory cycle (hereby TR refers to the time from radiofrequency pulse to echo signal acquisition). Other parameters included slice thickness = 7 mm and interslice gap 1 mm, matrix = 124 × 97, FOV = 375 mm × 302 mm, NEX = 2, and number of slices = 6. DWI images with b-values of 0, 400, and 600 s/mm2 were used in the current study. In total, there were 13 healthy volunteers (mean age: 23.85 years, range: 20–31 years), 7 early stage fibrosis patients (mean age: 42.4 years, range: 23–65 years), and 4 advanced fibrosis patients (mean age: 51.5 years, range: 32–60 years).
Human Viral B Hepatitis-Related Fibrosis Data 2
The human dataset 2 was newly acquired for the current study. Using a 1.5-T magnet (uMR, United Imaging Healthcare, Shanghai, China), the IVIM type of diffusion scan was based on a single-shot spin-echo type echo-planar sequence with free breathing. 24 The SPIR technique was used for fat suppression. The TR was 1600 ms and the TE was 65 ms. Other parameters included slice thickness = 7 mm and inter-slice gap 2 mm, matrix = 128 × 99, FOV = 256 mm × 204 mm, and number of slices = 12. DWI images with b-values of 0, 400, and 600 s/mm2 were used in the current study. NEX was 2 for images of b = 400 and b = 600, while NEX was 3 for images of b = 0 s/mm2. In total, there were 11 healthy volunteers (mean age: 37.2 years, range: 22–58 years), 11 early stage fibrosis patients (mean age: 42 years, range: 15–65 years), and 9 advanced fibrosis patients (mean age: 52 years, range: 34–69 years).
Human Viral B Hepatitis-Related Fibrosis Data 3
The human dataset 3 has been described earlier. 22 Liver IVIM imaging was performed with a 3.0-T magnet (Vida Magneton, Siemens Healthineers, Erlangen, Germany). The diffusion imaging was based on a single-shot spin-echo type echo-planar sequence with respiratory gating. The default spectral presaturation technique was used for fat suppression. The TR was 2500 ms and TE was 84 ms. Other parameters included slice thickness = 5 mm and inter-slice gap = 1 mm, matrix = 128 × 128, FOV = 350 mm × 350 mm. DWI images with b-values of 0, 500, and 800 s/mm2 were utilized in this study. NEX was 1 for b = 0 s/mm2 images, and 3 for b = 500, 800 s/mm2 images. For this dataset, the initial study aimed at diffusion MRI separation of focal nodular hyperplasia (FNH) and liver malignant tumors. 22 All patients have surgical histopathology. In the current analysis, the control group (n = 6, mean age: 37.67 years, range: 22–45 years) was FNH patients who did not have a diffuse liver disease background except for the focal lesion; the patient group all had HCC and a viral hepatitis B-related liver fibrosis background. In addition to the standard histology liver fibrosis grading, we further separated HCC patients into 2 groups: MRI-fibrosis group (n = 28, mean age: 51.3 years, range: 40–59 years) and MRI-cirrhosis group (n = 9, mean age: 55.7 years, range: 43–73 years). MRI-cirrhosis patients had MRI visible cirrhosis sign(s) and/or had ascites plus apparent splenomegaly. 25
Data Analysis
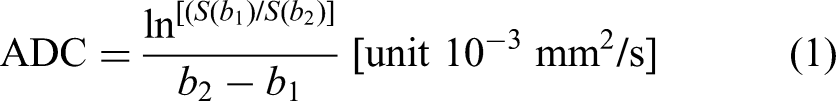
ADC was calculated according to:
SDC was calculated according to:

Image segmentation was performed using ITK-SNAP (http://www.itksnap.org), and data analysis was conducted with MATLAB (MathWorks, Natick, MA, USA). For ADC, free-hand regions of interest (ROIs) were manually placed on a b = 0 s/mm2 image to cover a large portion of liver parenchyma while avoiding large vessels (and avoiding focal lesions and focal lesions' surrounding tissues for dataset 3) and then copied onto the high b-value images of this slice. To account for the potential inter-scan motion, the copied ROIs on the high b-value images were additionally manually adjusted. For SDC, freehand ROIs were initially placed on the high b-value images, then copied onto the higher b-value images of this slice (Figure 1). The ROI drawing was conducted by a trained engineer graduate and checked by a specialist radiologist. For all analyses, the mean of all included slices’ measurements was regarded as the value of the examination, with the last step weighted by the percentage ROI area for each slice (ie, assuming the sum pixel number of all ROIs for each subject being 100%; according to pixel number in each slice's ROI, a percentage was assigned for each slice).
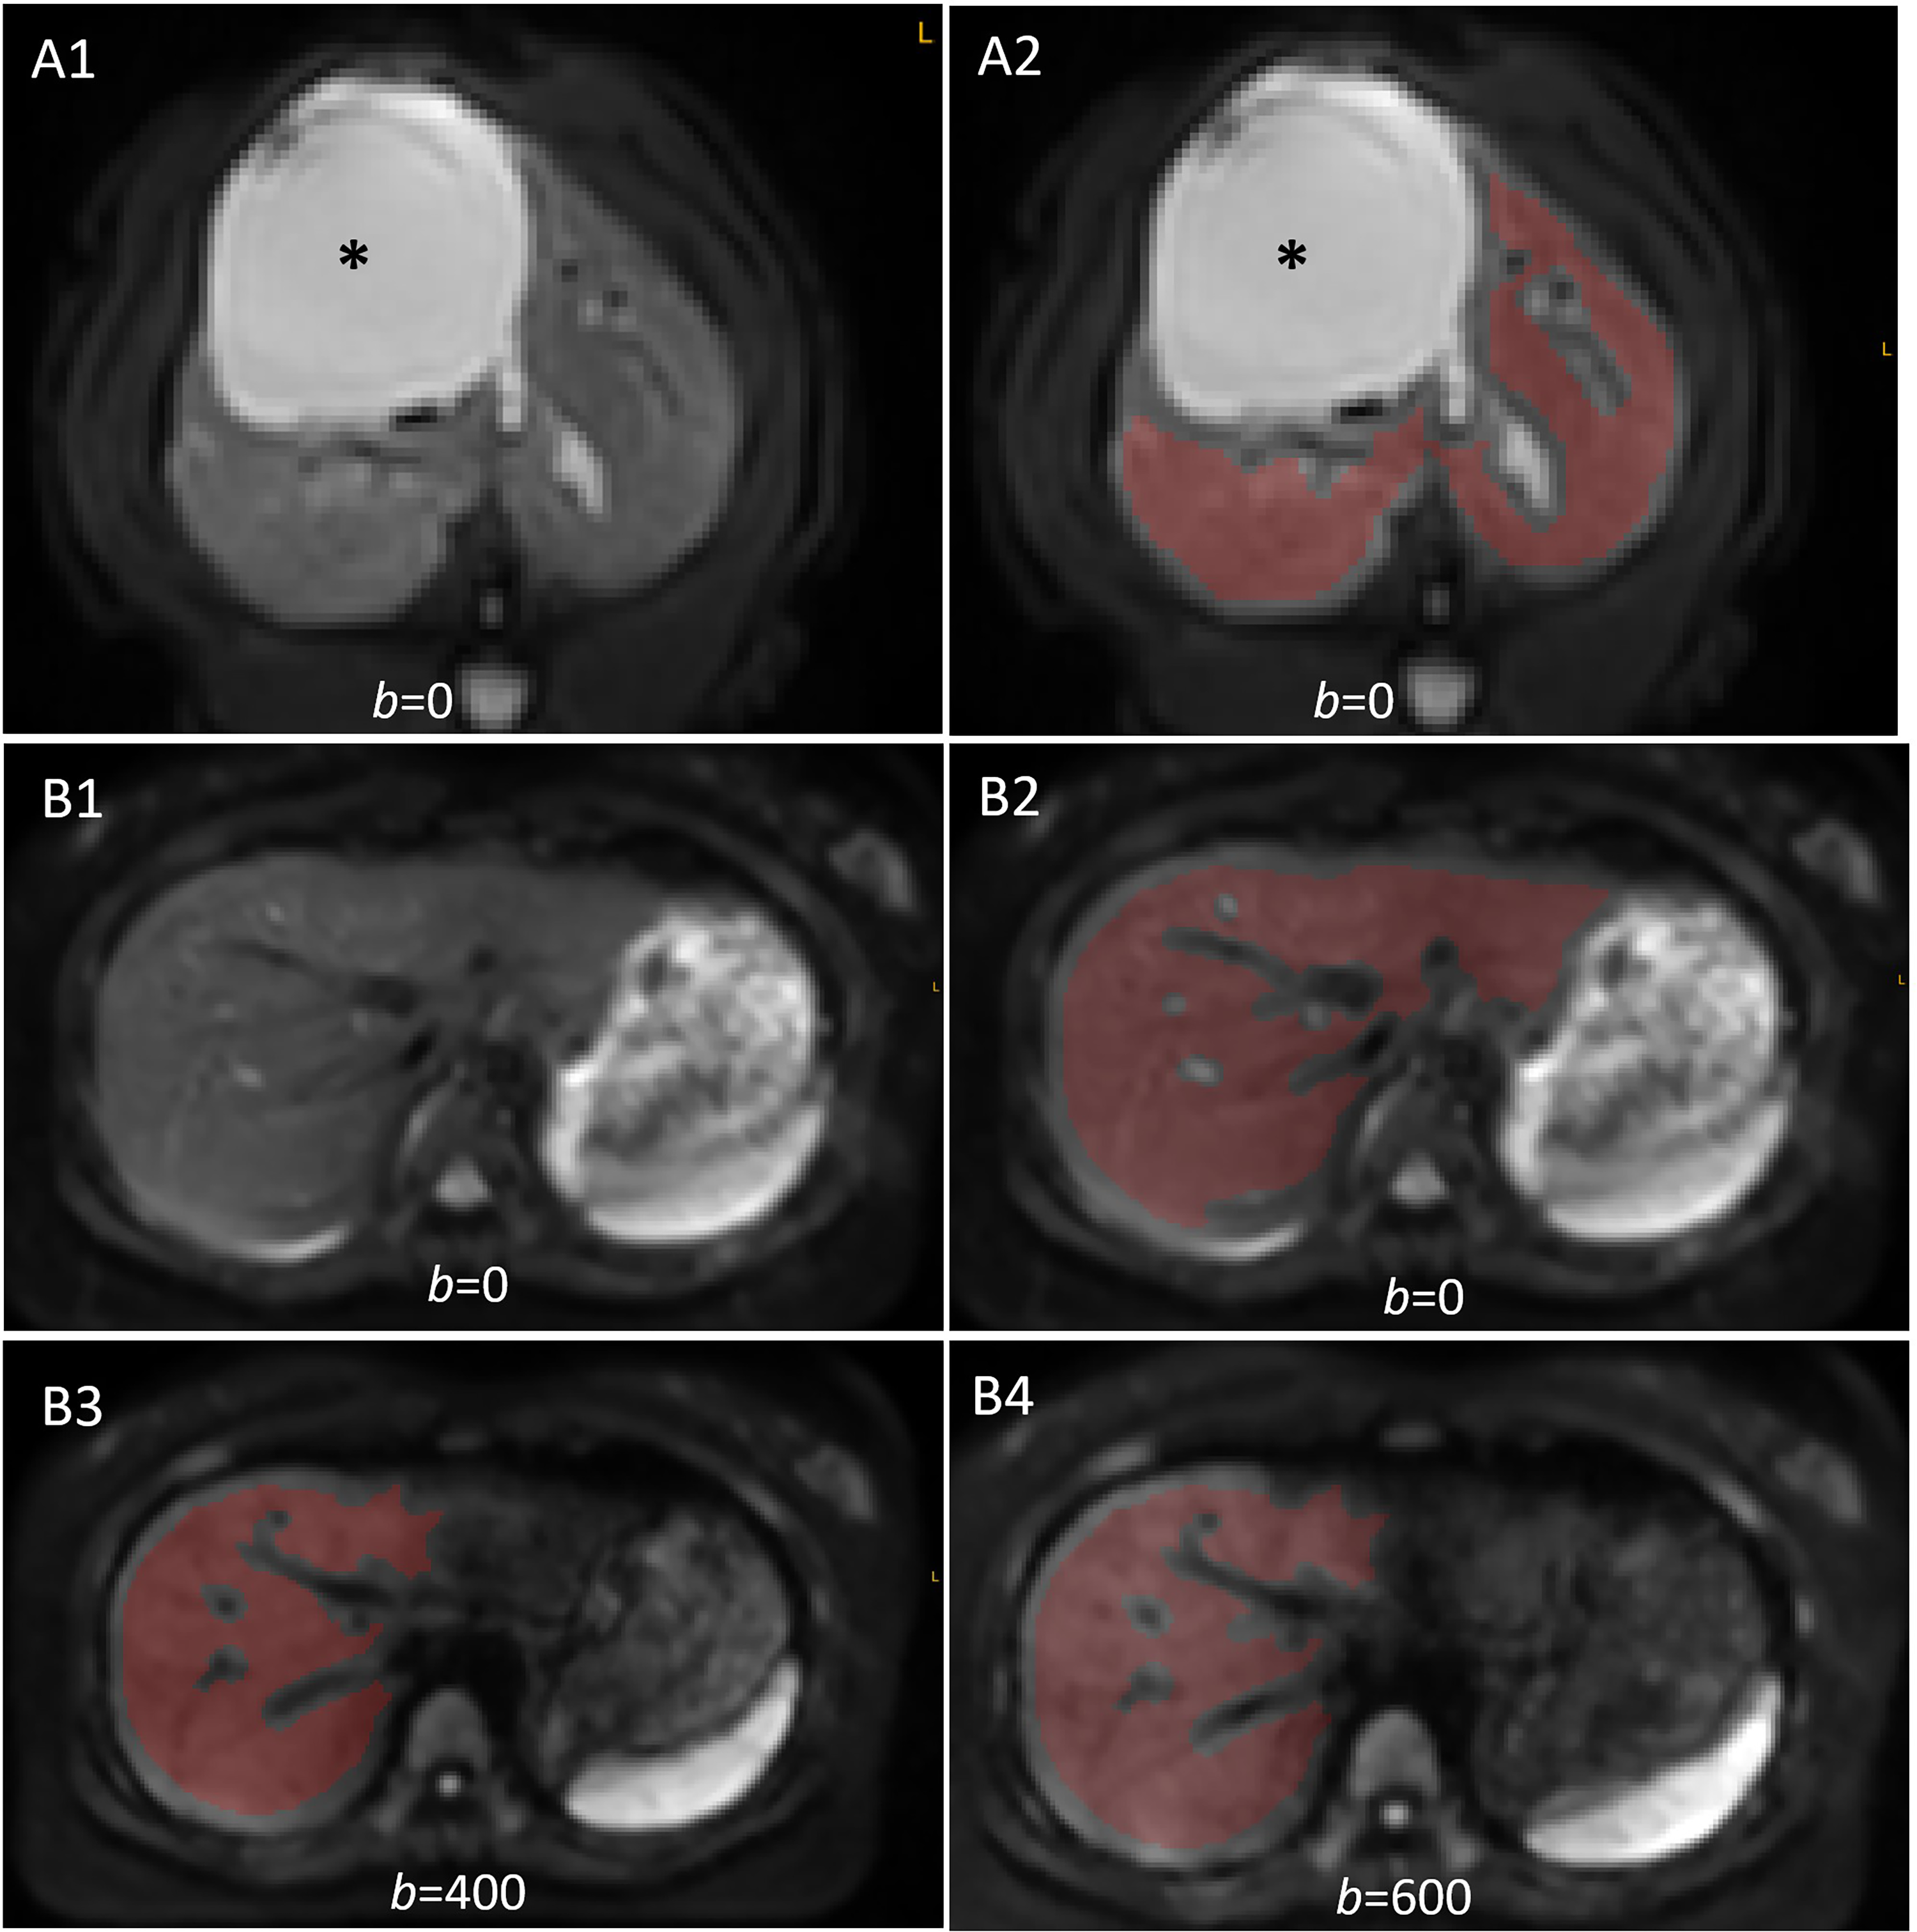
Examples of liver parenchyma manual segmentation. (A) A rat liver DWI with biliary duct dilatation (asterisk, [A1] without ROI and [A2] with ROI). (B) A human subject's liver DWI. (B1 and B2) b = 0 s/mm2 image without ROI and B2 with ROI. (B3 and B4) b = 400 s/mm2 image and b = 600 s/mm2 image, respectively, with ROI.
For statistical analysis, data were processed using GraphPad Prism (San Diego, CA, USA). Comparisons were performed using the Mann–Whitney test or the Kruskal–Wallis test as appropriate. A P-value <.05 was considered statistically significant.
Results
The rat study showed that liver ADC decreased stepwise (measured in weeks after BDL procedure) following fibrosis induction, whereas SDC increased stepwise following fibrosis induction. Following the recanalization, both the liver ADC and the liver SDC returned to the values of the controls (Figure 1 and Table 1).
Rat Liver ADC (Unit: ×10−3 mm2/s) and SDC (Unit: au/s) Changes Following the BDL Procedure and Recanalization Procedure.
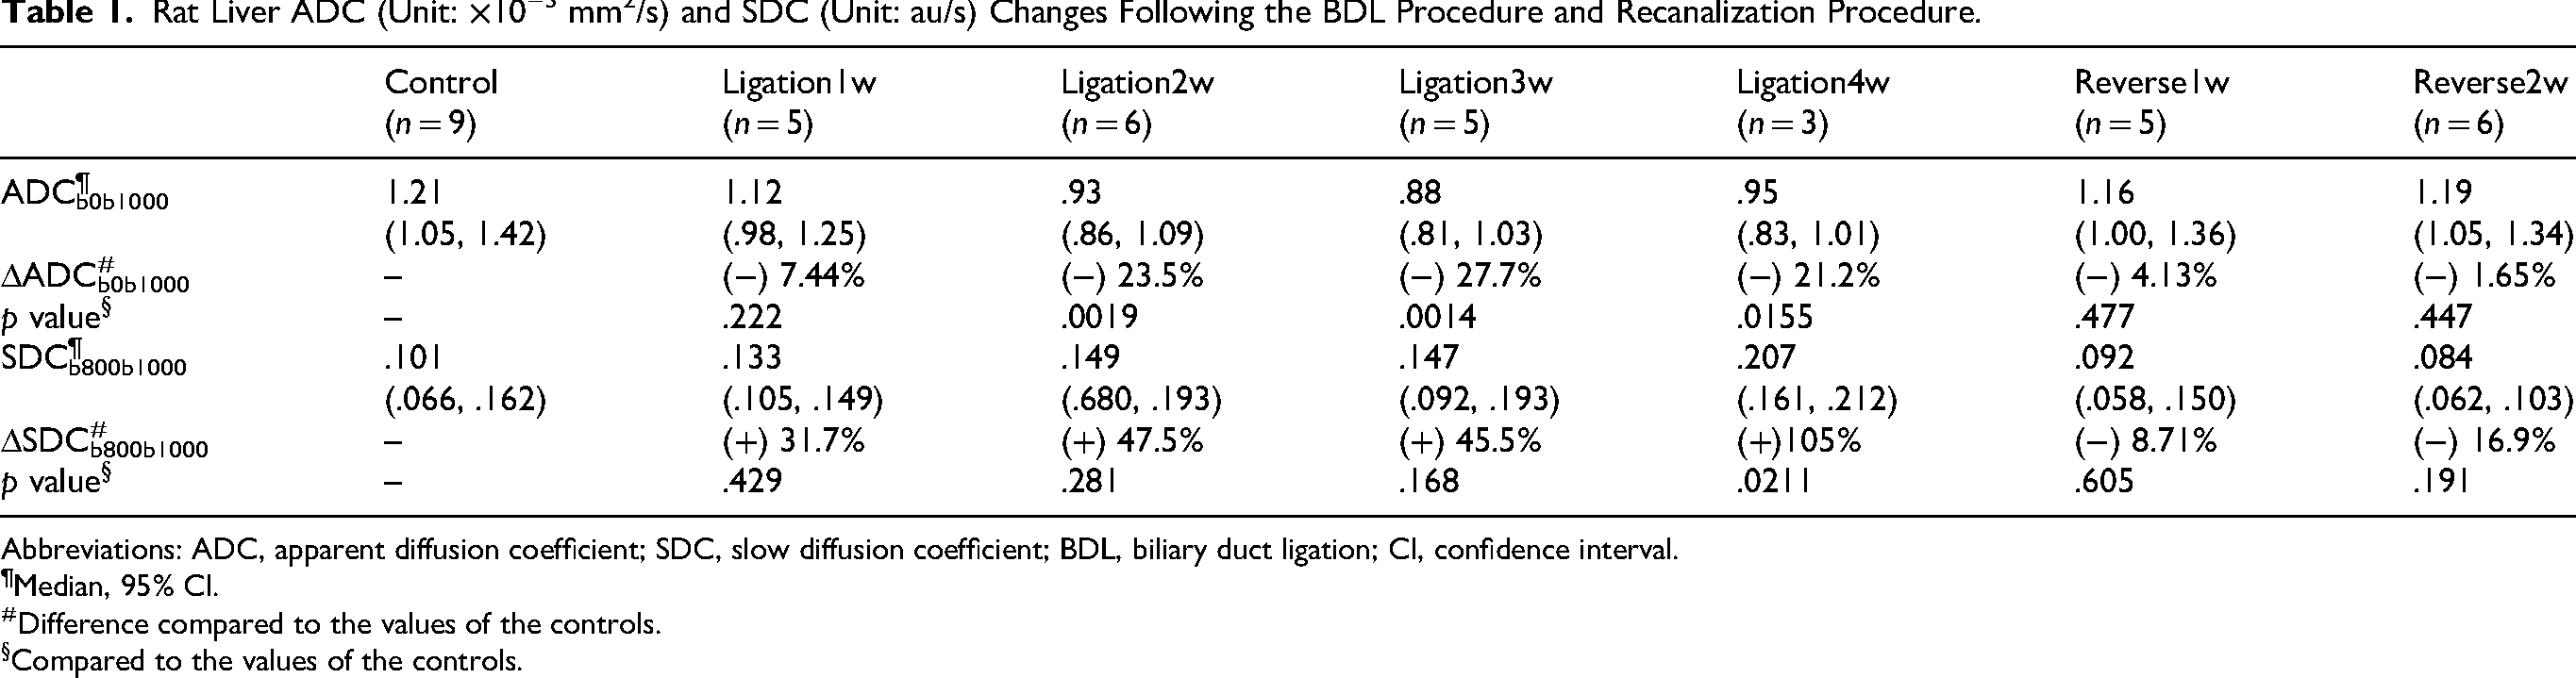
Abbreviations: ADC, apparent diffusion coefficient; SDC, slow diffusion coefficient; BDL, biliary duct ligation; CI, confidence interval.
Median, 95% CI.
Difference compared to the values of the controls.
Compared to the values of the controls.
In human datasets 1 and 2, advanced liver fibrosis had an ADC lower than that of early stage liver fibrosis; on the other hand, advanced liver fibrosis had an SDC higher than that of early stage liver fibrosis (Figures 2 and 3 and Table 2). In human dataset 3, liver MRI-cirrhosis had an ADC comparable to that of liver MRI-fibrosis, whereas MRI-cirrhosis had an SDC higher than that of liver MRI-fibrosis (Figure 4 and Table 2).
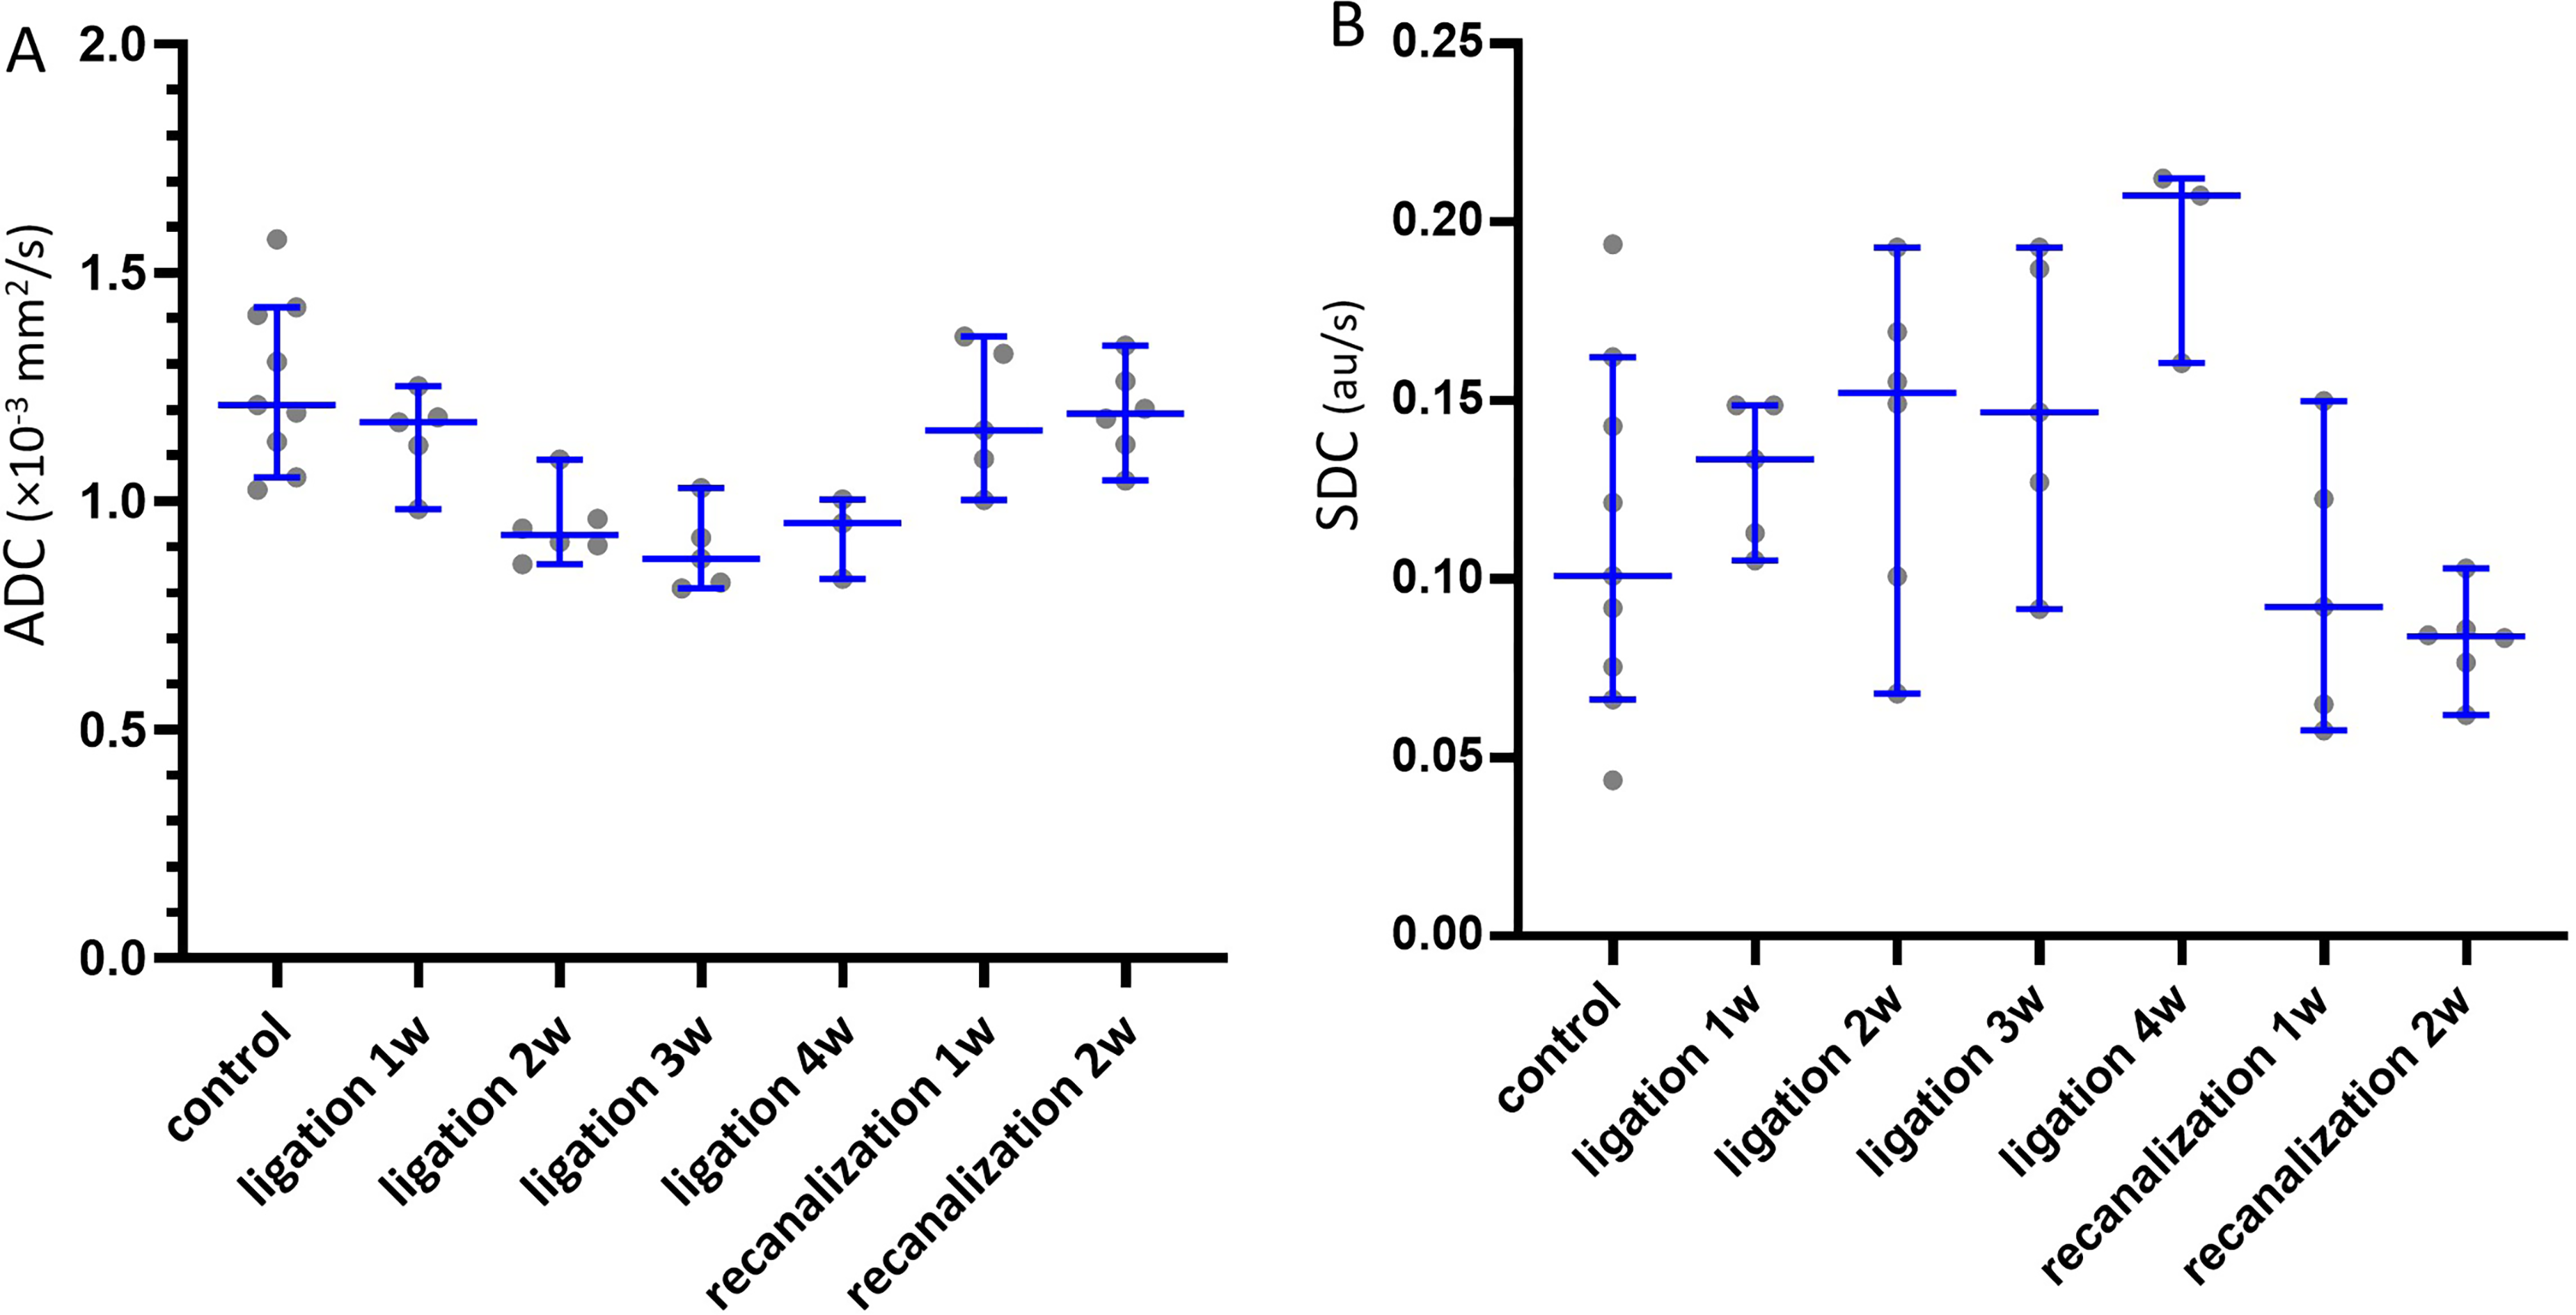
ADCb0b1000 and SDCb800b1000 changes following the BDL procedure and following the recanalization procedure. Liver ADC decreased stepwise (in weeks after BDL procedure) following fibrosis induction, and SDC increased stepwise following the BDL procedure. Following the recanalization, both the liver ADC and the liver SDC returned to normal values. Data are presented with a scatter plot (each dot represents the measure of 1 rat), median, and 95% confidence interval. ADC unit: ×10−3 mm2/s; SDC unit: au/s.
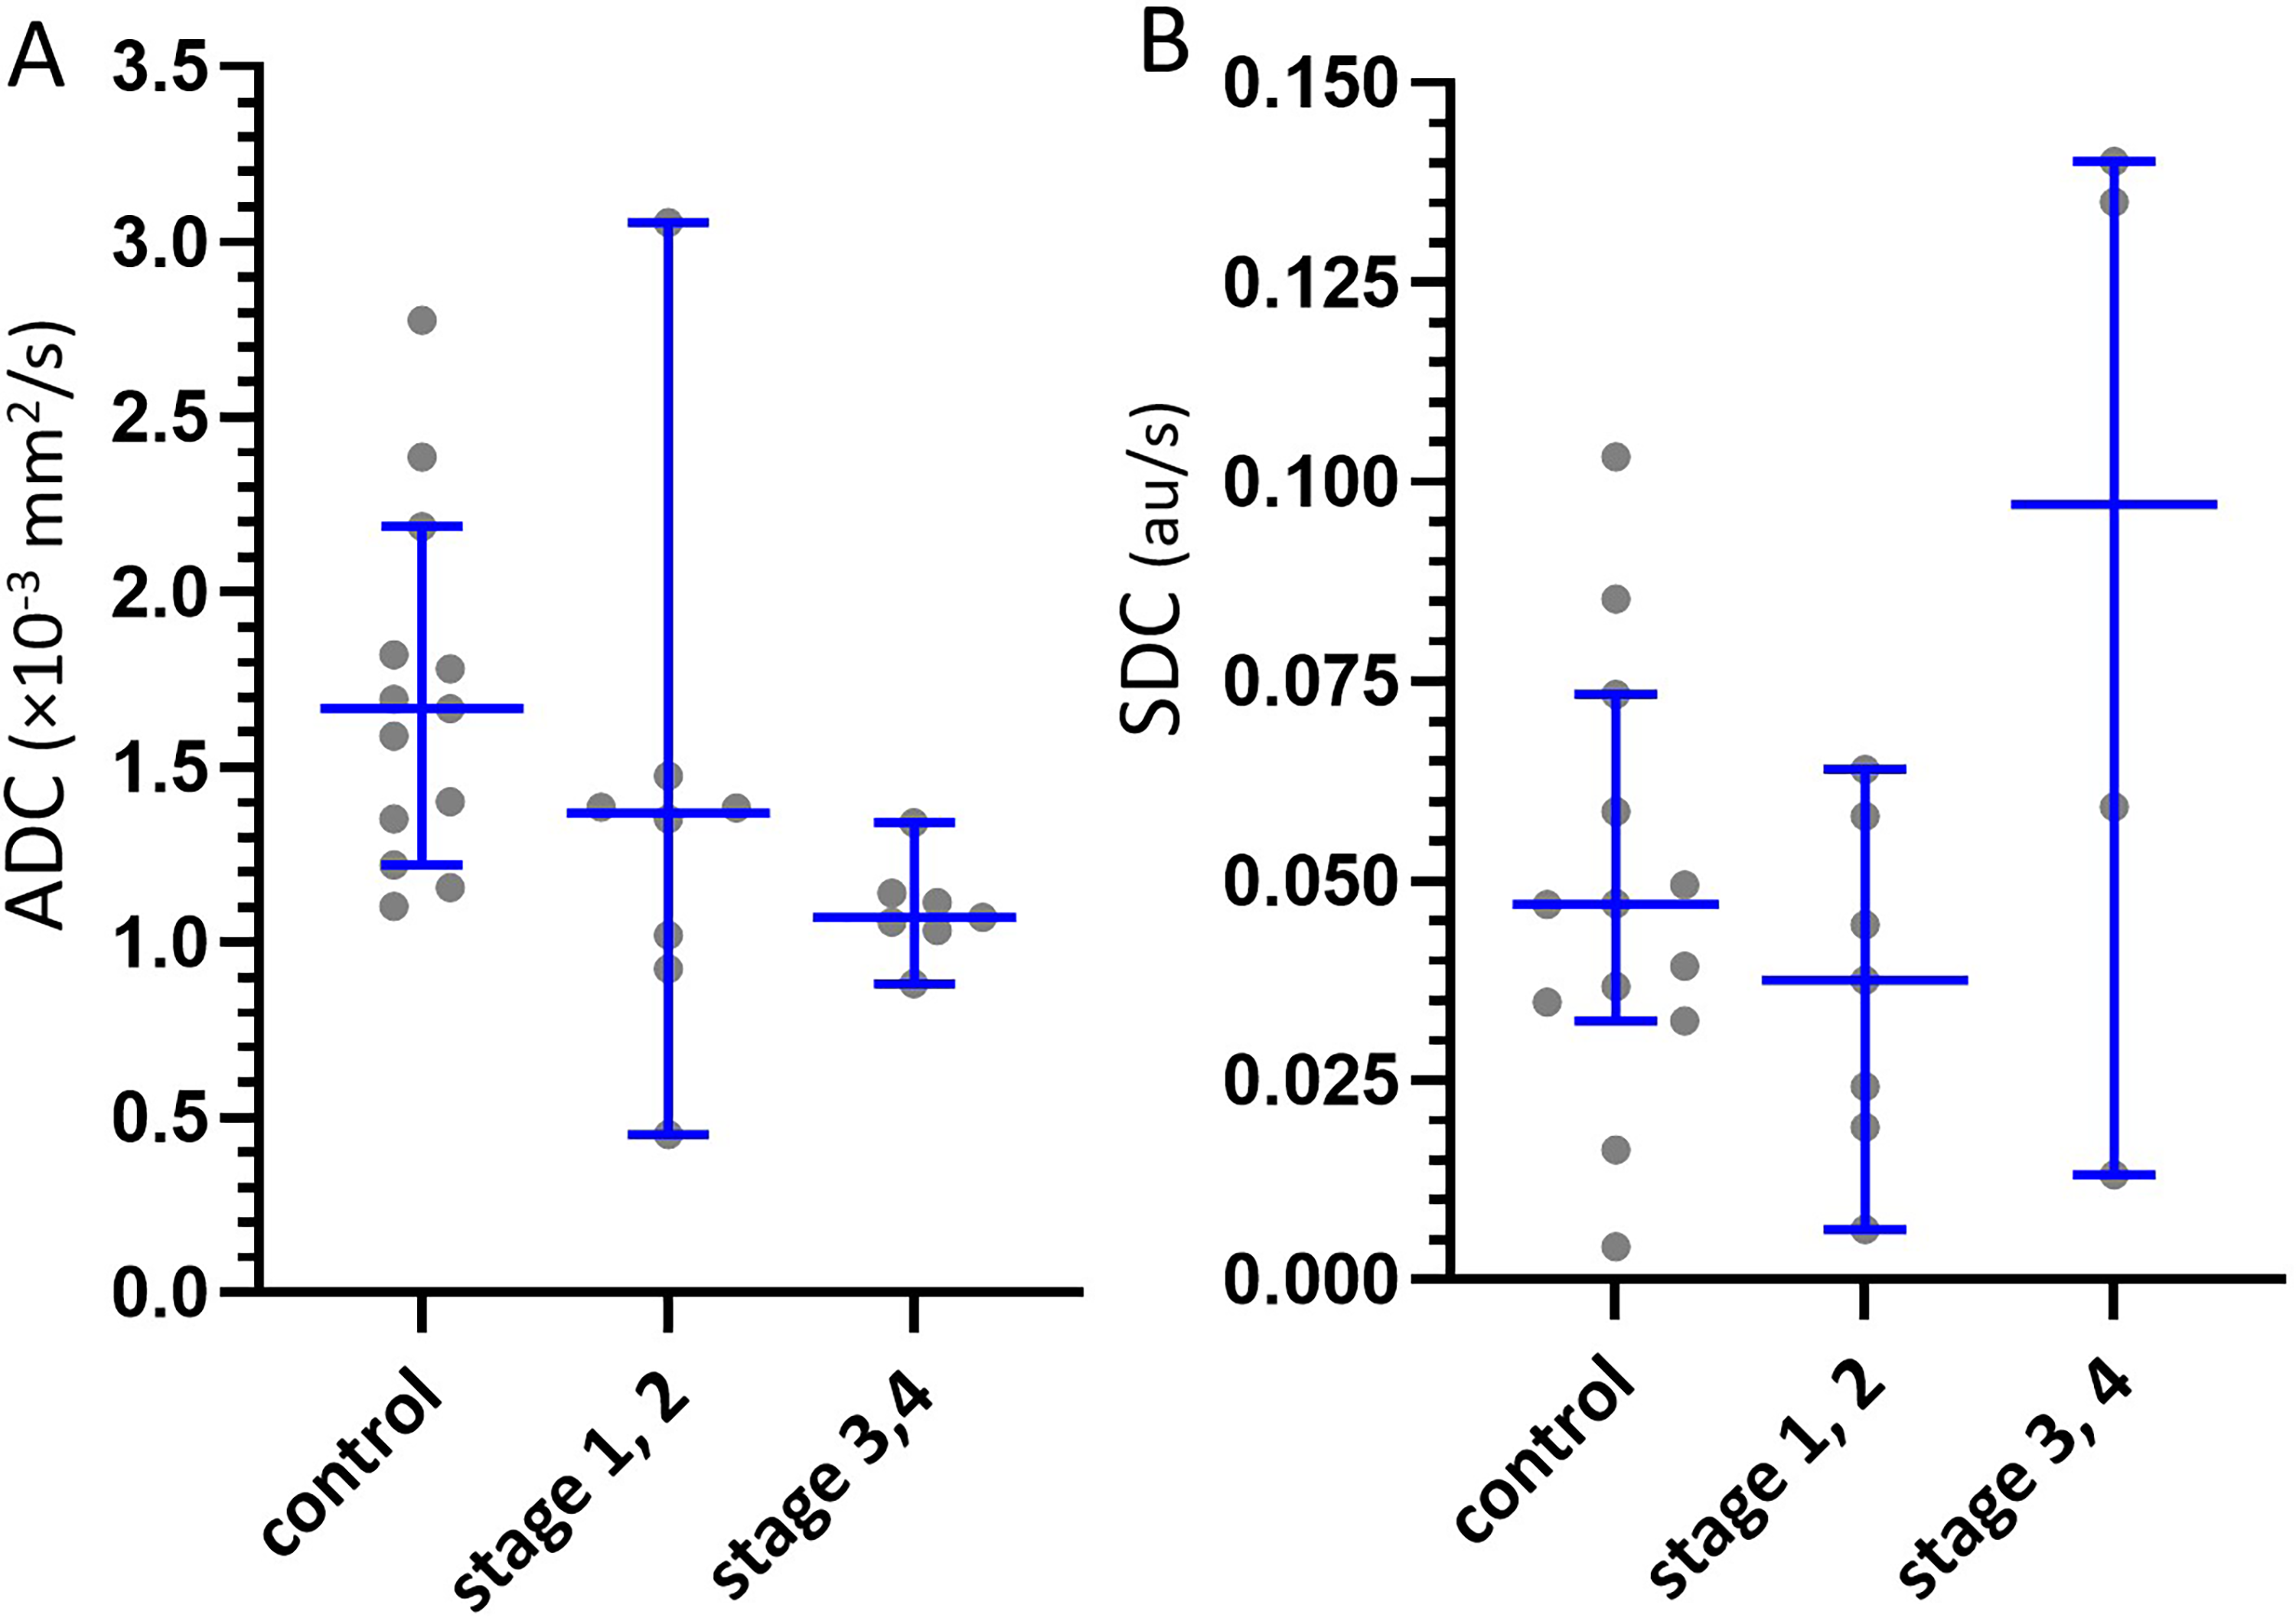
Human dataset 1 liver ADCb0b600 and SDCb400b600 results. Liver advanced fibrosis (stages 3 and 4) has an ADC lower than that of early stage liver fibrosis (stages 1 and 2); liver advanced fibrosis has an SDC higher than that of early stage liver fibrosis. Each dot represents a study subject, and blue lines represent the median and 95% confidence interval. ADC unit: ×10−3 mm2/s; SDC unit: au/s.
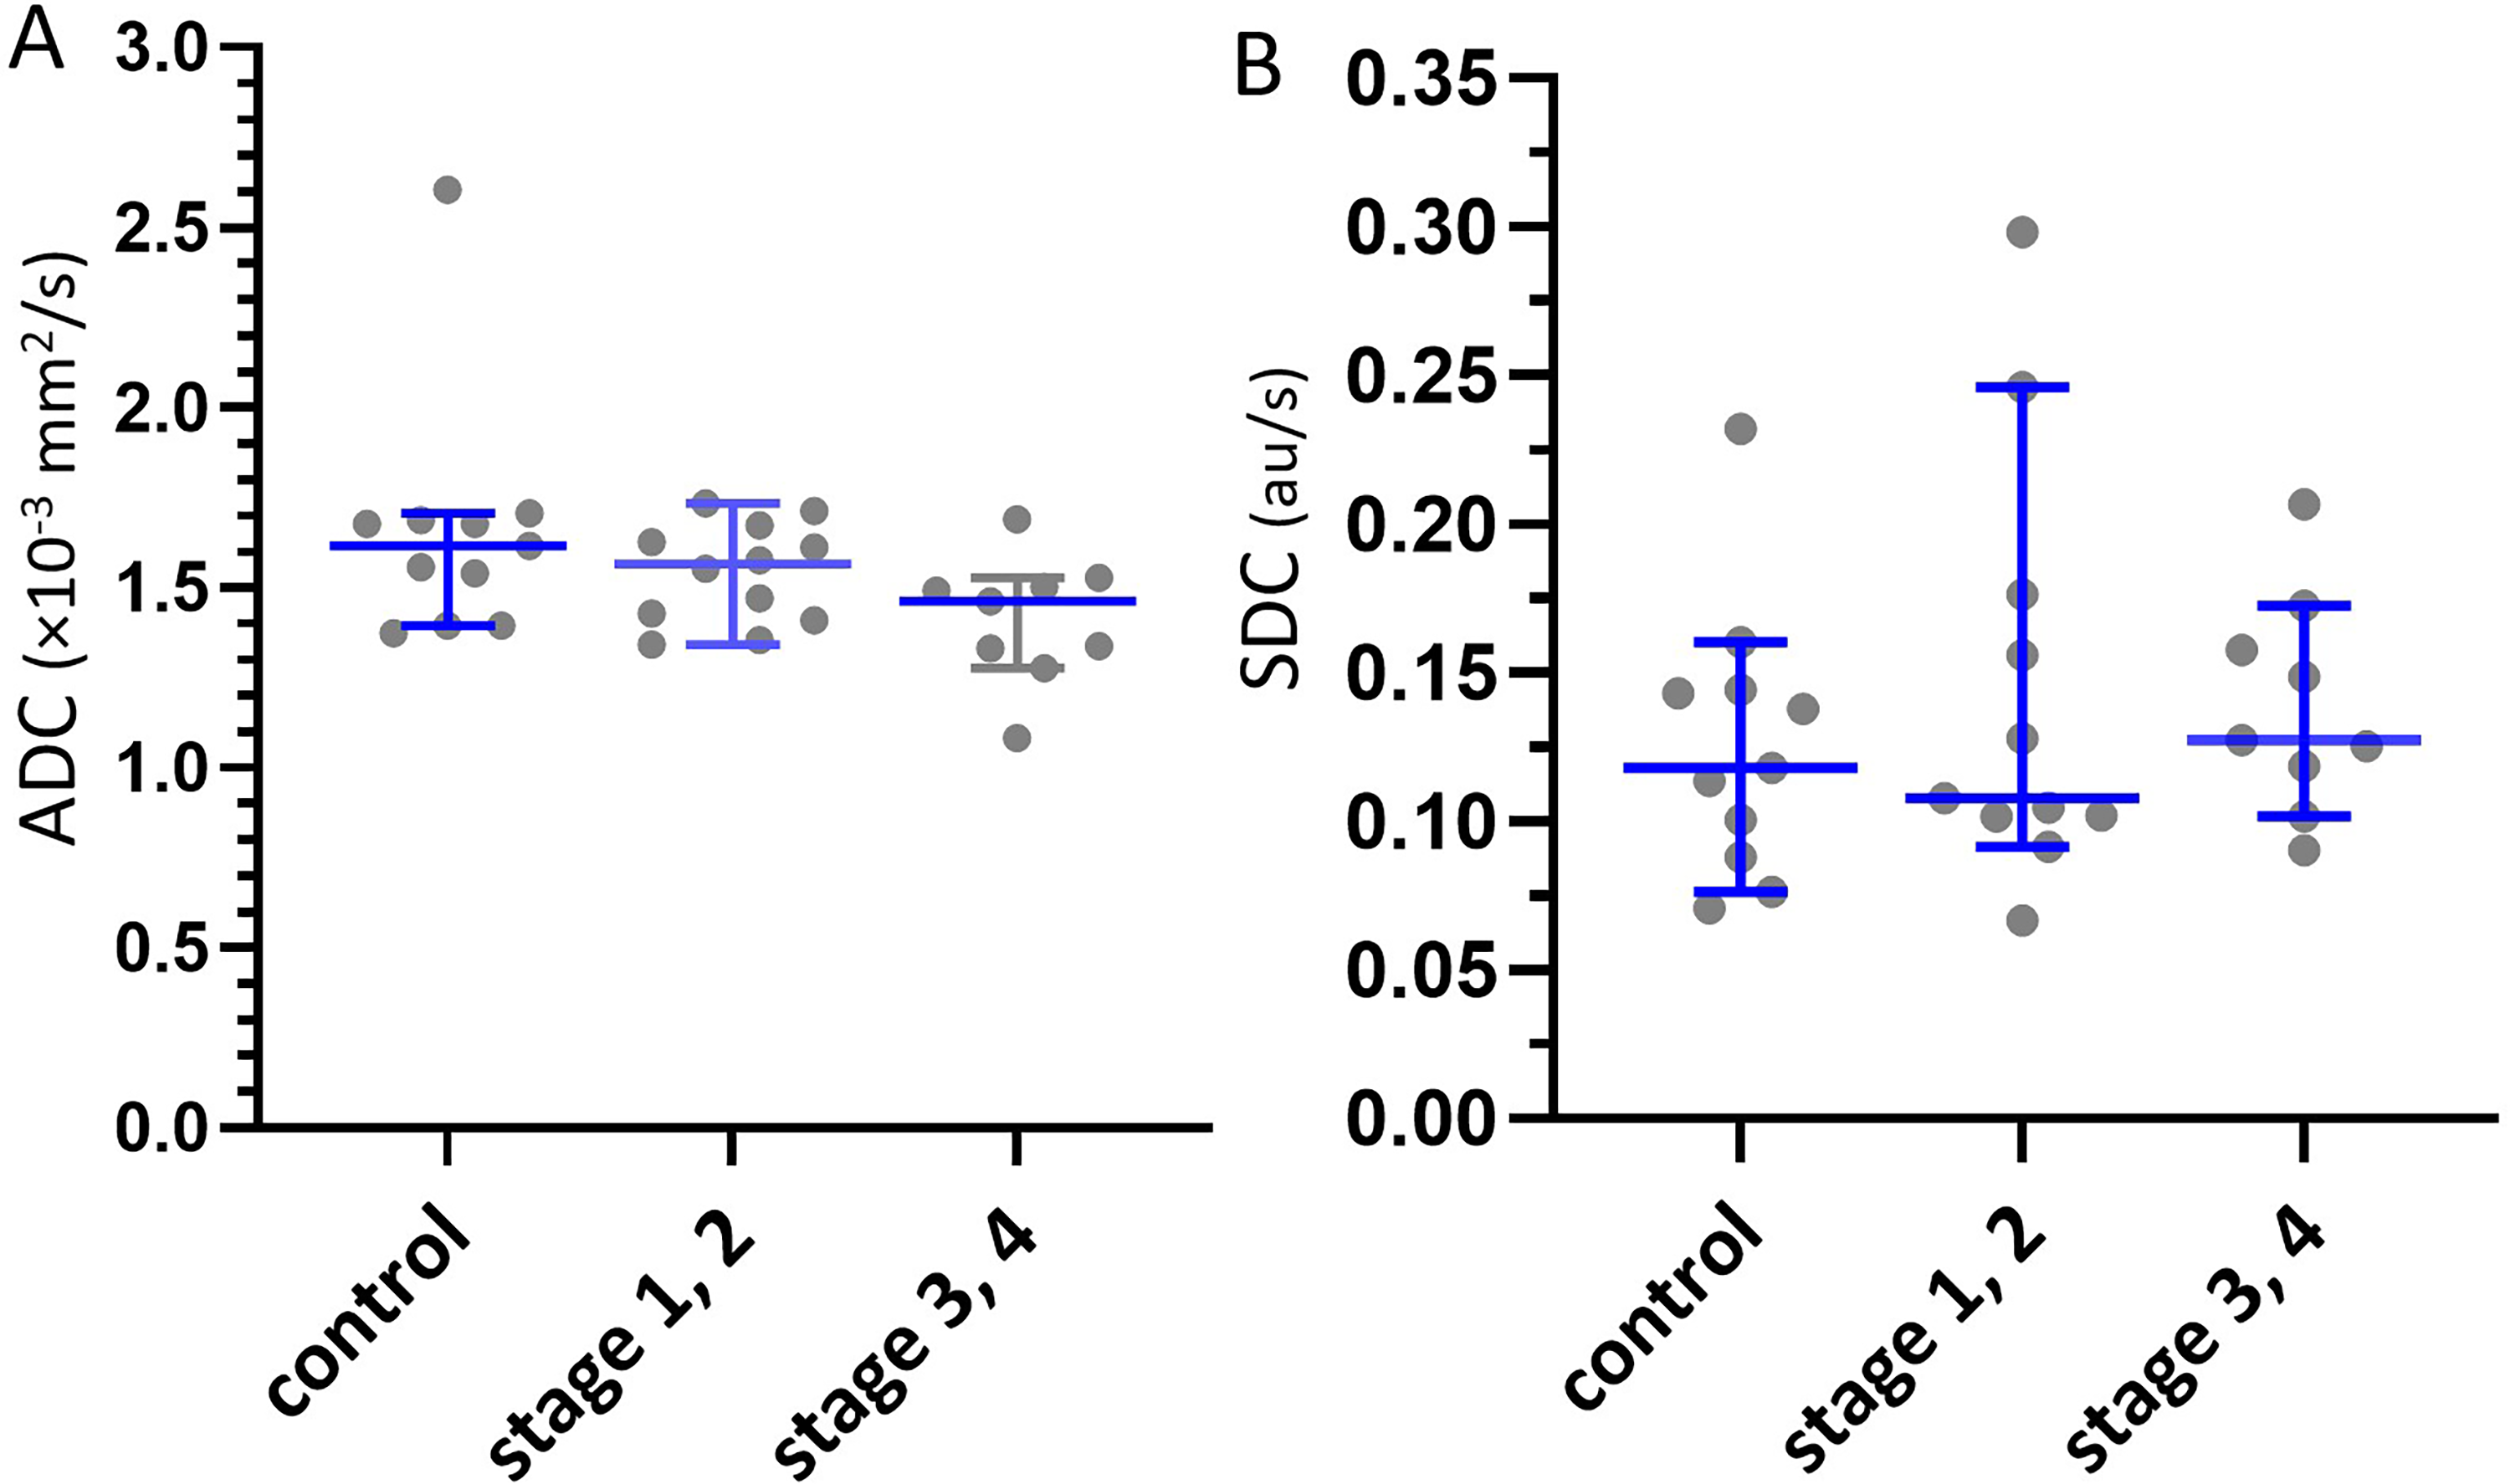
Human dataset 2 liver ADCb0b600 and SDCb400b600 results. Liver advanced fibrosis (stages 3 and 4) has an ADC lower than that of early-stage liver fibrosis (stages 1 and 2); liver advanced fibrosis has an SDC higher than that of early stage liver fibrosis. Each dot represents a study subject, and blue lines represent the median and 95% confidence interval. ADC unit: ×10−3 mm2/s; SDC unit: au/s.
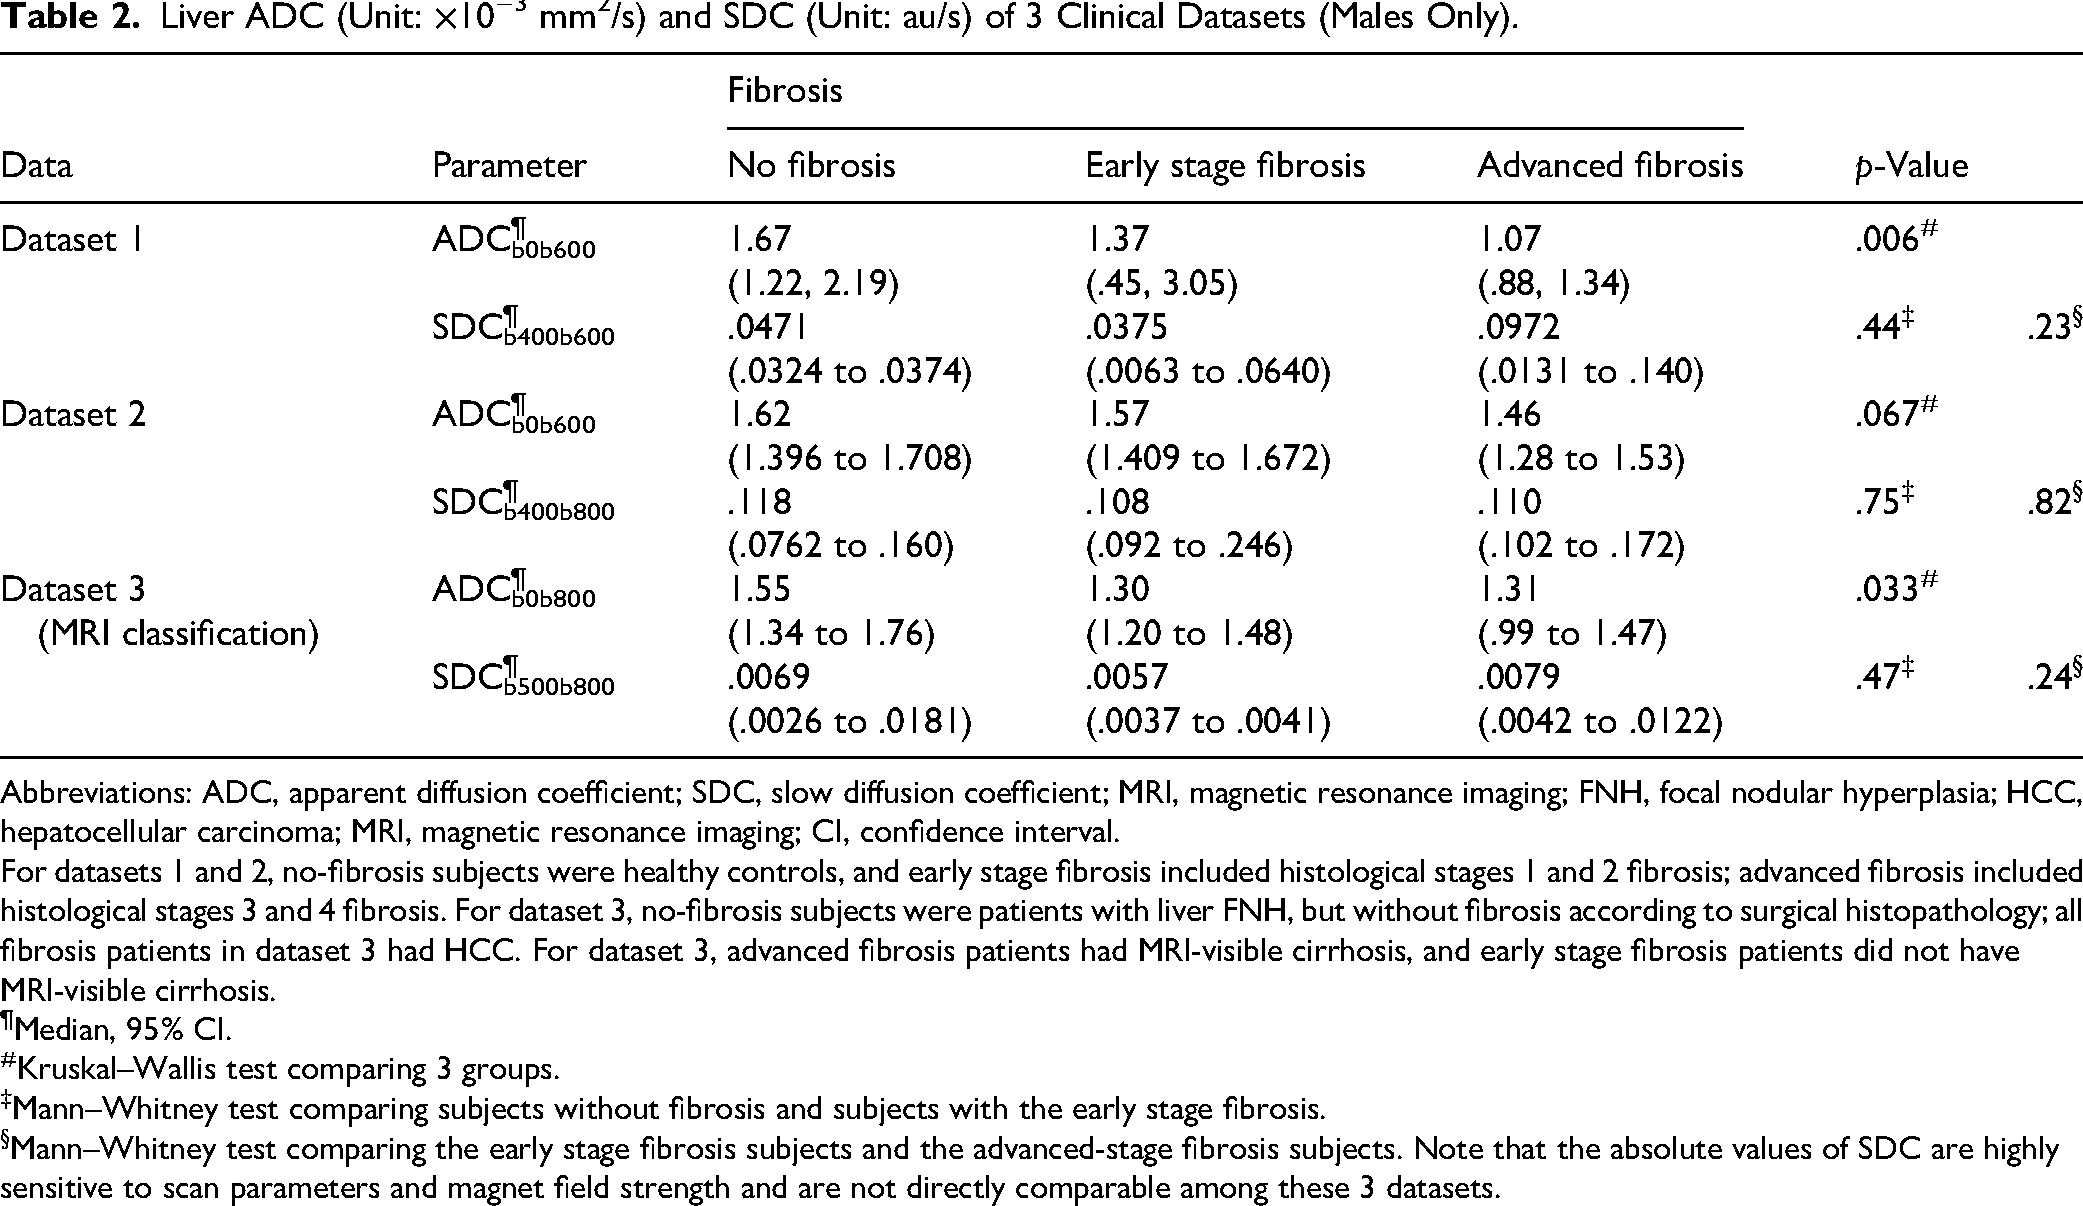
Liver ADC (Unit: ×10−3 mm2/s) and SDC (Unit: au/s) of 3 Clinical Datasets (Males Only).
Abbreviations: ADC, apparent diffusion coefficient; SDC, slow diffusion coefficient; MRI, magnetic resonance imaging; FNH, focal nodular hyperplasia; HCC, hepatocellular carcinoma; MRI, magnetic resonance imaging; CI, confidence interval.
For datasets 1 and 2, no-fibrosis subjects were healthy controls, and early stage fibrosis included histological stages 1 and 2 fibrosis; advanced fibrosis included histological stages 3 and 4 fibrosis. For dataset 3, no-fibrosis subjects were patients with liver FNH, but without fibrosis according to surgical histopathology; all fibrosis patients in dataset 3 had HCC. For dataset 3, advanced fibrosis patients had MRI-visible cirrhosis, and early stage fibrosis patients did not have MRI-visible cirrhosis.
Median, 95% CI.
Kruskal–Wallis test comparing 3 groups.
Mann–Whitney test comparing subjects without fibrosis and subjects with the early stage fibrosis.
Mann–Whitney test comparing the early stage fibrosis subjects and the advanced-stage fibrosis subjects. Note that the absolute values of SDC are highly sensitive to scan parameters and magnet field strength and are not directly comparable among these 3 datasets.
In all 3 human datasets, early stage liver fibrosis had both ADC and SDC lower than those of the controls. If each liver SDC datum was normalized by the mean value of the controls of its respective dataset and 3 human datasets were summed together, stage 1 liver fibrosis had a normalized SDC value lower than that of the controls, and there was a stepwise increase of SDC value from stage 1 liver fibrosis to stage 4 liver fibrosis (Figure 5).
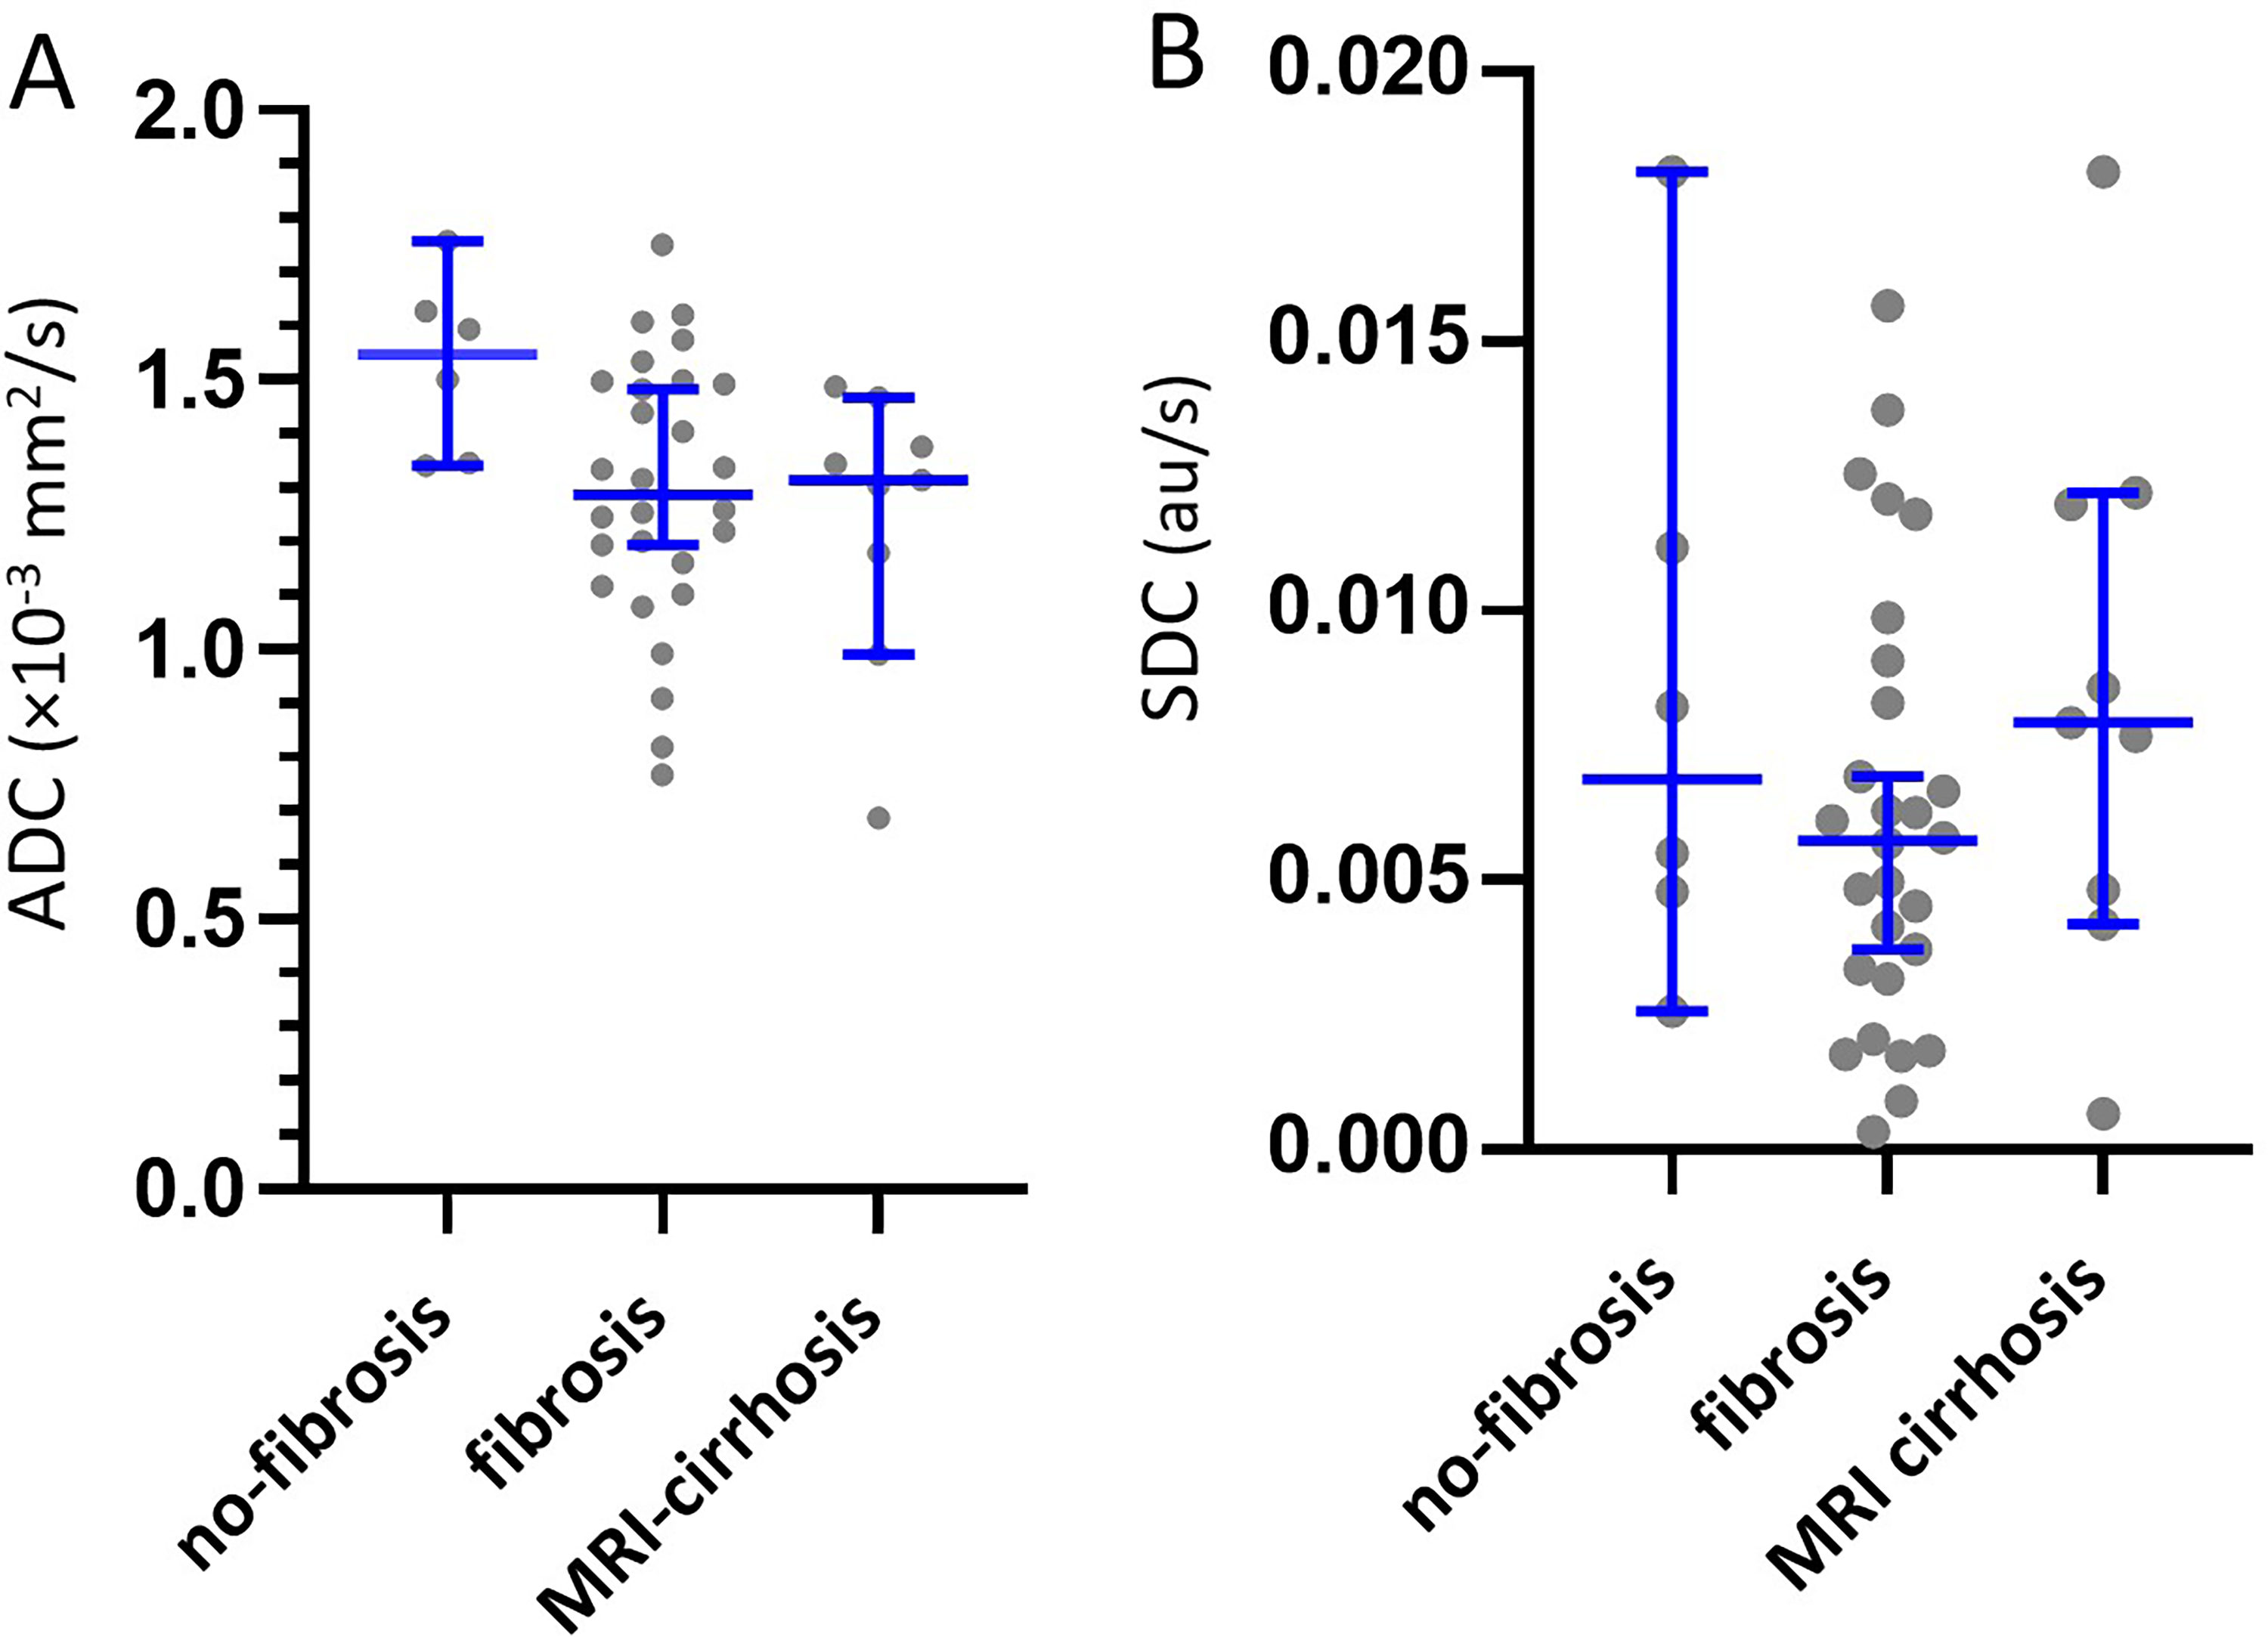
Human dataset 3 liver ADCb0b800 and SDCb500b800 results. Livers with MRI-visible cirrhosis had an ADC lower than that of liver fibrosis without MRI-visible cirrhosis. Livers with MRI-visible cirrhosis had an SDC higher than that of liver fibrosis without MRI-visible cirrhosis. Each dot represents a study subject, and blue lines represent the median and 95% confidence interval. ADC unit: ×10−3 mm2/s; SDC unit: au/s.
Measure raw ADC values and SDC values of this study are shown in Supplemental Table S1.
Discussion
ADC measure is affected by the tissue T2.13-16 Equation (1) for ADC calculation shows that the greater the signal loss between S(b1) and S(b2), the higher the ADC value. Although the low b-value can be nominally 0, in reality, the gradient switching for spatial encoding in the slice selection and readout directions always generates b-values >0. This makes it impossible to acquire images with exactly b = 0 s/mm2. The application of diffusion gradients leads to the tissue demonstrating shorter “apparent” T2 relative to the T2 measured when b = 0 s/mm2. For moving spins, the application of the pair of diffusion gradients will contribute to residual dispersion of “spin focusing” in the transverse plane (even after the application of the second “refocusing” diffusion gradient), leading to a shortening of the measured T2.16,17 It is reasonable to assume that, at the voxel level, there will be “ever-existing” moving spins, which are also contributed by irregular macroscopic body motion. When the motion-probing gradient b-value is increasingly high, even for assumed static voxels, the “refocusing” by the second diffusion gradient is increasingly less coherent. 16 It has been shown that, if we use equation (1) and apply a high b-value and a higher b-value images (such as 400 and 600 s/mm2) to calculate ADC, the “T2 shine-through” of ADC could not be resolved. 19 The conventional IVIM parameter Dslow also suffers from the “T2 shine-through” effect. 15 For example, the same as ADC, conventional IVIM-Dslow shows a lower value in HCC compared to adjacent liver tissues and a lower value in fibrotic livers compared to normal livers.19,26,27 Conventional IVIM-Dslow of the spleen has been consistently measured much lower than that of the liver. 28 SDC was proposed to mitigate the difficulties associated with the “T2 shine-through” effect of ADC and IVIM-Dslow. SDC is negatively associated with ADC for tissues with T2 shorter than 70 ms, and positively associated with ADC for tissues with T2 longer than 70 ms. The strength of the correlation will depend on the T2 of the tissue.15,16 It was shown that an increase in TE for DWI acquisition led to an increase in liver ADC, whereas an increase in TE for DWI image acquisition led to a decrease in liver SDC. Moreover, the magnitude of changes (increase or decrease) was much greater for the liver than for the spleen, with the liver having a much shorter T2 than the spleen (liver: 40 ms; spleen: 60 ms; 3.0 T).23,29 Note that, from an MRI signal decay point of view, a longer TE is equivalent to a shorter T2. For brain gliomas and parotid gland tumors (both have a mean T2 > 70 ms), a positive correlation of Pearson r of around .6–.7 have been noted.30,31
SDC has shown practical advantages in various scenarios. For example, in a study of 63 patients with diffuse gliomas [30 isocitrate dehydrogenase (IDH)-mutant and 33 IDH-wildtype], SDCb500b750 separated IDH mutant negative tumors and mutant positive tumors with an area under receiver operating characteristic curve (AUROC) of .828. ADCb0b1000 separated IDH mutant negative tumors and mutant positive tumors with an AUROC of .760. 32 Thus, SDC as a biomarker offers a better differentiation power than ADC. A combination of diffusion-derived “vessel density” (DDVD),20,21,33 ADC, and SDC achieved an AUROC of .9 for separating IDH-mutant and IDH-wildtype gliomas. 30 In studies of parotid gland tumors, DDVD ratio (DDVDr), SDC ratio (SDCr), and ADC ratio (ADCr) were the metrics of the tumor divided by the metrics of tumor-free parotid gland tissue. A combination of ADCrb0b800, SDCrb600b800, and DDVDrb0b20 separated parotid gland malignant tumors and benign tumors (ie, Warthin's tumors and pleomorphic adenomas) with an AUROC of 0.805. 31 Based on the T2 weighted image signal and these 3 metrics of DDVD, SDC, and ADC, we applied a scoring scheme termed “LiverMss-FNH” to evaluate liver solid mass. In 2 studies, totaling 25 FNH and 132 liver malignant tumors, LiverMss ≥ 3.0 suggests the possibility of a liver mass being FNH, and LiverMss ≥ 4 can strongly favor the diagnosis of FNH.22,34 A typical SDC signal, that is, being an iso-signal or slightly high signal (but not a high signal), has an odd ratio of 38 in favor of liver FNH over liver malignant tumors.22,34 More recently, we showed that a liver mass with an iso-signal or slightly high DDVD signal, while with an SDC higher than or equal to that of the kidneys, had an odds ratio of 34.7 in favor of intrahepatic cholangiocarcinoma over HCC, 35 and a higher SDC value is associated with a better intrahepatic cholangiocarcinoma patient survival potential. 36 On the other hand, a higher SDC value is associated with a higher Ki-67 expression for HCC. 37
The lowered value of ADC in liver fibrotic livers is likely due to at least 3 factors: (1) longer T2 of fibrotic livers is associated with a less signal decay between S(b1) and S(b2) according to equation (1); (2) increased iron-related susceptibility depresses ADC measure38,39,40; and (3) liver fibrosis/cirrhosis is associated decrease blood perfusion to the liver.20,21,41–43 In studies observing the aging effect on ADC and SDC, we noted that decreased blood perfusion to the liver in the older subjects leads to lower liver ADC but has no apparent effect on SDC.23,44 In the current study, the rat BDL model results show liver ADC decreased stepwise following the duration (in weeks) of BDL, whereas SDC increased stepwise. In all human data, advanced liver fibrosis had an ADC lower than that of liver early-stage fibrosis patients; on the other hand, advanced liver fibrosis had an SDC higher than that of liver early stage fibrosis. The latter is consistent with the clinical observation that more severe liver fibrosis is associated with higher liver water level (particularly ECW), and this in turn would relate to faster tissue diffusion. It is noted that early stage fibrosis has an SDC lower than that of the healthy controls. We attribute this to the fact that liver fibrosis is associated with increased liver iron level. 45 SDC measure appears to be highly sensitive to the iron/susceptibility effect. For example, compared to premenopausal women, postmenopausal women after 50 years have an increase in liver iron level and a lowering of liver SDC, whereas this change is not observed in similarly aged men. 23 It was well established that regardless of the aetiology, a higher liver iron-loading is frequently observed in chronic liver diseases. Increased liver iron in viral hepatitis may be a combined consequence of dysregulated liver iron homeostasis and normal defensive processes adopted during infections, which involve sequestration of iron by hepatic cells to limit access to pathogens and inhibit their proliferation. 46 Excess iron can induce fibrosis-promoting signals in the parenchymal and nonparenchymal cells, which accelerate disease progression and exacerbate liver pathology.47,48 Normal liver iron concentration is lower than 35 μmol/g of dry weight. 49 When liver iron concentration crosses a threshold of 60 µmol/g, hepatic stellate cells’ functionality begins to derail, and when it exceeds 250 µmol/g, cirrhosis becomes inevitable. 49 Despite the iron-related susceptibility being likely to be more apparent for higher grade fibrosis, the effect of elevated water content might surpass that of the susceptibility effect for cirrhosis or advanced stage fibrosis, finally leading to an elevated SDC (Figure 7).
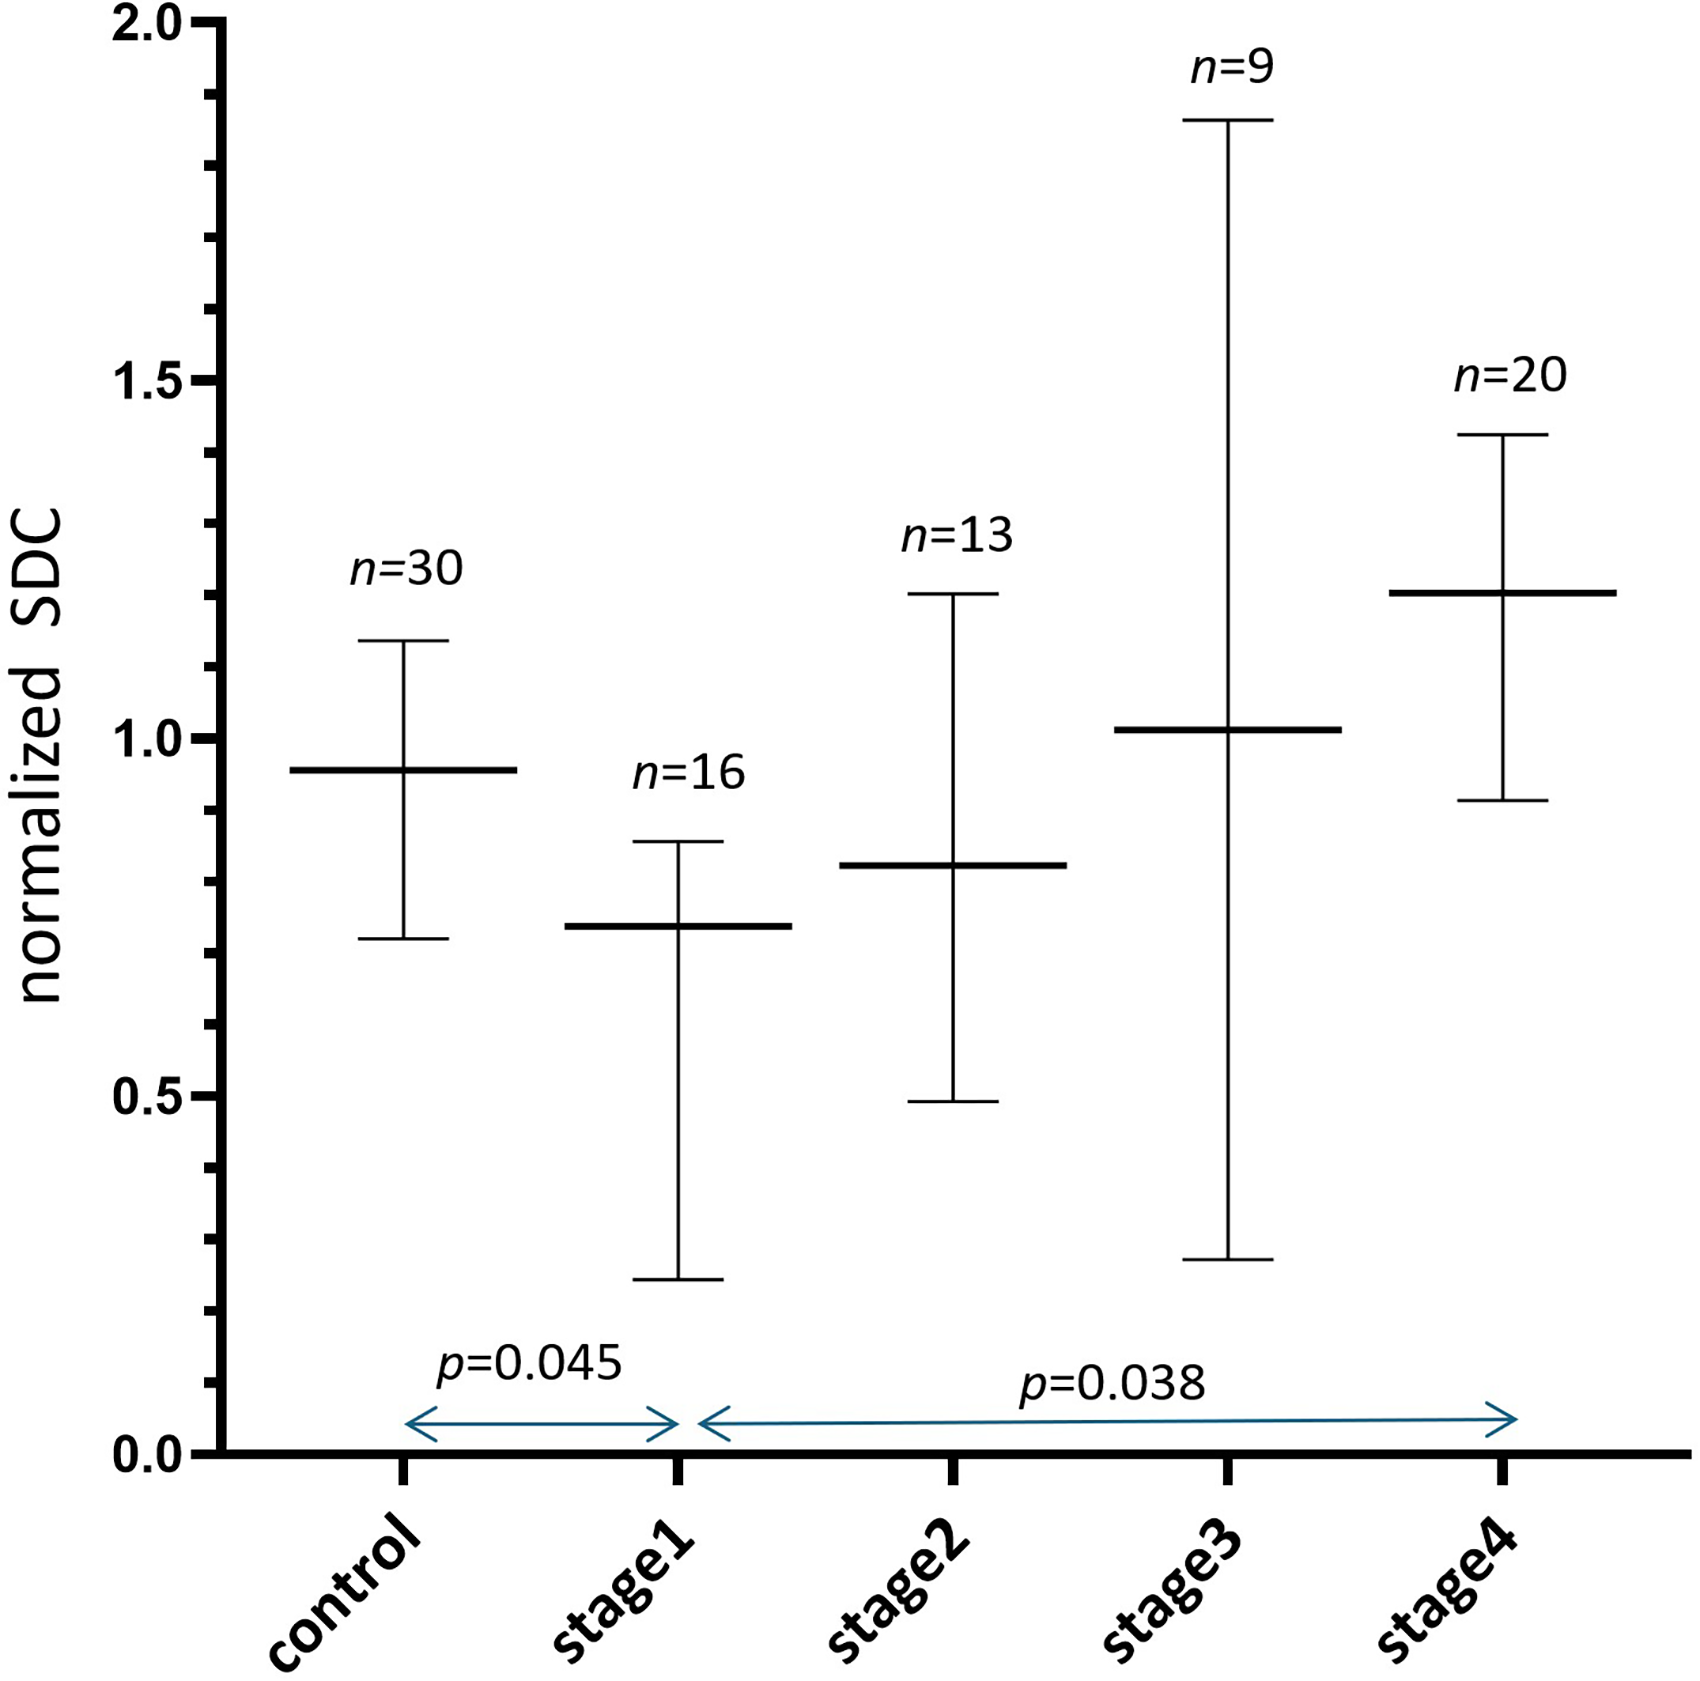
Summed results of normalized SDC values (median and 95% confidence interval) of three clinical datasets. In this graph, all liver SDC values were normalized to the mean value for controls (three datasets normalized separately), and the mean values for controls of each of the three datasets were assumed to be ‘“1.” Stage 1 liver fibrosis has a normalized SDC value lower than that of the controls, and there is a stepwise increase in SDC value from stage 1 liver fibrosis to stage 4 liver fibrosis (ie, cirrhosis).
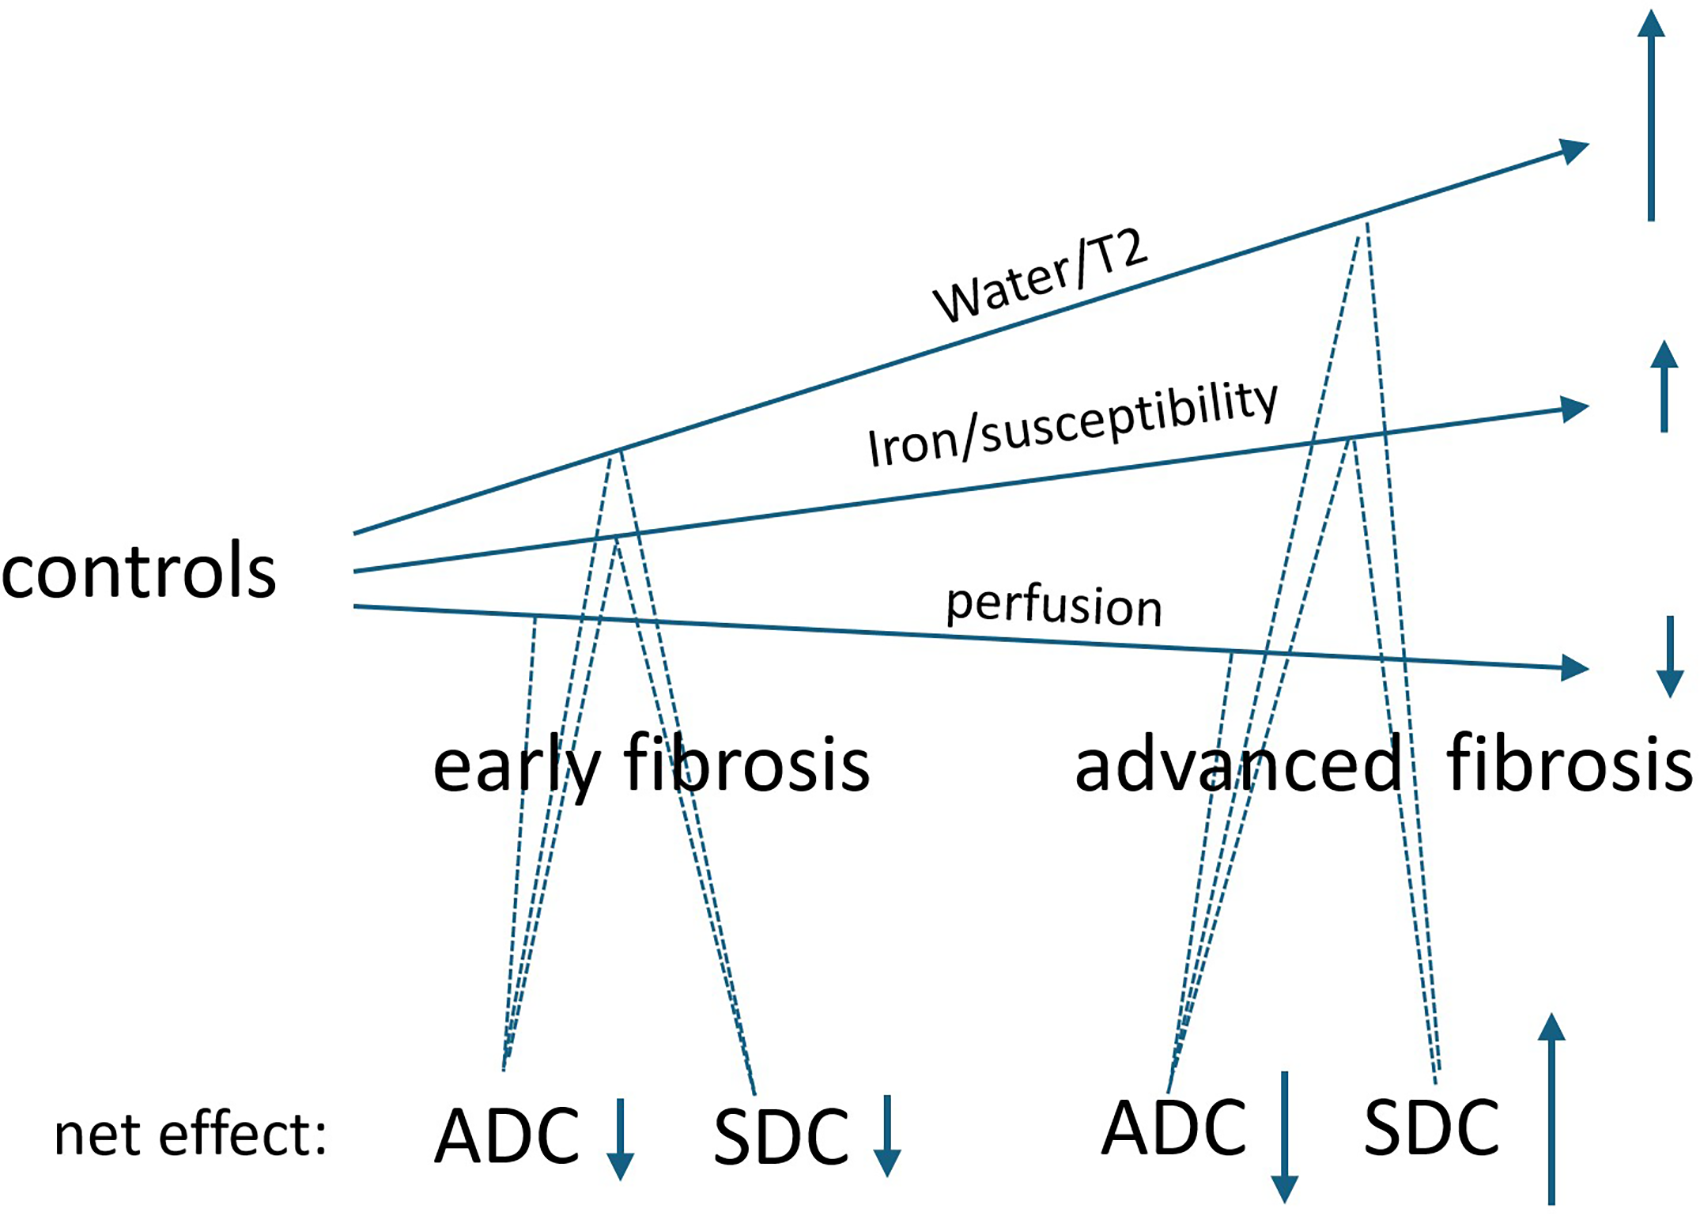
Postulated impact of 3 factors of perfusion, iron/susceptibility, and water content on ADC and SDC. Liver fibrosis is associated with lower perfusion,20,21,42,43 higher iron/susceptibility,45-49 and higher water content.1-7 These 3 factors all contribute to lower ADC measure, and more so with advanced fibrosis. Perfusion generally does not affect SDC.23,44 Higher iron/susceptibility lowers SDC measure, 23 whereas higher water content elevates SDC measure. For early stage liver fibrosis, the net effect of susceptibility and water leads to a lower SDC; while for advanced liver fibrosis, the net effect of susceptibility and water leads to a higher SDC.
To collaborate on the observations described above, we attempted a simulation analysis. According to the Extended T2-IVIM theory, we apply this equation50,51: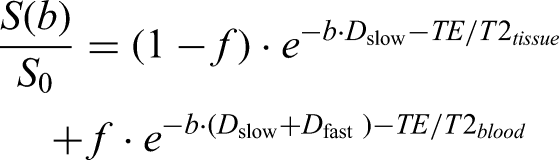
If we assume that: T2blood = 200 ms, TE = 65 ms, Dslow = 1 × 10⁻³ mm2/s, Dfast= 70 × 10−3 mm2/s, f = .2, and b = 0, 400, and 600 s/mm2,26,52 simulation analysis shows an increase in liver T2 is associated with a lower ADC and higher SDC (Figure 8), which is consistent with the observation for the animal data of the current study.
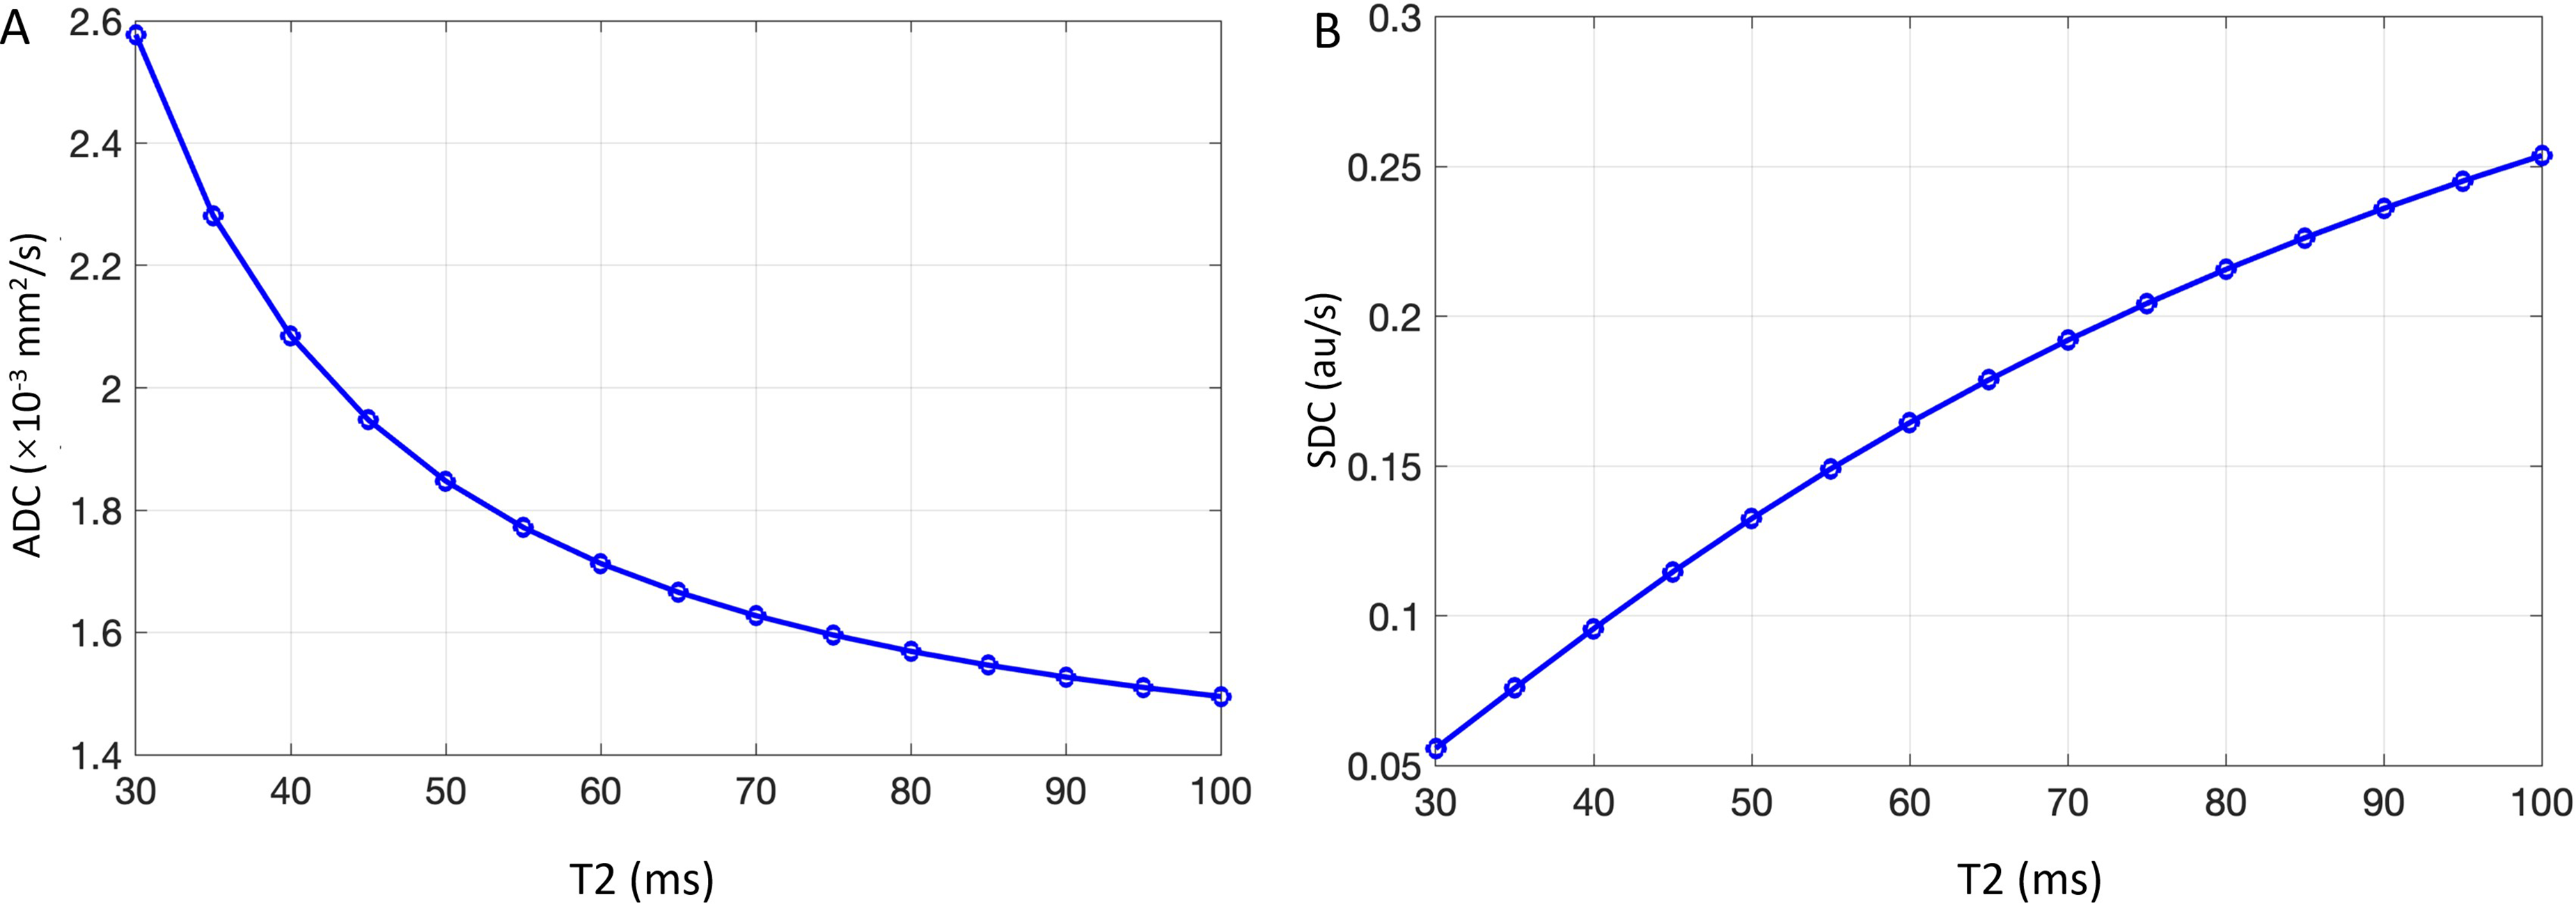
Simulation analysis results according to the Extended T2-IVIM theory show that an increase in liver T2 is associated with a lower ADC and higher SDC.
There are many limitations to this study. This study conveniently reused 4 sets of our historical liver IVIM data, while the liver iron level and its effect magnitude on SDC were not quantified and could only be postulated. However, it is reasonable to assume the liver iron level in our human data is: cirrhotic liver > fibrotic liver > normal liver.45-49 The iron/susceptibility effect may not be elevated in the BDL animal model. Water content in the liver was also not quantified for the liver in this study. The literature has well documented that advanced-stage liver fibrosis has longer T2 and higher ECW/TBW.5-7 The sample size is limited for all the 4 datasets analyzed. Despite statistical significance not being achieved for individual human datasets, the trend was the same for all 3 datasets, and statistical significance was achieved when we combined the results of the 3 datasets (Figure 6). While for the individual sets there was a high degree of heterogeneity, the trend direction was consistent across the datasets, which increased our confidence in the conclusion. Because a higher proportion of liver fibrosis/cirrhosis was in their early 50s, we only used males’ clinical data in this study to tease out the potential menopausal effect on liver SDC; females’ clinical data will require another study. Though the simulation analysis collaborates with our empirical observation, the formula used for simulation analysis takes many assumptions, and a perfect simulation model does not exist. Lastly, the clinical significance of the observations in the current study has not been investigated. The authors are further engaged in studies aiming to characterize liver fibrosis status by a combination of the 3 DWI metrics of DDVD, SDC, and ADC.
In conclusion, the rat model shows liver ADC decreases following liver fibrosis induction by BDL surgery, whereas liver SDC increases. Three sets of human data consistently show that advanced liver fibrosis has an SDC higher than that of early stage liver fibrosis. These SDC results are consistent with the known pathophysiology that patients with cirrhosis have sodium/water retention, and liver fibrosis/cirrhosis is associated with a higher liver water content and longer T2.
Supplemental Material
sj-xlsx-1-mix-10.1177_15353508261465601 - Supplemental material for Increased Brownian Motion of Water Molecules in Livers With Advanced Fibrosis: Preclinical and Clinical Observations With Magnetic Resonance Imaging (MRI)
Supplemental material, sj-xlsx-1-mix-10.1177_15353508261465601 for Increased Brownian Motion of Water Molecules in Livers With Advanced Fibrosis: Preclinical and Clinical Observations With Magnetic Resonance Imaging (MRI) by Fan-Yi Xu, Gen-Wen Hu, Cun-Jing Zheng, Hua Huang, Jie-Qi Luo, Guang-Ping Zheng, Xiao-Hui Duan, Romaric Loffroy and Yì Xiáng J. Wáng in Molecular Imaging
Footnotes
Abbreviations
ORCID iDs
Funding
The authors received no financial support for the research, authorship, and/or publication of this article.
Declaration of Conflicting Interests
The authors declared no potential conflicts of interest with respect to the research, authorship, and/or publication of this article.
Supplemental Material
Supplemental material for this article is available online.
References
Supplementary Material
Please find the following supplemental material available below.
For Open Access articles published under a Creative Commons License, all supplemental material carries the same license as the article it is associated with.
For non-Open Access articles published, all supplemental material carries a non-exclusive license, and permission requests for re-use of supplemental material or any part of supplemental material shall be sent directly to the copyright owner as specified in the copyright notice associated with the article.