
Abstract
Salvianolic acid B (Sal B) is a major water soluble component extracted from Radix Salviae miltiorrhizae, a traditional Chinese herb widely used for treating cardiovascular and hepatic diseases. Sal B has been reported to inhibit transforming growth factor (TGF)-β1-stimulated hepatic stellate cells (HSCs) activation and collagen type I expression. In this study, we further investigated the mechanisms of Sal B on liver fibrosis relating to TGF-β/Smads signalling pathway, especially to TGF-β1 receptors. Liver fibrosis model was induced by intraperitoneal injection of dimethylnitrosamine (DMN) for four weeks. Rats were randomly divided into three groups: normal, model, and Sal B groups. Rats in Sal B group were treated by oral administration of Sal B for four weeks from the first day of DMN exposure. Hydroxyproline (Hyp) content in liver tissue was assayed using Jamall's method and collagen deposition was visualized using Sirius red staining. HSCs were isolated from normal rats, and were cultured primarily in uncoated plastics. At day 4 after isolation, cells were stimulated with 2.5 ng/mL TGF-β1, and treated with 1 and 10 µmol/L Sal B and 10 µmol/L SB-431542 (TβR-I inhibitor) for 24 h, respectively. Cell proliferation was examined with 5-ethynyl-2'-deoxyuridine assay. The expressions of alpha smooth muscle actin (α-SMA) and Smad3 were assayed by immunofluorescent stain and Western blotting. The expression of TβR-I was analysed by Western blotting and real-time polymerase chain reaction. The activity of TβR-I kinase was measured by ADP-Glo kinase assay. The results showed that Sal B could inhibit collagen deposition and reduce Hyp content significantly, and decrease expressions of TGF-β1 and TβR-I in fibrotic liver in vivo. Also, Sal B decreased the expressions of α-SMA and TβR-I, inhibited Smad3 nuclear translocation and down-regulated TβR-I kinase activity in vitro. These findings suggested that Sal B could prevent HSCs activation through TGF-β signalling pathway, i.e. inhibiting TGF-β1 expression, activity of TβR-I kinase and Smads phosphorylation.
Keywords
Introduction
Liver fibrosis is a reversible wound-healing response characterized by the accumulation of extracellular matrix (ECM) following liver injury. 1 Ultimately, liver fibrosis leads to cirrhosis, associated with architectural disorder and functional impairments. The fibrotic response underlies virtually all the complications of end-stage liver diseases, including portal hypertension, ascites, encephalopathy, synthetic dysfunction, and impaired metabolic capacity. Thus, efforts to understand and attenuate fibrosis have direct clinical implications. 2 Over the past decades, the role of the hepatic stellate cells (HSCs) in liver fibrogenesis has been extensively studied, and it is clear that HSCs activation plays a crucial role in liver fibrosis formation. 3 In the normal liver, HSCs keep quiescent state and store vitamin A. Following liver injury, HSCs undergo an activation process in which quiescent vitamin A storing cells transform into proliferative, alpha smooth muscle actin (α-SMA) positive myofibroblast-like cells that synthesize ECM and matrix metalloproteinases. 4 Transforming growth factor beta-1 (TGF-β1) is a key profibrogenic cytokine, which can be released by Kupffer cells (KCs) and initiate HSCs activation by paracrine pathway, and at the meanwhile, activated HSCs secret TGF-β1 which perpetuates HSCs activation by autocrine pathway.
TGF-β pathway signalling occurs when TGF-β binds at the cell surface to the major TGF-β receptor II (TβR-II), which then recruits TβR-I to form a heterodimer. The kinase of TβR-II phosphorylates TβR-I, then phosphorylated TβR-I in turn recruits and binds Smad anchor for receptor activation (SARA) and leads to phosphorylation and nuclear translocation of smad2 and smad3. Once in the nucleus, smad2 and smad3 (in conjunction with smad4) can activate transcription of multiple genes. 5 Therefore, TβR kinase plays a key role in TGF-β signal transduction, and deficiency of TβR or TβR kinase would disrupt the TGF-β signalling pathway.
Danshen (Radix Salviae miltiorrhizae, RSM) is a traditional Chinese herb widely used for treating cardiovascular and liver diseases. Salvianolic acid B (Sal B), a major water soluble component extracted from RSM, has been reported to be effective in ameliorating oxidative damage and eliminating ROS accumulation in hepatocytes, and inhibiting HSCs activation, 6 and has been used in various kinds of diseases such as cerebrovascular, hepatic and pulmonary disorders, etc.
In our previous studies, it was found that Sal B could remarkably reverse liver fibrosis in patients with chronic hepatitis B, 7 whose efficacy was evaluated mainly by liver histological examination, and had a good effect against liver fibrosis in CCl4 and DMN-induced animal models. We also found that Sal B could decrease TGF-β1 expression in fibrotic liver, inhibit TGF-β1-stimulated HSCs proliferation and activation, and in particular decrease the expression, phosphorylation and nuclear translocation of Smad2, 8 these findings suggested that Sal B could have a mechanism of action against liver fibrosis relating to TGF-β signalling in HSCs.
According to reports in the literatures,9,10 bioavailability of Sal B in rabbits and beagle dogs were 1.07% and 5.06%, respectively. 11 In our previous studies, Sal B (10 mg/kg) was very safe for long-term toxicologic observation for rats in vivo (6 months), and 180 mg of Sal B per day for six months in treatment of liver fibrosis due to chronic hepatitis B did not show any toxicity and serious side effect, 7 and many experiments and evidences had accumulated that Sal B, at the dose of 10 mg/kg, were safe. 12 In this study, 10 mg/kg of Sal B was used in vivo in order to observe its effect on the expressions of TβR-I/II. Particularly, SB-431542, a potent and specific inhibitor of TβR-I kinase, was used as control. 13 Furthermore, the effects of Sal B (1 and 10 µmol/L) on the expression of TβR, activity of receptor kinase, Smad 3 phosphorylation in TGF-β1-stimulated HSCs were investigated in vitro. With these efforts, we aimed to elucidate the molecular mechanisms of action of Sal B on liver fibrosis relating to TGF-β/Smads signalling pathway, especially to the expressions and function of TGF-β1 receptors.
Materials and Methods
Reagents
Antibodies used in the study
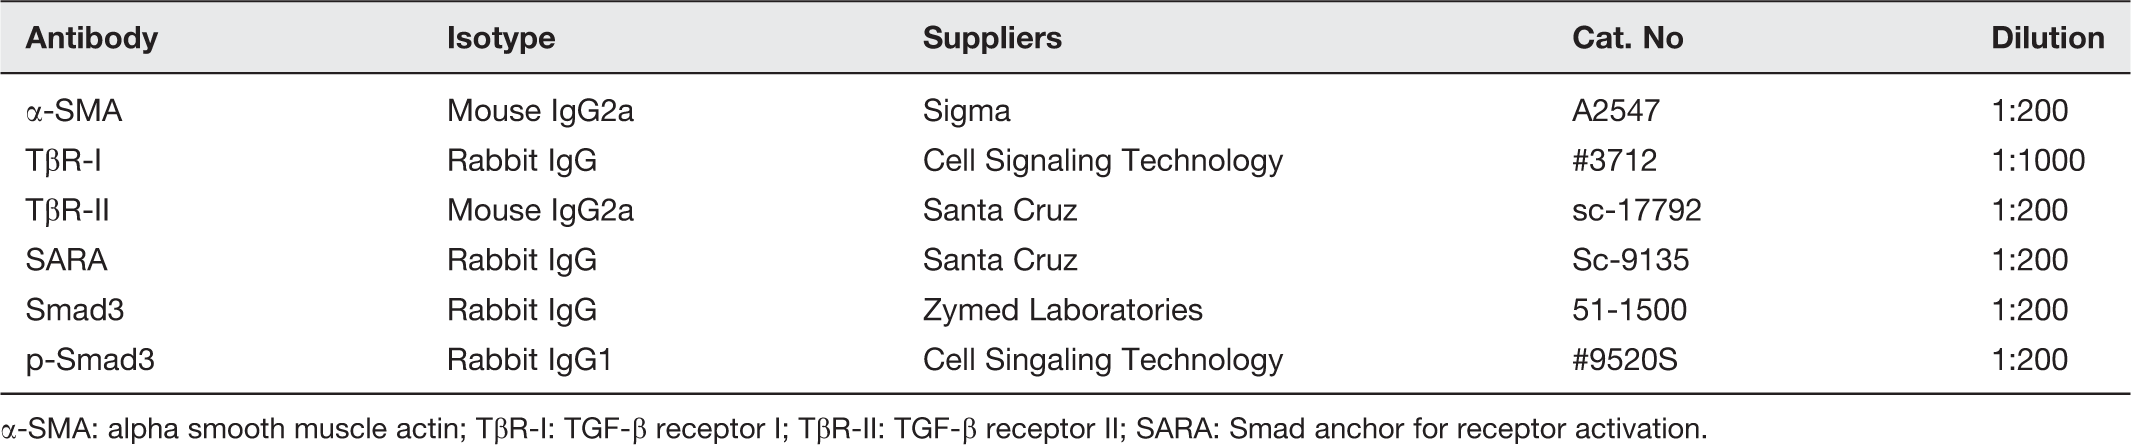
-SMA: alpha smooth muscle actin; TβR-I: TGF-β receptor I; TβR-II: TGF-β receptor II; SARA: Smad anchor for receptor activation.
Primers used for real-time PCR
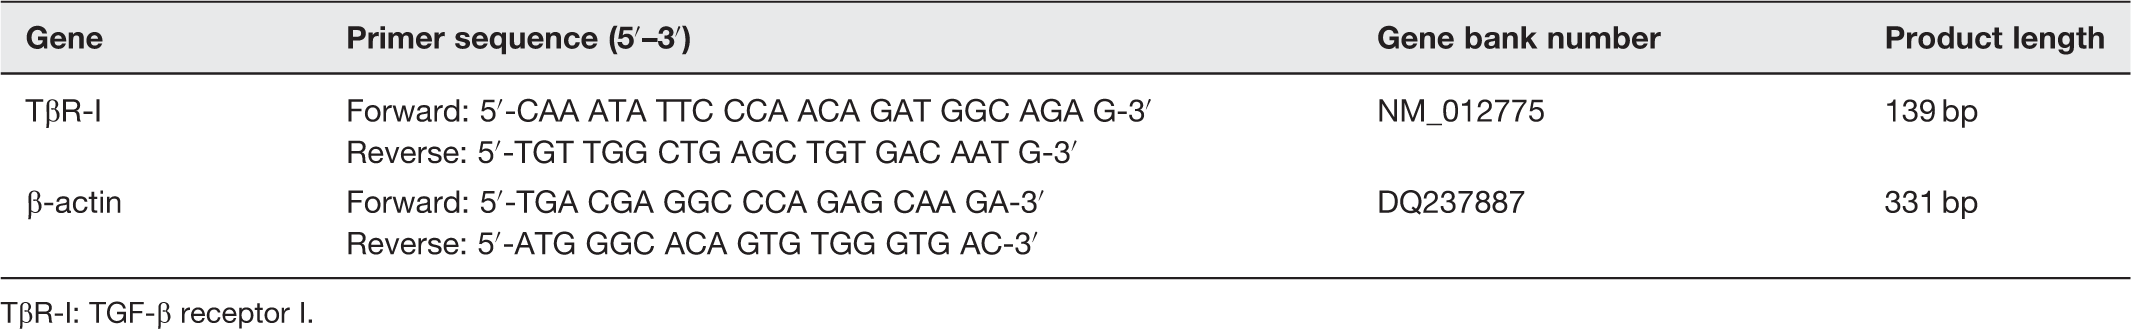
TβR-I: TGF-β receptor I.
Drugs
Sal B, an effective water-soluble compound of RSM, was obtained from Shanghai Medical Research Institute, Chinese Academy of Science, Shanghai, China. The purity of Sal B was 99%, molecular weight 718, and molecular formula C36H30O16. The chemical structure of Sal B was shown in Figure 1.
The chemical structure of Sal B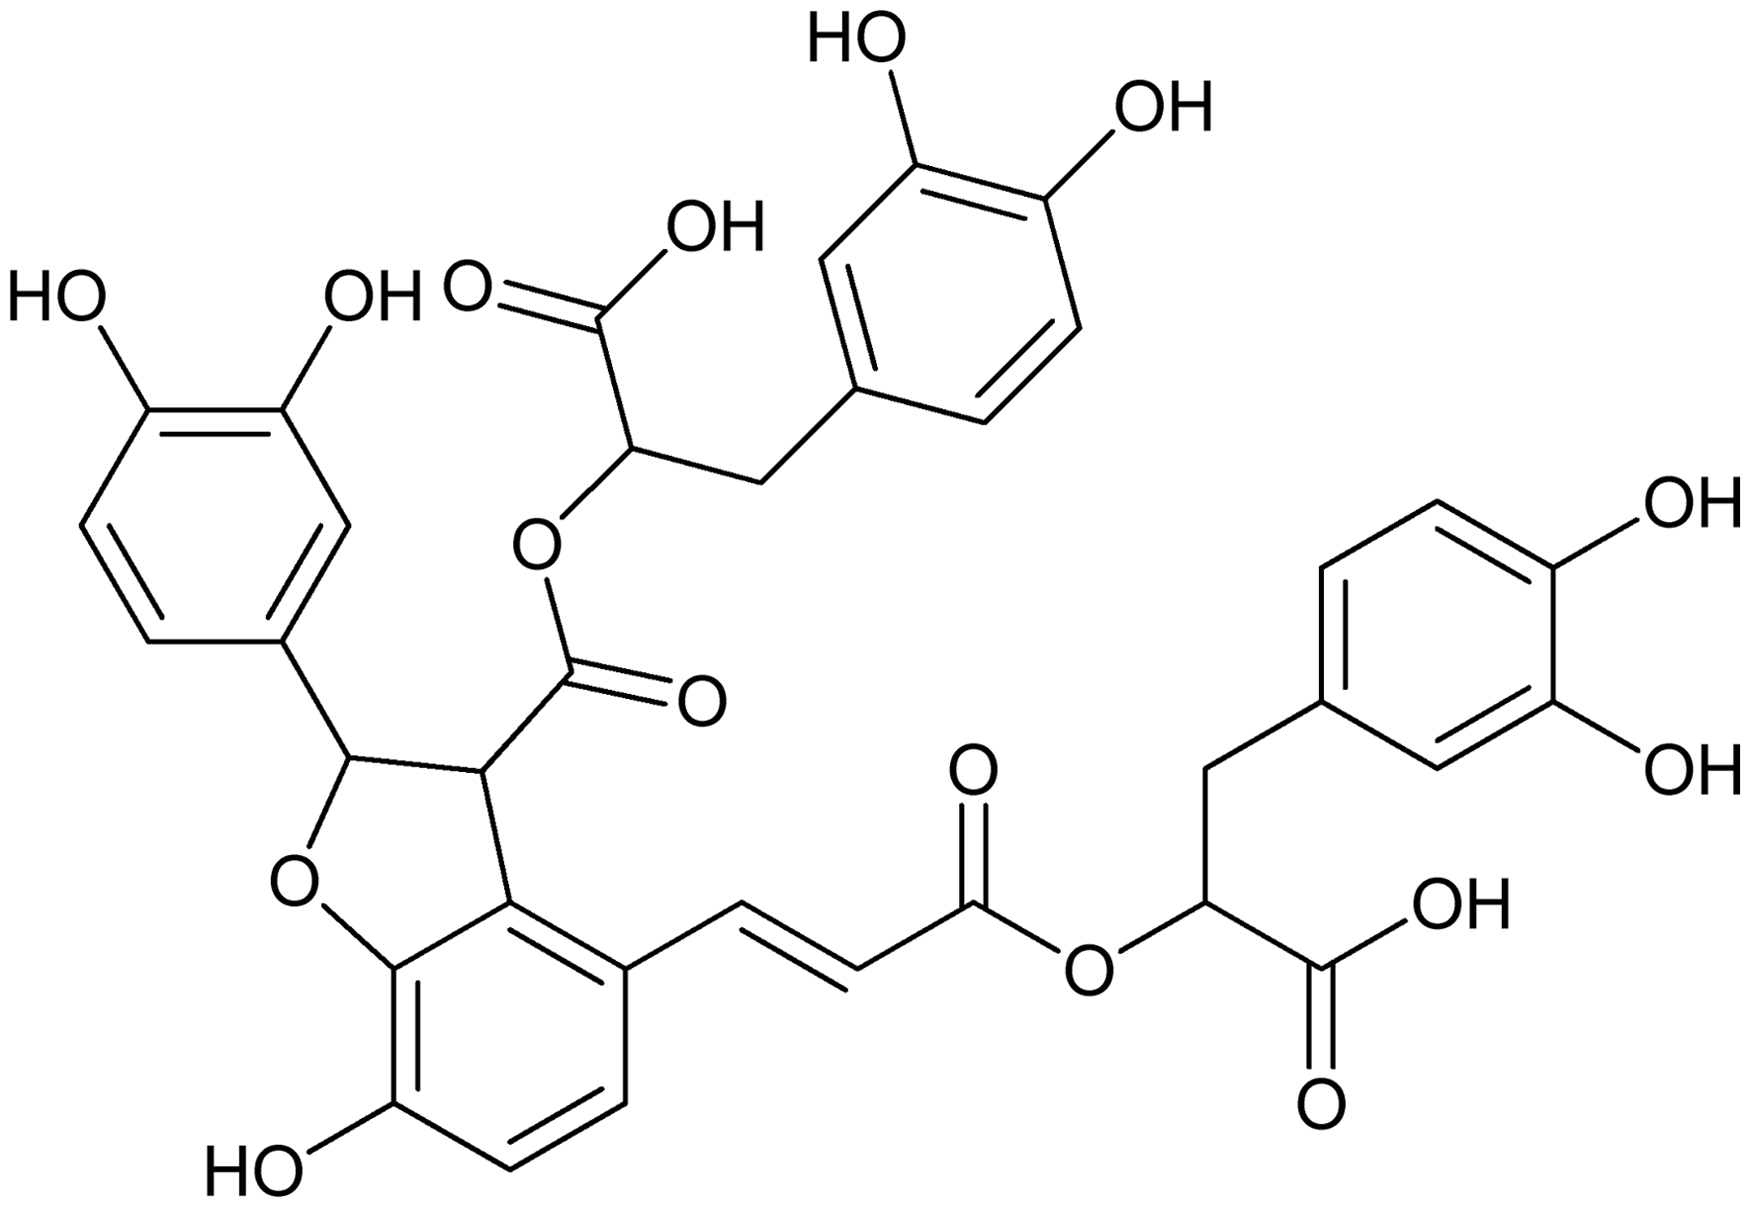
Animal models of liver fibrosis
A total of 30 male Wistar rats, weighing 140–160 g (SPF, Certificate No. SCXK2003-0003), were supplied by Shanghai Laboratory Animal Center, Chinese Academy of Sciences. To investigate the protective effects of Sal B, the rats were randomly divided into three groups: control (n = 6), DMN model (n = 12), and DMN + Sal B (n = 12) groups. Rats in model and Sal B group were administered intraperitoneally with DMN at a dose of 10 µg/kg of body weight every other day for four weeks referred by Ala-kokko et al. 14 Meanwhile, rats in Sal B group were treated by oral administration of Sal B at a dose of 10 mg/kg body weight every day for four weeks. Rats were sacrificed at the end of four weeks and the livers were removed. A portion of each liver was fixed in 10% phosphate-buffered formalin for histological studies after paraffin embedding. The remainder was snap-frozen in liquid nitrogen and stored at −80℃for Hyp content determination and protein and RNA extraction. All experimental procedures were carried out in accordance with internationally accepted principles for laboratory and all animals received humane care during the study with unlimited access to chow and water.
Examination of Hyp content in liver tissues
Hepatic Hyp content was measured with HCl hydrolysis according to Jamall et al.’s methods. 15 Briefly, 100 mg of all liver samples were homogenized and hydrolysed in 6 mol/L of HCl at 110℃for 18 h. Hydrolysates were filtrated with 3 mm filter paper and dried at 40°C. The samples were then incubated with Ehrlich’s solution (25% (w/v) p-dimethylaminobenzaldehyde and 27.3% (v/v) perchloric acid in isopropanol) at 50℃for 90 min and measured at A558 nm. All results were normalized by liver sample weight and calculated using a standard curve.
Histologic examination – Sirius red staining
The liver tissues fixed in 10% phosphate-buffered formalin were embedded in paraffin and sectioned (4 µm thickness). The sections were then stained with Sirius red to assess collagen fibre deposition.
HSC isolation and culture
HSC were prepared from male Sprague-Dawley (450–550 g) rats by in situ perfusion with 2.4 mg/mL pronase and 0.3–0.45 mg/mL collagenase and 11.2% single-step density gradient of OptiPrep™. The cells were mixed with 12.25 mL Gey’s balanced salt solution (GBSS: Dissolve the following in 500 mL water: 7.0 g NaCl, 0.37 g KCl, 70 mg MgSO4 7H2O, 220 mg) and 2.75 mL of 60% (w/v) of OptiPrep™. The gradient was generated by adding 10 mL of GBSS on top of the liver cell mixture in a 50-mL centrifugation tube. After centrifugation (1400 g, 20°C, 20 min) the cells were aspirated from above the interface, washed once in serum-free MEM and subsequently cultured under an atmosphere of 5% CO2, 95% air in 100-mm tissue culture dishes using M199 containing penicillin G 100 U/mL, streptomycin sulphate 100 Ig/mL and 20% fetal calf serum. For immunofluorescent stain, cells were cultured on 12-well plate. Cell viability was greater than 90% as assessed by trypan blue exclusion. Purity was 90–95% as assessed by immunofluorescent stain of α-SMA.
Cell treatment
After isolation, the cells were cultured for four days. For assessment of cytotoxicity of Sal B, cells were then incubated with 1, 10, or 100 µmol/L of Sal B in 0.5% FBS/M199 for another 24 h. For other experiments, the cells were kept in 0.5% FBS/M199 (control) or treated with (1) 2.5 ng/mL TGF-β1, (2) 2.5 ng/mL TGF-β1 plus 1 µmol/L of Sal B, (3) 2.5 ng/mL TGF-β1 plus 10 µmol/L of Sal B, or (4) 2.5 ng/mL TGF-β1 plus 10 µmol/L of SB-431542 for 24 h. The cells were harvested according to the experiments. All experiments were repeated at least three times using independent cell culture.
Assessment of cytotoxicity of Sal B with high content screening (HCS) assay
The cytotoxicity of Sal B on HSCs was determined with the Cellomics Multiparameter Cytotoxicity Kit 1. The principle of the assay is that live cells are labelled with a cocktail of fluorescent dyes that indicate the cellular properties of interest: (1) nucleus and its size and (2) cell membrane permeability status. All procedures were conducted according to the manufacturer’s instruction. At 30 min before the completion of incubation, 1 × MPCT1 Fluor Solution was added to each well. Then cells were fixed with pre-warmed Fixation Solution and washed twice with phosphate-buffered saline (PBS). The plate was sealed and read on HCS Kinetic Scan (Cellomics) immediately to acquire images.
Cell proliferation assay.
5-ethynyl-2'-deoxyuridine (EdU)-DNA incorporation assay was used to measure cell proliferation. After treatment, cells were incubated with M199 contain EdU for another 2 h. Incorporated EdU was detected and visualized by staining with Apollo® 643, Images were taken by Cellomics ArrayScan VTI HCS Reader. Proliferation was assessed by the percentage of cells incorporated EdU, which was analysed by Cellomics Cell Health Profiling BioApplication Software.
Immunocytochemical staining
Indirect immunofluorescence staining was performed for immunocytochemical staining. Briefly, HSCs cultured on coverslips were washed with cold PBS twice and fixed with cold methanol: acetone (1:1) for 10 min on ice. After extensive washing with PBS three times, the cells were permeated with 0.05% saponin for 15 min. The cells were then blocked with 5% BSA in PBS buffer for 30 min at room temperature before incubated with the specific primary antibodies (Table 1). To visualize the primary antibodies, cells were stained with FITC-conjugated secondary antibodies. After washing, cells were stained with Hoechst 33258 to visualize the nuclei. Stained cells were mounted with antifade mounting medium and viewed with a fluorescence microscope (Olympus). Smad3 nuclear translocation was analysed using image-pro plus 6.1 software. The values are represented as the Smad3 average fluorescent intensity in nucleus.
Western blotting analysis.
Liver tissues or HSCs were homogenized in radioimmunoprecipitation lysis buffer (150 mmol/L NaCl, 1% Nonidet P-40, 0.1% sodium dodecyl sulphate [SDS], 50 mmol/L Tris-HCl pH 7.4, 1 mmol/L EDTA, 1 mmol/L PMSF, 1 x Roche complete mini protease inhibitor cocktail). The supernatants were collected after centrifugation at 10,000 g at 4℃for 15 min. Protein concentration was determined using a BCA protein assay kit. Equal amount of proteins were separated by 10% SDS gel electrophoresis (SDS-polyacrylamide gel electrophoresis [SDS-PAGE]) under denaturing and non-reducing condition, and then transferred to nitrocellulose membrane. The membrane was blocked with 5% nonfat milk in Tris-buffered saline and Tween 20 (TBST) at room temperature for 1 h, and incubated with primary antibody (Table 1) at 4℃overnight. After washing in TBST, the blots were incubated with horseradish-coupled secondary antibody. The signals were visualized using the enhanced system (ECL).
RNA isolation, cDNA synthesis, and real-time RT-PCR
Total RNA was extracted from 100 mg of liver tissues using Trizol reagent (Life Technologies Corporation). RNA quantity was determined spectrophotometrically and its integrity was checked by agarose gel electrophoresis. Synthesis of cDNA was performed using 4 µg of total RNA per sample with random primers and reagents contained in the RevertAid First Strand cDNA synthesis kit (Fermentas International Inc.) according to the manufacturer’s protocol. Two microlitres (2 µL) of each sample was used for real-time PCR in a Rcorbett 6.0 system (Rotor-gene 3000, Australia). Primers and their sequences used are listed in Table 2. PCR mixtures contained 1 µL cDNA, 10 µL SYBR® Premix Ex Tq 2X, 0.25 µmol/L forward and reverse primers in a final volume of 20 µL. Reactions were started with a polymerase activation step at 95℃for 10 s, followed by 40 cycles of 95℃for 5 s, 58℃for 15 s, and 72℃for 10 s. Fluorescent data were acquired after each cycle. The absence of primer dimers and unspecific products were verified after each run by melting curve analysis. Relative quantitation was calculated using delta–delta cycle threshold method.
TβRI kinase activity assay
The inhibitory effect of Sal B on TβRI kinase activity was determined by ADP-Glo Kinase assay kit. Sal B was diluted serially in three-fold dilution from 1000/3 to 1000/38 µmol/L. 2 µL of Sal B, 2 µL of TβRI kinase (43.68 µg/mL), 2 µL of TGFβR1 peptide (50 µg/mL), and 2 µL of ATP were added to the wells. After incubation for 60 min at room temperature, 5 µL ADP-Glo™ reagent was added to stop the kinase reaction and deplete the unconsumed ATP. After an additional incubation for 40 min at room temperature, 10 µL kinase detection reagent was added to convert ADP to ATP and luciferase and luciferin were introduced to detect on the ATP concentration used in the kinase reaction, luminescence was measured using a plate-reading luminometer. The half maximal inhibitory concentration (IC50) was calculated using GraphPad Prism 5.0 software.
Stastistical analysis
Data were expressed as mean ± standard deviation. Statistical analyses were carried out using a one-way analysis of variance as well as the least significant difference test, and P < 0.05 was considered statistically significant.
Results
Sal B significantly ameliorated DMN-induced liver fibrosis in rats
The excessive and disorganized deposition of collagens is a major pathogenic feature of fibrotic diseases. Collagen was scarcely observed except around the small central venous walls in normal liver. DMN induced an increased amount of collagen synthesis, and collagen was seen to stretch from portal area to lobular, and complete septa were also observed. In contrast, collagen levels diminished in Sal B treated fibrotic livers (Figure 2a).
Sal B significantly ameliorated DMN-induced liver fibrosis in rats. (a) Sirius red staining for assessing liver fibrosis (×200). In the model group, portal and lobular bridging fibrosis, and cirrhotic nodule formation were observed, Sal B treatment significantly reduced collagen deposition. (b) Liver Hyp content was determined by HCl hydrolysis according to Jamall’s methods. Hyp content of liver was significantly increased in the model group as compared with the normal group. In contrast, Sal B treatment significantly decreased liver Hyp level. #P < 0.05 vs. normal; *P < 0.05 vs. model. (c) Western blotting analysis of α-SMA expression in vivo. α-SMA expression was low in normal liver, whereas it was prominent in model liver, and Sal B treatment attenuated α-SMA expression. (A color version of this figure is available in the online journal)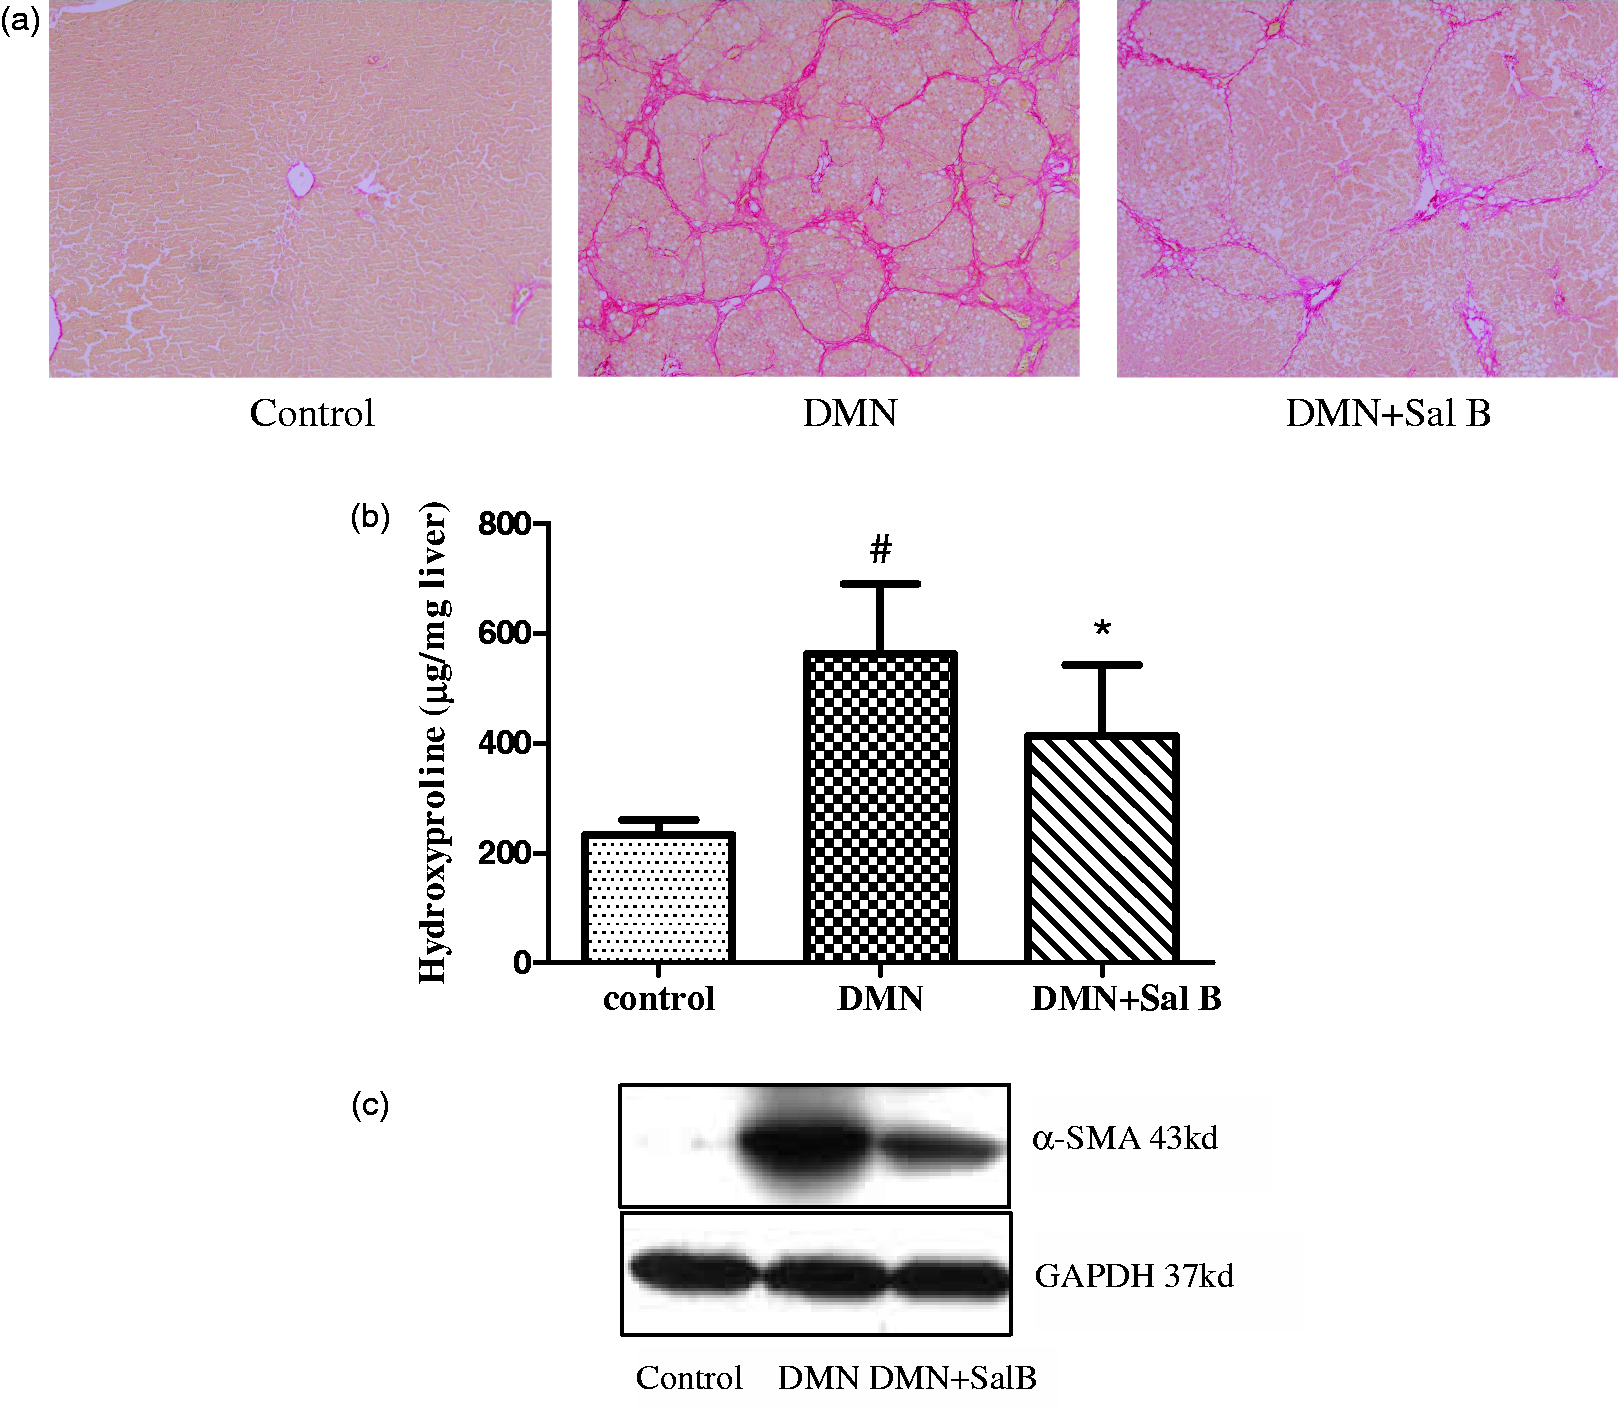
Hyp content is a specific marker for collagen synthesis. The results showed that Hyp content in liver increased significantly in the model group when compared with the normal group. In contrast, Sal B treatment significantly decreased liver Hyp content of model rats (Figure 2b).
α-SMA is a marker of HSCs activation. Western blot analysis revealed that the expression of α-SMA was low in normal liver, whereas it was prominent in model liver, and Sal B treatment attenuated α-SMA expression (Figure 2c).
Sal B treatment attenuated the increase in TGF-β1 and TβR-I expression in livers
It showed that the expressions of TGF-β1 and TβR-I were significantly increased in livers of model group when compared with those of the normal group by Western blot. Conversely, Sal B treatment significantly inhibited the upregulation of TGF-β1 and TβR-I (Figure 3).
The effects of Sal B on the expressions of TGF-β1, TβR-I, and TβR-II in livers of model rats. (a) Western blot analyses for the expressions of TGF-β1, TβR-I, and TβR-II in hepatic tissues. Significantly increased TGF-β1 and TβR-I expressions were observed in rats of the model group, but there was no difference in TβR-II expression. In contrast, Sal B treatment attenuated DMN-induced upregulation of TGF-β1 and TβR-I expressions, not affected TβR-II expression. (b) Graphic presentation of the relative expressions of TGF-β1 and TβR-I. The values are represented as the density of TGF-β1 or TβR-I vs. GAPDH (%) from three samples. ##P < 0.01 vs. normal; **P < 0.01 vs. model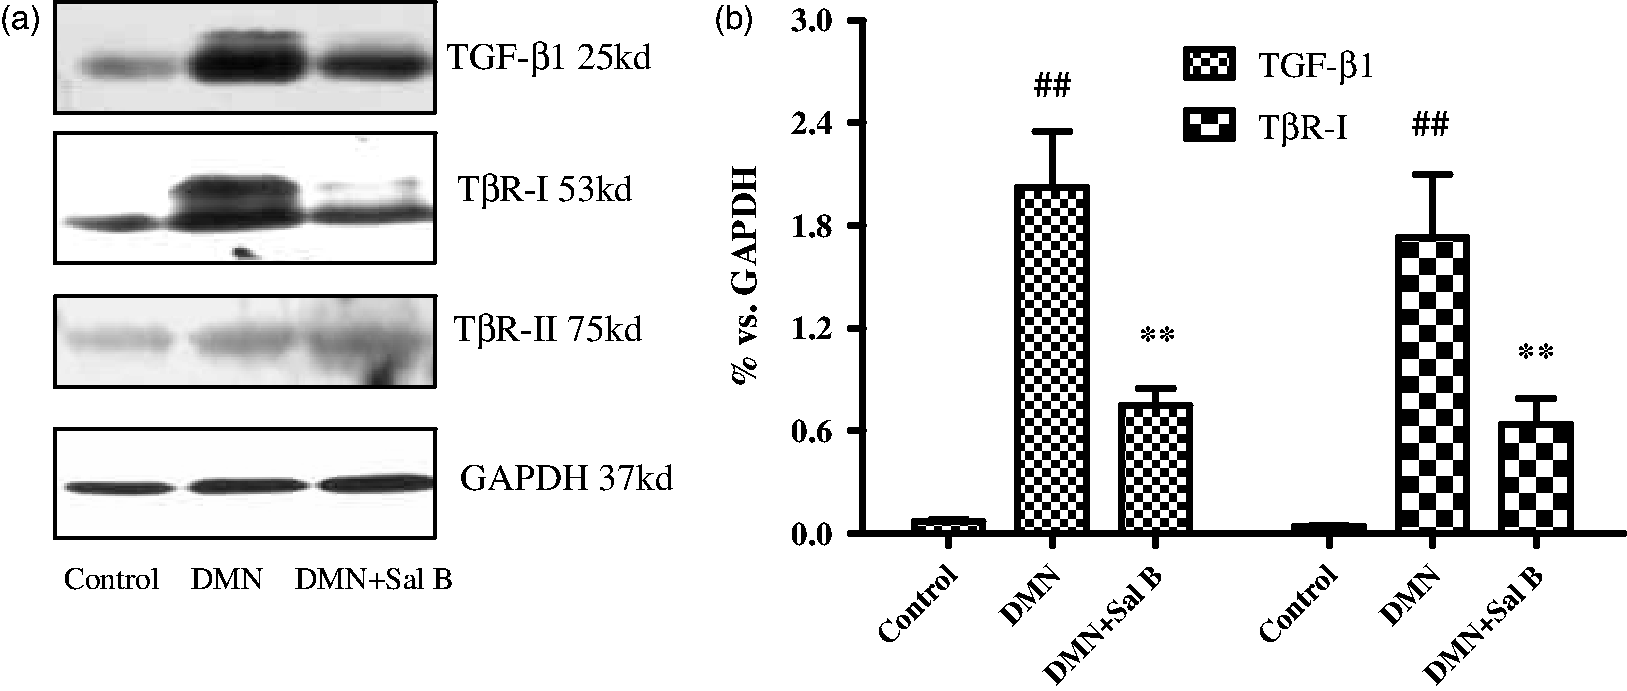
Effects of Sal B on cytoxicology of HSCs
To investigate the cytotoxicity of Sal B on HSCs, cells were treated with a wide range of Sal B doses from 1 to 100 µmol/L. After 24 h of incubation, there were no obvious changes in nuclear morphology and membrane permeability while treated with 1 and 10 µmol/L of Sal B in comparison with control cells. However, 100 µmol/L of Sal B showed an obvious cytotoxicity to cells, reflected by fewer nuclei and an increase in the membrane permeability as shown by the indicator dye. Therefore, 1 and 10 µmol/L of Sal B were considered to be safe doses for treating cells (Figure 4).
The toxicology of Sal B on HSCs. After isolation, the cells were cultured for four days, then incubated with different concentrations of Sal B for 24 h, and stained with Cellomics Multiparameter Cytotoxicity 1 Kit. (a) Images taken by Cellomics ArrayScan VTI HCS Reader. (b) The average cell nuclear size and cell membrane permeability was quantified and analysed by Cellomics Multiparameter Cytotoxicity BioApplication Software. ##P < 0.01 vs. control. (A color version of this figure is available in the online journal)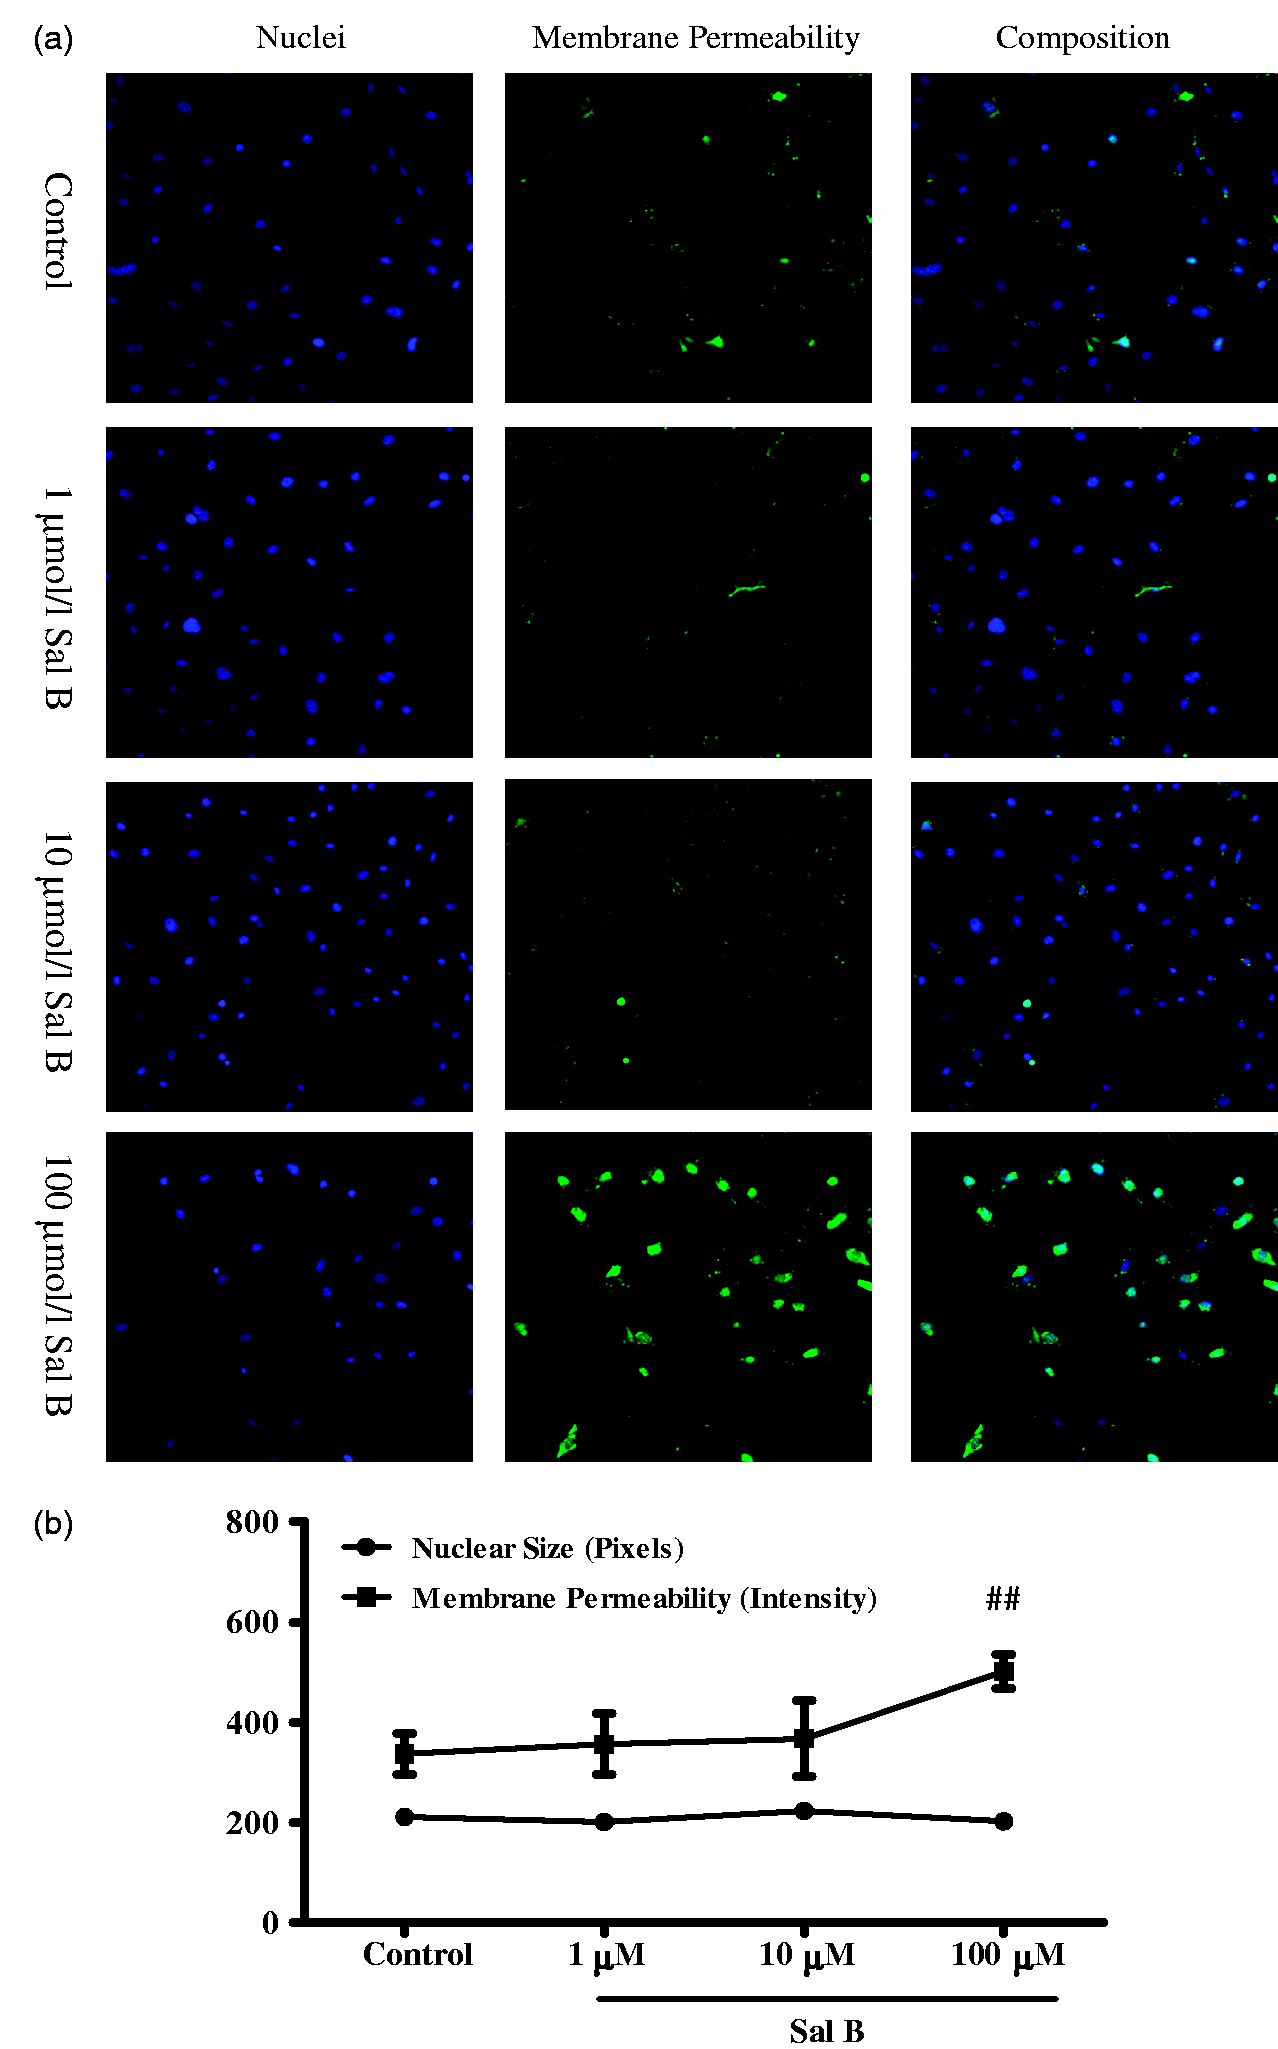
The effects of Sal B on cell proliferation and α-SMA expression of HSCs
Cell proliferation was increased significantly after TGF-β1 incubation, Sal B as well as SB-431542 inhibited cell proliferation, and there were no significant difference between 1 and 10 µmol/L of Sal B (Figure 5).
The effect of Sal B on cell proliferation. After isolation, the cells were cultured for four days, then incubated with 2.5 ng/mL TGF-β1 with or without Sal B for 24 h. SB-431542 (10 mmol/L) was used as positive control. Cell proliferation was tested by EdU assay. (a) Images taken by Cellomics ArrayScan VTI HCS Reader. The nucleus was stained with DAPI (blue), EdU incorporation was visualized by staining with Apollo® 643 (red). (b) Column graph shows % cells staining for EdU compared with DAPI stained nuclei. ##P < 0.01 vs. control, **P < 0.01 vs. TGF-β1. Four wells for each treatment, and 10 fields for each wells were performed for the analysis. (A color version of this figure is available in the online journal)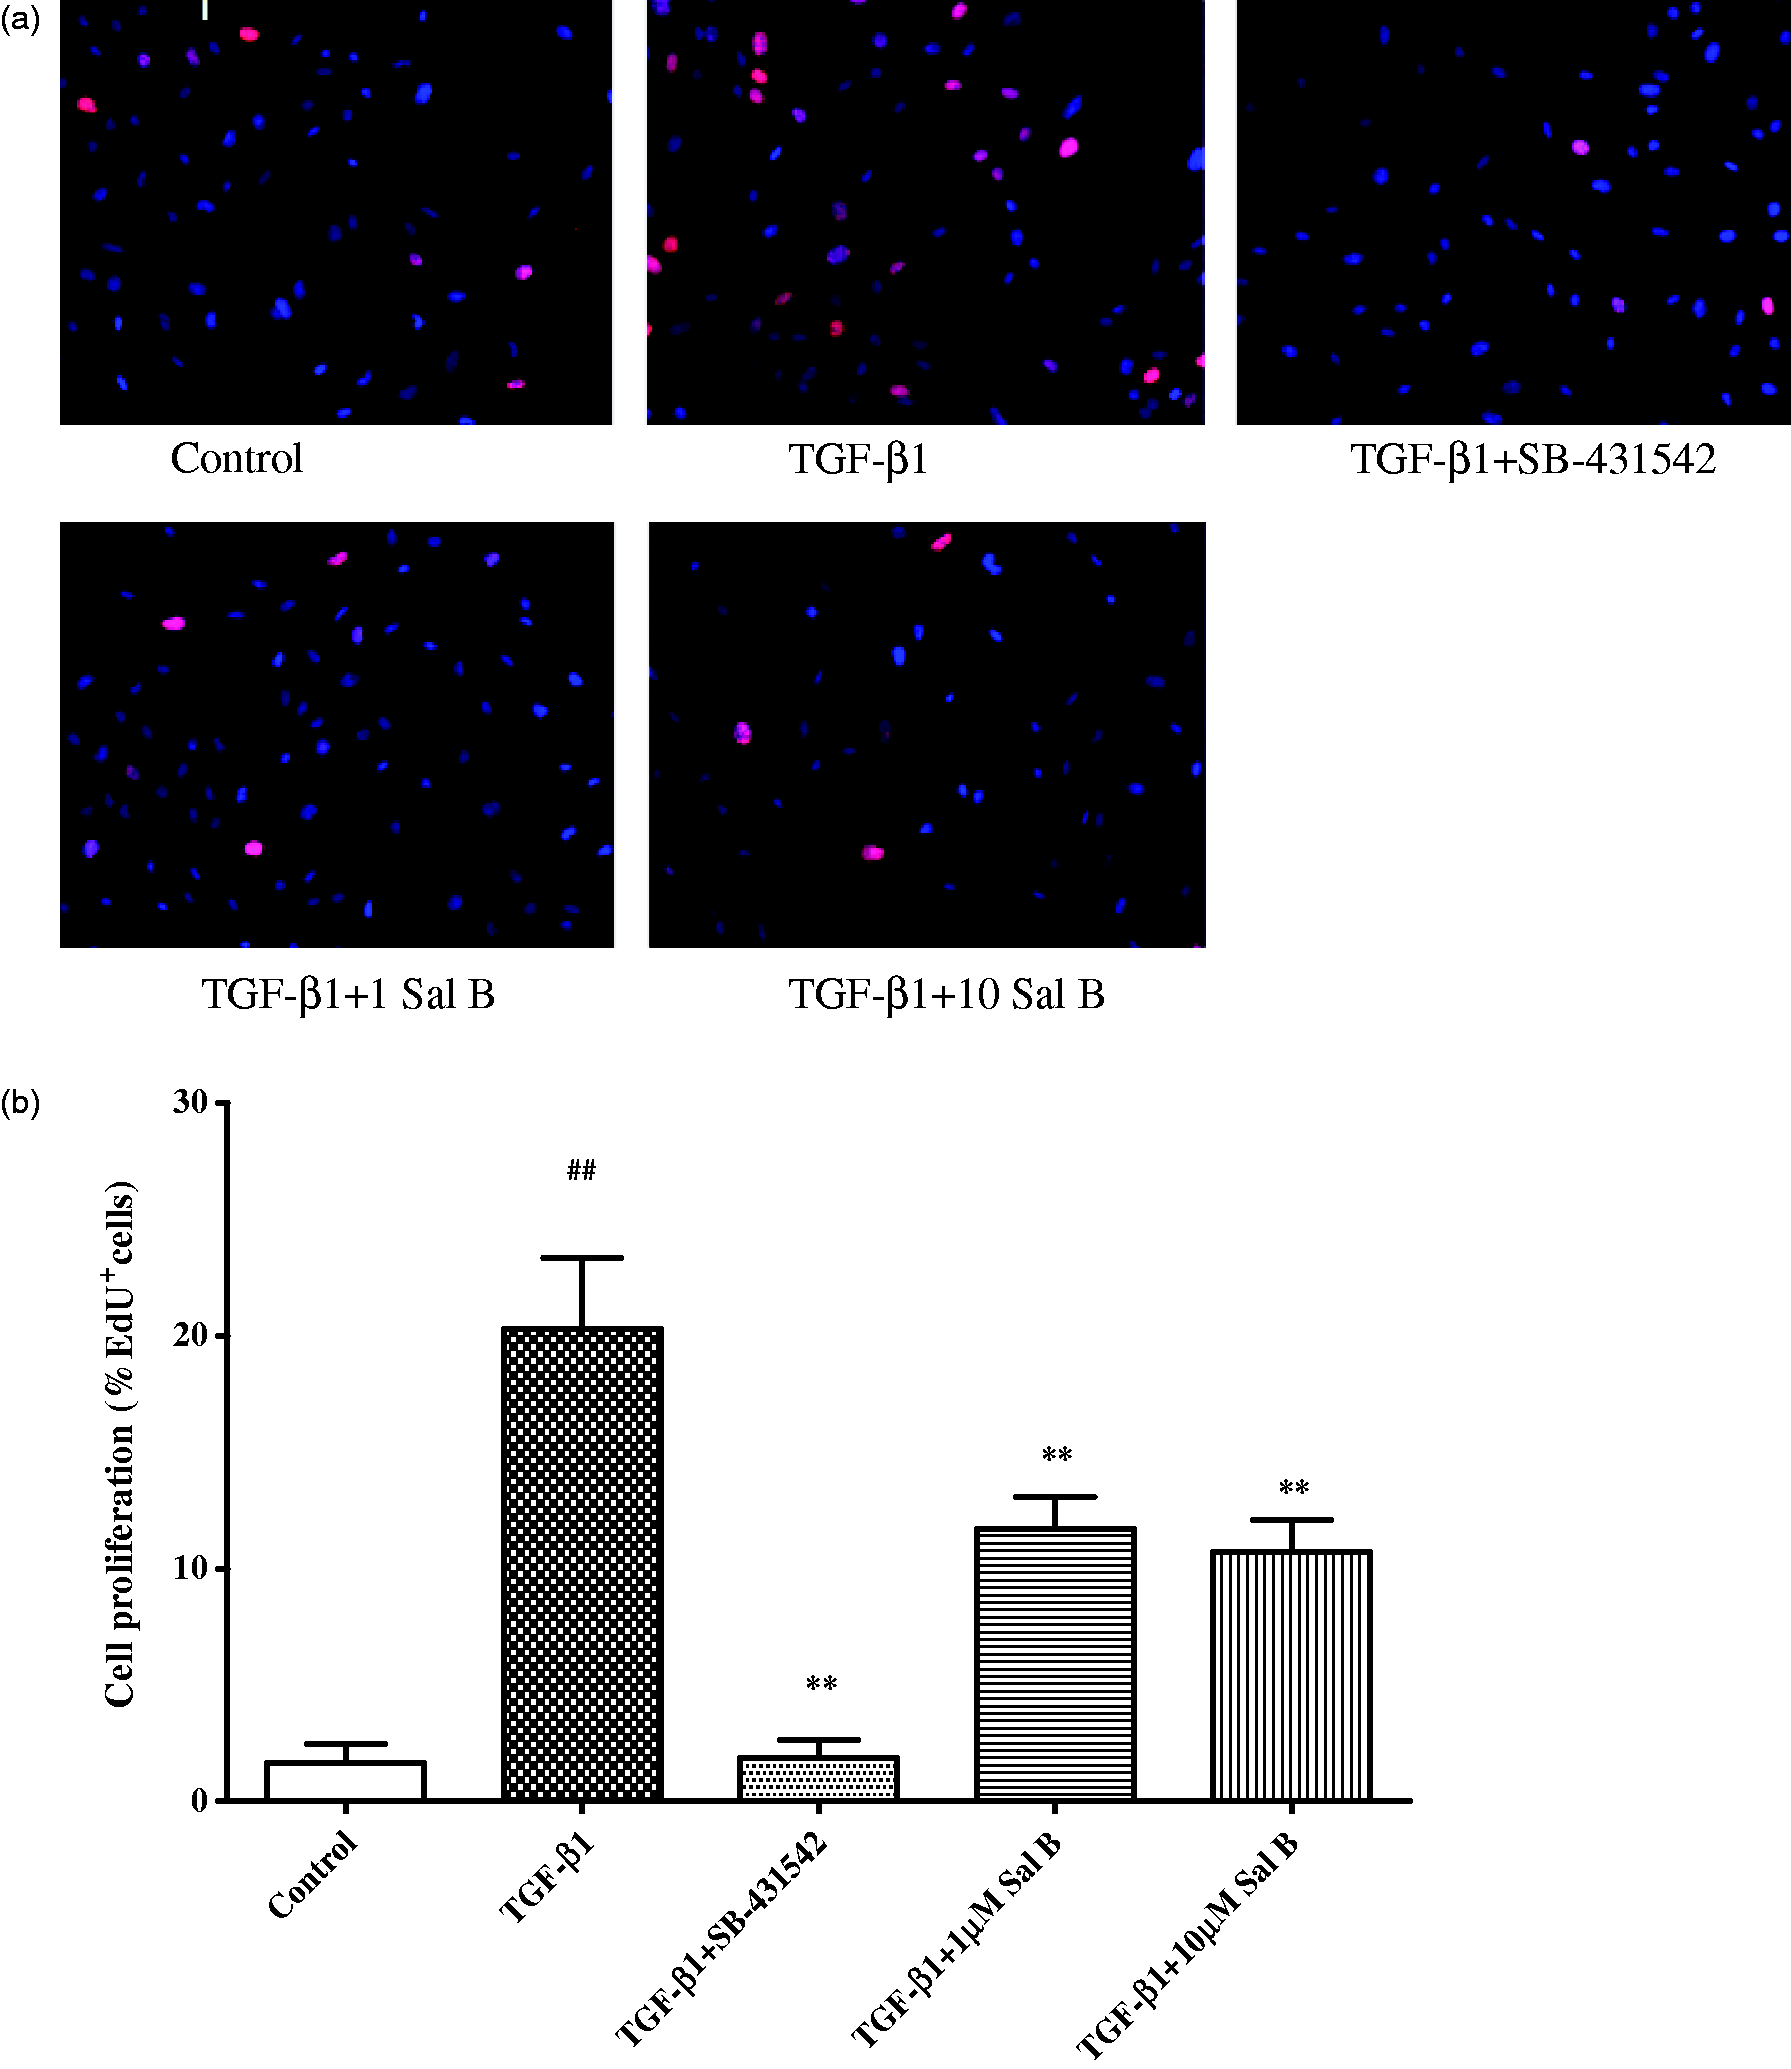
Immunofluorescent stain analysis revealed that the expression of α-SMA was weak in normal HSCs, whereas prominent after TGF-β1 stimulation for 24 h. The expression of α-SMA was significant inhibited by supplement with SB-431542 or 1 or 10 µmol/L Sal B at the same time addition (Figure 6a).
Effect of Sal B on α-SMA expression in HSCs. Four-day primary culture of rat HSCs were incubated with low-serum (0.5% FBS) M199 medium or treated with (1) 2.5 ng/mL TGF-β1, (2) 2.5 ng/mL TGF-β1 plus 1 µmol/L of Sal B, (3) 2.5 ng/mL TGF-β1 plus 10 µmol/L of Sal B, and (4) 2.5 ng/mL TGF-β1 plus 10 µmol/L of SB-431542 for 24 h. (a) Immunofluorescence staining of α-SMA in HSCs showed α-SMA expression upregulation induced by TGF-β1 stimulation, while 1 µmol/L Sal B, 10 µmol/L Sal B and SB-431542 decreased α-SMA expression (×200). (b) Western blotting analysis of α-SMA expression in HSCs. α-SMA expression increased after TGF-β1 stimulation. 1 µmol/L Sal B, 10 µmol/L Sal B and 10 µmol/L SB-431542 down-regulated α-SMA expression. (b) Graphic presentation of the relative expression of α-SMA. The values are represented as the density of α-SMA vs. GAPDH (%) from three samples. #P < 0.05 vs. normal; *P < 0.05 vs. model; **P < 0.01 vs. model. (A color version of this figure is available in the online journal)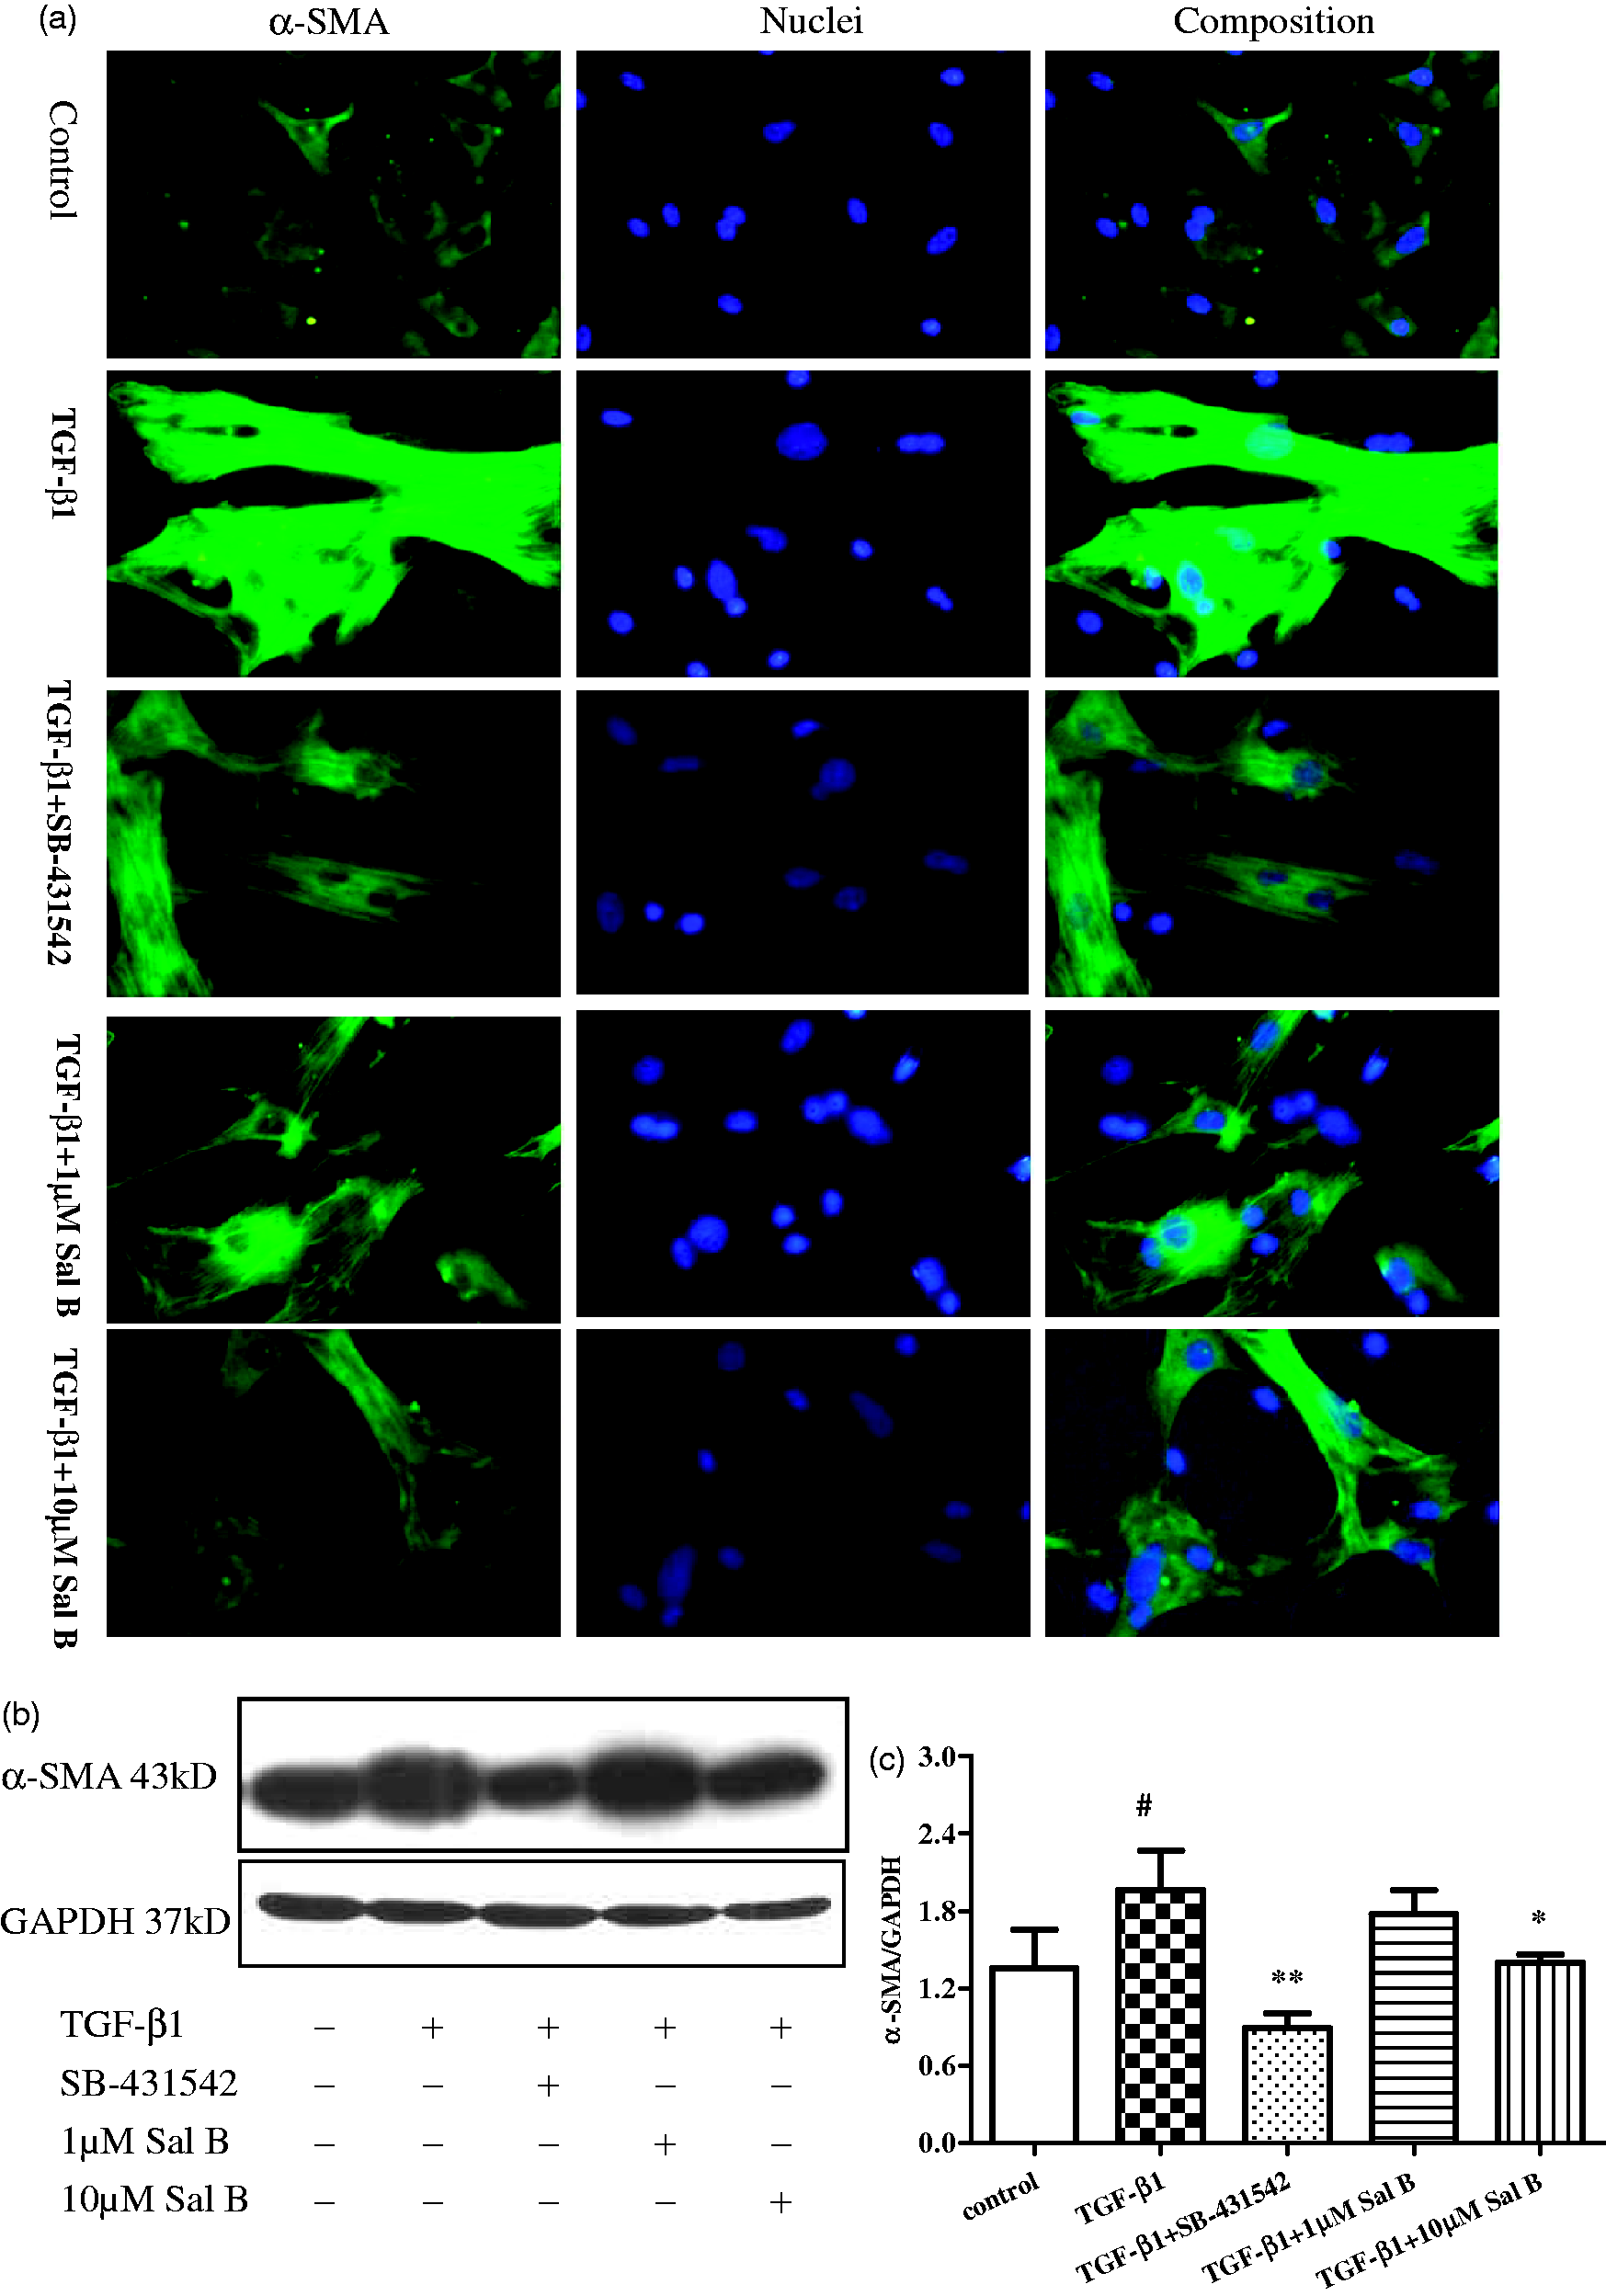
Consistent with the immunohistochemistry, Western blotting analysis revealed that α-SMA expression increased after TGF-β1 stimulation compared with normal HSCs. In contrast, the expressions of α-SMA decreased after treated with SB-431542 and 10 µmol/L of Sal B (Figure 6b).
The effect of Sal B on TβR-I and TβR-II expression in HSC
Western blotting analysis showed that TβR-I protein expression was induced by TGF-β1 stimulation, while TβR-II protein expression had no significant change after TGF-β1 stimulation, both Sal B and SB-431542 decreased TβR-I expression, while it had no significant effect on TβR-II expression (Figure 7a, b).
Effects of Sal B on TβR-I and TβR-II expression in HSCs. Four-day primary culture of rat HSCs were incubated with low-serum (0.5% FBS) M199 medium or treated with (1) 2.5 ng/mL TGF-β1, (2) 2.5 ng/mL TGF-β1 plus 1 µmol/L of Sal B, (3) 2.5 ng/mL TGF-β1 plus 10 µmol/L of Sal B, and (4) 2.5 ng/mL TGF-β1 plus 10 µmol/L of SB-431542 for 24 h. (a) Western blotting analyses of TβR-I and TβR-II protein expressions. The results revealed TβR-I expression was induced by TGF-β1 stimulation, while TβR-II expression had no significant change after TGF-β1 stimulation. Sal B of 1 and 10 µmol/L concentrations as well as SB-431542 treatments decreased TβR-I expression, while it had no significant effect on TβR-II expression. (b) Graphic presentation of the relative expressions of TβR-I, TβR-II, and SARA. The values are represented as the density of TβR-I vs. GAPDH (%) from three independent experiments. *P < 0.05 vs. normal; #P < 0.05 vs. model. (c) Real-time PCR analysis showed TGF-β1 significantly upregulated TβR-I mRNA expression in HSCs, while 1 and 10 µmol/L of Sal B and SB-431542 significantly blocked the process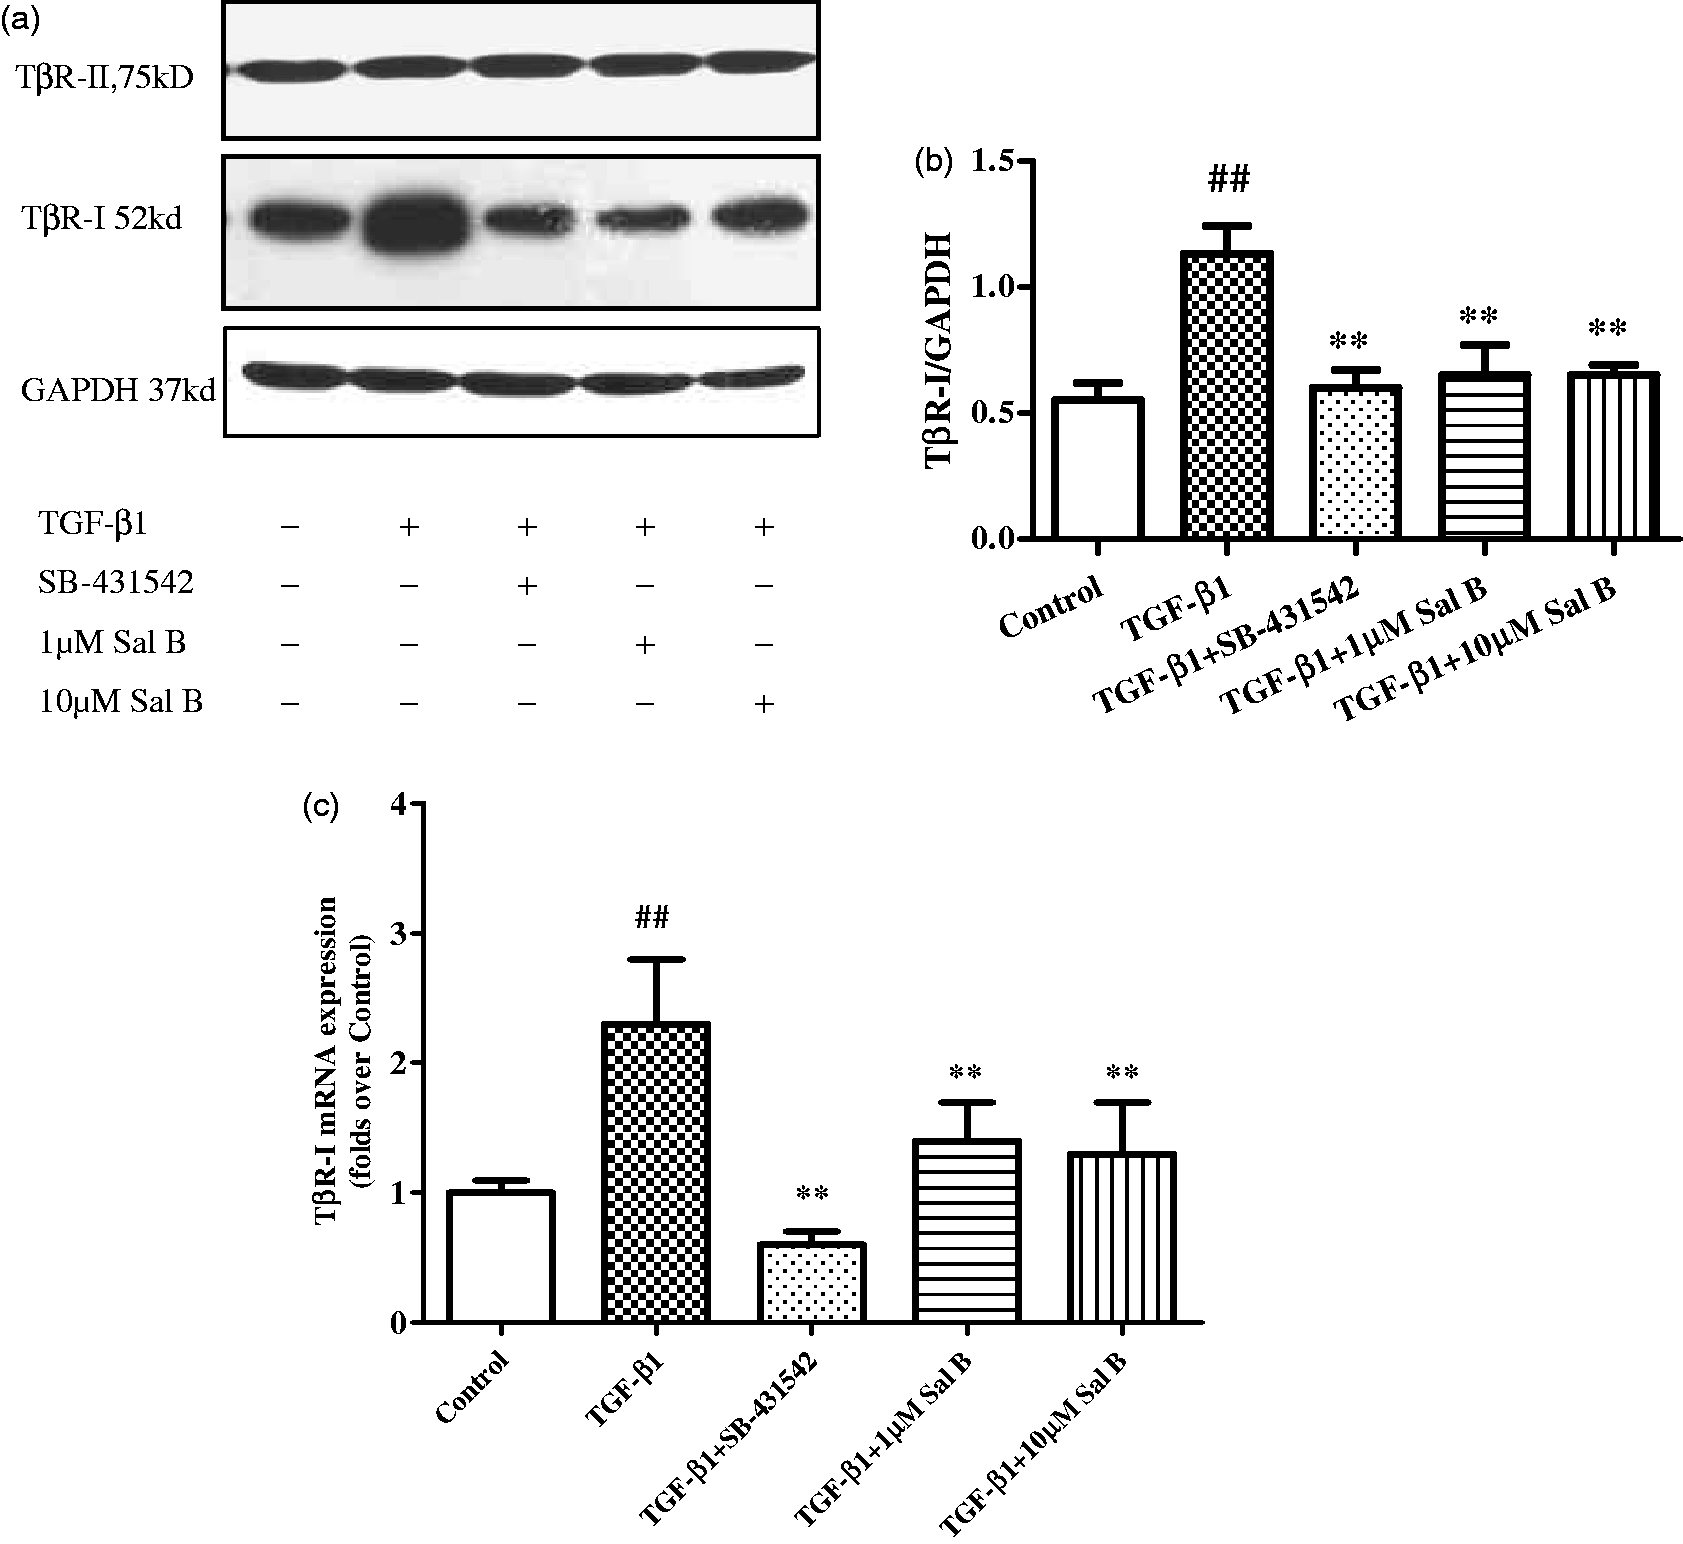
Consistent with the expression of TβR-I protein, the result of real-time PCR revealed that the expression of TβR-I mRNA was prompted by TGF-β1. However, both Sal B and SB-431542 could decrease the expression of TβR-I mRNA (Figure 7c).
The effect of Sal B on the activity of TβR-I kinase
The inhibitory effect of Sal B on TβR-I kinase activity was determined by ADP-Glo™ Kinase Assay. ADP-Glo™ Kinase Assay is a luminescent kinase assay that measures ADP formed from a kinase reaction; ADP is converted into ATP, which is converted into light by Ultra-Glo™ Luciferase. The luminescent signal positively correlates with kinase activity.
The results showed that Sal B could inhibit the activity of TβR-I kinase in a concentration-dependent manner, with the IC50 of 2.5 µmol/L (Figure 8).
The inhibitory effect of Sal B on TβRI kinase activity was determined by ADP-Glo Kinase assay kit. Sal B was diluted serially in three-fold dilution from 1000/3 to 1000/38 µmol/L. The results showed that Sal B inhibited TβR-I kinase activity in a dose-dependent manner, with the IC50 of 2.5 µmol/L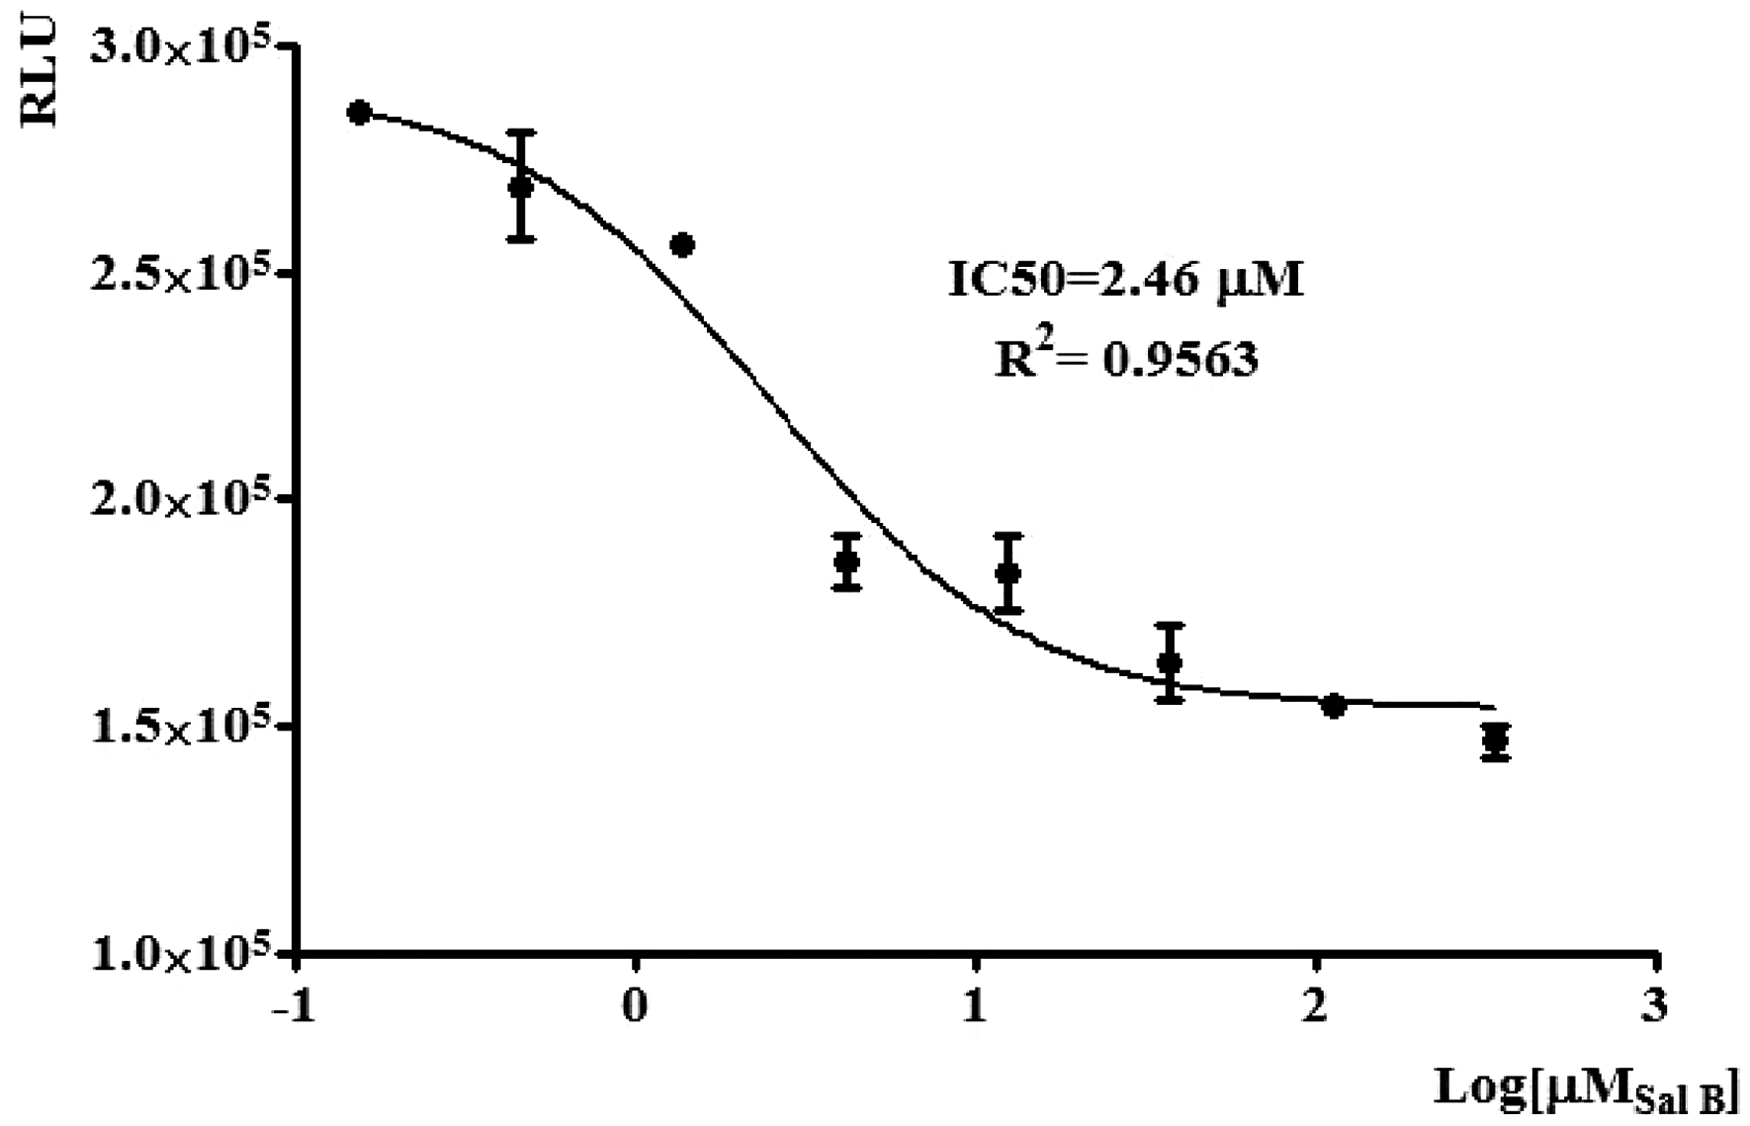
The effect of Sal B on Smad3, p-Smad3 expression, and Smad3 nuclear translocation
Immunofluorescent stain analysis also showed that Smad3 was expression in cytoplasm, and Smad3 expression in nuclear was lower. TGF-β1 significantly stimulated Smad3 nuclear translocation, and Sal B and SB-431542 significantly inhibited Smad3 nuclear translocation induced by TGF-β1 (Figure 9a, b).
The effects of Sal B on Smad3, p-Smad3 expression, and Smad3 nuclear translocation. Four-day old primary culture of rat HSCs were incubated with low-serum (0.5% FBS) M199 medium or treated with (1) 2.5 ng/mL TGF-β1, (2) 2.5 ng/mL TGF-β1 plus 1 µmol/L of Sal B, (3) 2.5 ng/mL TGF-β1 plus 10 µmol/L of Sal B, and (4) 2.5 ng/mL TGF-β1 plus 10 µmol/L of SB-431542 for 24 h. (a) Immunofluorescent stain of Smad3. (b) Smad3 nuclear translocation analysis using image-pro plus 6.1 software. The values are represented as the Smad3 average fluorescent intensity in nucleus. #P < 0.05 vs. control; *P < 0.05 vs. TGF-β1. (c) Western blotting analysis of Smad3 and p-Smad3 expression. (d) Graphic presentation of the relative expression of p-Smad3. The values are represented as the density of p-Smad3 vs. Smad3 (%) from three independent experiments. ##P < 0.01 vs. control; *P < 0.05 vs. TGF-β1; **P < 0.01 vs. TGF-β1. (A color version of this figure is available in the online journal) Continued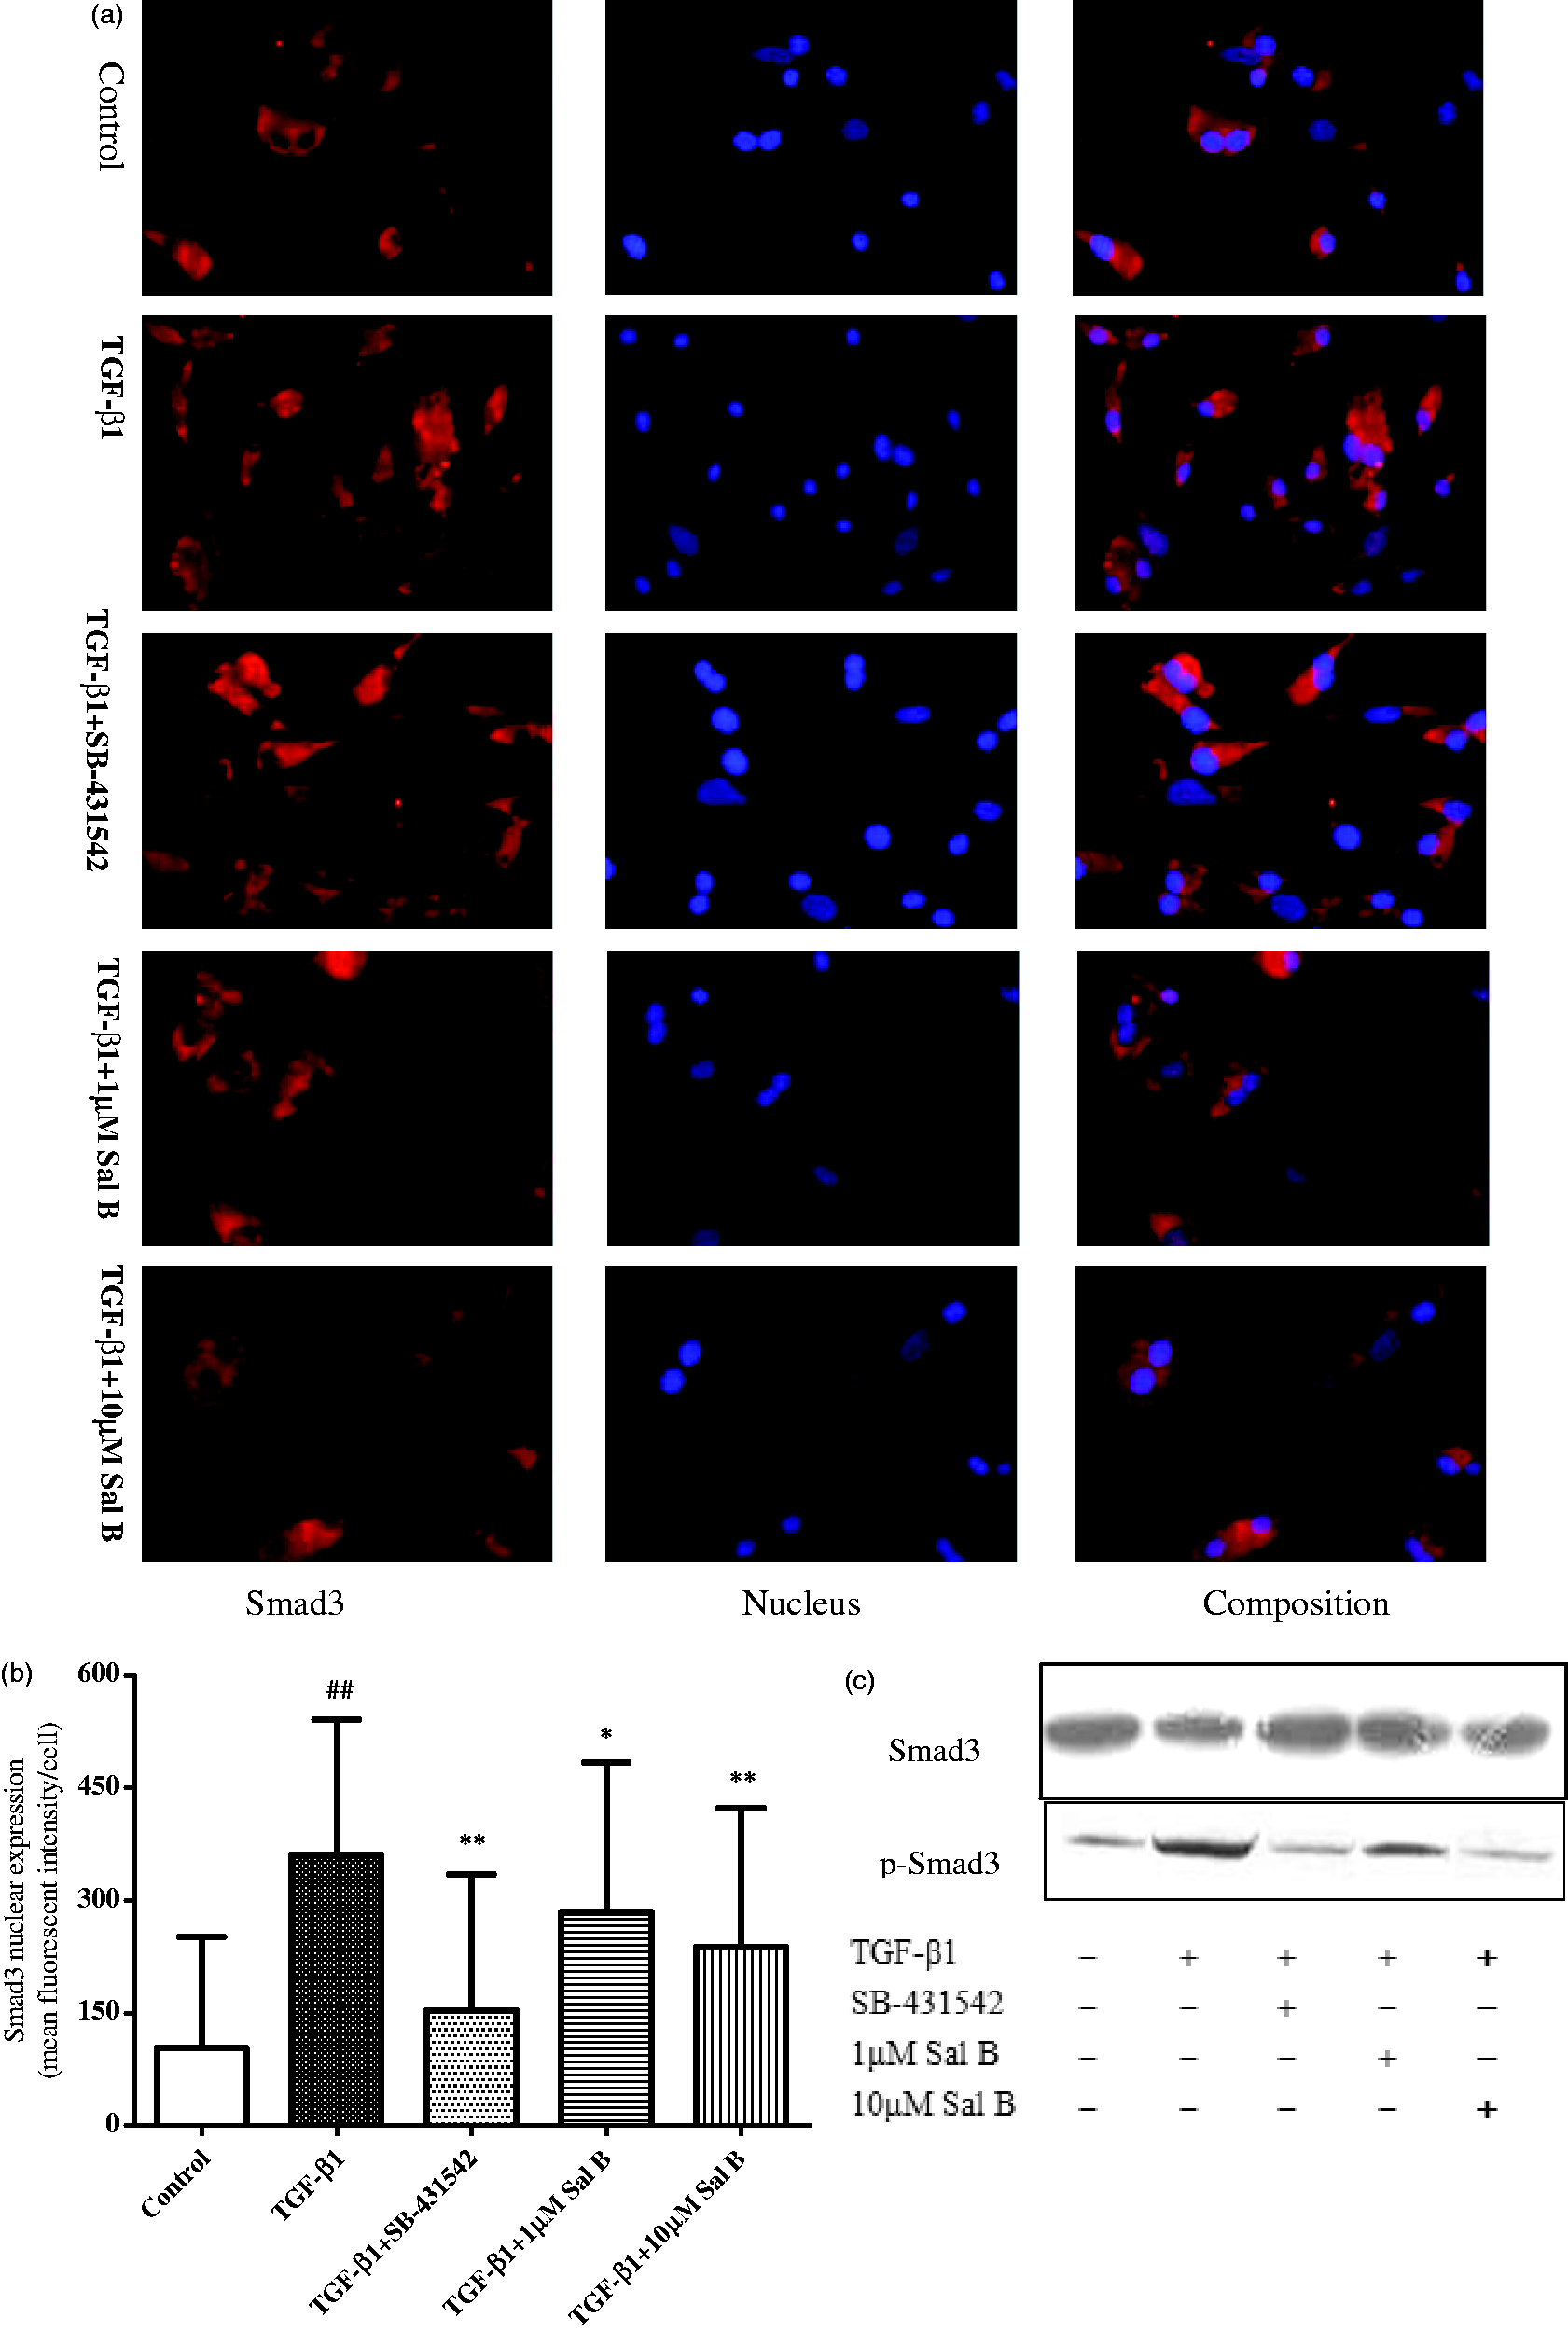
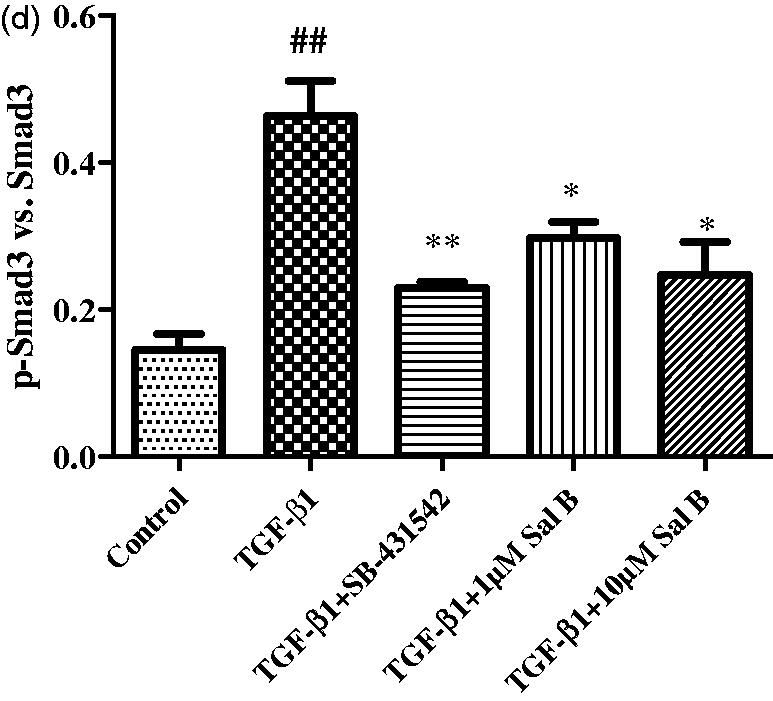
Western blotting analysis showed that no significant change of total Smad3 expression was found after TGF-β1 stimulation, and Sal B and SB-431542 treatment had no effect on total Smad3 expression. While significant upregulation of p-Smad3 was found after TGF-β1 stimulation, and Sal B and SB-431542 treatment down-regulated its expression (Figure 9c, d).
Discussion
Liver fibrosis, a precursor of cirrhosis, is a common and important pathological feature of chronic liver diseases. Current treatment of liver fibrosis is limited to withdrawal of the aetiological agent, which may prevent fibrosis progression and induce its regression. 16 Major advances have been made in this respect during the past decade, with the advent of efficient antiviral treatments for hepatitis B and C. Nevertheless, suppression of the cause of hepatic injury is not always feasible. 16 Thus, efforts to understand and attenuate fibrosis have direct clinical implications. 2 Traditional Chinese medicine has a rich experience in treating chronic liver diseases over thousands of years, and some herbal medicine and extracts have been proved to have good properties of anti-liver fibrosis.17–19
Our previous studies suggested that Sal B could have an mechanism of action related to TGF-β/Smads signalling in HSCs. It was also showed that Sal B exerted an antihepatic fibrosis effect via down-regulating Ang II signalling in HSCs activation 20 and inhibits ERK pathway 21 and p38 signalling 22 in HSCs. In this study, we further investigated the molecular mechanisms of action of Sal B on liver fibrosis relating to TGF-β/Smads signalling pathway, especially to TGF-β1 receptors expression and functions.
In this study, DMN-induced liver fibrosis in rats was a reproducible model for studying the pathogenesis of liver fibrosis and cirrhosis.23,24 DMN-intoxication for four weeks produced fully developed cirrhosis in rats; the hepatic Hyp content was higher in model rats than that of normal rats. Compared with that of model group, level of Hyp in liver tissue decreased significantly and hepatic inflammation and collagen deposition obviously improved in Sal B treatment group. These results reconfirmed that Sal B had a good effect against liver fibrosis. In addition, we found that Sal B could inhibit the protein expressions of TGF-β1 and TGF-β receptor I (TβR-I), which indicated that regulating TGF-β1 signalling transduction might be one of the mechanisms of Sal B anti-fibrosis.
Liver fibrosis is a complicated pathological process in which multiple components including HSCs, hepatocytes, KCs, and various cytokines and fibrotic matrix proteins are actively involved. There is overwhelming evidence that activated HSCs are the major producers of the fibrotic matrix. 25 HSCs are quiescent and non-proliferative in the normal liver. After acute or chronic injury, they become activated, developing a myofibroblast-like phenotype associated with increased proliferation and collagen synthesis, accompanied with expressing activation markers (e.g. α-smooth muscle actin, α-SMA). 26 This phenotypic change, termed ‘activation’, has been modelled in vitro by culturing HSCs on uncoated plastic. Freshly isolated HSCs appear small, round and undifferentiated, traditionally termed ‘quiescent’, whereas cells grown on uncoated plastic for 5–7 days become elongated and dendritic in shape, termed ‘activated’. 27 In response to TGF-β1, culture-activated cells produce ECM that is similar in composition with that seen in fibrotic liver,4,28–30 which provides a good model for elucidating underlying mechanisms of HSCs activation and for studying possible therapeutic interventions in the process.
TGF-β1 is known to be the most potent fibrogenic cytokine, which mediates HSCs activation. Moreover, activated HSCs can secrete TGF-β1 itself, which helps to perpetuate HSCs activation. In our experiment, four-day old primary culture of rat HSCs was further activated by TGF-β1. The results showed that TGF-β1 could activate HSCs, promote cell proliferation and α-SMA expression, and Sal B suppressed cell proliferation and α-SMA expression, confirming that Sal B could inhibit HSCs activation.
The biological responses of TGF-β1 are primarily depending on the regulation via TGF-β receptor and Smads signalling pathway. The type II receptor of TGF-β (TβR-II) 31 binds the ligand TGF-β1 at its extracellular domain, causes the formation of heteromeric complexes incorporating type I (TβR-I), and trans-phosphorylates the TβR-I, resulting in the activation of TβR-I kinase. Then, serine/threonine kinase of TβR-I phosphorylates Smad2 or Smad3, which are specific for the signalling pathways of TGF-β. Phosphorylated Smad 2 and 3 form heteromeric complexes with Smad4, a Smad common to the signalling pathways of multiple TGF-β superfamily members, and move into the nucleus where they join other transcription factors to form transcriptionally active complexes. 32 Thus, the TβR-I appears to be essential for the biological activity of TGF-β, which is closely related to its serine/threonine kinase activity.
In this study, TβR-I protein and mRNA expressions were increased in HSCs stimulated by TGF-β1, Sal B and SB-431542, a potent and specific inhibitor of TβR-I kinase, decreased TβR-I expression. The activity of TβR-I kinase was determined by ADP-Glo™ Kinase Assay. ADP-Glo™ Kinase Assay is a luminescent kinase assay that measures ADP formed from a kinase reaction; ADP is converted into ATP, which is converted into light by Ultra-Glo™ Luciferase. The luminescent signal positively correlates with kinase activity. Inhibition of kinase activity by a specific compound reduces the amount of luminescence. Our results showed that Sal B inhibited TβR-I kinase activity in a concentration-dependent manner, with the IC50 of 2.5 µmol/L. In the study, there was no obvious change of TβR-II expression between the normal and fibrotic livers, and Sal B had no effect on TβR-II expression. It was reported that TGF-β1 and TβR-I mRNAs in biopsy samples of liver from patients with chronic hepatitis C were significantly increased, while TβR-II mRNA was significantly decreased, and the ratio of TβR-II to TβR-I was decreased. 33 Our data also showed that Sal B upregulated the ratio of TβR-II to TβR-I by inhibiting TβR-I kinase, which might suggest that the regulation of TβR-II/TβR-I ratio could have a meaning for its action on TGF-β signalling in HSCs activation.
In conclusion, the molecular mechanism of action of Sal B against liver fibrosis was possibly related to the regulation of TGF-β1 signalling transduction by inhibiting the expression of TβR-I and activity of TβR-I kinase, suppressing Smad3 activation in HSCs.
Footnotes
Author contributions
CH Liu designed the project; YY Tao, L Shen and WW Fu performed experiments; QL Wang analyzed data; and YY Tao and QL Wang prepared the manuscript, CH Liu made a critical revision.
Acknowledgments
This work was supported by the following grants: National Natural Science Foundation of China (NO. 81173405, 81102701 and 81270053), Leading Academic Discipline of Hepatology and Key Disciplines of Liver and Gall Bladder Diseases of State Administration of TCM China (no. 2010sh), National Key New Drugs Creation Project, Innovative drug research and development technology platform (NO. 2012ZX09303009-001), Shanghai Municipal Natural Science Foundation (10ZR1431000), Innovation Program of Shanghai Municipal Education Commission (11YZ63), ZYSNXD-CC-YJXYY, E-Institute (E03008) and Innovative Research Team in Universities of Shanghai Municipal Education.