
Abstract
Introduction
Doxorubicin (Dox) due to its unmatched efficacy and broad-spectrum effects is a highly successful chemotherapeutic agent for malignant neoplasms but its usefulness is limited by acute and chronic dose related, cumulative, and essentially irreversible toxicities. Published reports show Dox to induce generation of both reactive oxygen species (ROS) and reactive nitrogen species (RNS), which engage in the interplay of a number of processes including redox cycling of the quinone moiety of Dox, disturbance of iron metabolism and Dox. 1 Since, quinone moiety is capable of undergoing one-electron redox reactions by redox cycling. In this process, “Dox quinone” is converted to “Dox semiquinone” by accepting an electron from an oxidant; in the presence of oxygen, this semiquinone is converted back to its native “Dox quinone,” producing superoxide (O2−) as a byproduct.2,3 O2− can damage biological components directly, as well as being converted to more reactive ROS/RNS. Further, Dox-induced toxicity has also been believed to be mediated through formation of free radicals, lipid peroxidation of membranes, and iron-dependent oxidative damage to biological macromolecules.4–7
In view of the fact that, widespread free radical production is likely to overcome antioxidant security, the activation of free radical-induced hostile reactions could be protected by antioxidants that are expected to reduce the intracellular level of ROS. This increase in oxidative stress and depletion of endogenous antioxidants triggers immense immune response.7,8
Inflammation is an intricate process mediated by the activation of various immune cells. Macrophages play a central role in mediating many different immune-pathological phenomena during inflammation, including the overproduction of pro-inflammatory cytokines and inflammatory mediators, such as interleukin IL-1β, IL-6, tumor necrosis factor-alpha (TNF-α), and nitric oxide (NO) synthesized by inducible NO synthase (i-NOS), and prostaglandin PGE-2 synthesized by cyclo-oxygenase-2 (COX-2).9,10 Many studies have reported increased tissue content of inflammatory mediators together with inflammatory cell infiltration, signifying that inflammation plays a significant role in Dox-induced renal injury.11,12 Dox increases levels of the proinflammatory cytokine TNF-α in the periphery, which can migrate into tissues and stimulate local inflammation and oxidative stress, 13 eventually leading to cellular apoptosis and, possibly appearance of side effects. 8
Various studies have investigated the link between Dox and nuclear factor kappa B (NFκB). NFκB regulates genes that are involved in the control of the inflammatory responses and immune responses. NFκB is recognized to be an important redox-sensitive transcriptional factor that regulates transcription of genes encoding inflammatory cytokines, adhesion molecules, and chemokines. TNF-α is a vital member in a network of proinflammatory chemokines and cytokines activated in the kidney by Dox. Inhibition of TNF-α action prevents the activation of this cytokine network and provides defense against Dox nephrotoxicity. 14 NO levels have also been modulated by the use of Dox treatment. 8 Dox treatment has also been reported to induce COX-2 expression in vitro and in vivo models. 15
Dietary natural products have shown protection against various degenerative diseases including cancer and in the present era, they are therapeutically importance because of the virtue of their anti-oxidant and anti-inflammatory potential. Epidemiological findings also implicate that substantial intake of fruits and vegetables in the diet have protective effects against different types of pathologies. 16 Natural products with anti-oxidant and anti-inflammatory activities are known to exhibit protection against Dox-induced toxicities. Sylimarin, 17 Lycopene, 18 Zingiber officinale, 19 Solanum torvum, 20 and Resveratrol 21 were found to protect against Dox-induced nephrotoxicity.
The goal of this study was to examine the effects of
Materials and methods
Chemicals
Reduced glutathione (GSH), oxidized glutathione (GSSG), reduced nicotinamide adenine dinucleotide phosphate (NADPH), NADP+, FAD, ethylene diamine tetra acetic acid (EDTA), thiobarbituric acid (TBA), pyrogallol, poly-
Experimental design
To study the effect of prophylactic treatment with Schematic representation of experimental design. (A color version of this figure is available in the online journal)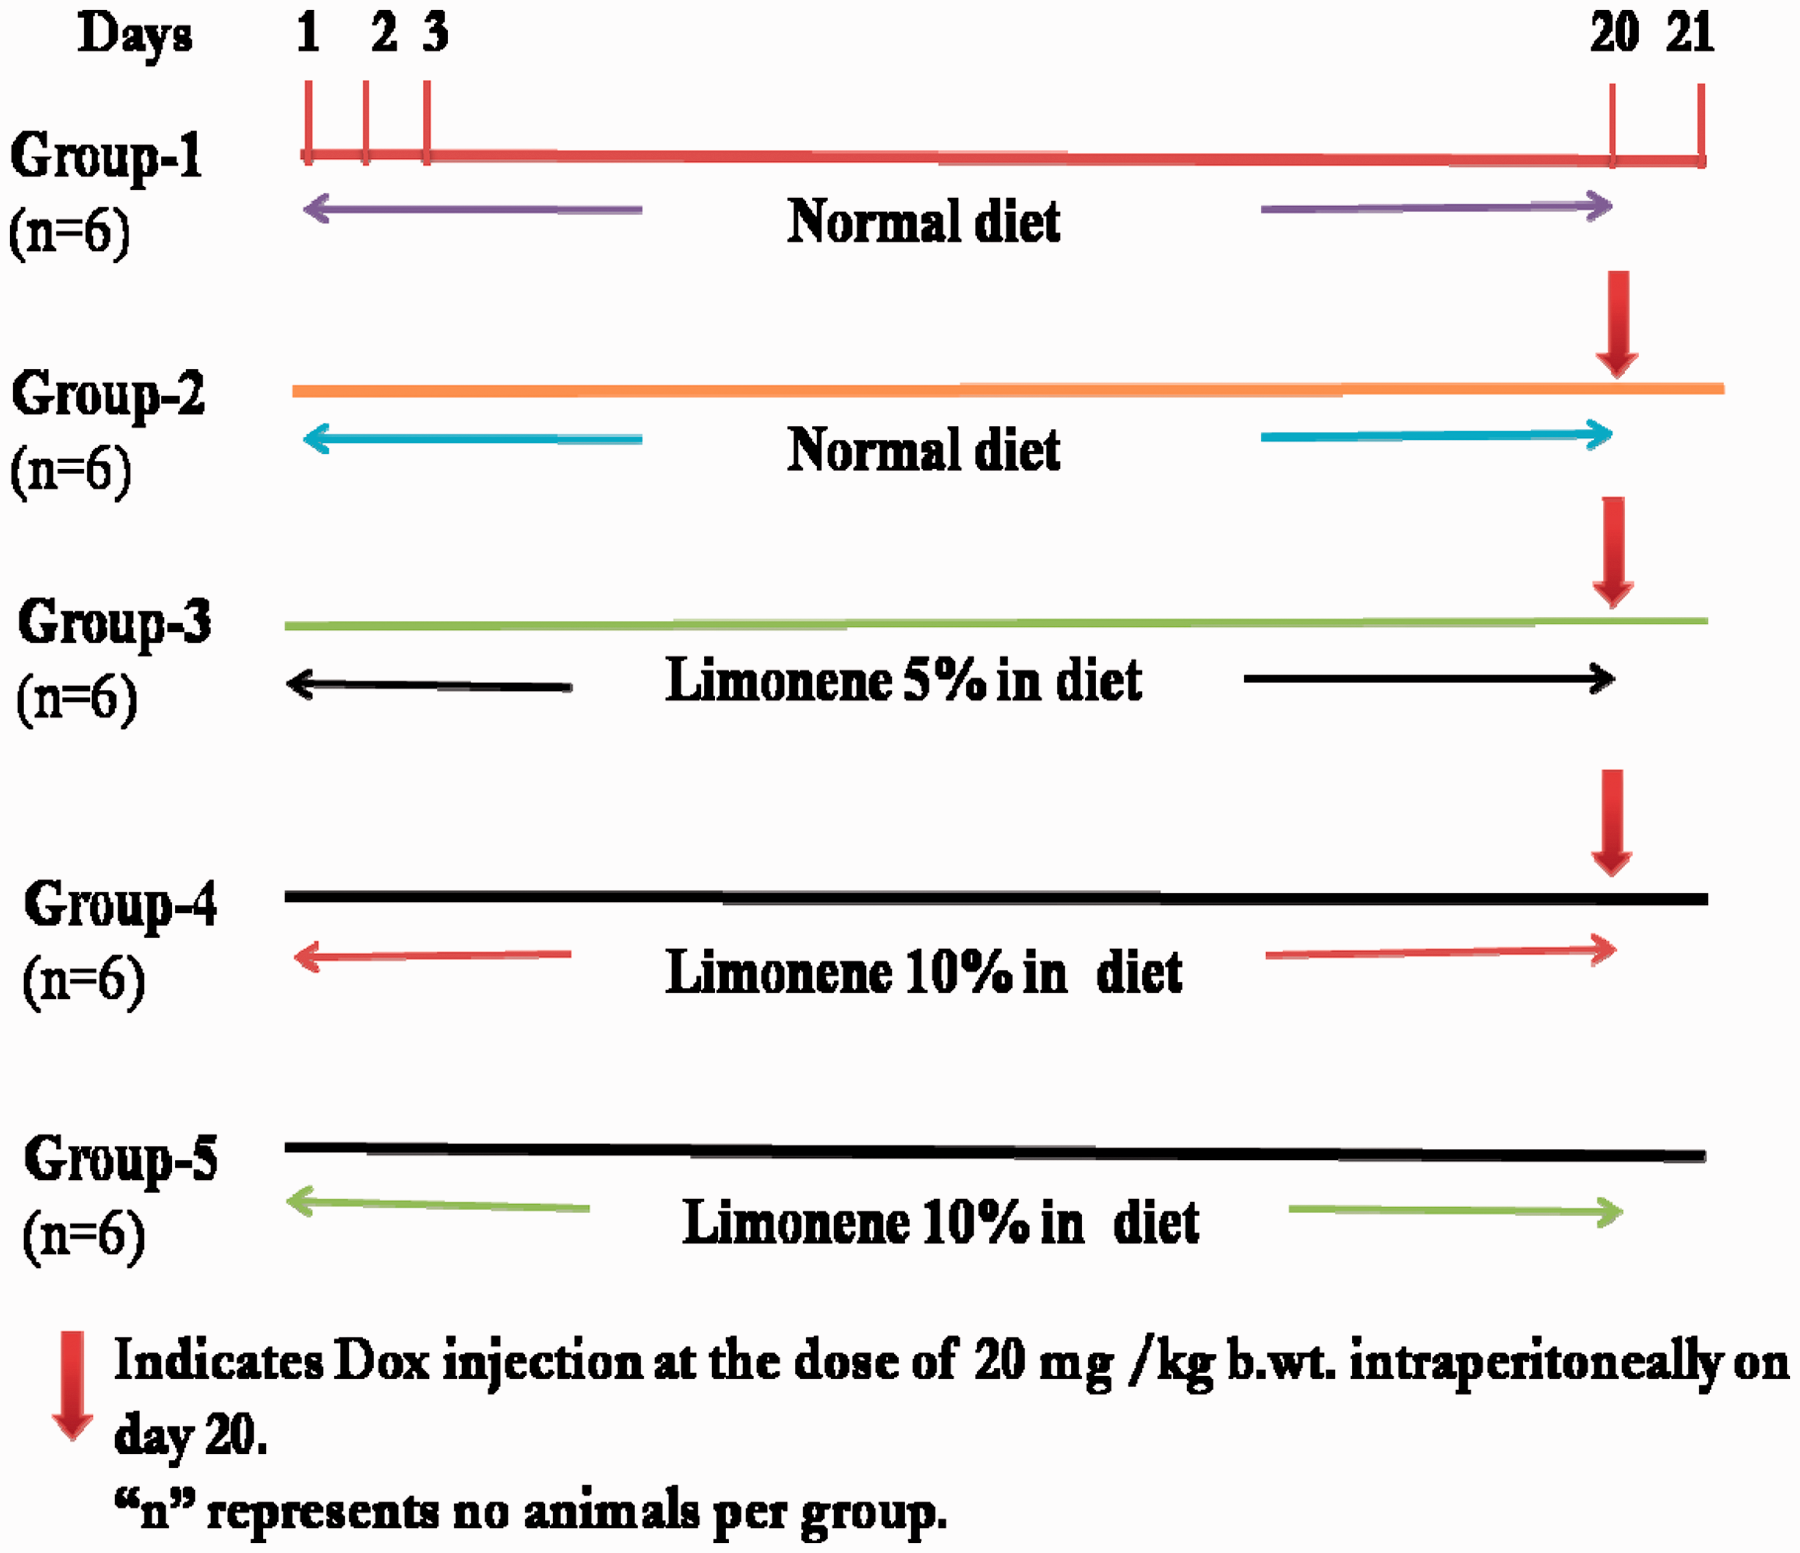
Postmitochondrial supernatant preparation and estimation of different parameters
Kidneys were removed quickly, cleaned free of irrelevant material and immediately perfused with ice-cold saline (0·85% NaCl). The kidneys (10% w/v) were homogenized in chilled phosphate buffer (0.1 M, pH 7.4) using a Potter Elvehjen homogenizer. The homogenate was filtered through muslin cloth, and centrifuged at 3000 rpm for 10 min at 48℃ in a Remi Cooling Centrifuge (C-24 DL) to separate the nuclear debris. The aliquot so obtained was centrifuged at 12,000 rpm for 20 min at 4℃ to obtain post mitochondrial supernatant (PMS), which was used as a source of various enzymes.
Assay for catalase activity
Catalase activity was assayed by the method of Claiborne. 30 The reaction mixture consisted of 1.95 mL phosphate buffer (0.1 M, pH 7.4), 1.0 mL hydrogen peroxide (0.10 mM), and 0.05 mL 10% PMS in a final volume of 3 mL. Changes in absorbance were recorded at 240 nm. Catalase activity was calculated as nmol H2O2 consumed/min mg protein.
Assay for glutathione-S-transferase activity
Glutathione-S-transferase (GST) activity was estimated by the method of Habig et al. 31 The reaction mixture consisted of 1.525 mL phosphate buffer (0.1 M, pH 7.4), 0.2 mL reduced glutathione (1 mM), 0.025 mL 1-chloro 2, 4-dinitrobenzene (CDNB) (1 mM), and 0.250 mL PMS (10% w/v) in a total volume of 2.0 mL. The changes in the absorbance was recorded at 340 nm and enzymes activity was calculated as nmol CDNB conjugate formed min−1 mg−1 protein using a molar coefficient of 9.6 × 10³ M−1cm−1.
Activity of reduced glutathione (GSH)
Reduced glutathione was determined by the method of Jollow et al. 32 Sample of PMS (1.0 mL) was precipitated with 1.0 mL of sulphosalicylic acid (4%). The samples were kept at 4℃ for 1 h and then centrifuged at 3000 rpm for 20 min at 4℃. The assay mixture contained 0.4 mL supernatant, 2.2 mL phosphate buffer (0.1 M, pH 7.4), and 0.4 mL 5, 5′-dithio bis-[2-nitrobenzoic acid] (10 mM) in a total volume of 3.0 mL. The yellow color developed, was read immediately at 412 nm on spectrophotometer and GSH was expressed as n mol GSH/g tissue.
Activity of glutathione peroxidase
Glutathione peroxidase (GPx) activity was estimated by the method of Mohandas et al. 33 The reaction mixture consisted of 1.49 mL phosphate buffer (0.1 M, pH 7.4), 0.1 mL EDTA (1 mM), 0.1 mL sodium azide (1 mM), 0.05 mL GR (1 IU/mL), 0.05 mL GSH (1 mM), 0.1 mL NADPH (0.2 mM), 0.01 mL H2O2 (0.25 mM), and 0.1 mL 10% PMS in a total volume of 2 mL. The disappearance of NADPH at 340 nm was recorded at 25℃. Enzyme activity was calculated as n mol NADPH oxidized per minute per mg protein using molar extinction coefficient of 6.22 × 10³ M−1 cm−1.
Assay of xanthine oxidase
The activity of xanthine oxidase (XO) was assayed by the method of Stripe and Della Corte. 34 The reaction mixture consisted of 0.2 mL PMS that was incubated for 5 min at 37℃ with 0.8 mL phosphate buffer (0.1 M, pH 7.4). The reaction was started by adding 0.1 mL xanthine (9 mM) and kept at 37℃ for 20 min. The reaction was terminated by the addition of 0.5 mL ice-cold perchloric acid (10% v/v). After 10 min, 2.4 mL of distilled water was added and centrifuged at 4000 rpm for 10 min and µg uric acid formed per minute per mg protein was recorded at 290 nm.
Measurement of superoxide dismutase activity
The superoxide dismutase (SOD) activity was measured by the method of Marklund and Marklund. 35 The reaction mixture consisted of 2.875 mL Tris–HCl buffer (50 mM, pH 8.5), pyrogallol (24 mM in 10 mM HCl) and 100 µL PMS in a total volume of 3 mL. The enzyme activity was measured at 420 nm and was expressed as units/mg protein. One unit of enzyme is defined as the enzyme activity that inhibits auto-oxidation of pyrogallol by 50%.
Estimation of lipid peroxidation
The assay for microsomal lipid peroxidation was done following the method of Wright et al. 36 The reaction mixture in a total volume of 1.0 mL contained 0.58 mL phosphate buffer (0.1 M, pH 7.4), 0.2 mL homogenate, 0.2 mL ascorbic acid (100 mM), and 0.02 mL ferric chloride (100 mM). The reaction mixture was incubated at 37℃ in a shaking water bath for 1 h. The reaction was stopped by addition of 1.0 mL 10% trichloroacetic acid (TCA). Following addition of 1.0 mL 0.67% TBA, all the tubes were placed in boiling water-bath for 20 min and then shifted to crushed ice-bath before centrifuging at 4500 rpm for 10 min. The amount of malondialdehyde formed in each of the samples was assessed by measuring optical density of the supernatant at 535 nm using spectrophotometer (Milton Roy 21 D) against a reagent blank. The results were expressed as nmol MDA formed per hour per gram tissue at 37℃ using molar extinction coefficient of 1.56 × 10⁵ M−1 cm−1.
Measurement of GR activity
The GR activity was measured by the method of Carlberg and Mannervik. 37 The assay system containing 1.65 mL phosphate buffer (0.1 M, pH 7.6), 0.1 mL EDTA (0.5 mM), 0.05 mL oxidized glutathione (1.0 mM), 0.1 mL NADPH (0.1 mM), and 0.1 mL PMS (10%) in a total volume of 2.0 mL. The enzyme activity was recorded at 25℃ by measuring the disappearance of NADPH at 340 nm and was calculated as µmol NADPH oxidized/min/mg protein using molar extinction coefficient of 6.22 × 10³ M−1 cm−1.
Measurement of quinone reductase activity
The quinone reductase (QR) activity was determined by the method of Benson et al. 38 The 3 mL reaction mixture consists of 2.13 mL Tris–HCl buffer (25 mM, pH 7.4), 0.7 mL BSA, 0.1 mL FAD, 0.02 mL NADPH (0.1 mM), and 50 µL PMS (10%). The reduction of dichlorophenolindophenol (DCPIP) was recorded calorimetrically at 600 nm and the enzyme activity was calculated as µmol of DCPIP reduced/min/mg protein using molar extinction coefficient of 2.1 × 10⁴ M−1 cm−1.
Assay for lactate dehydrogenase activity
Lactate dehydrogenase (LDH) activity was estimated in serum by the method of Kornberg. 39 The assay mixture consisted of 0.2 mL of serum, 0.1 mL of 0.02 M NADH, 0.1 mL of 0.01 M sodium pyruvate, 1.1 mL of 0.1 M (pH 7.4) phosphate buffer, and distilled water in a total volume of 3 mL. Enzyme activity was recorded at 340 nm, and activity was calculated as nmol NADH oxidized/min/mg protein.
Measurement of NO
Production of NO was evaluated by measuring the level of nitrite (an indicator of NO) in the supernatant using a colorimetric reaction with Griess reagent. Briefly, 100 µL of supernatants from different groups was mixed with 100 µL Griess reagent [0.1% N-(1-naphthyl) ethylenediamine dihydrochloride, 1% sulfanilamide, and 2.5% H3PO4]. After incubation at room temperature in the dark for 10 min, total nitrites were measured spectrophotometrically at 540 nm. The concentration of nitrite in the sample was determined from a NaNO2 standard curve. 40
Assay for hydrogen peroxide
Hydrogen peroxide (H2O2) was assayed by H2O2-mediated horseradish peroxidase-dependent oxidation of phenol red by the method of Pick and Keisari. 41 2.0 mL of supernatant, suspended in 1.0 mL of solution containing phenol red (0.28 nm), horseradish peroxidase (8.5 units), dextrose (5.5 nm), and phosphate buffer (0.05 M, pH 7.0) was incubated at 37℃ for 60 min. The reaction was stopped by the addition of 0.01 mL of NaOH (10 N) and then centrifuged at 800 × g for 5 min. The absorbance of supernatant was recorded at 610 nm against a reagent blank. The quantity of H2O2 produced was expressed as nmol H2O2/h/gm tissue based on the standard curve of H2O2-mediated oxidation of phenol red.
Assay for BUN and creatinine
BUN and creatinine levels were measured by the commercially available kit from Reckon digonistics, Pvt. Ltd. India, following manufacturer’s instruction.
Kidney injury molecule-1 levels
KIM-1 Levels were measured by Elisa Plate Reader (Benchmark plus, BioRad) by the commercially available kit from Adipo Biotech (CA, USA) following manufacturer’s protocol.
Cytokine analysis
Serum levels of proinflammatory cytokines, TNF-α and PGE2, were analyzed in serum. Serum was separated from blood and the levels of earlier-mentioned cytokines were evaluated in it by Elisa Plate Reader (Benchmark plus, BioRad) following the instructions of the manufacturer.
Histological investigation
For histopathology study, the kidneys were removed and immediately fixed in freshly prepared 10% neutral-buffered formalin at 4℃. Then, the skin was embedded in paraffin wax. A vertical section of skin (5 -µm thick) was cut and stained with hematoxylin and eosin (H&E). The leucocytes infiltration and epidermal thickness were observed as an indicator of histological changes with microscope (fluorescent microscope, Olympus) at least in six different regions.
Measurement of protein
The protein concentration in all samples was determined by the method of Lowry et al.38,42 using BSA as the standard.
Statistical analysis
The data from individual groups are presented as the mean ± standard error of the mean (SEM). Differences between groups were analyzed by using one-way analysis of variance (ANOVA) followed by Tukey–Kramer multiple comparisons test and minimum criterion for statistical significance was set at P < 0.05 for all comparisons.
Results
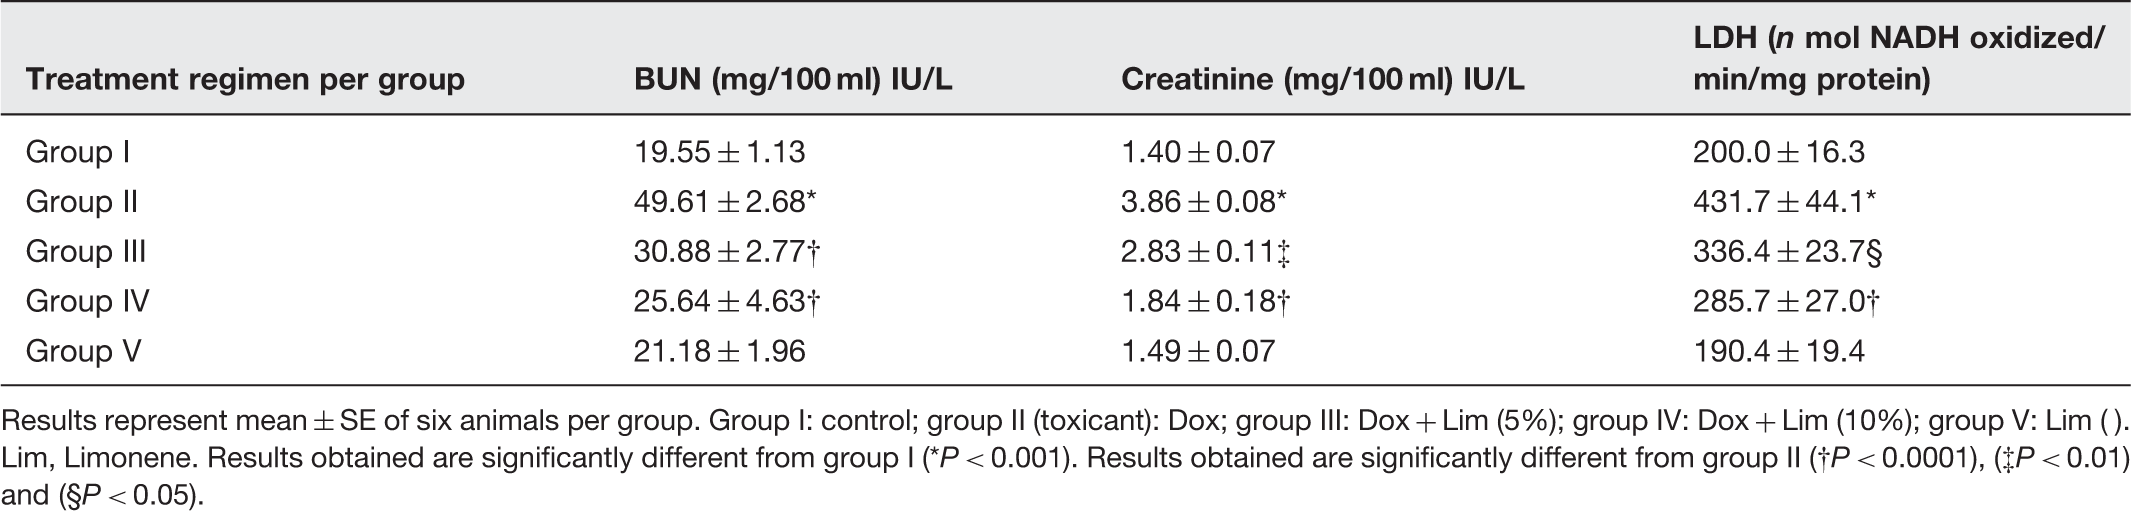
d-limonene attenuates the serum toxicity parameters for renal toxicity
Protective effect of Group I: Control group (normal diet); group II: doxorubicin-treated group (20 mg/kg body weight); group III: dose 1 of Results of pretreatment of Limonene on Dox-induced serum toxicity markers Results represent mean ± SE of six animals per group. Group I: control; group II (toxicant): Dox; group III: Dox + Lim (5%); group IV: Dox + Lim (10%); group V: Lim ( ). Lim, Limonene. Results obtained are significantly different from group I (*P < 0.001). Results obtained are significantly different from group II (†P < 0.0001), (‡P < 0.01) and (§P < 0.05).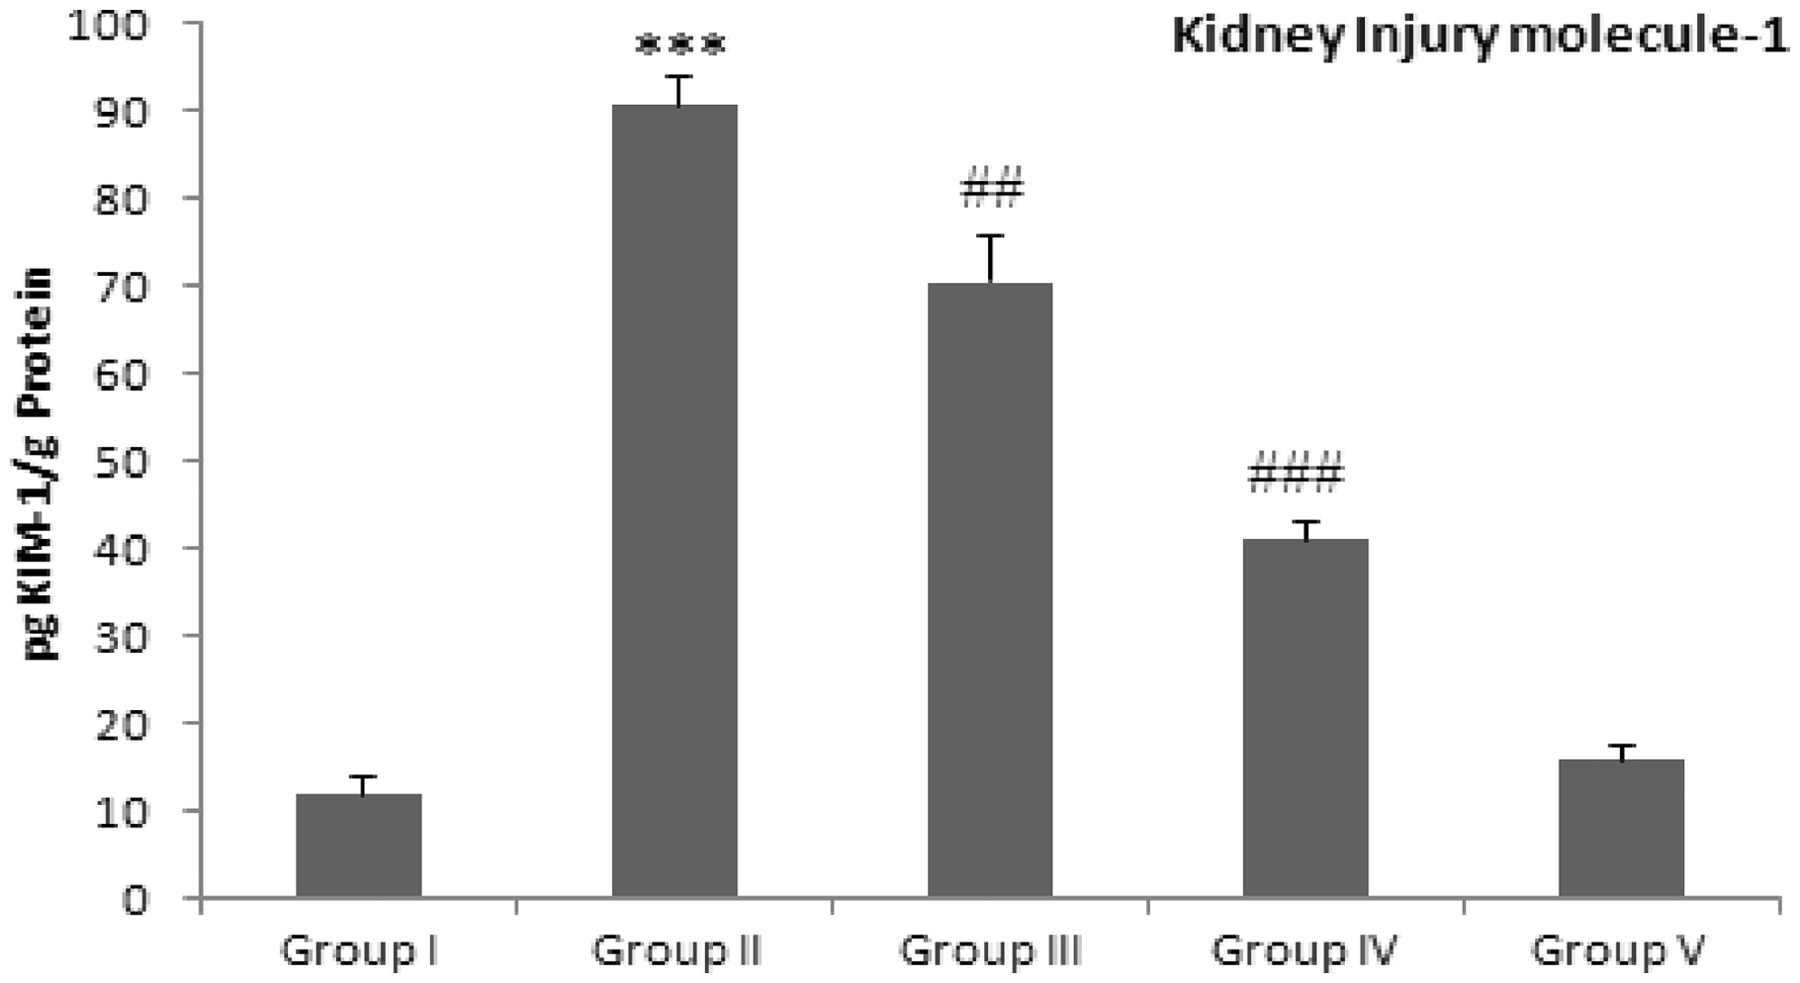
Effect of d -limonene and Dox on the antioxidant enzymes
Results of pretreatment of Limonene on biochemical parameters in Dox-induced renal toxicity
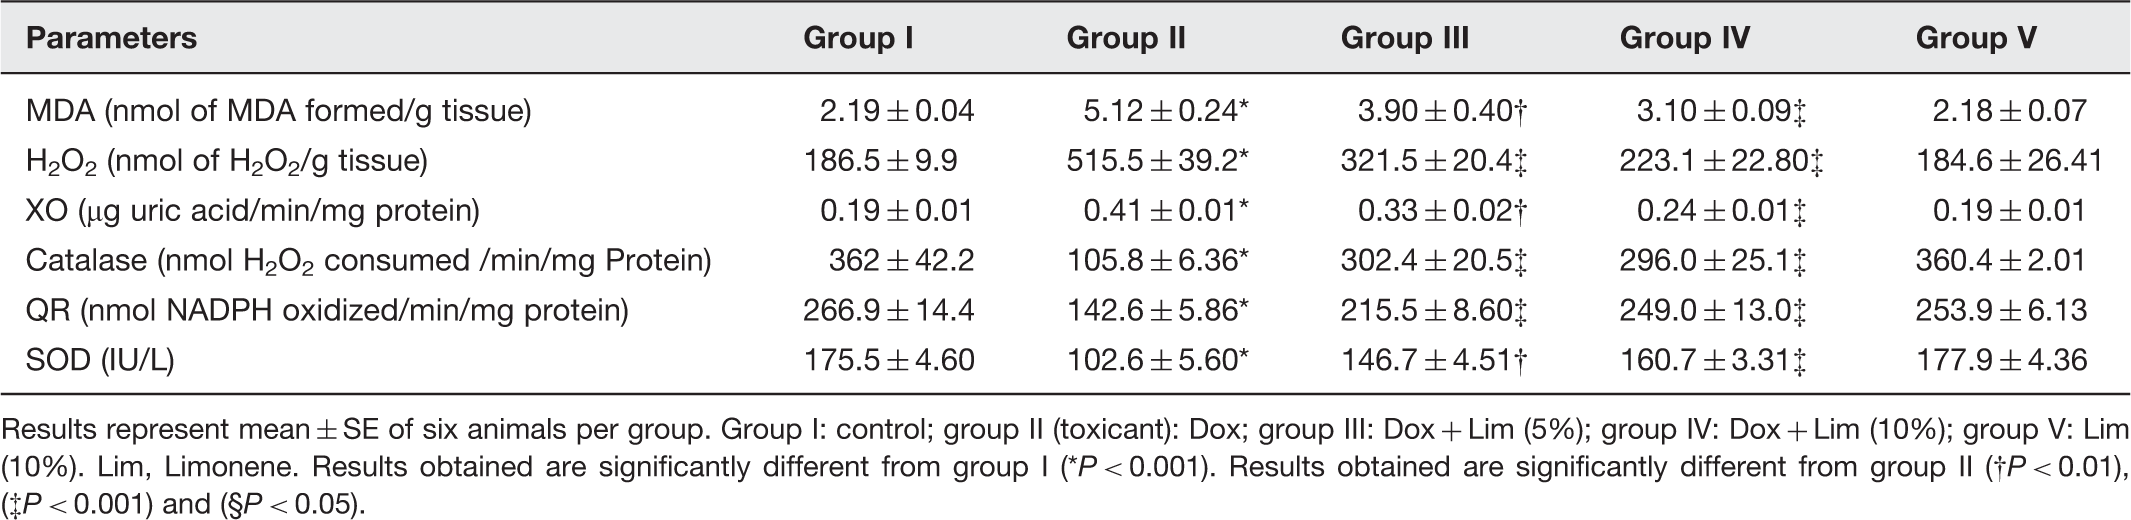
Results represent mean ± SE of six animals per group. Group I: control; group II (toxicant): Dox; group III: Dox + Lim (5%); group IV: Dox + Lim (10%); group V: Lim (10%). Lim, Limonene. Results obtained are significantly different from group I (*P < 0.001). Results obtained are significantly different from group II (†P < 0.01), (‡P < 0.001) and (§P < 0.05).
Results of pretreatment of Limonene on antioxidant enzymes like GSH, GST, GR and GPX on Dox induced renal redox imbalance
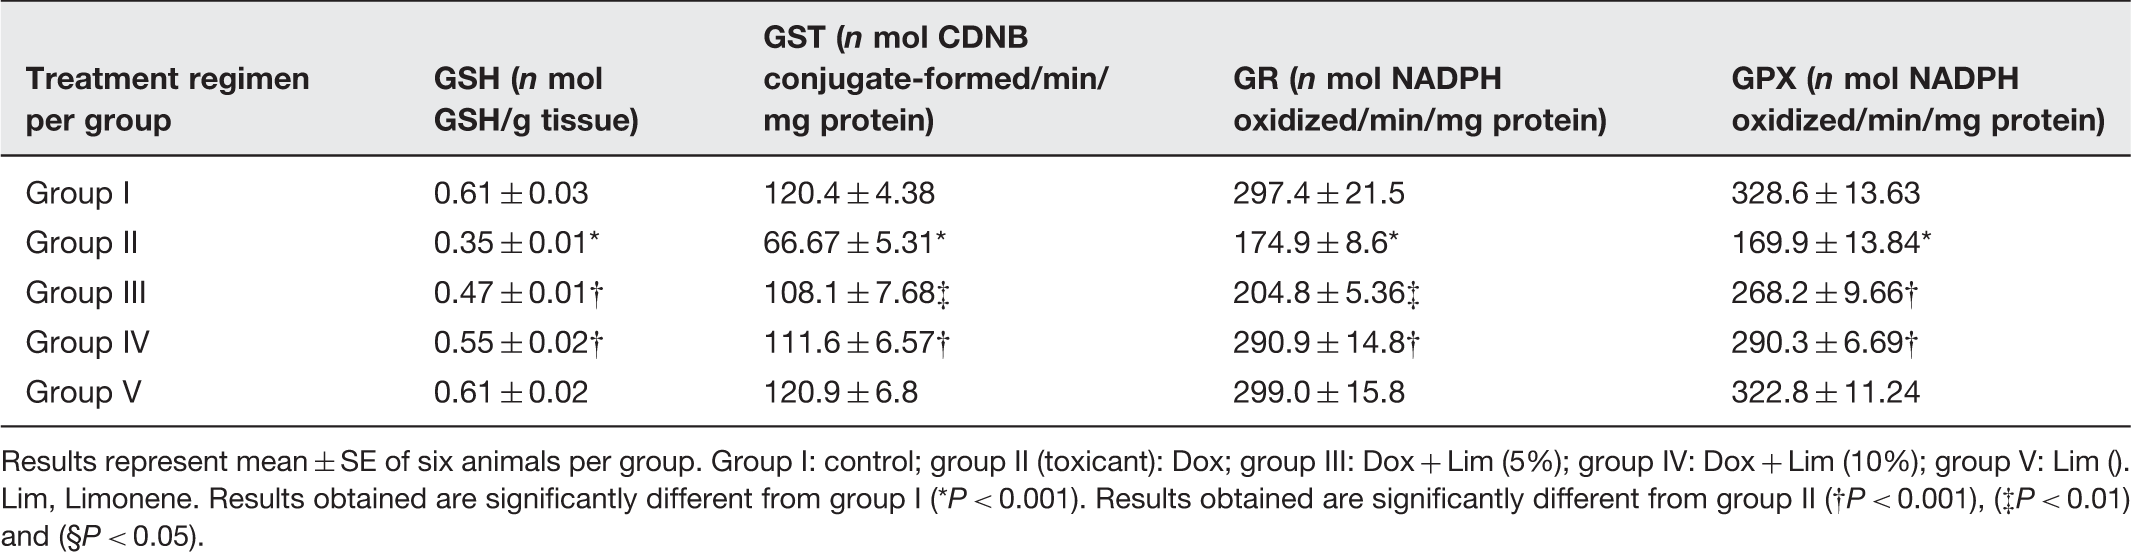
Results represent mean ± SE of six animals per group. Group I: control; group II (toxicant): Dox; group III: Dox + Lim (5%); group IV: Dox + Lim (10%); group V: Lim (). Lim, Limonene. Results obtained are significantly different from group I (*P < 0.001). Results obtained are significantly different from group II (†P < 0.001), (‡P < 0.01) and (§P < 0.05).
Effect of d -limonene and Dox on the renal GSH content
Pretreatment of
Effect of d -limonene pretreatment and Dox on XO activity in renal tissue
The activity of XO was significantly increased (P < 0.001) in group II as compared with group I.
Effect of d -limonene pretreatment and Dox on QR activity
QR reflected significant decrease in the enzyme activity in renal tissue of group II when compared with group I (Table 2).
Effect of d -limonene on Dox induced MDA levels in rat renal tissue
XO and H2O2 level restored to normal by d-limonene pretreatment
There was significant enhancement of renal microsomal XO (P < 0.001) and H2O2 (P < 0.001) levels in Dox treatment group. Marked reduction was noted in
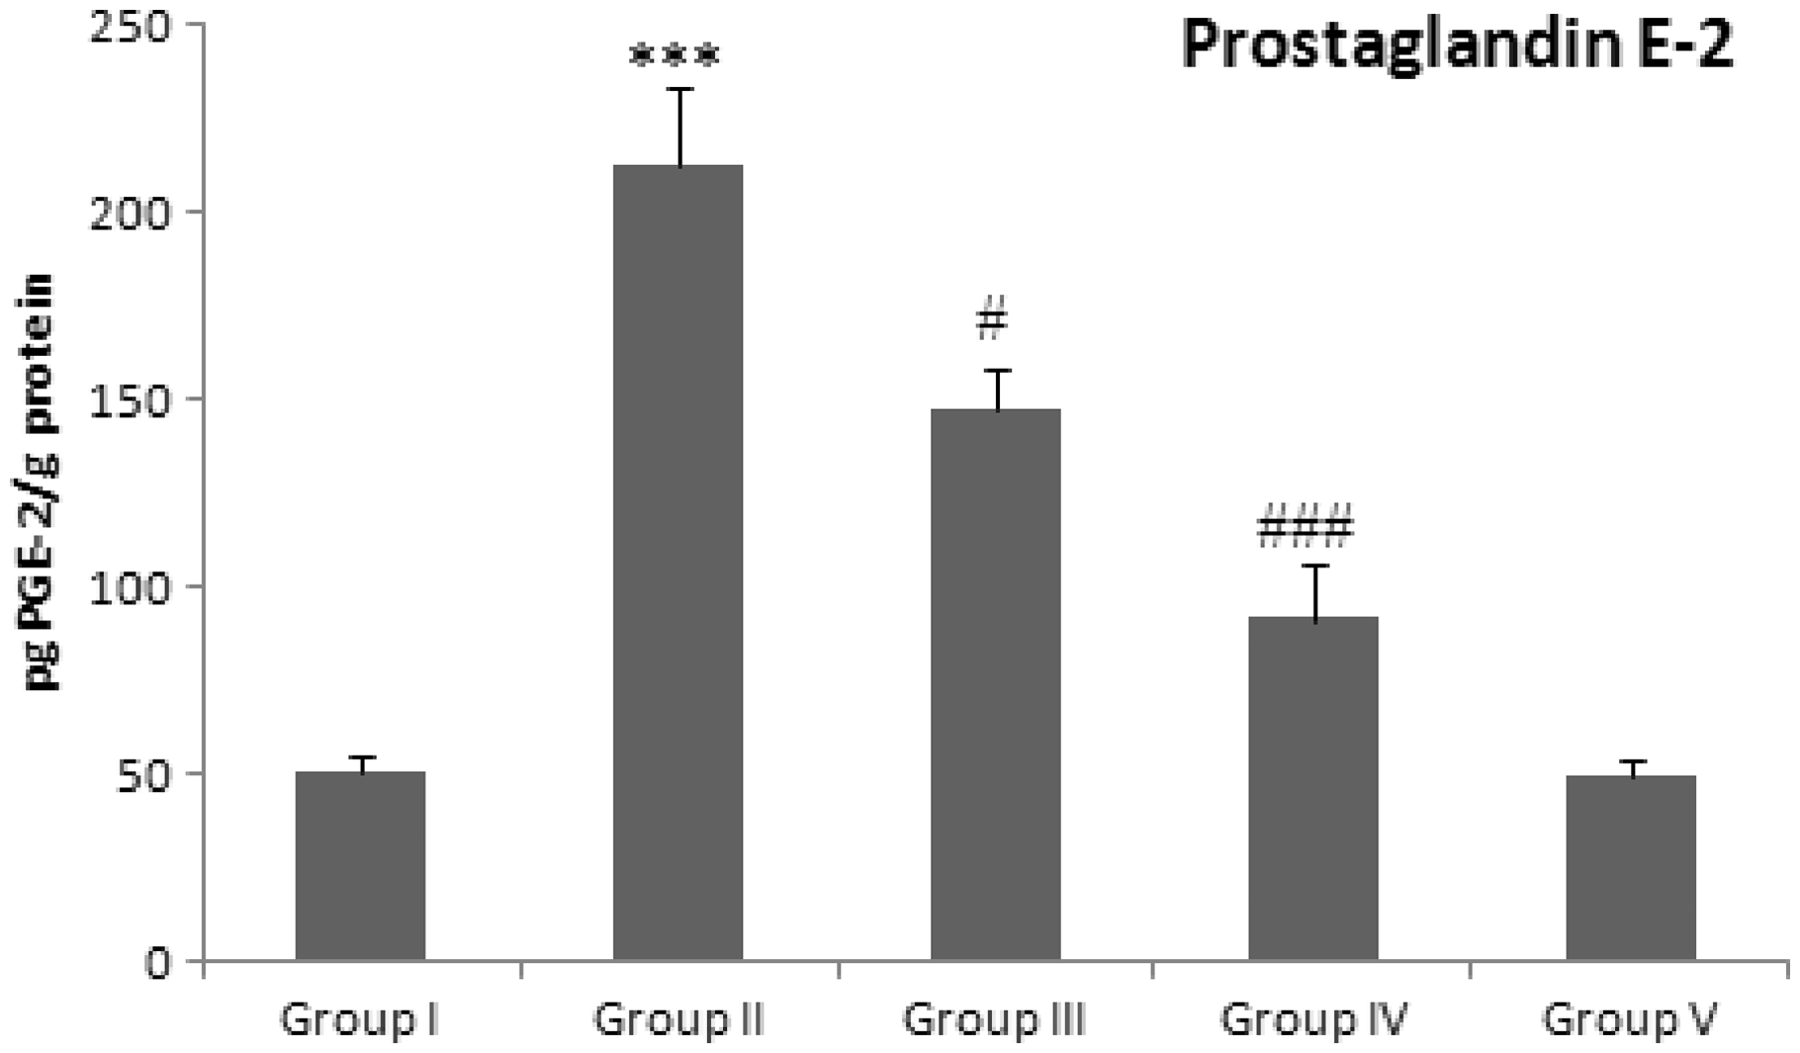
Effect of d -limonene and Dox treatment on proinflammatory cytokines
We have assessed the effect Group I: Control group (normal diet); group II: doxorubicin-treated group (20 mg/kg body weight); group III: dose 1 of Group I: Control group (normal diet); group II: doxorubicin-treated group (20 mg/kg body weight); group III: dose 1 of 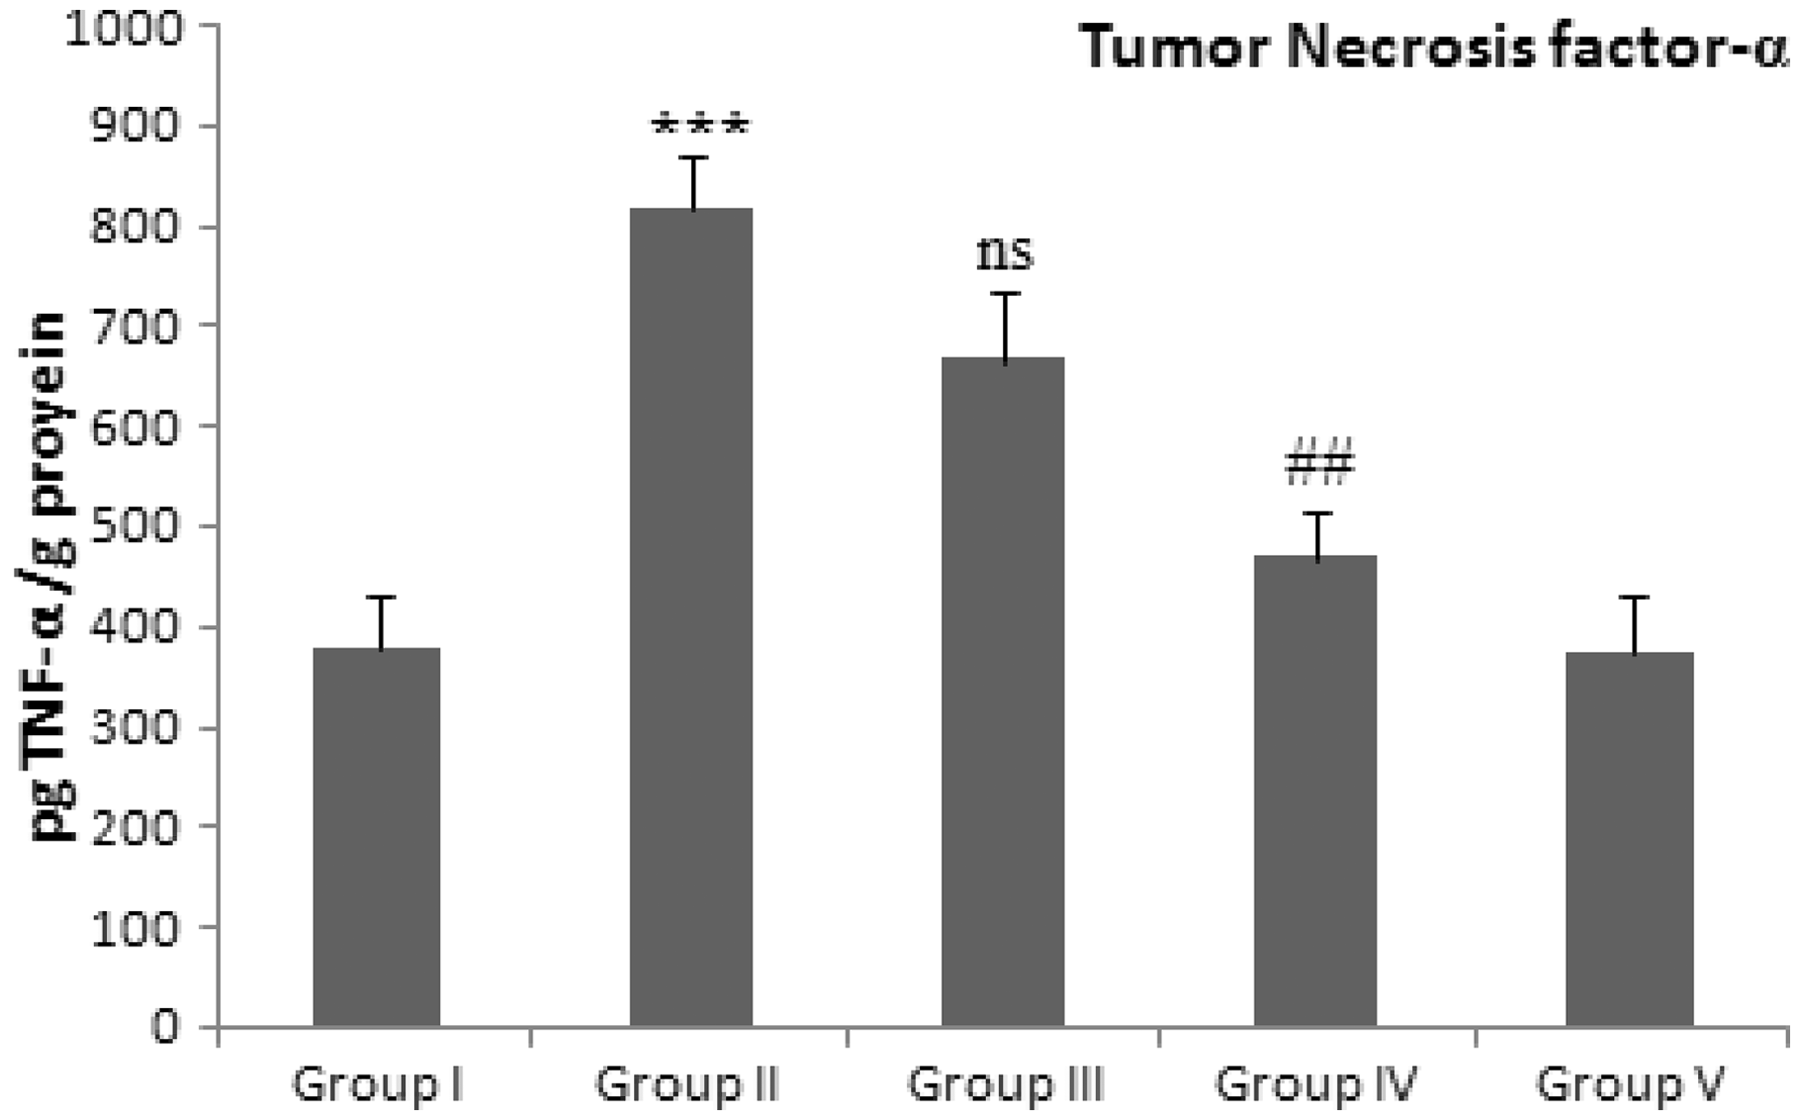
Effect of d -limonene on the NO production
Administration of Dox resulted in the elevated renal NO production in the group II as compared with the group I (P < 0.001). We observed that pre-treatment with Group I: Control group (normal diet); group II: doxorubicin-treated group (20 mg/kg body weight); group III: dose 1 of 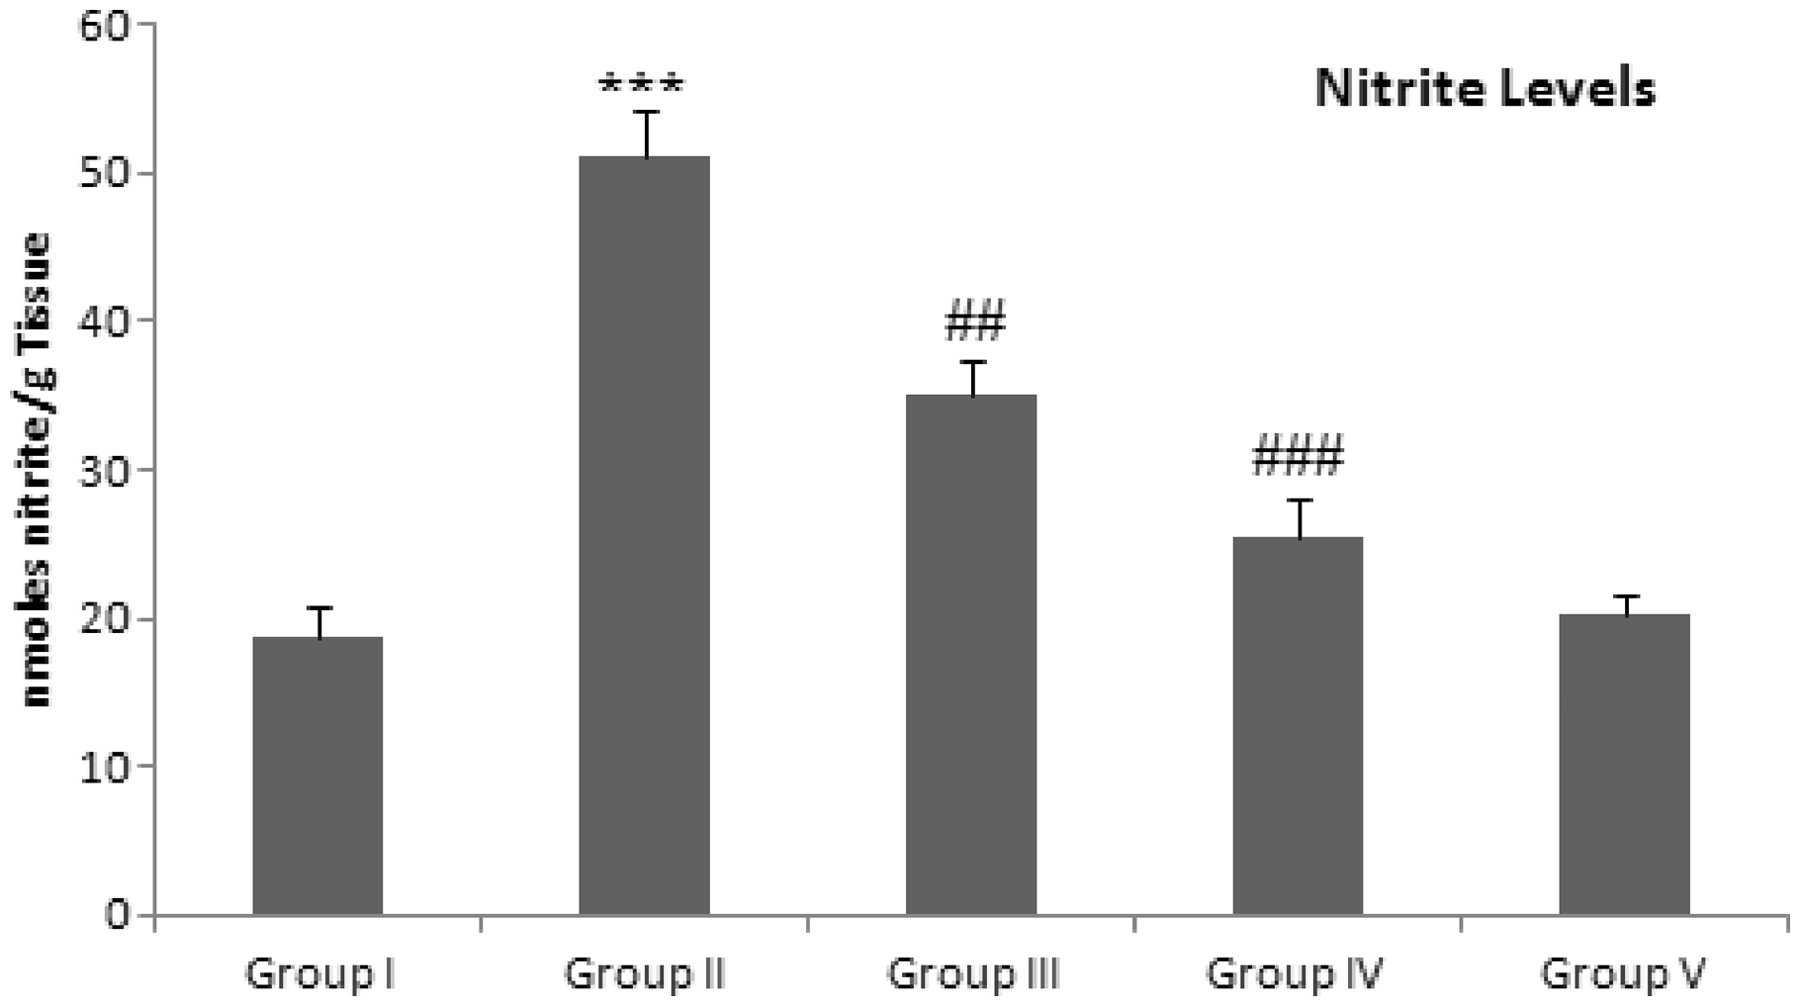
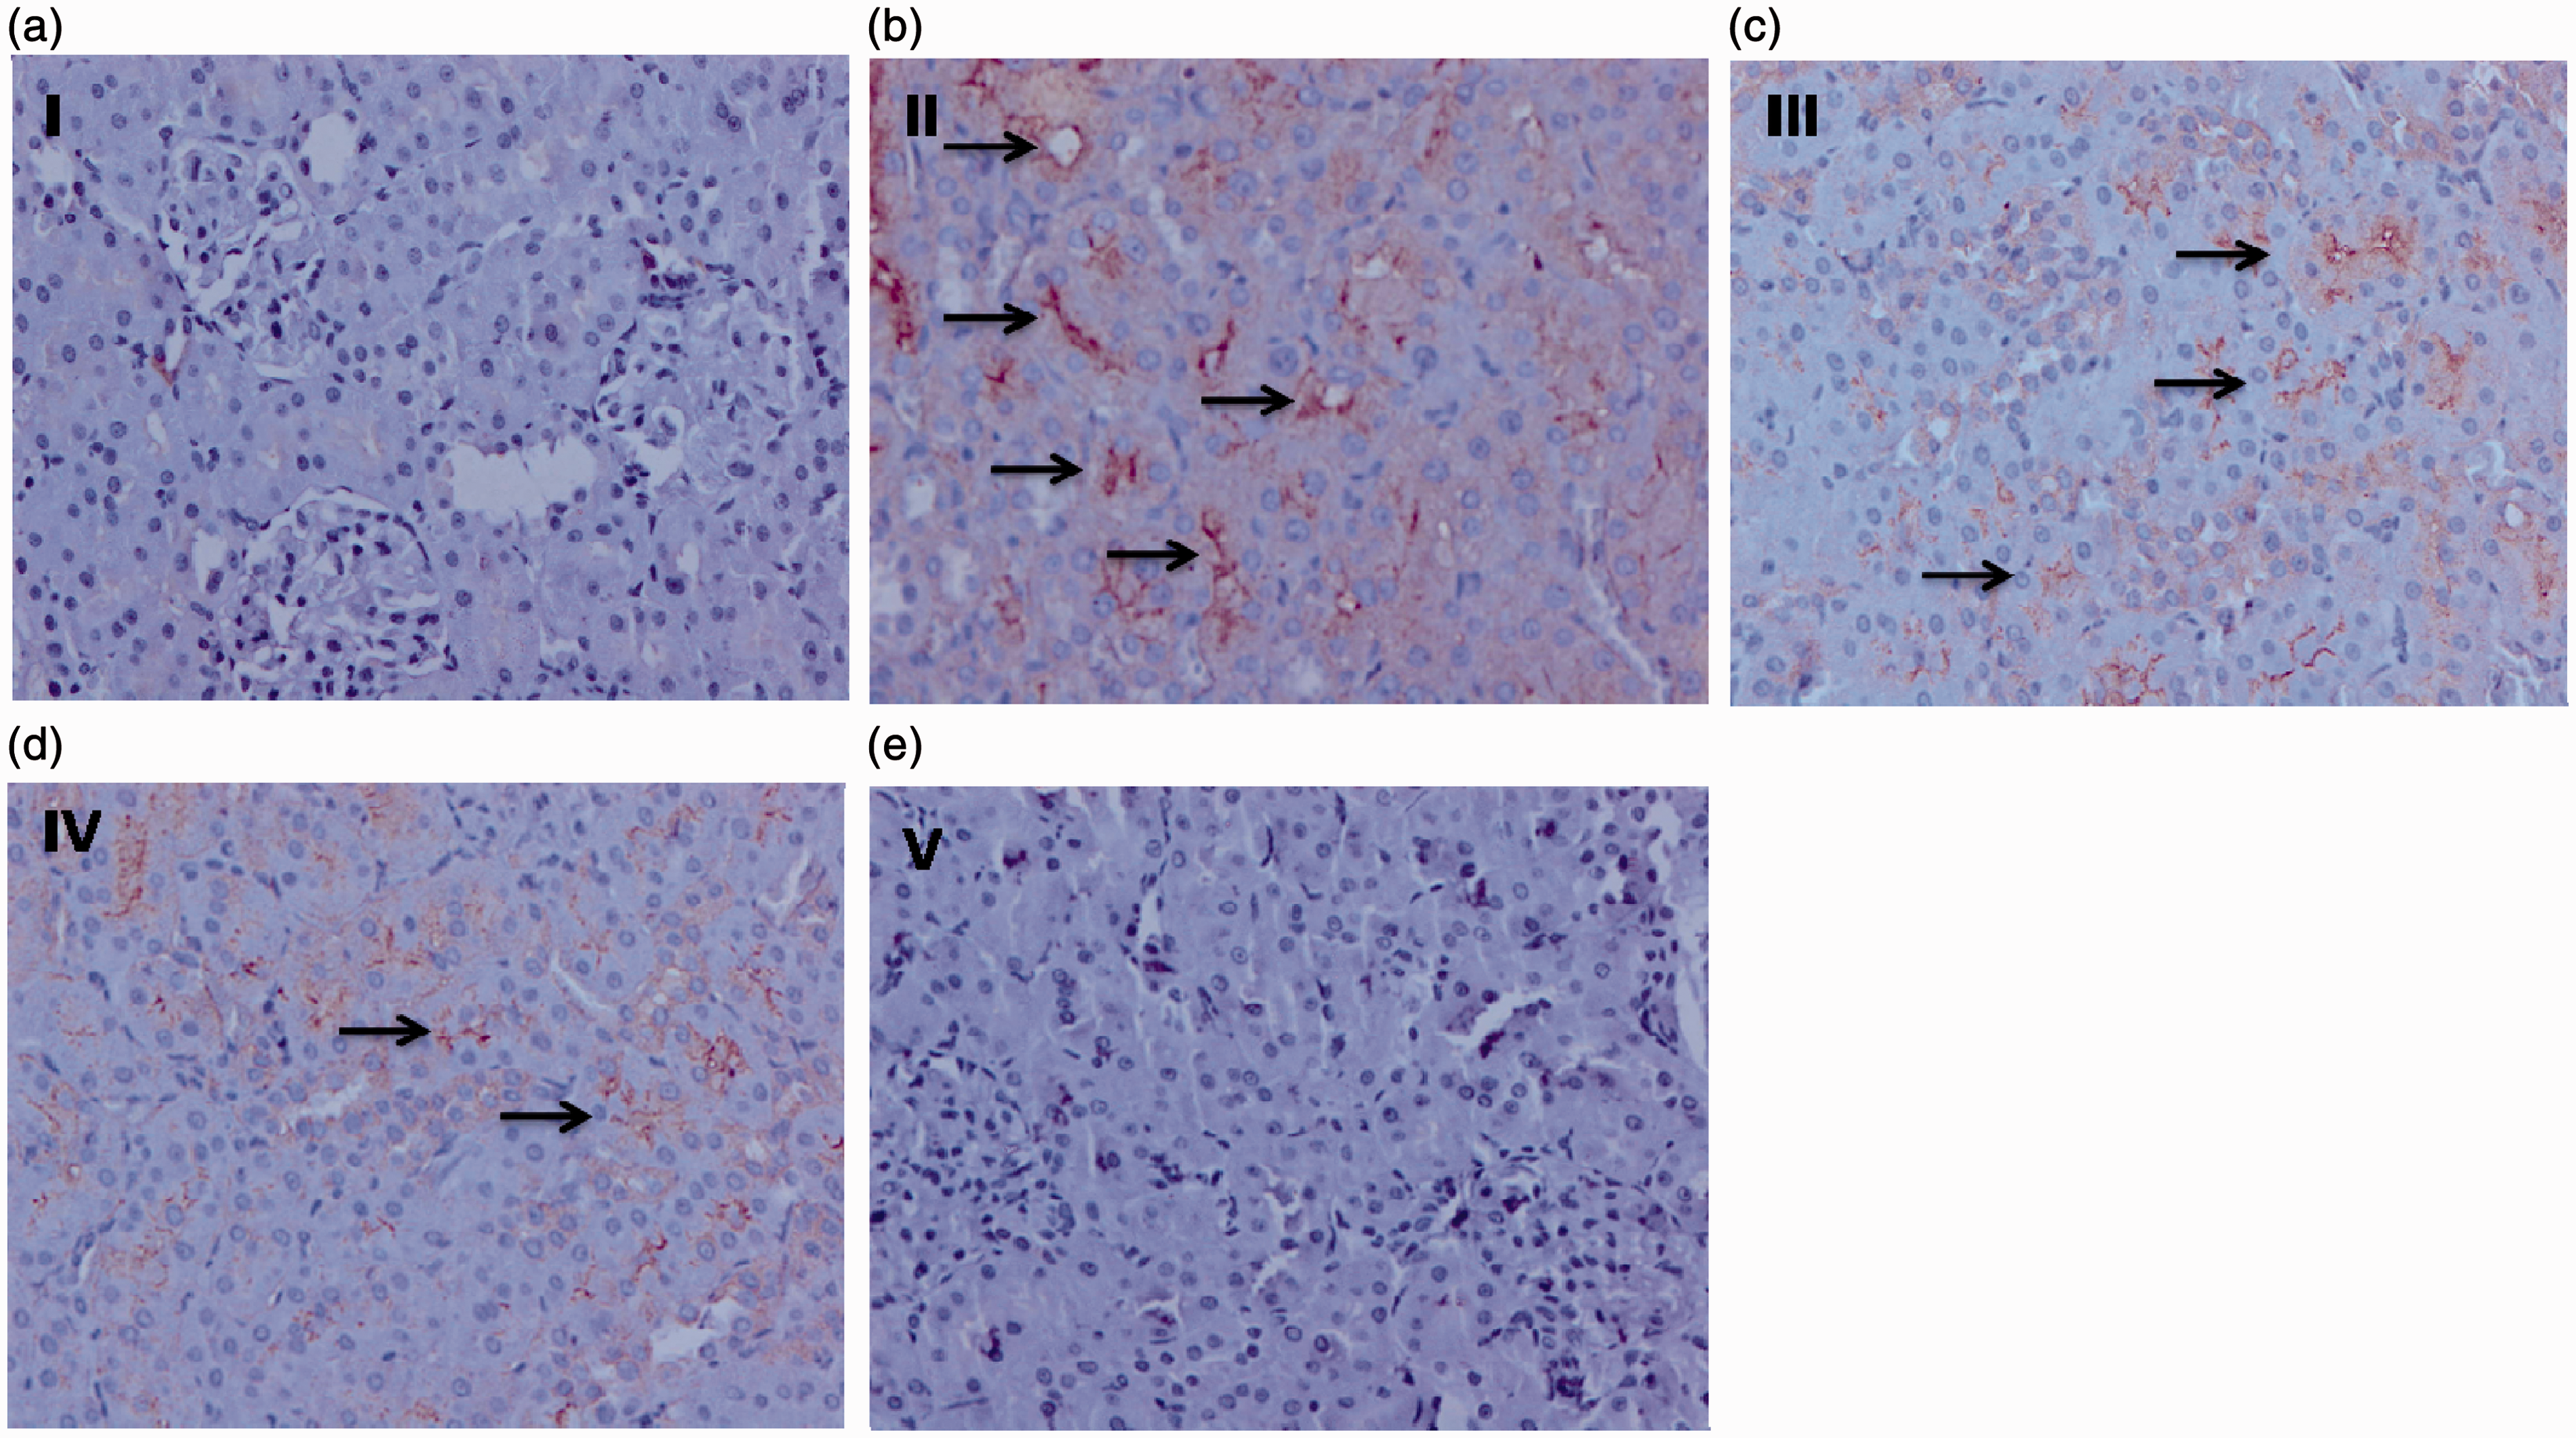
Effect of d -limonene on the Dox-induced renal Immunohistochemical expression of NF-κB, COX-2, and iNOS
Renal expression of the above-mentioned proteins is shown in the figures respectively. Brown color clearly indicates the more number of cells having NF-κB, COX-2, and i-NOS expression in the group II when compared with that of group I. Pretreatment with Effect of prophylactic treatment of Effect of prophylactic treatment of Effect of prophylactic treatment of 

Effect of d -limonene pretreatment and Dox on renal histology
Effect of orally administered Effect of prophylactic treatment of 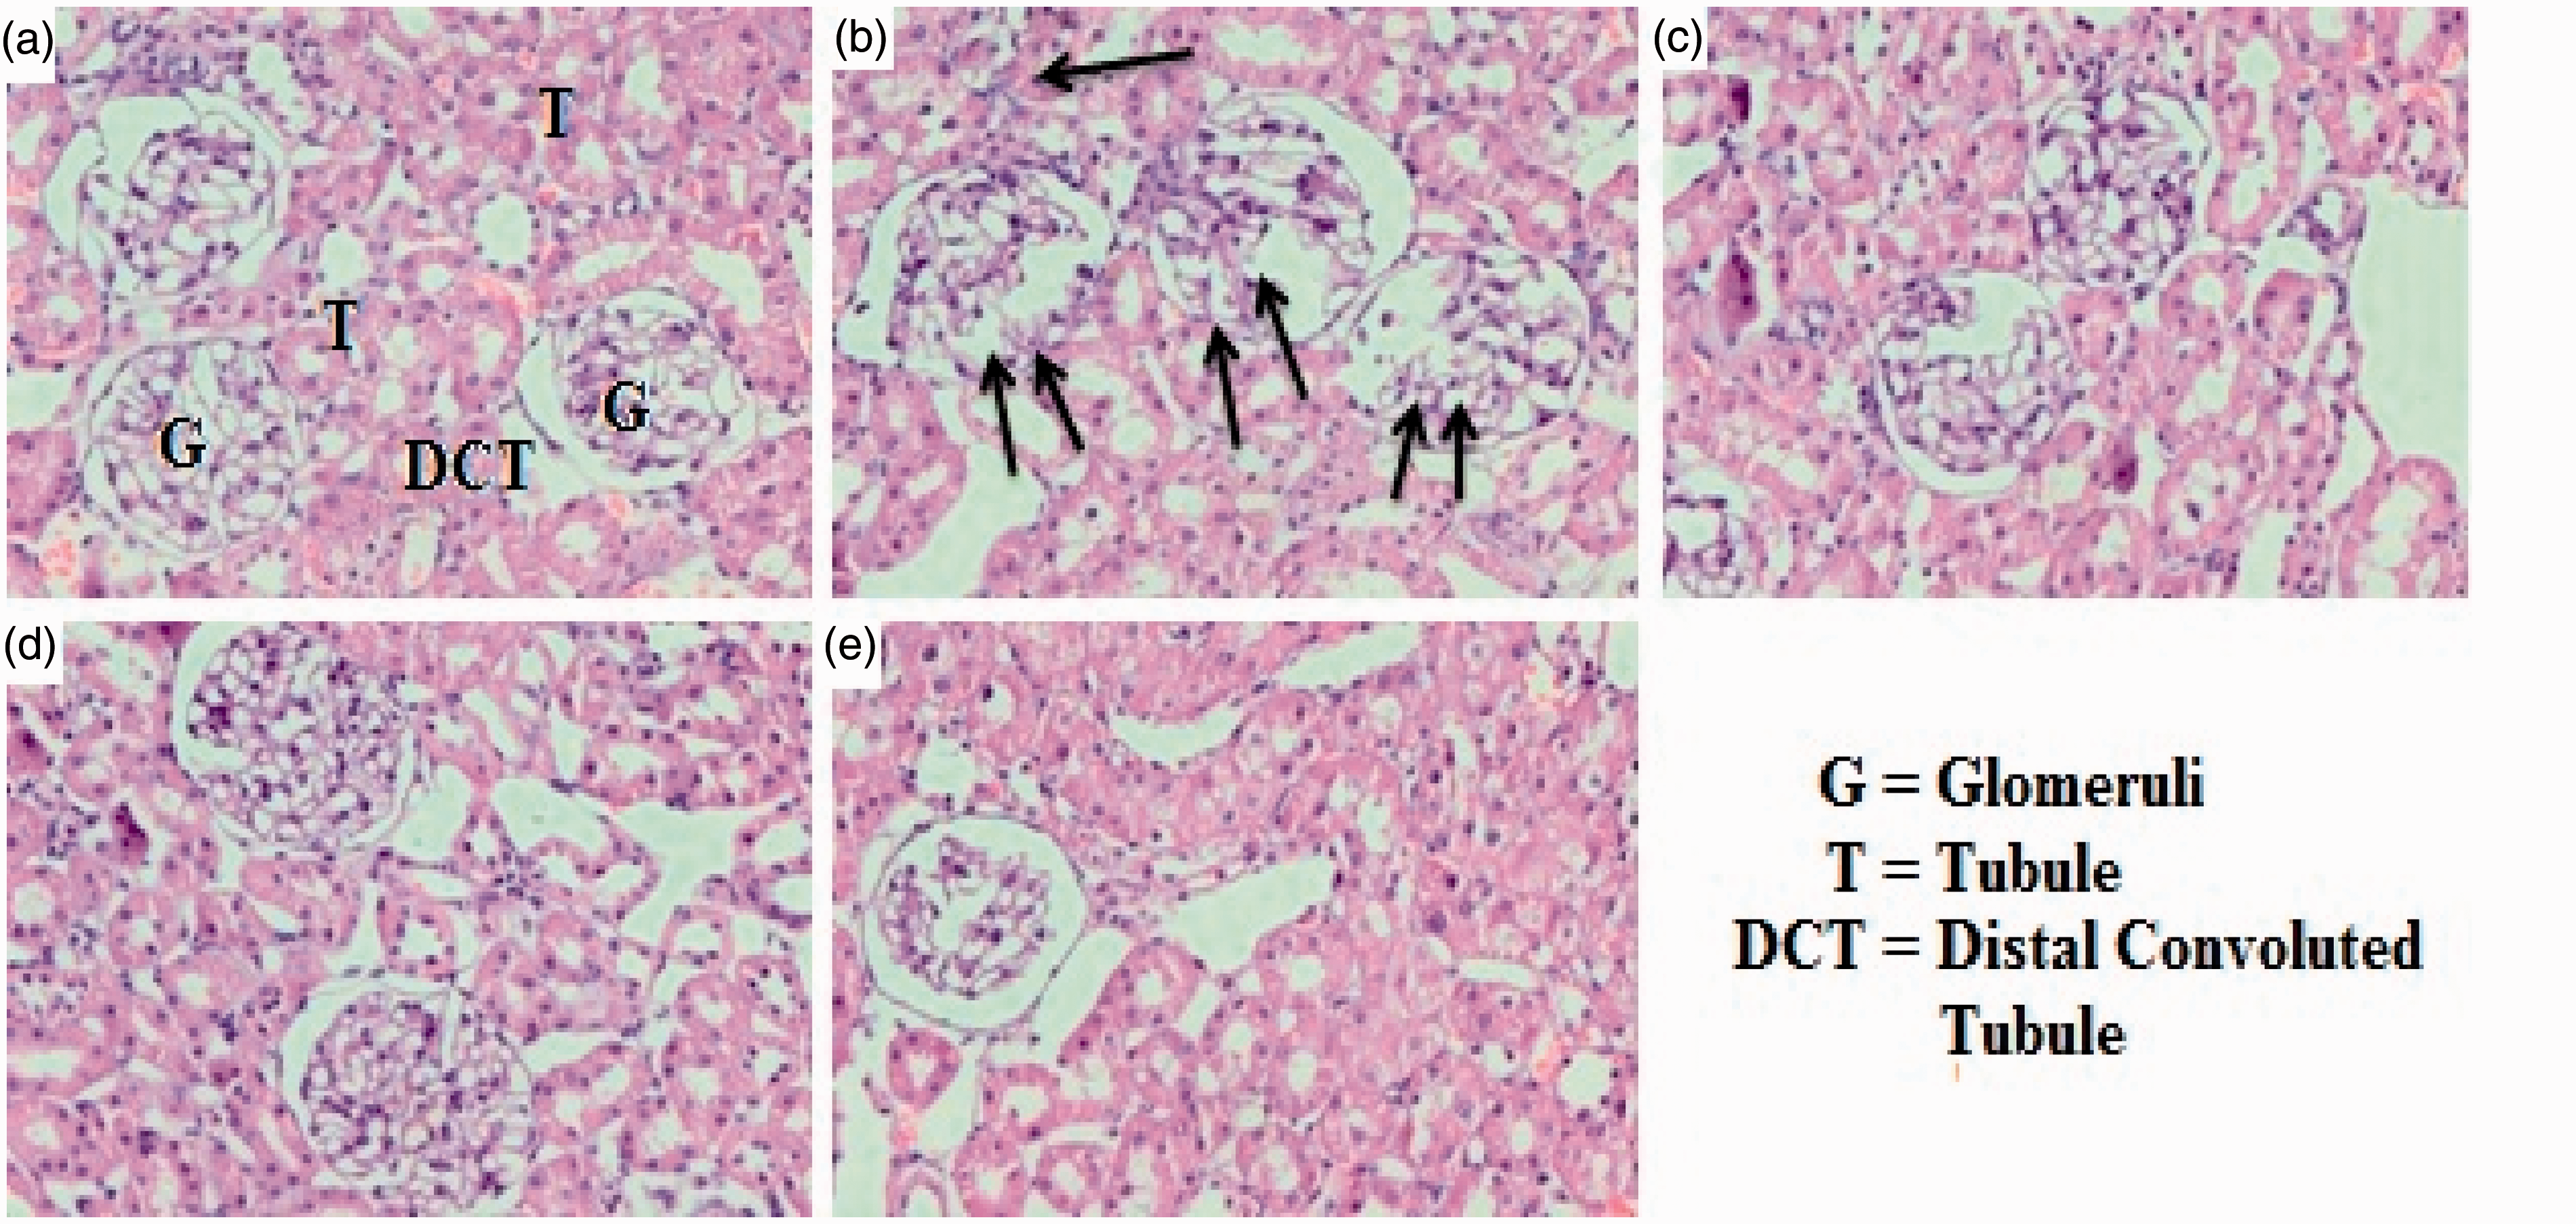
Discussion
In this study, we have observed the protective effects of
The most widely accepted mechanism of Dox toxicity implicates the formation of a Dox semiquinone free radical by the action of NADPH dependant reductases. In presence of oxygen this semi-quinone form yields super oxide radicals (O2−). Free radicals can also be produced by a non-enzymatic mechanism that involves reactions of iron–Dox complex that can reduce oxygen to H2O2 and other ROS.19,44,45
The antioxidant status of kidney is significantly lowered in the Dox treatment animals due to the decreased SOD, CAT, GPx activities, and GSH level.
Lipid peroxidation is a marker of oxidative stress, number of studies have reported that elevation in the level of malondialdehyde (MDA), a lipid peroxidation product, was observed after Dox-treatment.19,20 Our results agreed with the above mentioned previous findings which showed that there is remarkable increase in the level of MDA in rats treated with Dox and pretreatment with
Serum BUN and creatinine are all considered as reliable, important, well-documented markers of renal function for investigating drug induced nephrotoxicity in animals and man, and Dox toxicity has been shown to increase their level.47,48 In accordance with previous studies, Dox strongly induced both BUN creatinine and LDH1,20 in our study, whereas our modulator viz.,
Kim-1 is a type 1 transmembrane protein that is usually undetectable in healthy kidney tissue. Transcript levels for the gene that encodes Kim-1/Havcr1 are strongly up-regulated in dedifferentiated proximal tubule epithelial cells in kidney after ischemic or toxic injury. Kim-1 has been recommended to serve as a useful and most sensitive biomarker for renal injury in preclinical and clinical studies of drug safety evaluation, and the monitoring of renal disease status.
49
In our study, Kim-1 levels were elevated in the Dox-treated group, thus consistent with earlier reports.49,50 However,
Oxidative stress and inflammation is implicated in Dox-induced renal toxicity. Dox administration leads to oxidative damage as well as increases in TNF-α levels.11,51 This TNF-α induces the local generation of reactive nitrogen species (RNS) through NO synthase induction, and therefore intensifies the oxidative stress responsible for organ injury. Recent published papers identify TNF-α as part of the innate immune system in response to different forms of stresses which is initiated by binding of TNF-α to its receptor-1 causing the classical activation of NFκB and increasing the expression of genes required to control infection and injury. 52
Elevated production of NO results in peroxynitrite formation by reaction of NO and superoxide anion. Peroxynitrite is a powerful and aggressive cellular oxidant and causes the formation of 3-nitro-
This work confirmed the former findings, whereas Dox administered rats showed a significant increase in both TNF-α and NFκB expressions. Moreover, the elevation of iNOS in renal tissues supporting a role of TNF-α in mediating Dox effects in the kidney. Furthermore, the levels TNF-α and total nitrite were significantly increased in Dox group as compared with normal rats in accordance with previous findings.51,54,55
The aforementioned results further substantiated the histological data which exhibited the protective effects of
Footnotes
Author contributions
The contributions of the authors to this study were as follows: M.U.R. and S.S. designed the experiment and wrote the manuscript; M.U.R., M.T., A.Q.K., R.K., O.-O.-H., A.L., and M.Z. conducted the experimental work; S.K., S.R., and N.A. helped in animal handling, data analysis, and editing of manuscript.
ACKNOWLEDGMENTS
The author (Sarwat Sultana) is thankful to University Grants Commission (New Delhi, India) for providing UGC-Special Assistance Programme Departmental Research Support-II (UGC-SAP DRS-II) and Research Fellowship for Science and Meritorious (RFSMS) to Muneeb U Rehman.