
Abstract
Diabetes and fibrosis can be concurrent processes in several diseases such as cystic fibrosis or chronic pancreatitis. To evaluate whether diabetes can influence fibrosis and thus aggravate the pathological process, the progression of chronic pancreatitis was assessed in diabetic and non diabetic mice. For this purpose, insulin producing beta-cells in C57Bl/6 J mice were selectively impaired by administration of streptozotocin. Chronic pancreatitis was then induced by repetitive administration of cerulein in normoglycaemic and hyperglycaemic mice. Diabetes caused enhanced collagen I deposition within three weeks of the onset of chronic pancreatitis and increased the proliferation of interstitial cells. This was accompanied by an increased number of interlobular fibroblasts, which expressed S100A4 (fibroblast-specific protein-1) and stimulation of α-smooth muscle actin expression of pancreatic stellate cells. In addition, the observed aggravation of chronic pancreatitis by diabetes also led to a significantly enhanced atrophy of the pancreas, increased infiltration of inflammatory chloracetate esterase positive cells and enhanced acinar cell death. We conclude that diabetes has a detrimental influence on the progression of chronic pancreatitis by aggravating fibrosis, inflammation and pancreatic atrophy.
Keywords
Introduction
Fibrosis occurs in many tissues as a result of inflammation or damage and can have a devastating effect on the function of organs, as observed, for example in liver cirrhosis, pulmonary fibrosis or chronic pancreatitis.1–3 In chronic pancreatitis fibrosis is caused by stimulation of interstitial cells called pancreatic stellate cells. 4 Upon stimulation stellate cells start to express α-smooth muscle actin, which is followed by deposition of extracellular matrix. 4 These cells can be found at the basolateral aspect of acinar cells (periacinar cells) or in between lobuli (interlobular fibroblasts).5–7
During some diseases, such as cystic fibrosis or chronic pancreatitis, fibrosis is often accompanied by diabetes.1,3 In particular, chronic pancreatitis is regularly associated with diabetes. 1 Some patients with beginning chronic pancreatitis may have either type 2 diabetes mellitus mostly due to obesity or long-term type 1 diabetes, whereas patients with longstanding chronic pancreatitis can develop type 3 c diabetes mellitus. 8 The prevalence of diabetes in chronic pancreatitis depends on aetiology, age, genetic predisposition, degree of pancreatic damage, the presence or absence of pancreatic calculi and the duration of the disease. 1 For example, in one prospective cohort study with 500 patients the development of diabetes was observed in 83% of patients with chronic pancreatitis. 9 Chronic pancreatitis causes type 3 c diabetes by reducing the beta-cell mass and possibly by causing a reduced functionality of beta-cells.10–12 Interestingly, it has also been documented that diabetes is a mortality risk factor for chronic pancreatitis. 13 This suggests that diabetes may also have an influence on the progression of chronic pancreatitis. Surprisingly, no experimental data exist to address the hypothesis if diabetes influences fibrosis during chronic pancreatitis.
In this study, we explored whether diabetes influences main features of chronic pancreatitis such as fibrosis, inflammation and pancreatic atrophy. Our data demonstrate that diabetes has a fundamental influence on the progression of chronic pancreatitis by enhancing collagen I deposition and inducing the proliferation of interstitial cells. In addition, diabetes enhances cell death of acinar cells, increases the number of infiltrating inflammatory cells and aggravates atrophy of the pancreas.
Materials and methods
Animal husbandry and tissue collection
Eight- to twelve-week-old C57BL/6 J mice were either sham- (Sham), cerulein- (Cer), streptozotocin- (STZ), or streptozotocin plus cerulein- (STZ + Cer) treated (Figure 1). Diabetes was induced in two cohorts (STZ, STZ + Cer) by intraperitoneal injection of 50 mg/kg streptozotocin (Sigma-Aldrich, St Louis, MO, USA) daily on day 1–5 of experimental design. Chronic pancreatitis was then induced in two cohorts (Cer, STZ + Cer) by administration of three intraperitoneal injections of 50 µg/kg cerulein (Sigma-Aldrich) at a rate of one every hour three times a week (thus Monday, Wednesday and Friday) over a period of three weeks (Figure 1). All control mice were sham-treated with appropriate vehicles (0.9% wt/vol. saline solution instead of cerulein; 50 mmol/L sodium citrate pH 4.5 instead of STZ). All four cohorts of mice received drinking water containing 800 mg/L of metamizol to prevent potential pain caused by pancreatitis (Ratiopharm, Ulm, Germany). In addition, all mice received 1 g/L 5-bromo-2’-deoxyuridine (BrdU, Sigma-Aldrich) during the entire period of chronic pancreatitis in the drinking water, in order to evaluate cell proliferation. Blood samples for assessing amylase and lipase activity were taken 2 h after the third cerulein injection on day 22, or on day 47, one week after the last cerulein injection. Pancreatic tissue was sampled on day 26, 2 h after the last cerulein administration or on day 47. Blood glucose was measured with the blood glucose metre Contour (Bayer Vital, Leverkusen, Germany) on day 1 before the first STZ injection and on day 22 before the first cerulein injection. For retrobulbar blood sampling and tissue collection, the animals were anaesthetised with 75 mg/kg ketamine (bela-pharm, Vechta, Germany) and 5 mg/kg xylacine (Bayer Health Care, Leverkusen, Germany). After the start of laparotomy, the tissue was isolated within a maximum of 5 min and fixed in 4% (wt/vol.) phosphate-buffered formalin for 2–3 days. In addition, squeezing of the pancreas with tweezers was avoided, in order to minimise tissue damage. All experiments were performed in accordance with German legislation and the principles of laboratory animal care.
Experimental protocol. In two cohorts (STZ, STZ + Cer) diabetes was induced by intraperitoneal injection of 50 mg/kg streptozotocin on day 1–5 of the experimental paradigm. Control cohorts (Sham, Cer) were sham-treated in the same manner by injection of 50 mmol/L sodium citrate pH 4.5. In two cohorts (Cer, STZ + Cer) chronic pancreatitis was then induced from day 22 to day 40 by administration of three intraperitoneal injections of 50 µg/kg cerulein at a rate of one every hour on Monday, Wednesday and Friday. Control cohorts (Sham, STZ) were sham-treated in the same manner with 0.9% wt/vol. saline. In order to evaluate cell proliferation, all mice received 1 g/L BrdU during the entire period of chronic pancreatitis in the drinking water. The tissue was either collected on day 26 or on day 47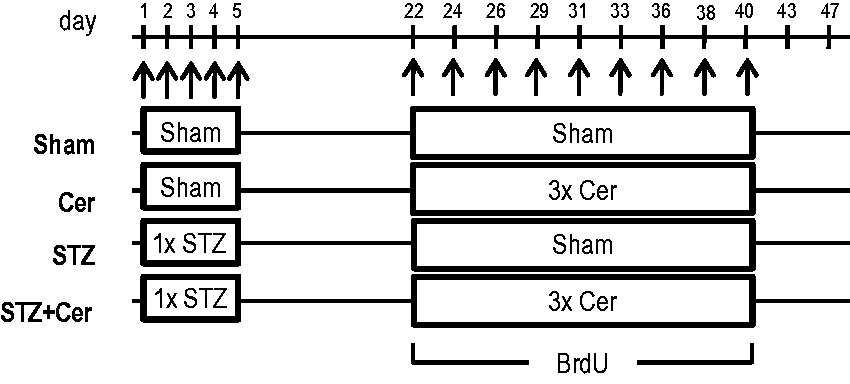
Analysis of plasma and tissue
To assess acinar cell damage, the activity of lipase and amylase in blood plasma was analysed using the Cobas c111 spectrophotometer (Roche Diagnostics, Mannheim, Germany). Pancreatic atrophy was quantified as pancreas to body weight ratio and the pancreas was processed as described previously for histological staining. 14 To evaluate the cellular inflammatory response, which is characterised by infiltration of granulocytes during cerulein-induced pancreatitis, 15 naphthol AS-D chloroacetate esterase (CAE) staining was performed on paraffin embedded tissue. Cell death was analysed using the ApopTag Plus Peroxidase in situ detection kit (Millipore, Eschborn, Germany). Cell proliferation or fibrosis was evaluated by immunohistochemistry using mouse anti-BrdU (clone Bu20a, dilution 1:50), rabbit anti-collagen-I (Abcam, Cambridge, UK, code ab 34710, dilution 1:200), goat anti-S100A4 (Santa Cruz Biotechnology, Inc., Santa Cruz, CA, code sc-19949, dilution 1:50) or rabbit anti-α-smooth muscle actin (Abcam, ab5694, dilution 1:800). All immunohistochemical procedures were performed using the Universal LSAB+ Kit/HRP as source for appropriate secondary antibodies (Dako, Hamburg, Germany). Planimetric analysis of collagen I positive areas in the pancreas was performed on 10 randomly chosen pictures (taken with a 40 x objective) of pancreatic tissue per mouse by using Adobe Photoshop CS5 (Adobe, San Jose, CA, USA).
Statistics
Data presentation and statistics were performed as described previously. 14 The significance of differences was evaluated using a Mann–Whitney rank-sum test, followed by the correction for the accumulation of the α error by considering the number of meaningful comparisons. Differences with P ≤ 0.05, divided by the number of meaningful comparisons were considered to be significant. Differences with P < 0.08, divided by the number of meaningful comparisons, were considered to indicate a tendency.
Results
Quality control of induced diabetes and chronic pancreatitis
At the beginning of the experiment, on day 1, all four cohorts of mice had similar blood glucose concentrations (Sham: 6.8/6.6–8.3, Cer: 7.7/7.0–8.8, STZ: 7.1/6.3–7.9, STZ + Cer: 7.0/6.0–8.2, median/interquartile range in mmol/L). Injection of STZ caused a strong rise in blood glucose concentration in STZ- and STZ plus cerulein-treated cohorts by day 22 when compared to control cohorts (Figure 2a). Thus, the blood glucose concentrations of the STZ versus STZ plus cerulein cohorts were comparable to each other, but were significantly increased in comparison to sham- and cerulein-treated mice. Two hours after the first three consecutive cerulein or sham injections on day 22, lipase and amylase activity in blood plasma was assessed. Lipase activity increased significantly in cerulein as well as STZ plus cerulein-treated mice when compared to control cohorts (Figure 2b), verifying the onset of pancreatic tissue injury. The analysis of amylase activity confirmed the lipase activity data, since amylase activity increased significantly in cerulein as well as STZ plus cerulein-treated mice when compared to control cohorts (Figure 2c). On day 47, one week after the last episode of cerulein-induced chronic pancreatitis, both lipase as well as amylase activity returned to physiological levels (data not shown).
Analysis of blood glucose concentration, lipase and amylase activity on day 22. Blood glucose concentration (a) was measured in the morning before any injection, whereas blood samples for lipase activity (b) and amylase activity (c) were taken 2 h after the last cerulein or sham injection in control (Sham), cerulein- (Cer), streptozotocin- (STZ) or streptozotocin plus cerulein (STZ + Cer)-treated mice. Box plots indicate the median, the 25th and 75th percentiles in the form of a box, and the 10th and 90th percentiles in the form of whiskers. Significant differences between the cohorts are indicated, *P ≤ 0.001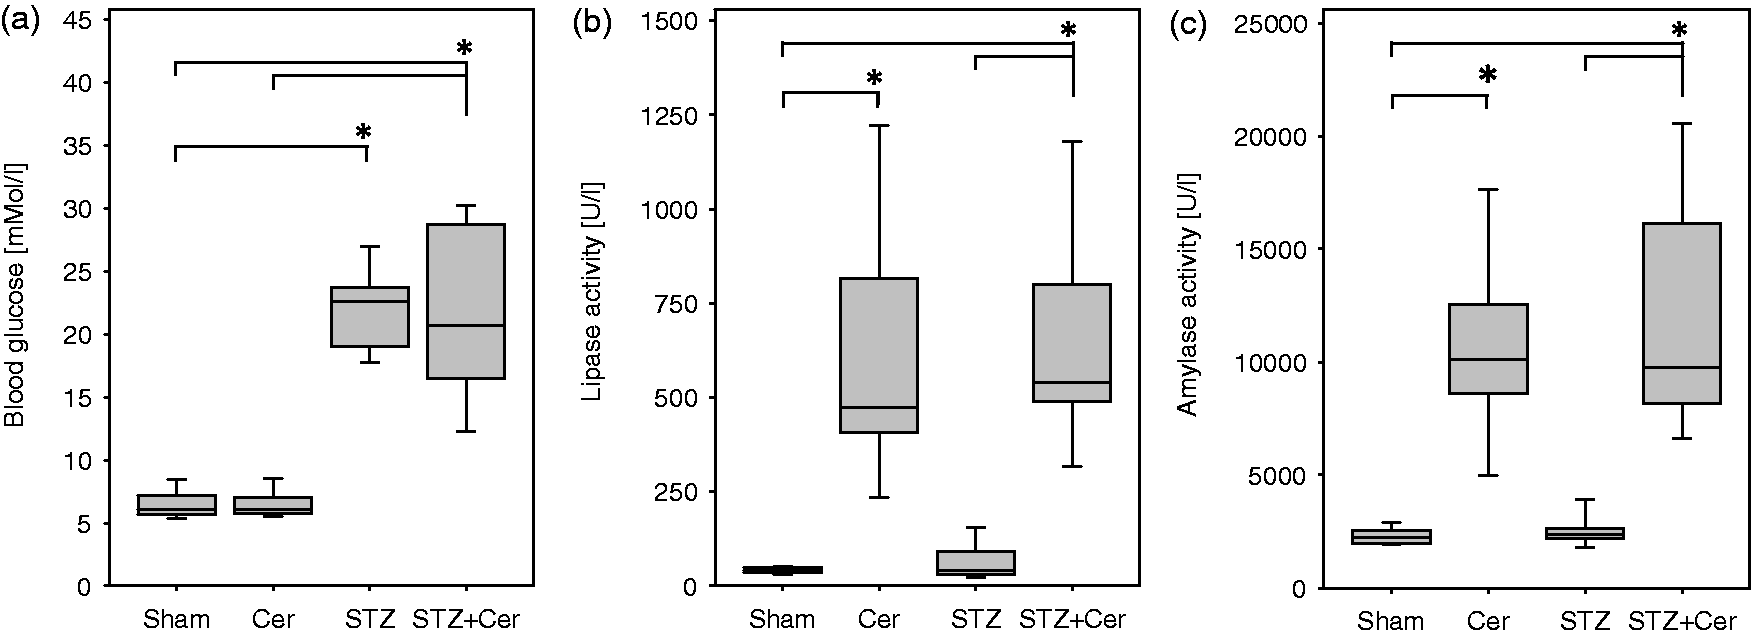
Diabetes enhances collagen I deposition and proliferation of interstitial cells
Immunohistochemical analysis of the pancreas on day 47 revealed barely any collagen I deposition in sham-treated or STZ-treated mice, whereas in cerulein and especially STZ plus cerulein-treated mice prominent collagen I deposition was observed (Figure 3a). Planimetric evaluation of the collagen I positive tissue area affirmed a significant increase in collagen I deposition in the pancreas of cerulein-treated mice when compared to sham-treated animals (Figure 3b). Collagen I deposition in STZ plus cerulein-treated mice was increased, when compared to sham, STZ- or cerulein-treated animals (Figure 3b). In order to assess if this increase in collagen deposition correlates with an expansion of interstitial cell populations, the BrdU incorporation in interstitial cells was evaluated on day 26. Proliferation of interstitial cells was increased in the mouse cohort treated with cerulein and a major increase in proliferation of interstitial cells was observed in mice treated with STZ plus cerulein (Figure 3c). Analysis of the percentage of BrdU+ cells in the islets of Langerhans on day 26 revealed reduced proliferation of islet cells during chronic pancreatitis, but increased proliferation in diabetic mice (Sham: 1.45/0.65–2.23, Cer: 0.71/0.00–0.95, STZ: 2.06/1.9–3.23, STZ + Cer: 1.57/0.51–2.32, median/interquartile range in percentage of BrdU+ cells, the differences were not significant). Diabetes, therefore, significantly stimulates the expansion of interstitial cells and enhances collagen I deposition during chronic pancreatitis, but only moderately stimulates the proliferation of islet cells.
Diabetes increases collagen I deposition and proliferation of interstitial cells. Indicated parameters were assessed in control mice (Sham) and cerulein (Cer), streptozotocin- (STZ) or streptozotocin plus cerulein- (STZ + Cer) treated cohorts. Deposition of collagen I was determined in the pancreas on day 47 by immunohistochemistry and counterstaining with haematoxylin (a). The relative area of collagen I deposition was quantified as percentage of collagen I positive pixels per high power field on day 47 (b). Proliferation of interstitial cells in the pancreas was evaluated by determining the number of BrdU positive interstitial cells per field on day 26 (c). Box plots indicate the median, the 25th and 75th percentiles in the form of a box, and the 10th and 90th percentiles in the form of whiskers. Significant differences between the cohorts are indicated, *P ≤ 0.01, bar = 50 µm. (A color version of this figure is available in the online journal.)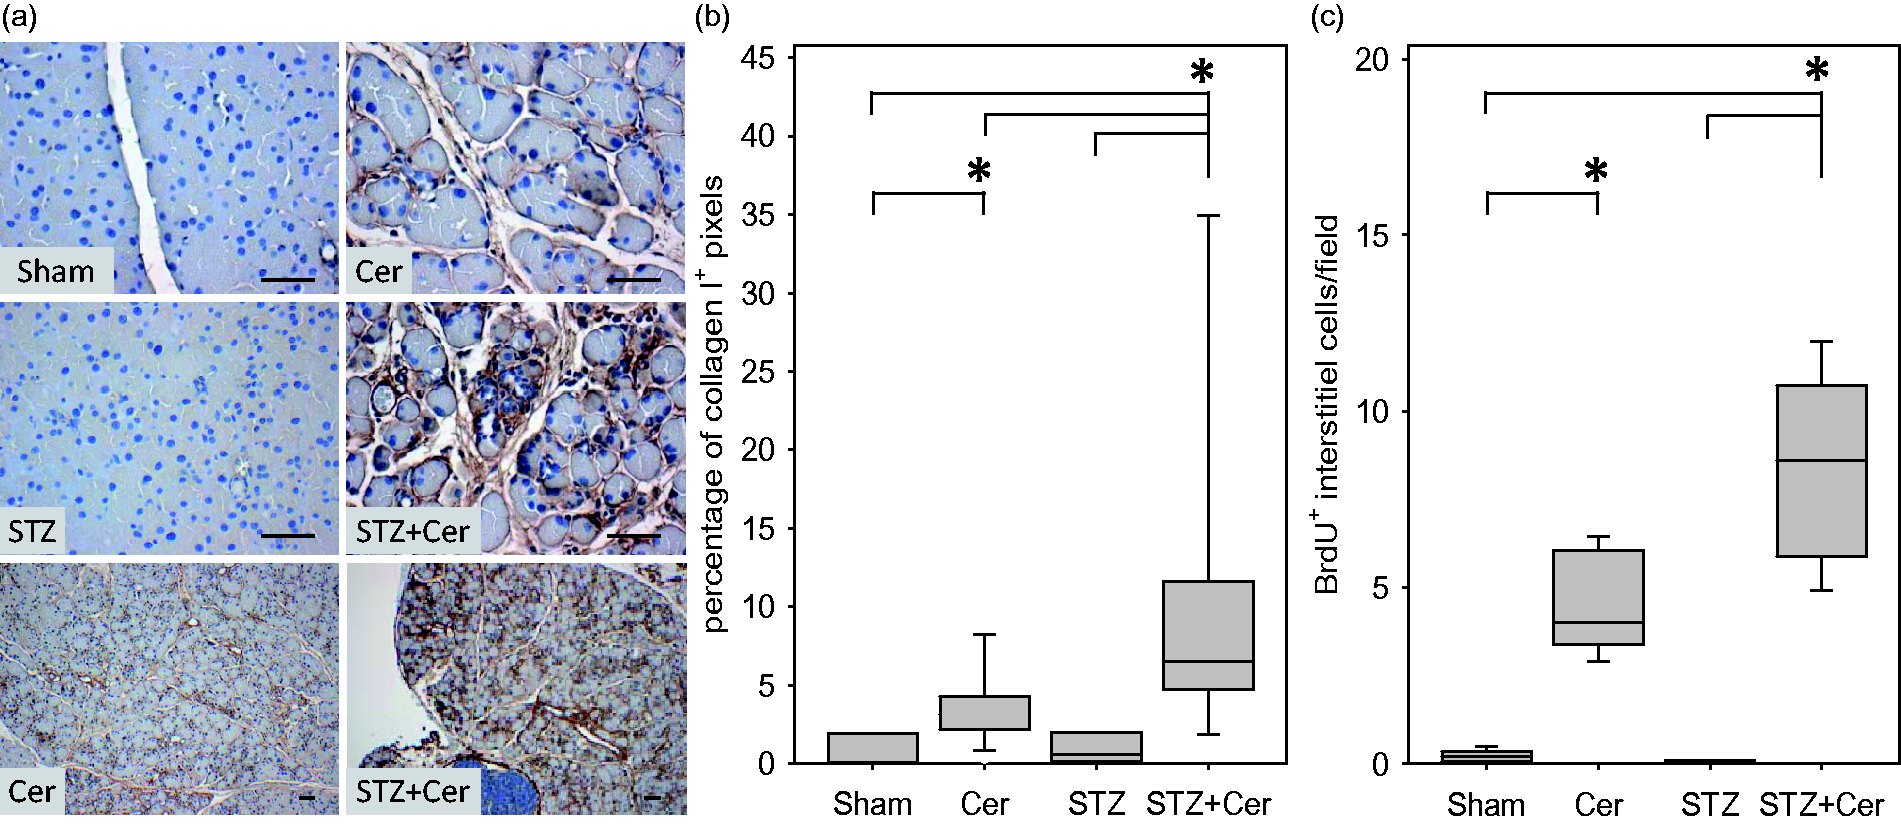
Diabetes stimulates activation of pancreatic stellate cells
Collagen can be produced by stimulated fibroblasts. In the pancreas, especially stellate cells have been reported to produce collagen during pancreatitis.
7
Thus, we evaluated the expression of S100A4 (fibroblast-specific protein-1), as general fibroblast marker and α-smooth muscle actin, which is expressed by pancreatic stellate cells only after tissue injury. Immunohistochemical analysis of the pancreas revealed that interlobular fibroblasts express S100A4 (fibroblast-specific protein-1) independent of diabetes or pancreatitis (Figure 4a). In cerulein and especially STZ plus cerulein-treated mice, however, more S100A4 positive interlobular cells could be observed on day 26 (Figure 4a). The expression of α-smooth muscle actin was observed in azinar as well as interlobular stellate cells only after cerulein and STZ plus cerulein treatment, whereas in all animals α-smooth muscle actin positive blood vessels could be noticed (Figure 4b). The intensity of α-smooth muscle actin staining of periacinar cells as well as interlobular stellate cells was increased in STZ plus cerulein-treated mice in comparison to cerulein-treated mice. This suggests that diabetes enhances the activation of stellate cells during chronic pancreatitis.
Diabetes activates stellate cells. Expression of S100A4 (a) or α-smooth muscle actin (b) was detected by immunohistochemistry and counterstaining with haematoxylin in interlobular control mice (Sham) and cerulein- (Cer), streptozotocin- (STZ) or streptozotocin plus cerulein- (STZ + Cer) treated cohorts on day 26. Interlobular stellate cells are marked by arrows, whereas arrowheads mark stimulated α-smooth muscle positive periacinar stellate cells. Bar = 50 µm. (A color version of this figure is available in the online journal.)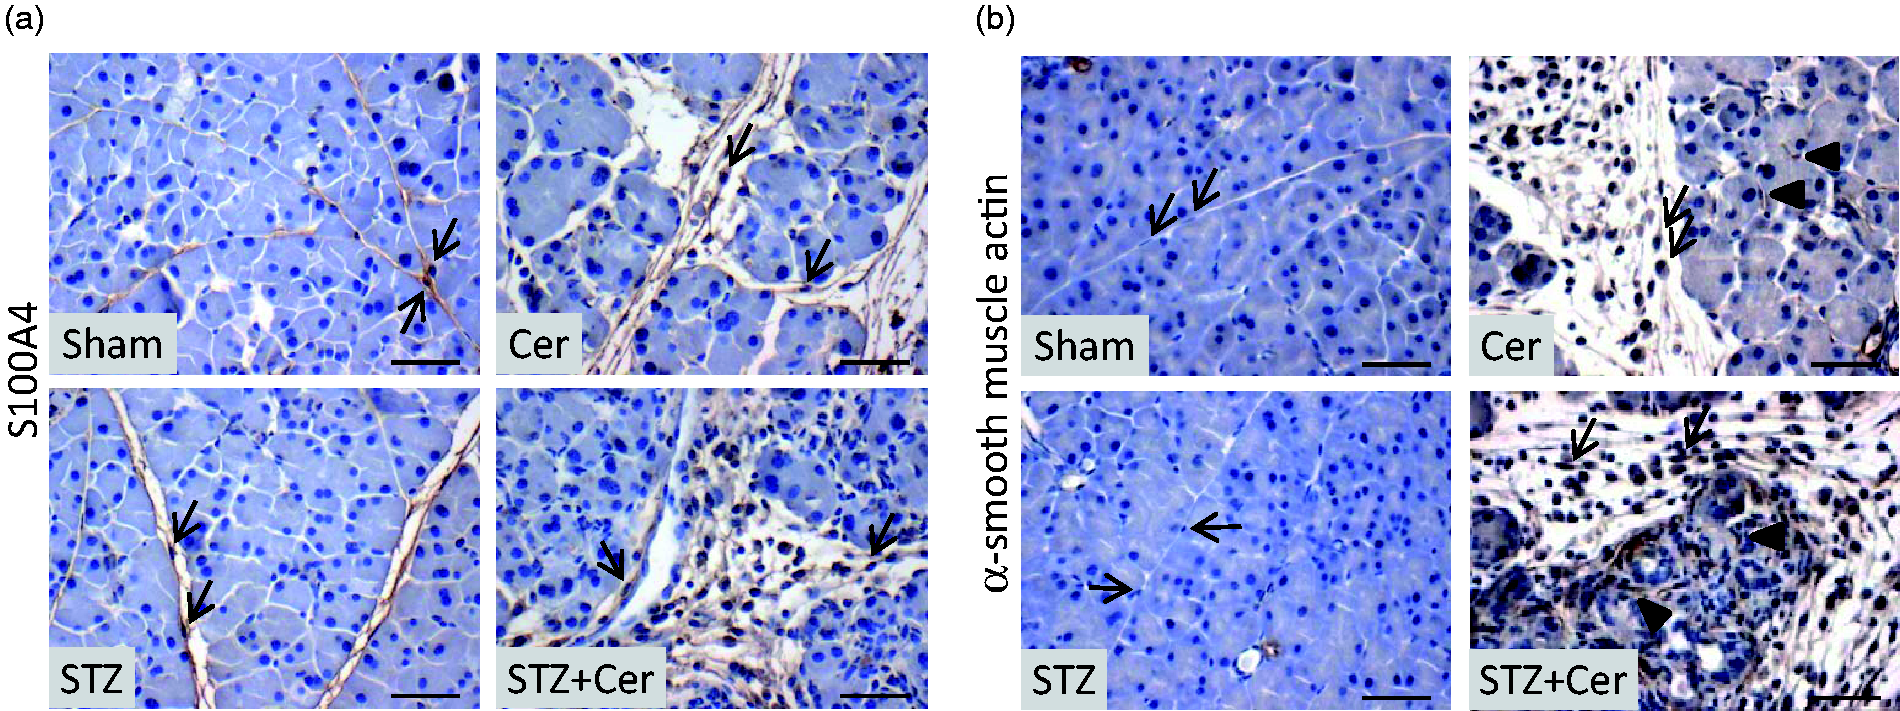
Diabetes enhances pancreatic atrophy and alters pancreas histology
Analysis of the pancreas on day 47 revealed a distinct atrophy of the pancreas in cerulein-treated mice compared to sham-treated animals (Figure 5a). This atrophy was even more pronounced in STZ plus cerulein-treated mice, when compared to sham-, STZ- or cerulein-treated animals (Figure 5a). Haematoxylin/eosin staining of sections on day 47 revealed no pathological features in the exocrine tissue in sham- and STZ-treated mice, whereas cerulein and especially STZ plus cerulein-treated animals had fields of acinar cells interrupted by interstitial cells (Figure 5b). In addition, beginning acinar to ductal metaplasia was often observed in STZ plus cerulein-treated mice (Figure 5b).
Diabetes aggravates pancreatic atrophy, and alters the histology. Pancreas to body weight ratio was determined in control (Sham) and cerulein- (Cer), streptozotocin (STZ) or streptozotocin plus cerulein- (STZ + Cer) treated mice (a) on day 47. Histology was evaluated by haematoxylin/eosin staining of pancreas sections in mice of the indicated cohorts on day 47 (b). Box plots indicate the median, the 25th and 75th percentiles in the form of a box, and the 10th and 90th percentiles in the form of whiskers. Significant differences between the cohorts are indicated, *P ≤ 0.003, bar = 50 µm. (A color version of this figure is available in the online journal.)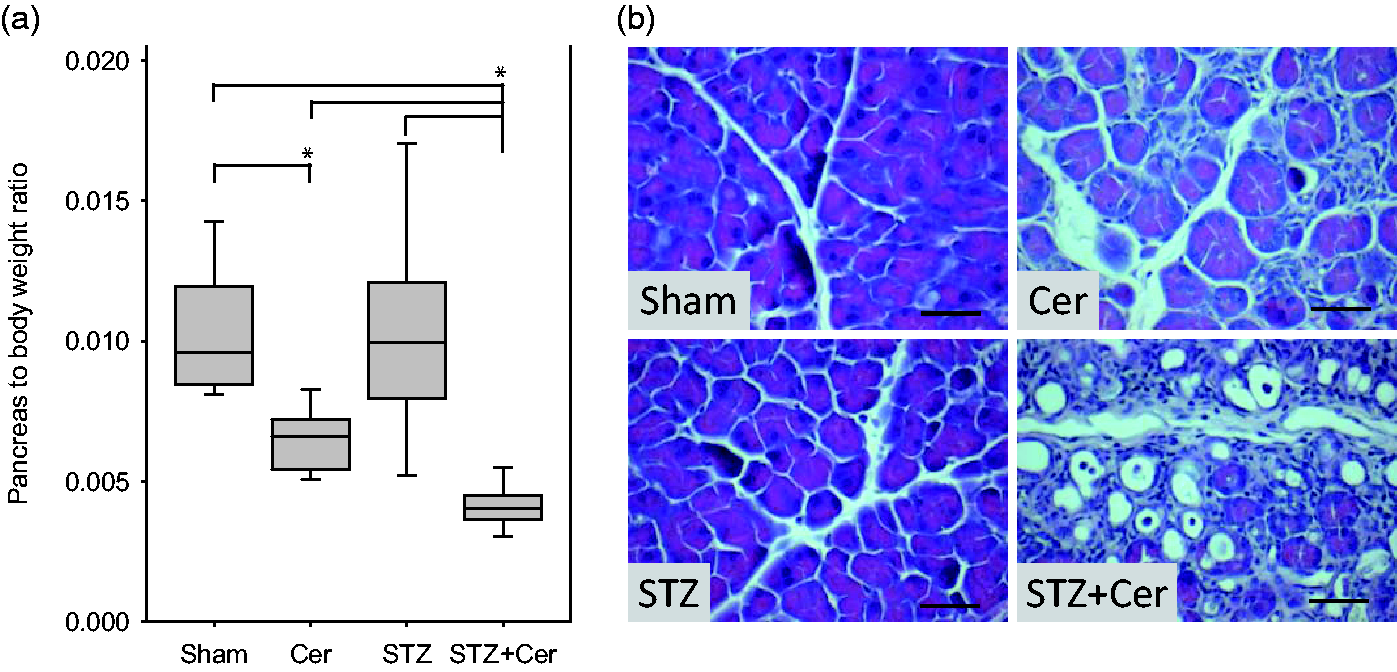
Diabetes enhances inflammation and cell death
On day 26, a significantly increased number of CAE positive infiltrating inflammatory cells were observed in the pancreas of cerulein-treated mice when compared to sham-treated animals (Figure 6a). STZ plus cerulein-treated mice showed an even stronger increase in the number of CAE+ inflammatory cells when compared to sham-, STZ- or cerulein-treated animals (Figure 6a). Cell death of acinar cells was modestly increased in the mouse cohort treated with cerulein, whereas a major increase in dying acinar cells was observed in mice treated with STZ plus cerulein (Figure 6b).
Diabetes activates inflammation and cell death. Indicated parameters were assessed in control mice (Sham) and cerulein- (Cer), streptozotocin- (STZ) or streptozotocin plus cerulein- (STZ + Cer) treated cohorts on day 26. The number of CAE+ inflammatory cells per field was quantified (a) and cell death was evaluated by determining the number of ApopTag positive acinar cells per field (b). Box plots indicate the median, the 25th and 75th percentiles in the form of a box, and the 10th and 90th percentiles in the form of whiskers. Significant differences between the cohorts are indicated, *P ≤ 0.003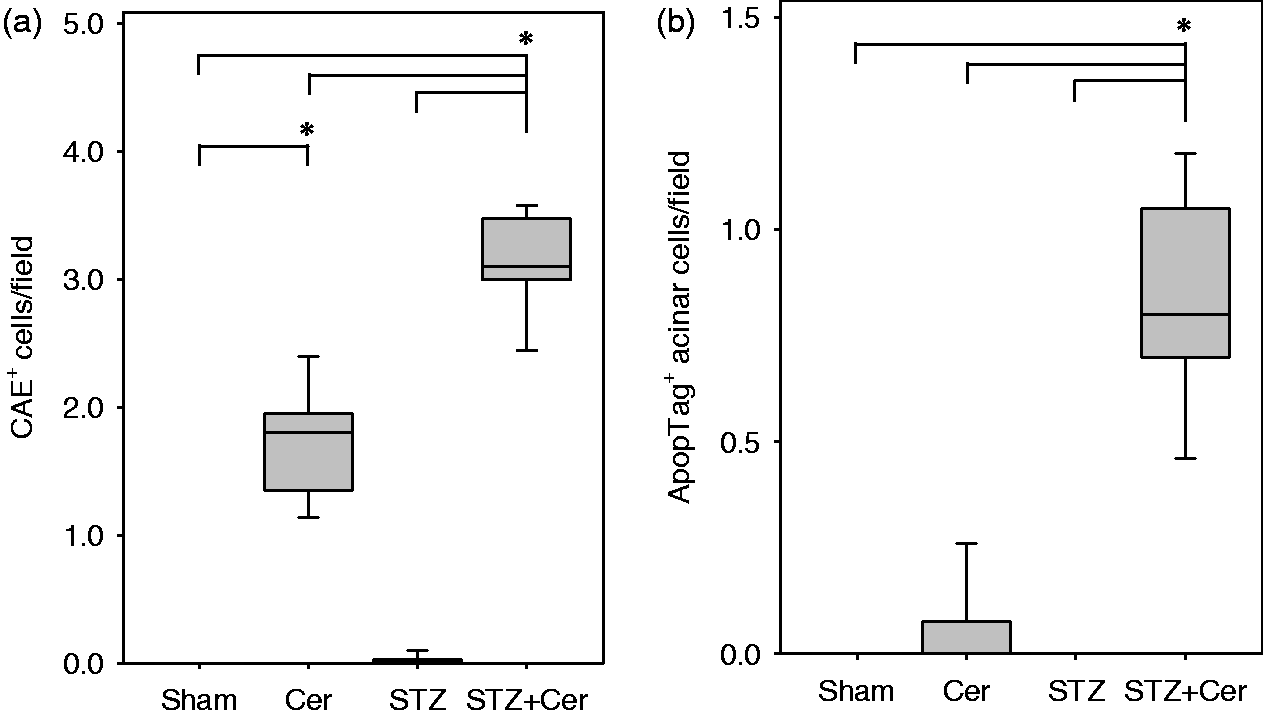
Discussion
The presented data demonstrate that diabetes (i) enhances collagen I deposition, (ii) increases proliferation of interstitial cells, (iii) stimulates the expression of α-smooth muscle actin in stellate cells, (iv) aggravates inflammation and (v) induces cell death during chronic pancreatitis. Diabetes leads, therefore, to a detrimental increase in fibrosis and pancreatic atrophy within three weeks of chronic pancreatitis. Thus, diabetes fundamentally aggravates the progression of chronic pancreatitis.
The observations in this study correlate well with a clinical study describing that diabetes is a mortality risk factor for chronic pancreatitis. 13 A detrimental influence of diabetes has also been discussed in the context of acute pancreatitis. 15 For example, patients with diabetes have a higher risk of acute pancreatitis and hyperglycaemia may predispose patients with acute pancreatitis to systemic organ failure.16–19 In addition, blood glucose level is an accurate predictor of outcome in gallstone pancreatitis and an important criterion for assessing the prognosis of acute pancreatitis by the Ranson score.20,21 However, a definite cause and effect relationship between diabetes and pancreatitis cannot be evaluated in these clinical studies, but needs to be addressed in an experimental setting.
Only few experimental data are available that address the question whether diabetes influences pancreatitis. For example, hyperglycaemia correlates with increased inflammation during chronic pancreatitis in CCR2 loss of function mice. 22 In addition, we demonstrated in a previous study that diabetes increases tissue damage and reduces regeneration in the pancreas after acute pancreatitis. 23 Both publications are consistent with this study and support the hypothesis that diabetes has a major influence on the exocrine compartment during pancreatitis.
The observed aggravation of chronic pancreatitis by diabetes raises the question whether diabetes has a direct effect on acinar cells and stellate cells. A direct effect of diabetes on acinar cells has been described previously and has been summarised as so called endocrine to exocrine axis hypothesis.1,24 For example, numerous publications document that diabetes reduces the secretion of digestive enzymes such as amylase.25–27 These observations might partially explain exocrine deficiency that can be observed in some diabetic patients. 28 However, it seems to be counterintuitive that the aggravation of pancreatitis by diabetes could be explained by exocrine insufficiency of acinar cells. It is more likely that diabetes has a profound influence on pancreatitis through other mechanisms such as modulation of the inflammatory response or the aggravation of cell death.
A direct effect of diabetes on stellate cells is supported by some in vitro experiments. For example, high glucose concentration has been reported to induce proliferation and synthesis of extracellular matrix proteins in interstitial cells which were isolated from the pancreas.29–31 However, since STZ-treated hyperglycaemic mice did not have any obviously increased collagen I deposition or activation of stellate cells, higher glucose concentration alone seems to be insufficient to induce fibrosis in vivo. Only in the context of chronic pancreatitis we observed that diabetes increased collagen deposition and activation of stellate cells. This suggests that diabetes does not cause, but aggravates inflammation-induced fibrosis. However, we cannot determine if diabetes stimulates stellate cells directly or indirectly, for example, via modulation of inflammation. Nevertheless the characterised aggravation of fibrosis by diabetes might be of clinical relevance, since some clinical studies support this conclusion. For example, enhanced fibrosis was observed post mortem in the pancreas of patients with type 2 diabetes. 32 In addition, enhanced fibrosis was also observed in other organs, in diabetic patients with hepatitis C virus-infected liver and in patients suffering from idiopathic pulmonary fibrosis.33,34
As a secondary finding, we observed that diabetes moderately increased proliferation of islet cells. This is consistent with previously published data, describing increased proliferation of β-cells as well as α- and δ-cells in islets after application of STZ.35–37 To our surprise application of supraphysiological levels of cerulein, an analogue of cholecystokinin, did not increase, but rather reduced the proliferation of islet cells. This is not consistent with previous publications, which describe increased proliferation of islet cells after application of moderate levels of cholecystokinin.38,39 We assume that the inflammatory micromilieu caused by supraphysiological levels of cerulein has the opposite effect than administration of moderate concentrations of cholecystokinin.
Recently, an intensified insulin therapy for patients with pancreatitis as well as for critically ill patients in general has been widely discussed.40–42 Since the danger of hypoglycaemia in patients with pancreatitis is high, a conservative insulin therapy is usually pursued.8,43,44 However, studies also report that a more intensified careful insulin therapy can be applied to patients with chronic pancreatitis without increasing the incidence of hypoglycaemic events. 42 Thus, if diabetes had a similar strong negative effect on pancreatitis in humans as observed in mice, a more intensified insulin therapy could be beneficial to some patients.
Footnotes
Author contribution
All authors participated in the design, interpretation of the studies, analysis of the data and review of the manuscript; NK, DZ, TR and BG conducted experiments.
ACKNOWLEDGMENTS
We thank Berit Blendow, Dorothea Frenz, Eva Lorbeer-Rehfeldt and Maren Nerowski (Institute for Experimental Surgery, University of Rostock) for excellent technical assistance.
This study was supported by the Forschungsförderung der Medizinischen Fakultät der Rostocker Universität (FORUN) (project 889017).