
Abstract
Multiple sclerosis (MS) is a disease induced by demyelination in the central nervous system, and the remission period of MS is crucial for remyelination. In addition, abnormal levels of thyroid hormone (TH) have been identified in MS. However, in the clinic, insufficient attention has been paid to the role of TH in the remission period. Indeed, TH not only functions in the development of the brain but also affects myelination. Therefore, it is necessary to observe the effect of TH on remyelination during this period. A model of demyelination induced by cuprizone (CPZ) was used to observe the function of TH in remyelination during the remission period of MS. Through weighing and behavioral tests, we found that TH improved the physical symptoms of mice impaired by CPZ. Supplementation of TH led to the repair of myelin as detected by immunohistochemistry and western blot. In addition, a sufficient TH supply resulted in an increase in myelinated axons without affecting myelin thickness and g ratio in the corpus callosum, as detected by electron microscopy. Double immunostaining with myelin basic protein and neurofilament 200 (NF200) showed that the CPZ-induced impairment of axons was alleviated by TH. Conversely, insufficient TH induced by 6-propyl-2-thiouracil resulted in the enlargement of mitochondria. Furthermore, we found that an adequate supply of TH promoted the proliferation and differentiation of oligodendrocyte lineage cells by immunofluorescence, which was beneficial to remyelination. Further, we found that TH reduced the number of astrocytes without affecting microglia. Conclusively, it was shown that TH alleviated demyelination induced by CPZ by promoting the development of oligodendrocyte lineage cells and remyelination. The critical time for remyelination is the remission period of MS. TH plays a significant role in alleviating demyelination during the remission period in the clinical treatment of MS.
Introduction
Multiple sclerosis (MS), a classical demyelination disease, is characterized by pathological changes, including inflammation, demyelination, and axon loss.1–3 In studies of classical relapsing–remitting MS, the remission period has been characterized as a critical time for the repair of damaged myelin sheaths and axons. Demyelinated axons would be rewrapped by the regenerated myelin sheath, thus ameliorating axonal dysfunction. The remission period is also considered the period of remyelination.4,5
However, patients with symptoms of remission always leave the hospital, so they receive little treatment during this time and doctors pay little attention to the remission period. 6 Patients who suffer primary or secondary progressive MS (PPMS and SPMS), two special clinical types of MS that do not have remission periods, rapidly develop severe disabilities.7–9 The most conspicuous difference between PPMS/SPMS and the classical relapsing–remitting MS is the remission period, when remyelination occurs. The remission stage was defined as a critical window, in which the promotion of remyelination leads to the inhibition of disease progression. The stage is the several weeks following the six-week cuprizone (CPZ) diet in mice. 10 This suggests that the absence of a remission period may be highly related to the extent of demyelination in PPMS and SPMS. The adult brain can generate oligodendrocytes to repair damaged axons, but remyelination in relapsing–remitting MS is incomplete and eventually fails.11–13 Extracellular and intracellular pathways affect the formation of myelin in CNS. 14 Although there is a remission period in relapsing–remitting MS, the course of the disease and pathology are still progressive and cumulative. The remission period is a key time for the regeneration of the myelin sheath. The prognosis of patients with MS may be improved if we can maintain adequate and functional levels of remyelination and effective neuroprotection in the remission period.
Studies suggest that thyroid hormone (TH) is an important factor affecting the progression of MS. The active form of TH in body is 3,3′,5′-triiodothyronine (T3), which is transformed from 3,5,3,5-tetraiodothyronine (T4). The ratio of T4/T3 in the cerebrospinal fluid of patients is high, which is part of the clinical classification of MS. 15 It is well established that TH is required for normal timing in the differentiation and maturation of oligodendrocyte progenitor cells (OPCs). 16 TH is also necessary for arresting the cell cycle,17,18 producing the myelin sheath 19 and transdifferentiation. 20 In addition to a role in the differentiation and maturation of oligodendrocytes via nuclear hormone receptors, TH also plays a role in the migration of OPCs in the subventricular zone (SVZ).21–23 A recent study shows that the effect of TH on cortical remyelination alleviates CPZ-induced demyelination. 24 However, the role of TH in remyelination during the remission period remains unknown.
In this study, we intend to identify whether TH can promote remyelination in the remission period or not. We also investigate the effect of TH on oligodendrocyte lineage cells, axons, astrocytes, and microglia cells. The aim is to provide a new insight in the role of TH during remyelination and suggest a promising treatment for MS during the remission period.
Materials and methods
Animals and CPZ treatment
Six-week-old C57BL/6 wild type (WT) male mice were obtained from the Experimental Animal Center of the Third Military Medical University. The reason for not choosing female mice is that demyelination induced by CPZ is similar in male and female C57BL/6 mice. 25 Besides, estrogen might have some impacts on CPZ-induced model. So, male mice were chosen for this study. All experiments in this study were performed in accordance with protocols specifically approved (IACUC: 09446) by the Third Military Medical University Institutional Animal Care and Use Committee. The mice were divided into eight groups: normal (N), N+PTU, N+Phosphate buffered saline (PBS), N+T3, CPZ+N, CPZ+PTU, CPZ+PBS, and CPZ+T3. For CPZ treatment, 88 mice (11 animals per group) weighing 17.34±0.44 g were housed (five animals per cage) and maintained with water (N, N+PTU, N+PBS, and N+T3 groups) or water containing 0.2% CPZ (CPZ+N, CPZ+PTU, CPZ+PBS, CPZ+T3 groups) for six weeks.
Reagents and antibodies
CPZ (Sigma-Aldrich Co, St Louis, USA) with the concentration of 0.2% was used to induce demyelination. 6-propyl-2-thiouracil (PTU; Sigma-Aldrich Co, St Louis, USA), an antihyperthyroid agent, was used to induce hypothyroidism. T3 (Sigma-Aldrich Co, St Louis, USA) was used to observe remyelination. Luxol fast blue (LFB; Sigma-Aldrich Co, St Louis, USA) was used to observe myelin sheaths. Fixed sections were blocked with 1% albumin from bovine serum (BSA) in 0.4% Triton X-100 for 30 min at 37℃ and subsequently incubated in primary antibodies overnight at 4℃. Primary antibodies included goat antimyelin basic protein (MBP; Santa Cruz Biotechnology, Inc., Dallas, Texas, USA), rabbit anticorpus callosum1 (CC1; Merck Millipore, Inc., Darmstadt, Germany), goat anti-Oligodendrocyte lineage transcription factor 2 (anti-Olig2; Merck Millipore, Inc., Darmstadt, Germany), goat anti-Neuron-glia antigen 2 (anti-NG2; Merck Millipore, Inc., Darmstadt, Germany), goat anti-F4/80 (Bioscience GmbH, Dümmer, Germany), mouse antiglial fibrillary acidic protein (anti-GFAP; Sigma-Aldrich Co, St Louis, USA), goat anti-neurofilament 200 (anti-NF200; Sigma-Aldrich Co, St Louis, USA), and β-actin (Santa Cruz Biotechnology, Inc., Dallas, Texas, USA). Fluorescein isothiocyanate (FITC) or Cy3 labeled secondary antibodies, either anti-goat (Invitrogen, Thermo Fisher Scientific Inc., Carlsbad, California, USA) or anti-rabbit (Merck Millipore, Inc., Darmstadt, Germany), were used for immunofluorescence. Alternatively, biotinylated anti-goat or anti-mouse (Vector Laboratories, Inc., Burlingame, California, USA) secondary antibodies were used for immunochemistry. Oligodendrocytes and astrocytes were observed using 0.05% 3,3’-diaminobenzadine (DAB, Zhongshan Co, Ltd, Beijing, China). A polyclonal rabbit immunoglobulin G (Santa Cruz Biotechnology, Inc., Dallas, Texas, USA) was used as a negative control. Horseradish peroxidase-conjugated secondary antibodies (Santa Cruz Biotechnology, Inc., Dallas, Texas, USA) were used for western blots.
Grouping
N, N+PTU, N+PBS, and N+T3 groups were administered a normal diet for six weeks. For the next two weeks, the N group continued to receive a normal diet. The N+PTU group was given 0.15% PTU in their drinking water as a control for the CPZ+PTU group. The N+PBS group received daily intraperitoneal (IP) injections of PBS as a control for the CPZ+PBS group. The N+T3 group received daily IP injections with T3 (300 ng/g, weight) as control for the CPZ+T3 group (Figure 1(a)).
Thyroid hormone stimulates the recovery of body weight and behaviors impaired by CPZ. (a) The eight treatment groups are N, N+PTU, N+PBS, N+T3, CPZ+N, CPZ+PTU, CPZ+PBS, CPZ+T3 (n = 11 in each group). The N group was supplied a normal diet in eight weeks. The N+PTU, N+PBS, and the N+T3 groups were supplied a normal diet for the initial six weeks. Over the following two weeks, they received a diet with 0.15% PTU, a normal diet with 6 µL/g PBS via IP injection and a normal diet with 300 ng/g T3 via IP injection. The CPZ+N group was administered a diet with 0.2% CPZ for six weeks and normal diet for the following two weeks. The CPZ+PTU, CPZ+PBS, and CPZ+T3 groups received 0.2% CPZ for six weeks and then two weeks with a diet of 0.15% PTU, a normal diet with 6 µL/g PBS, and IP injections of 300 ng/g T3 IP injection. (b) Relative weight was recorded every day for eight groups to observe the physical condition of mice. The relative weight of mice was suppressed by CPZ in the initial six weeks. After different manipulations over the following two weeks the relative weight in the CPZ+PTU group was less than that in the CPZ+N group **P-value < 0.05. The relative weight in the CPZ+T3 group was more than that in the CPZ+PTU group *P-value < 0.05. (c) To observe the ability of motor coordination, rota-rod tests were carried out at a speed of 40 r/min for 3 min every other day. The maintain time on rota-rod for the CPZ+PTU group was shorter than in the CPZ+N group** P-value < 0.05. The maintain time of the CPZ+T3 group was longer than in the CPZ+ PBS group* P-value < 0.05. (d) Through open field tests, we recorded the trails of mice in the CPZ+N, CPZ+PTU, CPZ+PBS, and CPZ+T3 groups. These data were used to determine the distance traveled, the ratio of the central area time to the total time, and the ratio of the central area distance to the total distance. The central area was the central grid of a nine-grid diagram. (e) Statistical analysis showed that the total traveled distance in the CPZ+PTU group was shorter than in the CPZ+N group *P-value < 0.05. Trials on the CPZ+T3 group compared with the CPZ+PBS group **P-value < 0.05. (f) There were no differences in the ratio of central area time to total time and the ratio of the central area distance to the total distance among the CPZ+N, CPZ+PTU, CPZ+PBS, and CPZ+T3 groups. ANOVA Test: P-value > 0.05. (A color version of this figure is available in the online journal.)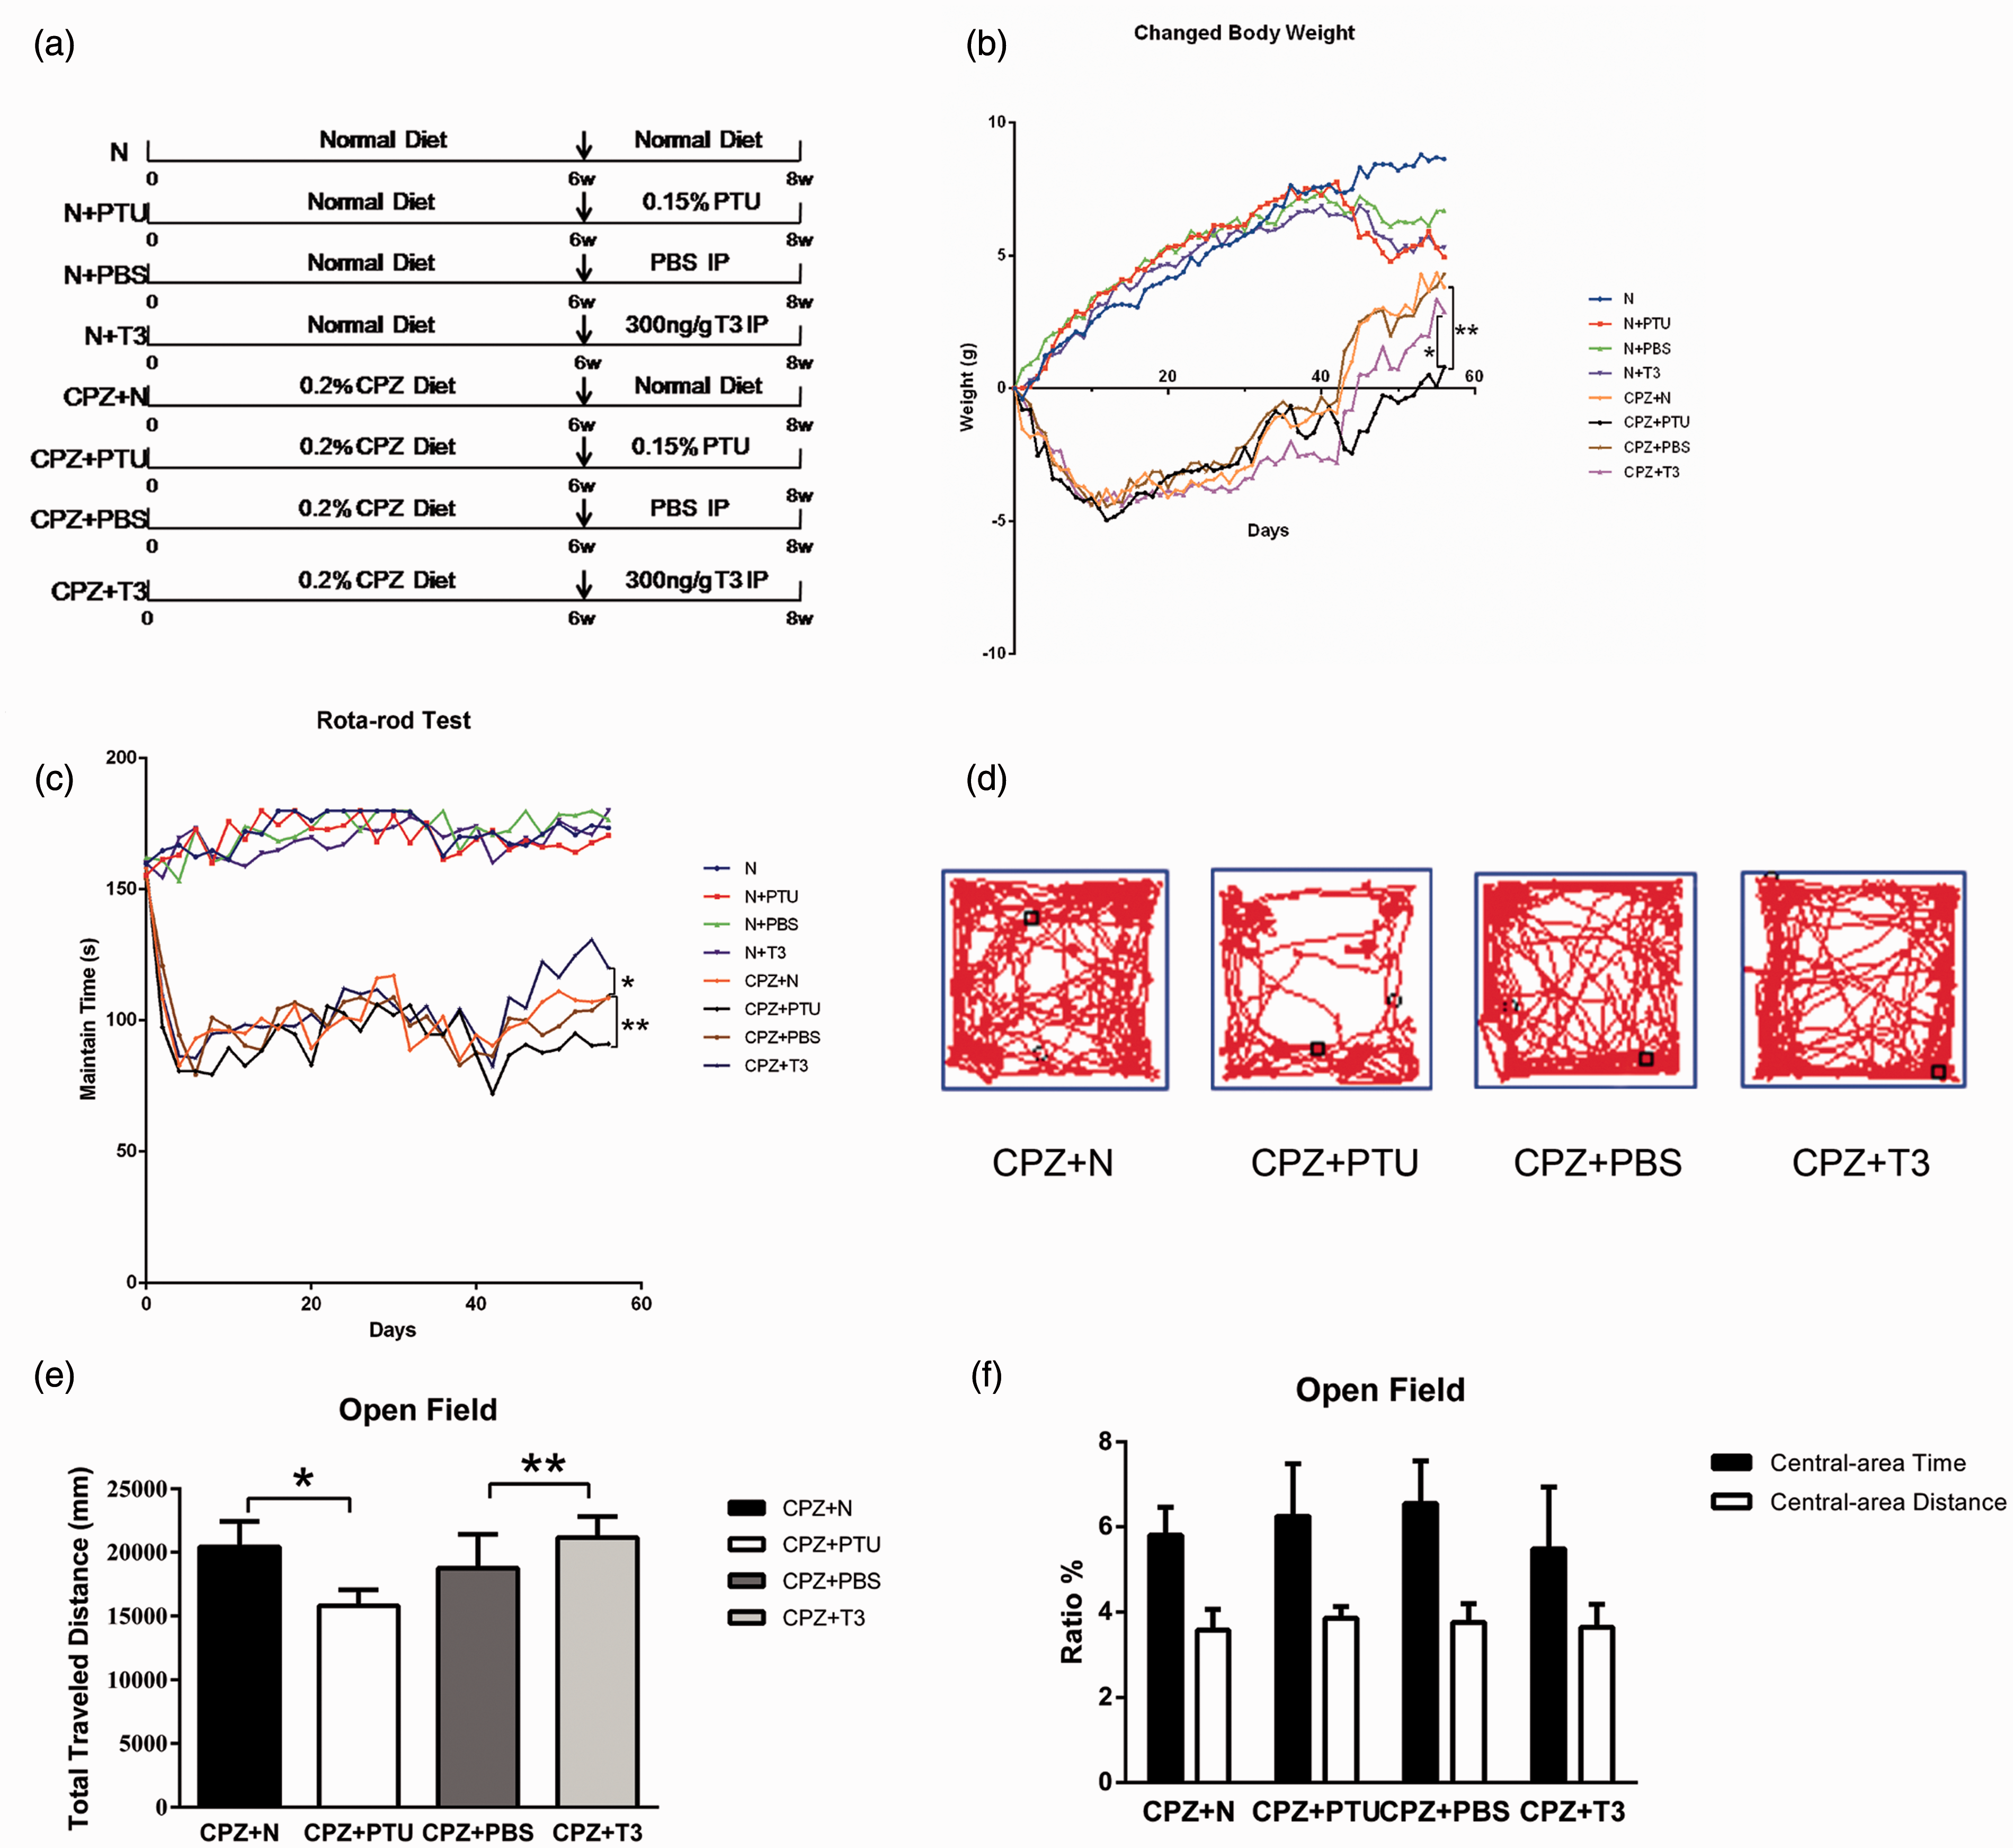
The CPZ+N, CPZ+PTU, CPZ+PBS, and the CPZ+T3 groups were given CPZ for six weeks to induce demyelination. For the next two weeks, the CPZ+N group received a normal diet. The CPZ+PTU group received 0.15% PTU in the drinking water as a negative control for the CPZ+T3 group. The CPZ+PBS group was IP injected with 0.1% PBS as control for the CPZ+T3 group. The CPZ+T3 group was IP injected with T3 (300 ng/g, weight) as the experimental group (Figure 1(a)).
Weighing and rota-rod tests
To monitor the physical condition of mice, we weighed them every day at 12:00. The daily weight was recorded, which was used to subtract the initial weight. The deviation of them is defined as relative weight, which is observed to assess the general health of mice. The rota-rod test, widely used to assess motor coordination, may be affected by demyelination.26,27 We trained mice on the accelerating rota-rod (YLS-4 C Instruments, Biowill Co, Ltd, Shanghai, China) at a slow speed of 5–10 r/min for 3 minutes, three times per day on every other day. We then increased the speed from 5 to 40 r/min over 90 s and maintained this high speed for 3 min while testing mice at 13:00 every other day in eight weeks. The trial was considered complete once the mouse fell off or gripped rungs and spun for two continuous circles. 28 The time animals remained on the rota-rod was recorded and is referred to as the maintain time.
Open field test and the assay of serum TH
During the 6–8 weeks, mice were tested in an open field station (Biowill Co, Ltd, Shanghai, China) to observe their behavioral responses and activities in a new environment. The mice were placed in the central area and allowed to move freely around an open field station to explore the environment for 10 min. A video camera was placed above the square to record the behavioral paths of mice for analysis by a video tracking program (Biowill Co, Ltd, Shanghai, China). The total distance traveled, the central area time, and the central area distance were recorded.
A total of 0.5 mL blood of each mouse was collected to obtain plasma via centrifugation at 4000 r/min for 10 min. Total levels of serum T3 and T4 (ng/mL) were measured by radioimmunoassay kits (3 V-diagnostic company, Shenzhen, China).
Tissue processing
For immunohistochemistry experiments, mice were anesthetized by IP injection with 1% sodium pentobarbital. Animals were then quickly transcardially perfused with 37℃ 0.9% saline followed by a slow perfusion with Zamboni’s fixative for tissue fixation. Tissue was postfixed overnight at 4℃ in Zamboni’s fixative and then stored in 30% sucrose at 4℃ for cryoprotection. Coronal sections (20 µm) were obtained using a cryostat (Leica CM1850, Biosystems Nussloch GmbH, Germany) and collected in Zamboni’s fixative.
Some mice were euthanized by cervical dislocation. Their brains were dissected and immediately frozen until used in western blots.
LFB staining
We performed LFB staining to detect mature myelin. Slides were incubated in 0.1% LFB overnight. Sections were rinsed in 95% ethyl alcohol (ETOH) and double distilled water (ddH2O) and differentiated with 0.05% lithium carbonate. Once the appropriate intensity of LFB staining was achieved, the sections were rinsed in ddH2O and 70% alcohol and then dehydrated by a graded series of alcohol and xylene. Photos were taken with an Olympus BX60 microscope.
Immunofluorescence
Coronal sections were incubated with 1% BSA in 0.4% Triton X-100 for 30 min at 37℃ to block endogenous enzyme activity. Brain sections were then incubated overnight at 4℃ with primary antibodies, including goat anti-MBP (1:200), rabbit anti-CC1 (1:200), goat anti-Olig2 (1:200), goat anti-NG2 (1:100), goat anti-F4/80 (1:500), and goat anti-NF200 (1:1000). Sections were incubated with a FITC- or Cy3-labeled secondary antibody, either anti-goat (1:500) or anti-rabbit (1:500). Nuclei were stained with 4′,6-diamidino-2-phenylindole (DAPI, 1 µg/mL, Sigma-Aldrich Co, St Louis, USA). Brain sections were mounted on glass slides with Dako mounting medium (Dako Co Ltd, Glostrup, Denmark). For double immunofluorescence labeling, different host primary antibodies were required. This was performed as previously described. However, sections were rinsed three times with 0.01 mol/L PBS after labeling with the primary and secondary antibodies for the initial marker. After this, the second primary and secondary antibodies were added. For negative controls, incubation with primary antibodies was replaced by incubation with PBS or polyclonal rabbit immunoglobulin G. Immunostaining for each section was acquired by a Leica immunofluorescence microscope and a Leica confocal laser scanning microscope (Leica Microsystems, Heidelberg GmbH, Mannheim, Germany).
Immunohistochemistry
Brain sections were rinsed with 0.01 mol/L PBS and then incubated in 3% H2O2 for 15 min, followed by 1% BSA in 0.4% Triton X-100 for 30 min at 37℃. Sections were subsequently incubated overnight at 4℃ with goat anti-MBP (1:200) or mouse anti-GFAP (1:200). Sections were incubated for 30 min with biotinylated anti-goat or anti-mouse (1:200) secondary antibodies. The avidin biotin peroxidase method (ABC kit, Vector Laboratories Burlingame, CA) was performed according to the manufacturer’s protocol and used DAB as a substrate. A control in which the primary antibody was omitted was evaluated. Sections were dehydrated using increasing concentrations of ethanol (50–100%) followed by immersion in xylol. Samples were then mounted with DPX-mounted medium (Fluka Analytical, Sigma, Aldrich Co, St Louis, USA).
Western blot analysis
Proteins extracted from the median and paramedian areas of the CC were homogenized with denaturing solution (T-PER tissue protein extraction reagent, Thermo Fisher Scientific Inc., Carlsbad, California, USA). Brain homogenates were kept on ice for 30 min and then centrifuged at speed of 12,000 r/min for 30 min. The supernatant was collected and the protein concentration was measured by a microplate reader (Bio-Rad model 680). Proteins were diluted to the same concentration using sample buffer. Lysates were separated by sodium dodecyl sulfate polyacrylamide gel electrophoresis gels (SDS-PAGE) and transferred to polyvinylidene fluoride (PVDF) membranes following standard techniques. Membranes were blocked with 5% non-fat dried milk in tris-buffered saline with tween (TBS/T) and then incubated overnight with the following primary antibodies: MBP (1:500) and GFAP (1:1000). After washing with TBS/T, blots were incubated with horseradish peroxidase-conjugated antibodies: anti-goat IgG (1:1000) for MBP and anti-mouse IgG (1:2000) for GFAP. Blots were developed using the ECL system (ECL Plus, Amersham Biosciences, Piscataway, USA).
Some membranes were stripped for 1 h at 60℃ in a sodium dodecyl sulfate (SDS) solution (2% SDS, 0.85% 2-ME, and 65 mM Tris–HCl [pH 6.8]), washed, and incubated with anti-β-actin mAb (1:2000) for 2 h as a loading control.
Extracted proteins were subjected to SDS-PAGE. Protein bands on PVDF membranes were detected by an enhanced chemiluminescence method (ECL kit, Invitrogen, Thermo Fisher Scientific Inc., Carlsbad, California, USA). The optical density (OD) values of the specific bands were analyzed by the image pro plus (IPP) 5.0 program. The mean ± SD of eight independent brain samples was used for analysis.
Transmission electron microscope
In the eighth week, mice from eight groups (n = 3 in each group) were deeply anesthetized and perfused via the left ventricle with 2.5% glutaraldehyde at 4℃ for 24 h. Small blocks from the CC were processed for electron microscopy and embedded in Epon resin, as previously described. 29 The ultrathin tissue sections were contrasted with uranyl acetate and lead citrate and then examined with a transmission electron microscope at 80 kV. We measured approximately 300 axons from the CC at 6200× and 24,000× in each group.
Statistical analysis
The results are reported as the mean ± SD. Data were analyzed using one-way analysis of variance, the Friedman Test, Bonferroni’s multiple comparison post-test, and a t-test for independent samples. Statistical analyses were performed using Prism 6 (GraphPad Prism Software Inc, La Jolla, CA). The IPP5.0 software was used to quantify photographs and the results of western blots. Differences were considered statistically significant at a value of P < 0.05.
Results
TH stimulates the recovery of body weight and behaviors impaired by CPZ
To monitor their general condition, we checked the body weight of mice daily. The relative weight of mice in the N group increased by 8.63 ± 1.16 g by the eighth week. The relative weight trend in the N+PTU, N+PBS, and N+T3 groups was an initial decrease followed by an increase between the 6th sixth and 8th eighth week (Figure 1(b)). Relative weight increased by 4.93 ± 1.93 g in the N+PTU group, 6.7 ± 3.58 g in the N+PBS group, and 5.3 ± 0.72 g in the N+T3 group in the eighth week. However, the relative weights in these groups had no difference when compared with the N group (P > 0.05).
The administration of CPZ induced a dramatic decrease in weight, 4.175 ± 0.99 g, during the second week. Although the relative weight of mice recovered over the following four weeks, it remained decreased by 1.495 ± 1.24 g. At the sixth week, the diet of mice in the CPZ+N, CPZ+PTU, CPZ+PBS, and the CPZ+T3 groups changed to a normal diet and then further changes were made for each group. Relative weight recovery in the CPZ+PTU group was dramatically delayed and only increased by 1.14 ± 0.48 g by the eighth week. The relative weight increase in the CPZ+PTU group was much lower than in the CPZ+N group (4.46 ± 1.69 g) (P < 0.05). In contrast, the relative weight level of animals in the CPZ+T3 group in the eighth week had increased by 3.04 ± 0.16 g, less than in the CPZ+PBS group (4.24 ± 0.47 g) and higher than in the CPZ+PTU group (1.14 ± 0.48 g) (P < 0.05) (Figure 1(b)).
To assess the balance and motor coordination of mice, we used a rota-rod test and recorded the time animals maintained their balance on an accelerating and high-speed rod. The mice kept their balance well and seldom gripped the rungs. There were no differences in the maintain time among the N, N+PTU, N+PBS, and N+T3 groups. These were 174.4 ± 6.53 s in the N group, 172.0 ± 6.43 s in the N+PTU group, 175.2 ± 7.30 s in the N+PBS group, and 170.9 ± 6.21 s in the N+T3 group (P > 0.05) during the eighth week. However, the maintain time of CPZ-treated mice was significantly decreased in two weeks. This reached a stable level (85.66 ± 16.86 s) during the sixth week, which was still much lower than that of the N, N+PTU, N+PBS, and the N+T3 groups. Mice treated with CPZ frequently gripped the rungs (Figure 1(c)). After a change from the CPZ diet to a normal diet at the sixth week, the maintain time of mice increased in each group over the next two weeks. The maintain time in the eighth week was 95.00 ± 15.43 s in the CPZ+PTU group, which was lower than that in the CPZ+N group (116.40 ± 11.30 s) (P < 0.05). The CPZ+T3 group was 127.00 ± 14.71 s, higher than in the CPZ+PBS group (115.50 ± 6.81 s) (P < 0.05) (Figure 1(c)). PTU might block the recovery of balance and T3 could promote recovery.
To evaluate spontaneous activity and behavioral responses to a new environment, an open-field test was carried out between the sixth and eighth weeks. Total distance traveled was used to represent general locomotor activity. The ratio of the central area time to the total time and the ratio of the central area distance to the total distance were used to analyze behavior. In the sixth week, there was a significant decrease in activity and exploratory behavior in mice receiving the CPZ diet when compared with mice receiving a normal diet. Total distance traveled by mice receiving the CPZ diet decreased to 16,331.43 ± 2104.97 mm in comparison with normal mice (24,091.17 ± 2951.84 mm) (P < 0.05). However, there were no differences in the ratio of central area time to total time or in the ratio of central area distance to total distance between mice with the normal and CPZ diet. The ratio of central area time to total time was 5.640 ± 1.36% and the ratio of central area distance to total distance was 3.596 ± 2.27% in the CPZ+N group (Figure 1(d) and (f)). Similarly, the ratios were 5.860 ± 4.14% and 4.388 ± 1.73% in the N group (P > 0.05). The total distance traveled was used to test spontaneous activity and the exploratory behavior of mice. There were no differences between the CPZ+N and CPZ+PBS groups at the eighth week, which reached 20,396.96 ± 2047.39 and 19,747.35 ± 1682.11 mm, respectively (Figure 1(d) and (e)). However, the total distance traveled of mice in the CPZ+PTU group was only 15,803.98 ± 1241.49 mm, shorter than that of the CPZ+N group (20,396.96 ± 2047.39 mm) (P < 0.05) (Figure 1(d) and (e)). Conversely, the total distance traveled by mice in the CPZ+T3 group was 21,167.86 ± 1646.75 mm, longer than that of the CPZ+PBS group (19,747.35 ± 1682.11) (P < 0.05) (Figure 1(d) and (e)). There were no significant differences in the ratio of central area time to total time and the ratio of central area distance to total distance among these four groups: 5.640 ± 1.36 and 3.596 ± 2.27% in the CPZ+N group, 6.243 ± 2.78 and 3.817 ± 0.67% in the CPZ+PTU group, 5.988 ± 1.79 and 3.748 ± 0.99% in the CPZ+PBS group, and 5.503 ± 3.26 and 3.624 ± 1.23% in the CPZ+T3 group (P > 0.05) (Figure 1(f)).
TH promotes remyelination after CPZ-induced impairment
Radioimmunoassays were used to detect the levels of serum TH induced by PTU or T3. PTU significantly inhibited levels of T3 and T4. The level of T3 was 0.552 ± 0.071 ng/mL in the N+PTU group, lower than in the N group (0.740 ± 0.090 ng/mL) (P < 0.05), and it was 0.580 ± 0.091 ng/mL in the CPZ+PTU group, lower than in the CPZ+N group (0.770 ± 0.048 ng/mL) (P < 0.05) (Figure 2(a)). The level of T4 was 3.606 ± 3.255 ng/mL in the N+PTU group, much lower than in the N group (34.651 ± 7.297 ng/mL) (P < 0.05), and it was 4.652 ± 3.119 ng/mL in the CPZ+PTU group, much lower than in the CPZ+N group (33.130 ± 7.090 ng/mL) (P < 0.05) (Figure 2(b)). The level of T3 was 0.952 ± 0.093 ng/mL in the N+T3 group, higher than in the N+PBS group (0.757 ± 0.055 ng/mL) (P < 0.05), and it was 0.935 ± 0.110 ng/mL in the CPZ+T3 group, higher than in the CPZ+PBS group (0.733 ± 0.089 ng/mL) (P < 0.05) (Figure 2(a)). These data suggest that IP injections of T3 increased the total level of T3 in the serum of mice. The level of T4 in the N+T3 group was 4.514 ± 2.147 ng/mL, much lower than in the N+PBS group (34.776 ± 6.231 ng/mL) (P < 0.05), and it was 4.011 ± 2.068 ng/mL in the CPZ+T3 group, much lower than in the CPZ+PBS group (31.421 ± 5.795 ng/mL) (P < 0.05) (Figure 2(b)).
Thyroid hormone promotes remyelination after the impairment induced by CPZ. (a) Radioimmunoassays show differences in the T3 levels between the N and N+PTU groups * P-value < 0.05, between the CPZ+N and CPZ+PTU groups * P-value < 0.05, between the N+PBS and N+T3 groups ** P-value < 0.05, between the CPZ+PBS and CPZ+T3 ** P-value < 0.05. (b) Differences in the level of T4 can be found between the N and N+PTU groups **P-value < 0.05, between the CPZ+N and CPZ+PTU groups **P-value < 0.05, between the N+PBS and N+T3 groups * P-value < 0.05, between the CPZ+PBS and CPZ+T3 groups *P-value < 0.05. (c) Pictures of LFB staining and MBP immunohistochemistry staining in the CC, scale bars = 500 and 100 µm. (d) There were differences in the OD values of MBP immunohistochemistry staining between the CPZ+N and CPZ+PTU groups *P-value < 0.05, between the CPZ+PBS and CPZ+T3 groups **P-value < 0.05. (e) Pictures of MBP immunofluorescence staining in the CC taken by confocal laser scanning microscope, scale bar = 20 µm. (df) The expression of MBP in the CC was tested by western blot. (g) Results of western blots were analyzed by OD value. The expression of MBP in CPZ+PTU group was lower than that in CPZ+N group*P-value < 0.01. However, the amount of MBP in CPZ+T3 group was higher than that in CPZ+PBS group **P-value < 0.01. (A color version of this figure is available in the online journal.)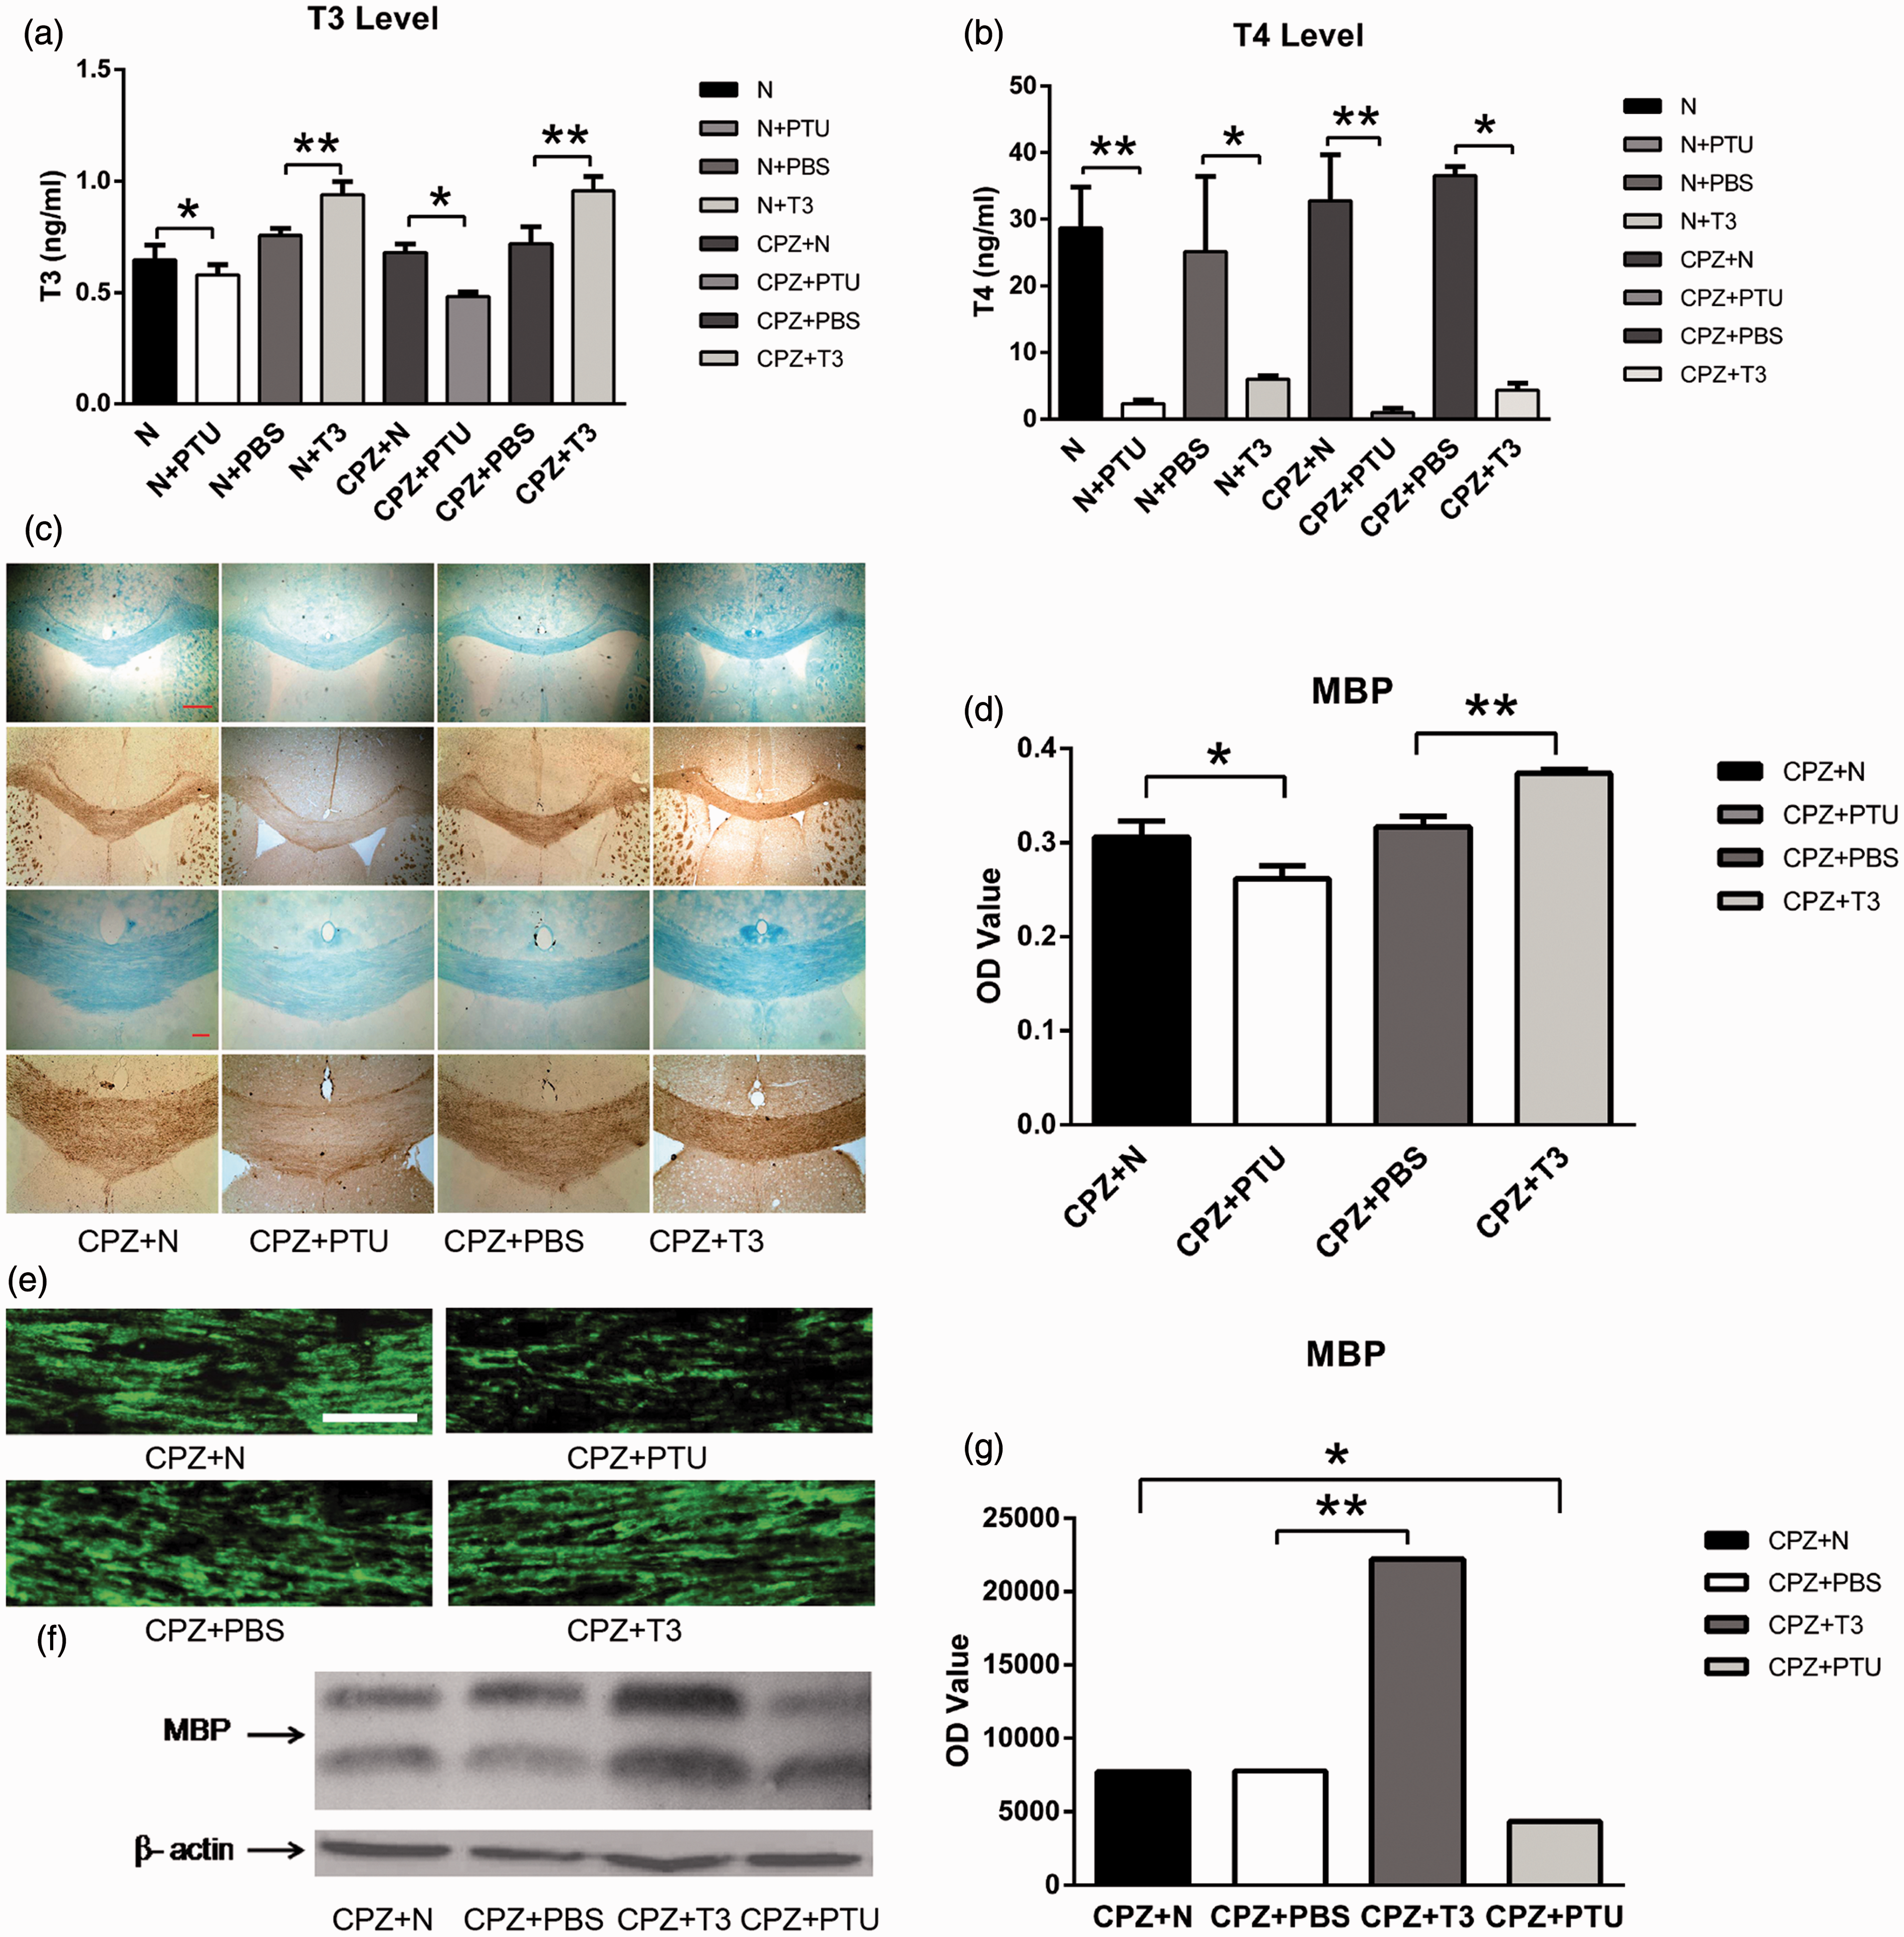
LFB staining and MBP immunochemistry staining were used to observe demyelination induced by CPZ in the CC at the sixth week. The OD value of MBP immuno-positive staining in the CPZ+N group was reduced to 61.3% of the N group (P < 0.05). The myelin sheath in the N, N+PTU, N+PBS, and the N+T3 groups at the eighth week showed no differences in the OD value of MBP immuno-positive staining: 0.3950 ± 0.0194 in the N group, 0.3850 ± 0.0085 in the N+PTU group, 0.3871 ± 0.0087 in the N+PBS group, and 0.3837 ± 0.0142 in the N+T3 group (P > 0.05). To observe remyelination, the OD values of MBP immuno-positive staining were analyzed in the CPZ+N, CPZ+PTU, CPZ+PBS, and CPZ+T3 groups. The OD value of the CPZ+PTU group was only 0.2620 ± 0.0136, much lower than in the CPZ+N group (0.3058 ± 0.0174) (P < 0.05) (Figure 2(c) and (d)). The OD value of the CPZ+T3 group was 0.3737 ± 0.04, higher than in the CPZ+PBS group (0.3164 ± 0.0115) (P < 0.05) (Figure 2(c) and (d)). These data show that PTU inhibited remyelination and T3 enhanced remyelination. High magnification, laser scanning confocal microscopy showed that myelin sheaths in the CC among the N, N+PTU, N+PBS, and the N+T3 groups were intact, had a high density, were continuous and compact. However, the myelin sheath in the CPZ+PTU group was loose, thin, discontinuous, and incomplete when compared with the CPZ+N group (Figure 2(e)). The expression of MBP was tested by western blot and analyzed by OD value. The OD value of the CPZ+PTU group was 4334.963, which was lower than that of the CPZ+N group (7711.965) (P < 0.05) (Figure 2(f) and (g)). The myelin sheath in the CPZ+T3 group was thicker, more continuous, and more compact than that of the CPZ+PBS group (Figure 2(e)). The OD value in the CPZ+T3 group was 22,215.21, which was extremely high in comparison to the CPZ+PBS group (7774.813) (P < 0.05) (Figure 2(f) and (g)).
TH promotes myelination of axons without affecting myelin thickness after CPZ-induced impairment
A transmission electron microscope was used to observe the number of myelinated axons and the myelin thickness. No differences were detected in the percentage of myelinated axons in the CC among the N, N+PTU, N+PBS, and N+T3 groups: 83.3 ± 6.7%/µm2 in the N group, 84.9 ± 6.4%/µm2 in the N+PTU group, 82.7 ± 6.4%/µm2 in the N+PBS group, and 84.7 ± 3.7%/µm2 in the N+T3 group. However, the percentage of myelinated axons in the CPZ+PTU group was just 7.2 ± 1.1%/µm2, much lower than in the CPZ+N group (33.8 ± 4%/µm2) (P < 0.05) (Figure 3(a) and (b)). In contrast, the percentage of myelinated axons in the CPZ+T3 group reached 57.3 ± 4.6%/µm2 in comparison with the CPZ+PBS group which was 33 ± 4%/µm2 (P < 0.05) (Figure 3(a) and (b)). However, there were no differences in myelin thickness among the CPZ+N, CPZ+PTU, CPZ+PBS, and CPZ+T3 groups (P > 0.05), which were 192.8 ± 91.39, 171.8 ± 63.43, 193.6 ± 87.32, and 180.30 ± 63.89 nm, respectively (Figure 3(c)). There were no differences in the g ratios among these groups (P > 0.05) (Figure 3(d)).
Transmission electron microscopy of myelin in the corpus callosum. (a) Electron micrographs of the CC in the CPZ+N,CPZ+PTU, CPZ+PBS, and CPZ+T3 groups, scale bar = 2 µm at 80 kV and 0.5 µm at 80 kV. (b) There were differences in the number of myelinated axons between the CPZ+N and the CPZ+PTU groups *P-value < 0.01, between the CPZ+PBS and the CPZ+T3 groups **P-value < 0.01. (c) There were no differences in myelin thickness between the CPZ+N, CPZ+PTU, CPZ+PBS, and CPZ+T3 groups. (d) There were no differences in the g ratio as analyzed by scatter plots of these four groups P-value > 0.05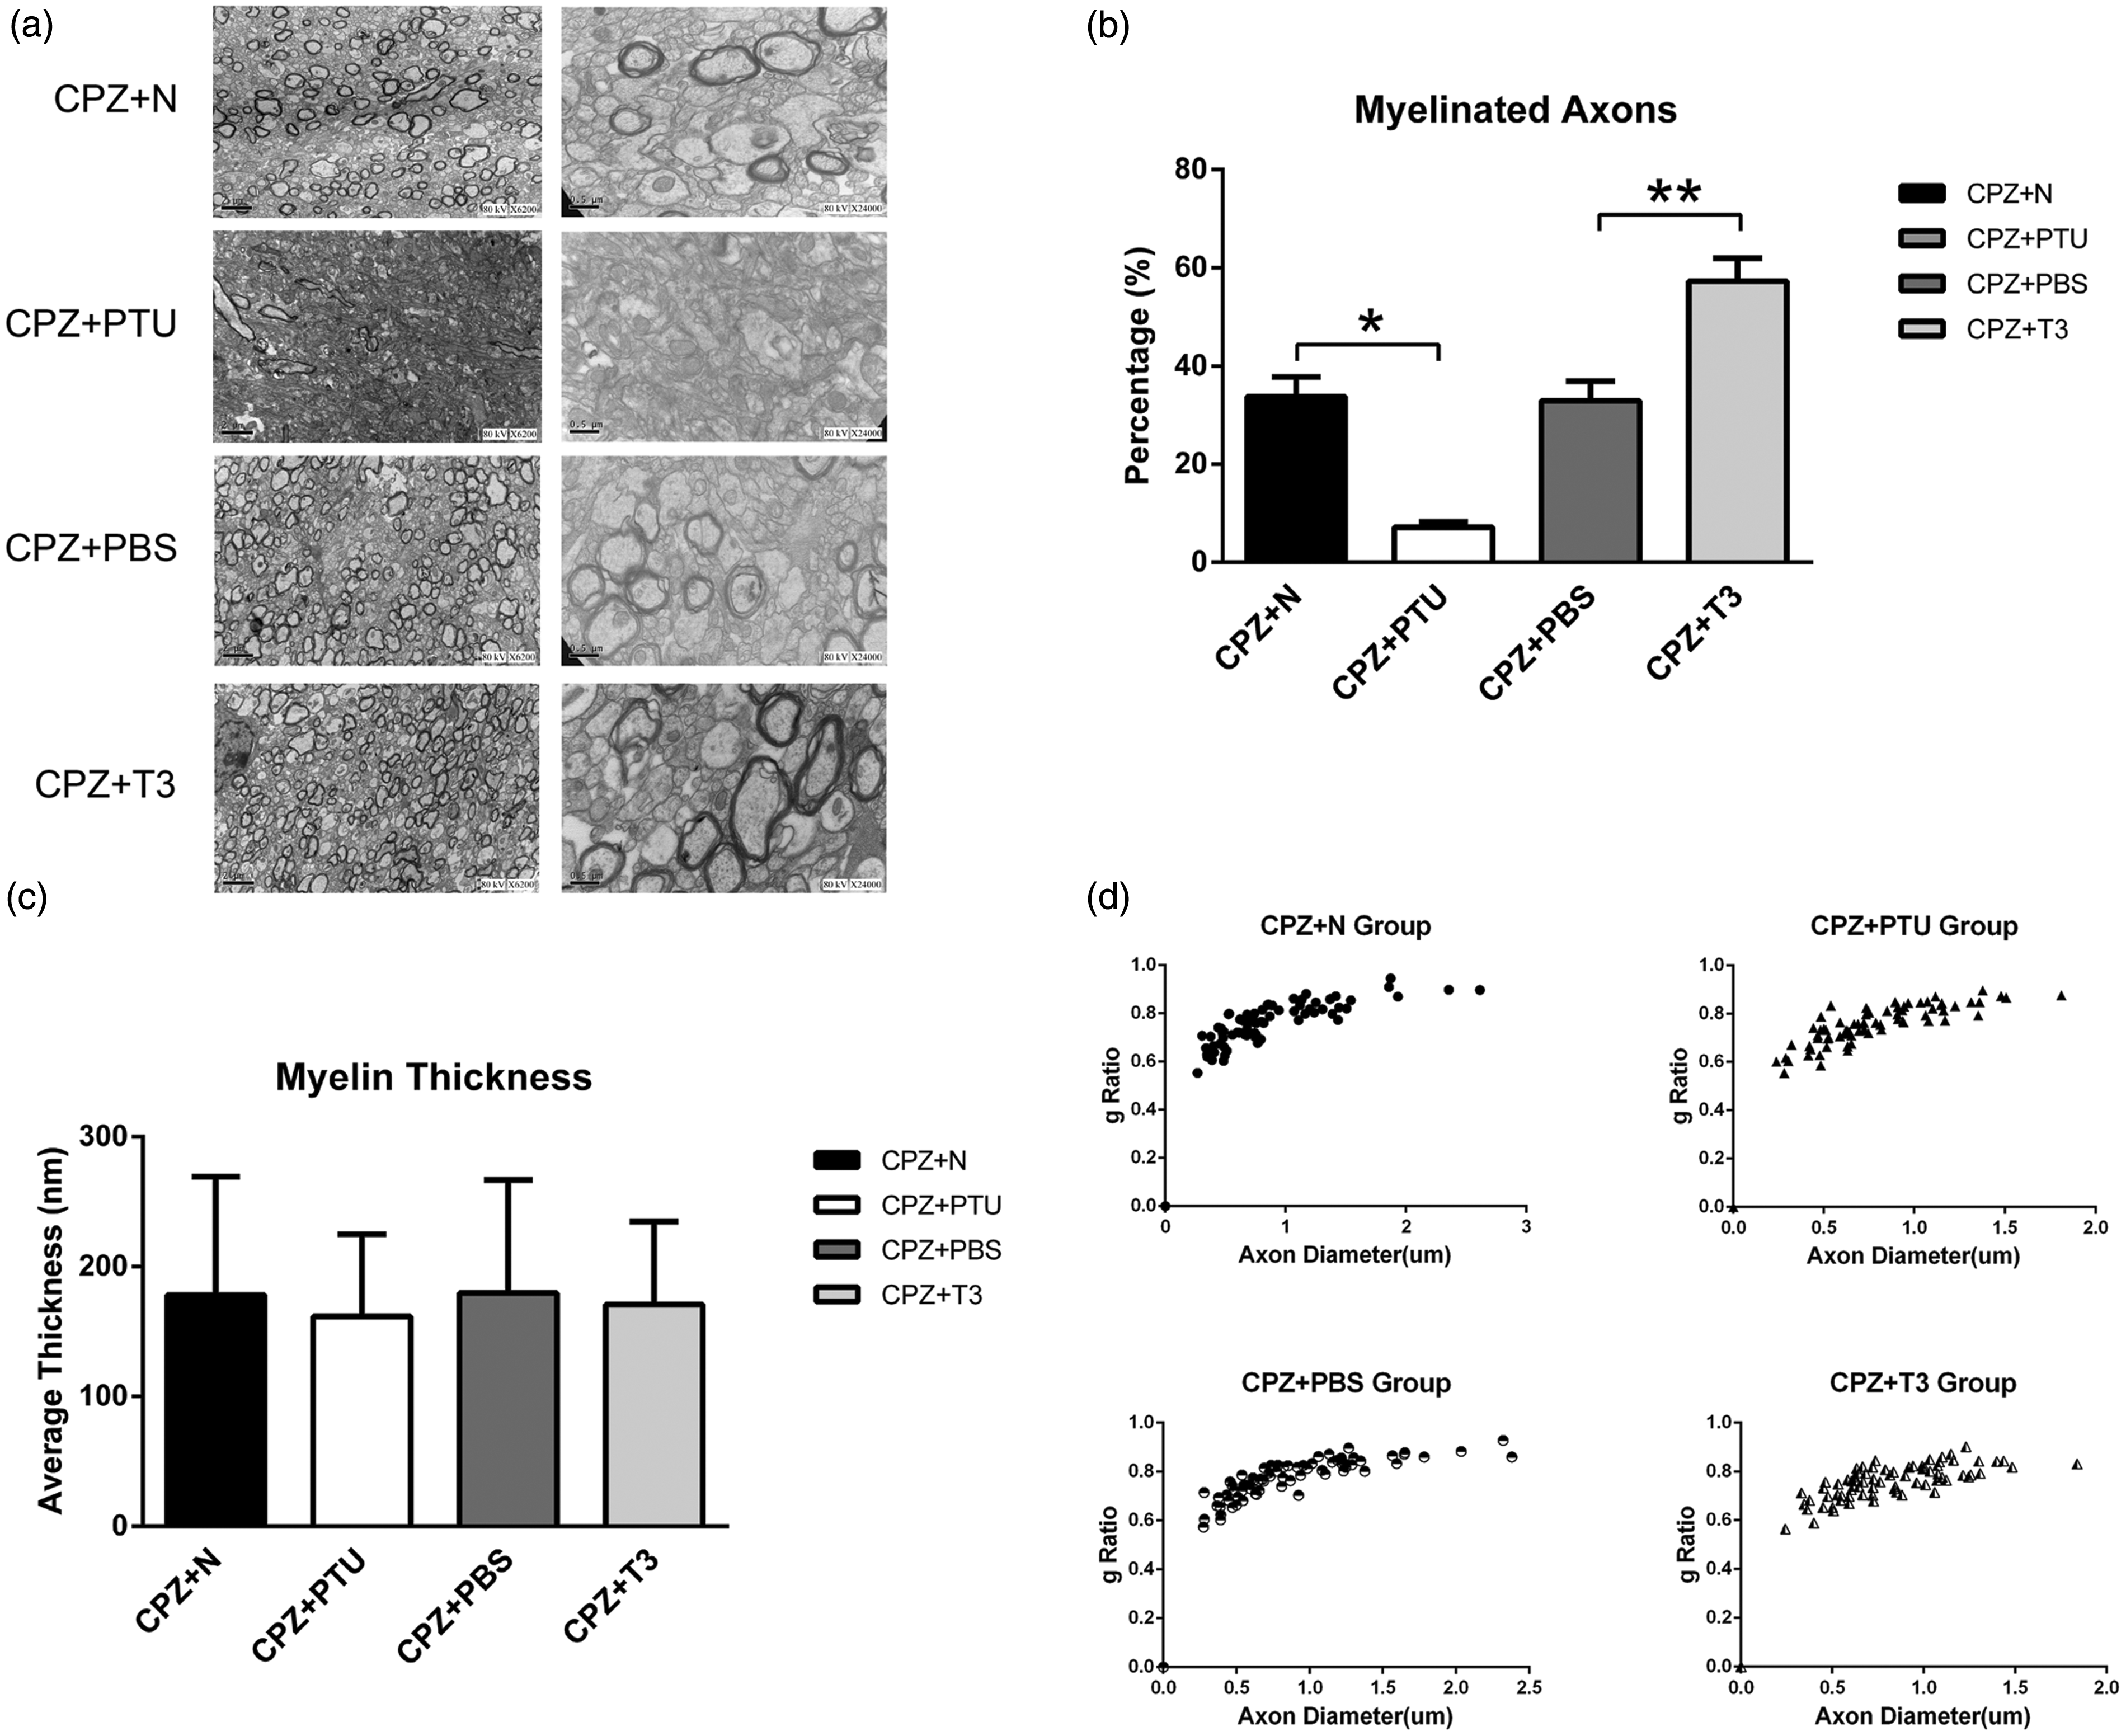
TH alleviates CPZ-induced impairment
Double staining with MBP and NF200 showed myelinated axons in the CC among the N, N+PTU, N+PBS, and N+T3 groups. The MBP immuno-negative and NF200 immuno-positive staining areas in these groups might be nodes of Ranvier (Figure 4(a)). No differences were observed in the mean OD values of MBP and NF200 in each group: 12,724.69 ± 1084.20 and 9874.89 ± 675.72 in the N group, 12002.09 ± 946.99 and 10054.49 ± 766.45 in the N+PTU group, 12373.45 ± 1095.53 and 9449.70 ± 796.50 in the N+PBS group, 12252.84 ± 694.73 and 9981.54 ± 782.44 in the N+T3 group (Figure 4(b)). The areas positive for NF200 staining were larger than those for MBP in the CPZ+PTU group. The areas positive for NF200 staining were continuous, linear, and extended in the direction of axons (Figure 4(a)). The OD value of MBP was 3147.74 ± 607.38 in the CPZ+PTU group, much lower than in the CPZ+N group (6625.52 ± 746.47) (P < 0.05). However, the OD value of NF200 increased from 2692.82 ± 426.13 in the CPZ+N group to 5689.78 ± 616.83 in the CPZ+PTU group (P < 0.05) (Figure 4(b)). Conversely, an increased area of MBP immuno-positive staining and a decreased area of NF200 immuno-positive staining were found in the CPZ+T3 group when compared with the CPZ+PBS group (Figure 4(a) and (b)). The OD value of MBP in the CPZ+T3 group was 10,220.63 ± 701.22, higher than in the CPZ+PBS group (5738.41 ± 523.63) (P < 0.05). The OD value of NF200 in the CPZ+T3 group was 2551.08 ± 334.73, lower than in the CPZ+PBS group (2828.48 ± 324.16) (Figure 4(b)). Enlarged mitochondria were found in axons in the CPZ+PTU group (Figure 4(c)), whose diameter reached 787.16 ± 105.67 nm in comparison with the CPZ+N group (386.78 ± 54.19 nm) (P < 0.05) (Figure 4(d)).
Thyroid hormone alleviates the impairment of axons induced by CPZ in corpus callosum. (a) Pictures of MBP and NF200’s double Immunofluorescence staining taken by confocal laser scanning microscope in CC, scale bar = 20 µm. (b) There were differences in the OD values of MBP immuno-positive staining between the CPZ+N and the CPZ+PTU groups *P-value < 0.01, between the CPZ+PBS and the CPZ+T3 groups ***P-value < 0.01. Differences also existed in the OD values of NF200 immuno-positive staining between the CPZ+N and the CPZ+PTU groups **P-value < 0.01. (c) Enlarged mitochondria can be found in axons of the CPZ+PTU group in electron micrographs, scale bar 2 µm 80 kV. (d) Statistical analyses reveal that the diameter of mitochondria in the CPZ+PTU group was longer than that in the CPZ+N group *P-value < 0.01. (A color version of this figure is available in the online journal.)
TH promotes the proliferation and differentiation of oligodendrocyte lineage cells following CPZ-induced damage
To observe the effect of TH on myelin sheaths damaged by CPZ, we focused on cells from the oligodendrocyte lineage, which form myelin in the CNS. Immunofluorescence staining of CC1 (Figure 5(a)) showed that the number of CC1 immuno-positive cells was only 25.05 ± 3.68/100 µm2 in the CPZ+PTU group, much less than in the CPZ+N group (42.64 ± 2.49/100 µm2) (P < 0.05) (Figure 5(b)). However, the number of CC1 immuno-positive cells in the CPZ+T3 group was 51.07 ± 0.68/100 µm2, which was more than in the CPZ+PBS group (41.43 ± 1.81/100 µm2) (P < 0.05) (Figure 5(b)).
Thyroid hormone promotes the amount of oligodendrocyte lineage cells impaired by CPZ in the corpus callosum. (a) Double immunofluorescence staining of MBP and CC1 in the CC and immunofluorescence staining of Olig2 in the same area. Scale bar 50 µm. (b) The number of CC1 immuno-positive cells was different between the CPZ+N and the CPZ+PTU groups *P-value < 0.05, between the CPZ+PBS and the CPZ+T3 groups **P-value < 0.05. (c) There were differences in the number of Olig2 immuno-positive cells between the CPZ+N and the CPZ+PTU groups *P-value <0.01, between the CPZ+PBS and the CPZ+T3 groups **P-value < 0.01. (d) Immunofluorescence pictures of NG2 in the CC (D1) and the SVZ (D2), scale bar = 50 µm. (e) There were differences in the number of NG2 immuno-positive cells in the CC (D1) and the SVZ (D2) between CPZ+N and CPZ+PTU groups *P-value < 0.01, between the CPZ+PBS and the CPZ+T3 groups **P-value < 0.01. (A color version of this figure is available in the online journal.)
We used immunofluorescence staining of Olig2 to observe premature oligodendrocytes. There were 8.72 ± 0.55/100 µm2 Olig2 immuno-positive cells in the CPZ+PTU group, less than in the CPZ+N group (11.36 ± 0.55/100 µm2) (P < 0.05). The number of Olig2 immuno-positive cells was 16.09 ± 0.96/100 µm2 in the CPZ+T3 group, more than in the CPZ+PBS group (11.86 ± 1.19/100 µm2) (P < 0.05) (Figure 5(a) and (c)). NG2, a specific marker of OPCs, was used to identify any change in the number of cells in these groups. Areas in the CC (Figure 5D1) and the SVZ were examined (Figure 5D2). The number of NG2 immuno-positive cells was 1.84 ± 0.19/100 µm2 in the CPZ+PTU group, less than in the CPZ+N group (8.69 ± 0.25/100 µm2) (P < 0.05) (Figure 5(e)). Interestingly, the number of NG2 immuno-positive cells was 13.70 ± 0.76/100 µm2 in the CPZ+T3 group, more than in the CPZ+PBS group (8.79 ± 0.26/100 µm2) (P < 0.05) (Figure 5(e)).
TH reduces CPZ-induced active astrocytes without affecting the number of active microglia
Although the number of oligodendrocytes was decreased in the CC, there were no changes in DAPI staining after the administration of CPZ. We therefore examined changes in astrocytes and microglia in the CC. Astrocytes were identified by immunochemistry staining with GFAP (Figure 6(a)). The morphology of the GFAP immuno-positive cells was small and light in the N, N+PTU, N+PBS, and N+T3 groups at the eighth week (Figure 6(a)). There were no differences in the number of GFAP immuno-positive cells among these groups (Figure 6(c)). Western blots showed that the expression of GFAP in these groups was low (Figure 6(b)). However, the morphology of astrocytes was enlarged with high densities in the CPZ+PTU group when compared with the CPZ+N group (Figure 6(a)). GFAP staining in the CPZ+T3 group was small and light in comparison to the CPZ+PBS group (Figure 6(a)). The number of GFAP immuno-positive cells was increased in the CPZ+N, CPZ+PTU, CPZ+PBS, and CPZ+T3 groups when compared with the N, N+PTU, N+PBS, and N+T3 groups during the eighth week (Figure 6(c)). The number of GFAP immuno-positive cells in the CPZ+PTU group reached 3.51 ± 0.21/100 µm2, more than in the CPZ+N group (3.05 ± 0.20/100 µm2) (P < 0.05) (Figure 6(c)). However, the amount of GFAP immuno-positive cells in the CPZ+T3 group was 2.60 ± 0.24/100 µm2, less than in the CPZ+PBS group (3.01 ± 0.26/100 µm2) (P < 0.05) (Figure 6(c)). Western blots showed that the expression of GFAP in the CPZ+N, CPZ+PTU, CPZ+PBS, and CPZ+T3 groups was higher than that in the N, N+PTU, N+PBS, and N+T3 groups (Figure 6(b)). The OD value was 3779.46 in the CPZ+PTU group, as higher than in the CPZ+N group (2181.32) (P < 0.05). The OD value was 1036.58 in the CPZ+T3 group, lower than in the CPZ+PBS group (1960.18) (P < 0.05) (Figure 6(b)). From these data, we conclude that CPZ induces an increase in astrocytes that could be alleviated by T3.
Thyroid hormone reduces active astrocytes induced by CPZ but has no effect on active microglia in the corpus callosum. (a) Images of GFAP immuno-peroxidase staining in the CC, scale bar = 100 µm. (b) The expression of GFAP in the CC was examined by western blots. The results were analyzed by OD values. The expression of GFAP in the CPZ+PTU group was higher than that in the CPZ+N group*P-value < 0.01. The amount of GFAP in the CPZ+T3 group was lower than in the CPZ+PBS group **P-value < 0.01. (c) There were differences in the number of GFAP immuno-positive cells in the CC between the CPZ+N and the CPZ+PTU groups *P-value < 0.05, between the CPZ+PBS and the CPZ+T3 groups **P-value < 0.05. (d) Immunofluorescence staining of F4/80 in several subareas of the CC including the central CC area (D1), the CC g area (D2), and the distal end of the CC area (D3). We found no differences between the CPZ+N, CPZ+PTU, CPZ+PBS, and CPZ+T3 groups, scale bar = 50 µm. (A color version of this figure is available in the online journal.)
Immunofluorescence staining with F4/80 was used to observe changes in the number of microglia in each group. Several subareas of the CC were analyzed, including the central region (Figure 6D1), the CC g area (Figure 6D2), and the distal end (Figure 6D3). The number of F4/80 immuno-positive cells was increased in the CPZ+N, CPZ+PTU, CPZ+PBS, and CPZ+T3 groups during the eighth week. However, there were no differences between the CPZ+T3 group and the CPZ+PBS group (P > 0.05). These data suggest that T3 does not reverse the effect of CPZ on microglia.
Discussion
Promoting remyelination during the remission period is significant for MS therapies
Clinical evidence has demonstrated that most MS patients have a significant remission of symptoms after the first clinical attack. These patients have classical relapsing–remitting MS, and the resulting damage is cumulative.7,30,31 The remission period is viewed as the time during which remyelination and the recovery of injured axons can occur. Unfortunately, the remyelination is inadequate for most patients. Therefore, during the next relapse period, old and new lesions combine, leading to the progressive pathology of MS. 32 Importantly, patients with PPMS and SPMS do not have a remission period after the first or second clinical attack. Therefore, the disease course will progress rapidly, leading to severe disability and dysfunction.9,33
It was believed that the major hindrance to the repair of demyelination lesions was the failure of oligodendrocytes to unsheathe and preserve axons.28,34–37 Failure to remyelinate is the predominant reason for the axonal and neuronal degeneration that leads to disability.38,39 However, most therapies for MS have focused on inflammation as a target for immunomodulatory therapies, such as the administration of interferon-beta, glatiramer acetate, and mitoxantrone. Although these treatments reduce the rates of relapse and improve the appearance of the brain via magnetic resonance imaging,40–42 their ability to prevent the development of progressive disabilities and to improve the prognosis of MS patients has been disappointing.43,44 The remission period is an important target for MS therapy and treatment that may alter the prognosis of MS patients. A therapy to increase the proliferation and differentiation of OPCs and enhance endogenous remyelination or neuroprotection during the remission period would improve the prognosis of MS.
TH promotes remyelination during the remission period
TH plays a crucial role in the development of the brain and hypothyroidism in childhood can lead to cretinism. 45 Abundant evidence shows that TH plays a significant role in the timing of oligodendrocyte development and differentiation.46–49 TH is effective in improving remyelination only if enough new OPCs have been generated. This process may be related to the intrinsic timer in OPCs, generated when nuclear receptors were produced to regulate TH expression.50–52 Some evidence shows that TH promotes differentiation of oligodendrocyte precursor cells. Oligodendrocyte differentiation may be enhanced by TH via its selective β receptor. 53 In addition, alterations in TH signaling in the hippocampus are associated with delayed myelination. 54 We hypothesize that TH improves remyelination during a specific time window, most possibly the remission period.
In this study, we show that the administration of TH alleviates demyelination by promoting remyelination during remission periods. Specifically, T3 improves the overall condition of mice treated with CPZ: their body weight, motor coordination, and balance recover. Results from open field tests also suggest that T3 slightly promotes spontaneous activity. Conclusively, TH promoted the physical condition and athletic ability of these model mice. However, we have not known the role of TH in the improvement of cognitive deficit, and it was clarified in previous studies that TH could alleviate cognitive deficit in Alzheimer’s disease. 55 So, it is still waiting for further studies that whether TH has any effect on the cognitive performance in CPZ-induced demyelination diseases or not. Besides, we performed immunochemistry and examined the effect of T3 on myelin sheaths and oligodendrocyte linage cells damaged by CPZ. T3 improved recovery of the myelin sheath during the remission period by promoting the proliferation and differentiation of oligodendrocyte linage cells in the CC and the SVZ, which is regarded as the germinal center of oligodendrocytes during remyelination. Using electron microscopy, we showed that the number of myelinated axons increased without affecting the thickness of myelin, the g ratio, or the diameter of mitochondria after treatment with T3. The degradation of axons is alleviated by T3, as shown by double staining with MBP and NF200. T3 may increase the number of mature oligodendrocytes and induce remyelination. It is widely believed that demyelination during MS increases active astrocytes and the inflammation of microglia. This results in the formation of a barrier that blocks the proliferation and differentiation of oligodendrocytes and so prevents remyelination.56,57 T3 treatment leads to a decrease in the number of active astrocytes induced by CPZ. A T3 deficiency, resulting from the administration of PTU, promotes an increase in the number of active astrocytes. This suggests that T3 inhibits active astrocytes to improve remyelination. T3 had no effect on microglia, consistent with previous reports.58,59
Some studies have insisted that TH can affect the timing of OPC differentiation. 60 Others suggest that TH affects the secretion of neurotrophic factors.61–63 However, a function for T3 in remyelination had not been shown and we explored this in our study. Therefore, this study may provide new insights for the treatment of MS.
Inadequate supplies of TH inhibits remyelination in the remission period
The administration of TH improved remyelination during the remission period and a stable level of TH was necessary. A TH deficiency, induced by PTU, inhibited the recovery of body weight, motor coordination, balance, and spontaneous activity. This phenomenon was obvious during the remission period. Pre-existing brain dysfunctions were unlikely. Results from open field tests showed that the exploratory behavior of mice was not altered by a change in TH level. This suggests that damage was induced by the TH deficiency rather than a dysfunction of the brain.
A pool of undifferentiated OPCs in the central nervous system of adults can migrate to an area of demyelination and differentiate into mature oligodendrocytes for the remyelination of nude axons. Unfortunately, the capacity for remyelination is lost in MS.64–66 Our study reveals that T3 can reverse this loss and that a T3 deficiency may exacerbate the decreased remyelination in MS. TH plays a role throughout remyelination, including the stages of precursor formation, pre-maturation and maturation. There were no proliferating OPCs in the SVZ when TH levels were inadequate. A TH deficiency affected the proliferation and differentiation of oligodendrocytes in the pre-mature and mature stages. In addition, a TH shortage resulted in a decrease of myelinated axons in the CC during the period of remyelination. A TH deficiency did not affect the thickness of the myelin sheath, but it did enlarge mitochondria in nude axons. Conversely, an adequate supply of T3 alleviated axonal injuries. Previous clinical evidence shows that myelination can be restored by thyroxine. 67
The remission period has not received sufficient attention in the clinical treatment of MS. It is a key stage for promoting remyelination and providing neuroprotection that could improve the prognosis of patients with MS. Indeed, TH treatment failed to prevent inflammation-induced white matter injury in the immature brain. 68 This phenomenon may be related to the critical period of remyelination. We focused on the remission period and found that the administration of adequate TH promotes remyelination during this period.
In conclusion, we found that TH enhances remyelination resulted from the promotion of the proliferation and differentiation of oligodendrocyte linage cells. Besides, the decreased active astrocytes signified that TH might inhibit inflammation as well. However, the molecular mechanisms should further be focused. As a nuclear hormone, TH might bind to the nuclear receptor to regulate the oligodendrocyte linage cells and inhibit signal transduction of inflammation, which have not been proved. Presently, we clarified the role of TH in the process of remyelination and suggested a new direction for clinical treatments of MS.
Footnotes
Authors’ contribution
ZXY conceived and designed the experiment. XLZ and MZ completed the main experiments, MZ and ZYM performed data statistics, MZ and XLZ drafted and revised the manuscript, XSC and QYC completed parts of the immunohistochemistry. ZXY was responsible for research funding. All authors approved the final version of the manuscript.
Acknowledgements
Mao Zhang and XiaoL Zhan share first authorship. We sincerely acknowledge Guangyun Zhang for the serum thyroid hormone test and Ling Tao for the preparation of samples for the transmission electron microscope. This work was supported by grants from the National Natural Science Foundation of China (Grant No. 31371147) and the High Education Teaching Reform Project of Chongqing (No. 132080).