
Abstract
Dyslipidemia and dysglycemia are etiologically associated, but the direction, chronology, and mechanisms of the association are not fully understood. We, therefore, analyzed data from 335 healthy adults (184 black, 151 white) enrolled in the Pathobiology of Prediabetes in A Biracial Cohort study. Subjects underwent oral glucose tolerance test (OGTT) and were enrolled if they had normal fasting and 2-h plasma glucose levels. Assessments during year 1 included anthropometry, fasting lipid profile, insulin sensitivity, and insulin secretion. Thereafter, OGTT was assessed annually for 5.5 years. The primary outcome was occurrence of prediabetes (impaired fasting glucose or impaired glucose tolerance) or diabetes. During a mean follow-up of 2.62 years, 110 participants (32.8%) developed prediabetes (N = 100) or diabetes (N = 10). In multivariate logistic regression models, higher baseline low-density lipoprotein (LDL) cholesterol and triglyceride levels and lower HDL cholesterol levels significantly increased the risk of incident prediabetes. The combined relative risk (95% confidence interval [CI]) of prediabetes for participants with lower baseline HDL cholesterol (10th vs. 90th percentile), higher LDL cholesterol (90th vs. 10th percentile) and high triglycerides levels (90th vs. 10th percentile) was 4.12 (95% CI 1.61–10.56), P = 0.0032. At baseline, lipid values showed significant associations with measures of adiposity, glycemia, insulin sensitivity, and secretion. In both ethnic groups, waist circumference correlated positively with triglycerides and inversely with HDL cholesterol levels (P = 0.0004–<0.0001); fasting plasma glucose correlated positively with triglycerides and LDL cholesterol levels and inversely with HDL cholesterol levels (P = 0.006–<0.0001); insulin sensitivity correlated positively with HDL cholesterol and inversely with triglyceride levels (P < 0.0001), and insulin secretion correlated positively with triglycerides (P = 0.01) and inversely with HDL cholesterol (P < 0.0001). We conclude that a baseline lipidemic signature identifies normoglycemic individuals at high risk for future glycemic progression, via congruent associations with adiposity and glucoregulatory mechanisms. These findings suggest that early lifestyle intervention could ameliorate progressive dyslipidemia and dysglycemia.
Keywords
Introduction
The risk factors for type 2 diabetes mellitus (T2DM) include genetic/familial predisposition and several behavioral and cardiometabolic characteristics. 1 Of the latter, low plasma levels of high-density lipoprotein (HDL) cholesterol and high levels of triglycerides are well-recognized associations of increased risk for T2DM.1–4 Both the prevalence of T2DM and the distribution of plasma levels of triglycerides and HDL cholesterol display ethnic disparities.5,6 Among persons at genetic risk for T2DM, the transition from normoglycemia to diabetes often follows a predictable course through an intermediate stage of prediabetes, defined as impaired fasting glucose (IFG) and/or impaired glucose tolerance (IGT).1,7–9 Persons with IGT or IFG develop T2DM at an annual rate of approximately 10%.10,11 Although not all persons with prediabetes progress to T2DM,8,11 the occurrence of prediabetes in a previously normoglycemic subject represents a sentinel dysglycemic event that indicates a potential for further progression to diabetes.
The Pathobiology of Prediabetes in A Biracial Cohort (POP-ABC) study12–14 enrolled healthy African American (black) and European American (white) offspring of parents with T2DM and followed them for the occurrence of prediabetes, defined as IFG and/or IGT.1,15 At enrollment, participants underwent a 75-g oral glucose tolerance test (OGTT), clinical examination, and measurement of fasting lipids. Thereafter, fasting plasma glucose (FPG) was assessed quarterly and OGTT annually. The main results of the POP-ABC study showed that healthy black and white offspring of parents with T2DM developed incident prediabetes at a rate of approximately ∼11%/year, and that progressors to prediabetes had higher baseline levels of LDL cholesterol and triglycerides, and lower levels of HDL cholesterol, than non-progressors. 16 As the mechanisms of the association of plasma lipids with the risk of incident dysglycemia are unclear, we here determined whether individual lipid moieties at baseline had congruent relationships with glycemia, adiposity and known glucoregulatory mechanisms, such as insulin sensitivity and insulin secretion. We also determined whether any observed relationships would be consistent across ethnic groups.
Research design and methods
Study subjects
The study subjects were participants in the POP-ABC study.12–14 Eligibility criteria for the POP-ABC study included age 18–65 years; self-reported non-Hispanic white (European American) or non-Hispanic black (African American) race/ethnicity status; one or both biological parents with T2DM; no evidence of diabetes; normal FPG (<100 mg/dL [5.6 mmol/L]) and/or normal glucose tolerance (NGT) (2-h plasma glucose [2hPG] <140 mg/dL [7.8 mmol/L] during a 75-g OGTT); and good overall health, as previously described.12–14
None of the participants was using any medications known to alter glucose or lipid metabolism. Enrollment in behavioral, pharmacological, or other active weight loss program, or a history of liposuction or bariatric surgery were additional exclusion criteria.12–14 Individuals self-reported their race/ethnicity, based on the 1990 US Census questionnaire. 17 The study protocol was approved by the Institutional Review Board; all participants gave written informed consent before initiation of the study, which was conducted at the University of Tennessee General Clinical Research Center (GCRC).
Assessments
Enrolled participants arrived at the GCRC after an overnight fast for baseline assessments, which included a medical interview and physical examination, anthropometry, and a standard 75-g OGTT.12,14,15 The body-mass index (BMI) was calculated as the weight in kilogram divided by the height in meter squared. The OGTT was initiated between 07:00 and 11:00 in subjects who had been fasting for approximately 10–14 h: venous blood specimens for glucose measurement were obtained before (0 min) and at 30 min and 120 min after ingestion of 75 g flavored glucose (Trutol 75; Custom Laboratories, Baltimore, MD). Additional baseline measurements included hemoglobin A1c (HbA1c) and fasting lipid profile. Follow-up assessments included FPG measured quarterly, OGTT annually, insulin secretion annually, and insulin sensitivity in years 1, 3, and 5, as previously described.12,14,15
Insulin sensitivity and insulin secretion
Insulin sensitivity and insulin secretion were assessed, as previously described.7,12,14,15,18,19 In brief, insulin sensitivity was assessed using the hyperinsulinemic euglycemic clamp procedure in subjects who had fasted overnight for ∼12 h. A primed, continuous intravenous (i.v.) infusion of regular insulin (2 mU kg−1 min−1; 14.4 pmol kg−1 min−1) was administered for 180 min while blood glucose concentration was maintained at ∼100 mg/dL (5.6 mmol/L) with a variable rate dextrose (20%) infusion. Arterialized blood specimens for measurement of glucose and insulin levels were obtained every 10 min. The rate of total insulin-stimulated glucose disposal (M) was calculated for the last 60 min of insulin infusion, and corrected for the steady state plasma insulin levels, to derive the insulin sensitivity index (Si-clamp).18,19
The frequently sampled intravenous glucose tolerance test (FSIVGTT) was used for the direct assessment of insulin secretion. After an overnight fast, subjects received an i.v. bolus of dextrose (25 g). Arterialized blood samples for the measurement of glucose and insulin levels were collected 30 min before and at 2, 3, 4, 5, 7, and 10 min following the i.v. dextrose bolus.7,16 The acute insulin response to i.v. glucose (AIRg) was computed as the mean incremental insulin concentration from 3 to 5 min after the dextrose bolus.7,16
Biochemical measurements
Plasma glucose was measured with a glucose oxidase method (Yellow Spring Instruments Co., Inc., Yellow Spring, OH). Plasma insulin levels were measured immunochemically in our Endocrine Research Laboratory, using commercial ELISA kits. HbA1c and fasting plasma lipid profiles were measured in a contract clinical laboratory.
Definition of outcome measures
The primary outcome was the occurrence of prediabetes (IFG and/or IGT) or diabetes, 16 defined by the 2003 revised American Diabetes Association criteria. 15 For all subjects, any occurrence of diabetes, as indicated by an FPG value of 126 mg/dL (7.0 mmol/L) or higher or 2hPG of 200 mg/dL (11.1 mmol/L) or higher, or prescription of a diabetes medication, was an endpoint. Of the enrollees, 75% had normal FPG (<100 mg/dL [5.6 mmol/L]) and normal 2hPG (<140 mg/dL [7.8 mmol/L]) during OGTT. The remainder (25%) had either normal FPG (and isolated IGT) or normal 2hPG (and isolated IFG) at enrollment. For participants enrolled with normal FPG and normal 2hPG, the occurrence of IFG and/or IGT constituted an endpoint. For those enrolled with normal FPG (and isolated IGT), progression to IFG constituted an endpoint. For those enrolled with NGT (and isolated IFG), progression to IGT was an endpoint. 16 A confirmatory test was performed within six weeks for each endpoint occurrence. The 75-g OGTT was the method of confirmation. All endpoints were independently adjudicated by the Institutional Data and Safety Officer (Murray Heimberg, MD, PhD).
Statistical analysis
Data were reported as means ± standard deviation (SD). Differences between defined groups were analyzed using unpaired t-tests for continuous variables and chi-square test for categorical variables. General linear regression models were used to compare anthropometric and metabolic characteristics between African Americans and Caucasians and between subjects who experienced glycemic progression and non-progressors. The relationship between plasma lipid moieties and selected metabolic variables measured at baseline was analyzed using Pearson correlation coefficients. Logistic regression models were used to analyze baseline plasma levels of cholesterol and triglycerides as predictors of incident diabetes/prediabetes, after adjustments for age, sex, and BMI. All statistical analyses were performed with the use of SAS statistical software, version 9.3 (SAS Institute Inc., Cary, NC).
Results
Cohort description
Demographic, clinical, and metabolic characteristics at baseline in 335 offspring of parents with type 2 diabetes
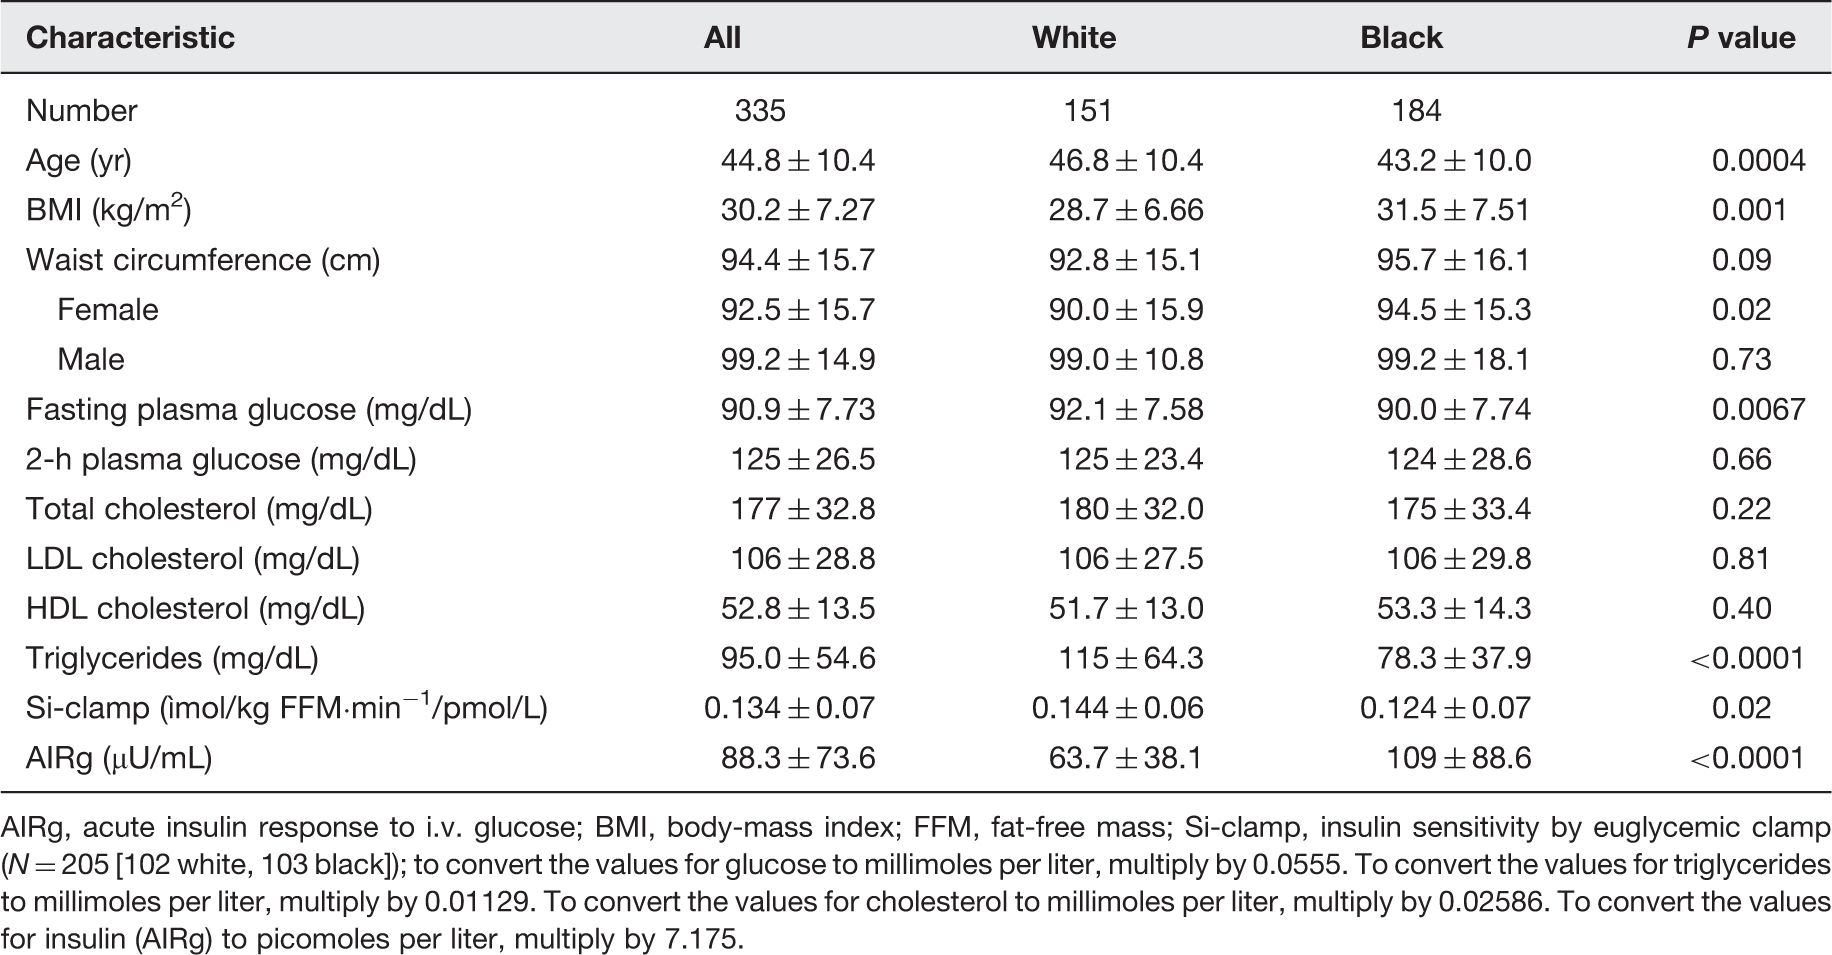
AIRg, acute insulin response to i.v. glucose; BMI, body-mass index; FFM, fat-free mass; Si-clamp, insulin sensitivity by euglycemic clamp (N = 205 [102 white, 103 black]); to convert the values for glucose to millimoles per liter, multiply by 0.0555. To convert the values for triglycerides to millimoles per liter, multiply by 0.01129. To convert the values for cholesterol to millimoles per liter, multiply by 0.02586. To convert the values for insulin (AIRg) to picomoles per liter, multiply by 7.175.
Baseline plasma levels and glycemic progression
During 5.5-years of follow-up (mean 2.62 years), 110 participants (32.8%, progressors) developed prediabetes (N = 100) or T2DM (N = 10), and 225 participants (67.2%) were non-progressors. As previously reported from our study cohort,
16
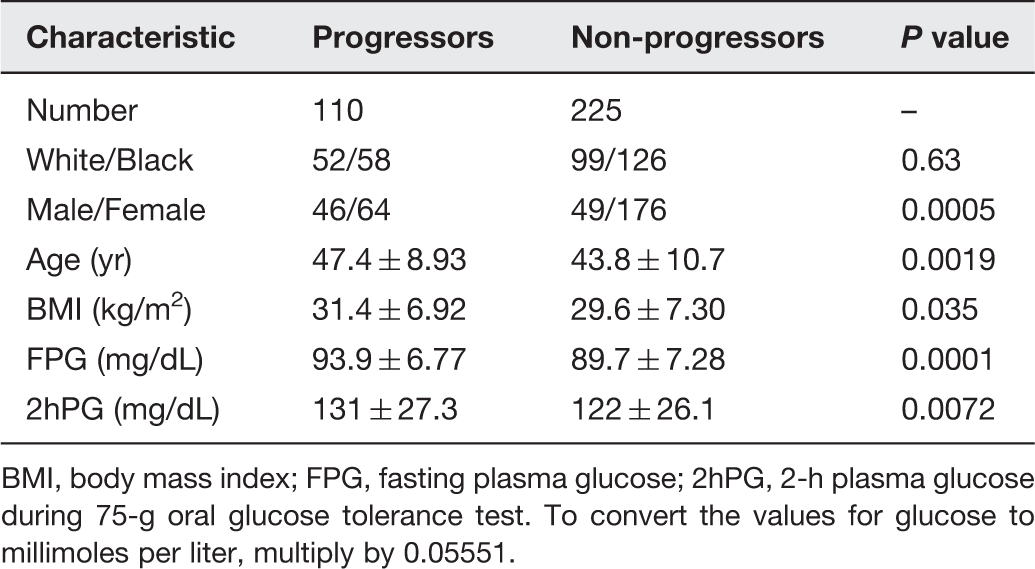
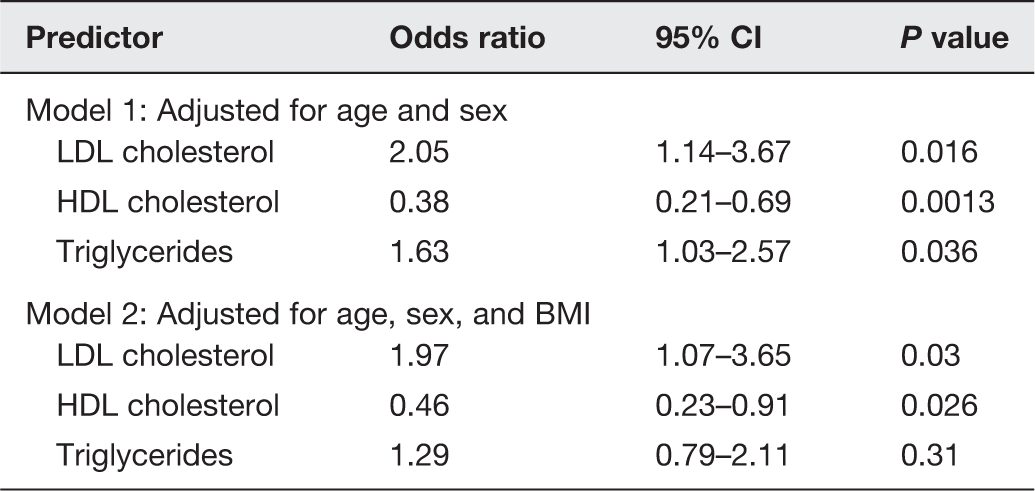
progressors to higher glycemic status and non-progressors were discordant for age, gender, BMI, and baseline plasma glucose levels (Table 2). Compared with non-progressors, participants who developed prediabetes/T2DM during follow-up had higher baseline plasma levels of LDL cholesterol (112 ± 30.0 vs. 103 ± 27.8, P = 0.009) and triglycerides (105 ± 54.7 vs. 90.2 ± 54.2, P = 0.017), and lower levels of HDL cholesterol (49.1 ± 11.9 vs. 54.3 ± 14.2, P = 0.0005) (Figure 1). Although triglycerides were lower in black participants than white participants (Table 1), the pattern of higher triglyceride levels in progressors compared to non-progressors was consistent in both groups (Figure 1). In multivariate logistic regression models (after adjustment for age and sex), higher baseline plasma levels of LDL cholesterol, and triglycerides significantly increased the risk of incident prediabetes/T2DM, whereas higher levels of HDL cholesterol significantly decreased the risk of incident prediabetes/T2DM. The relative risks (95% confidence intervals) of incident prediabetes/T2DM were 2.05 (1.14–3.67) for LDL cholesterol (P = 0.015), 0.38 (0.21–0.69) for HDL cholesterol (P = 0.0013), and 1.63 (1.03–2.57) for triglycerides (P = 0.036) (Table 3, model 1). With additional adjustment for BMI, the relative risks were 1.97 (1.07–3.65) for LDL cholesterol (P = 0.03), 0.46 (0.23–0.91) for HDL cholesterol (P = 0.026), and 1.29 (0.79–2.11) for triglycerides (P = 0.31) (Table 3, model 2). The combined relative risk of incident prediabetes/T2DM for participants with lower baseline HDL cholesterol (10th percentile vs. 90th percentile), higher LDL cholesterol (90th vs. 10th percentile), and higher triglycerides levels (90th vs. 10th percentile) was 4.12 (1.61–10.56), P = 0.0032.
Plasma levels of LDL and HDL cholesterol (a, b) and triglycerides (c) among study participants who developed prediabetes or diabetes (progressors, P) compared to those who remained free of incident dysglycemia (non-progressors, NP) *P = 0.17, **P = 0.009, ***P = 0.0005, progressor vs. non-progressor groups Baseline body mass index, demographic, and glycemic characteristics of subjects who developed prediabetes/diabetes (progressors) compared to those who remained free of incident dysglycemia (non-progressors) BMI, body mass index; FPG, fasting plasma glucose; 2hPG, 2-h plasma glucose during 75-g oral glucose tolerance test. To convert the values for glucose to millimoles per liter, multiply by 0.05551. Logistic regression modeling predicting progression to prediabetes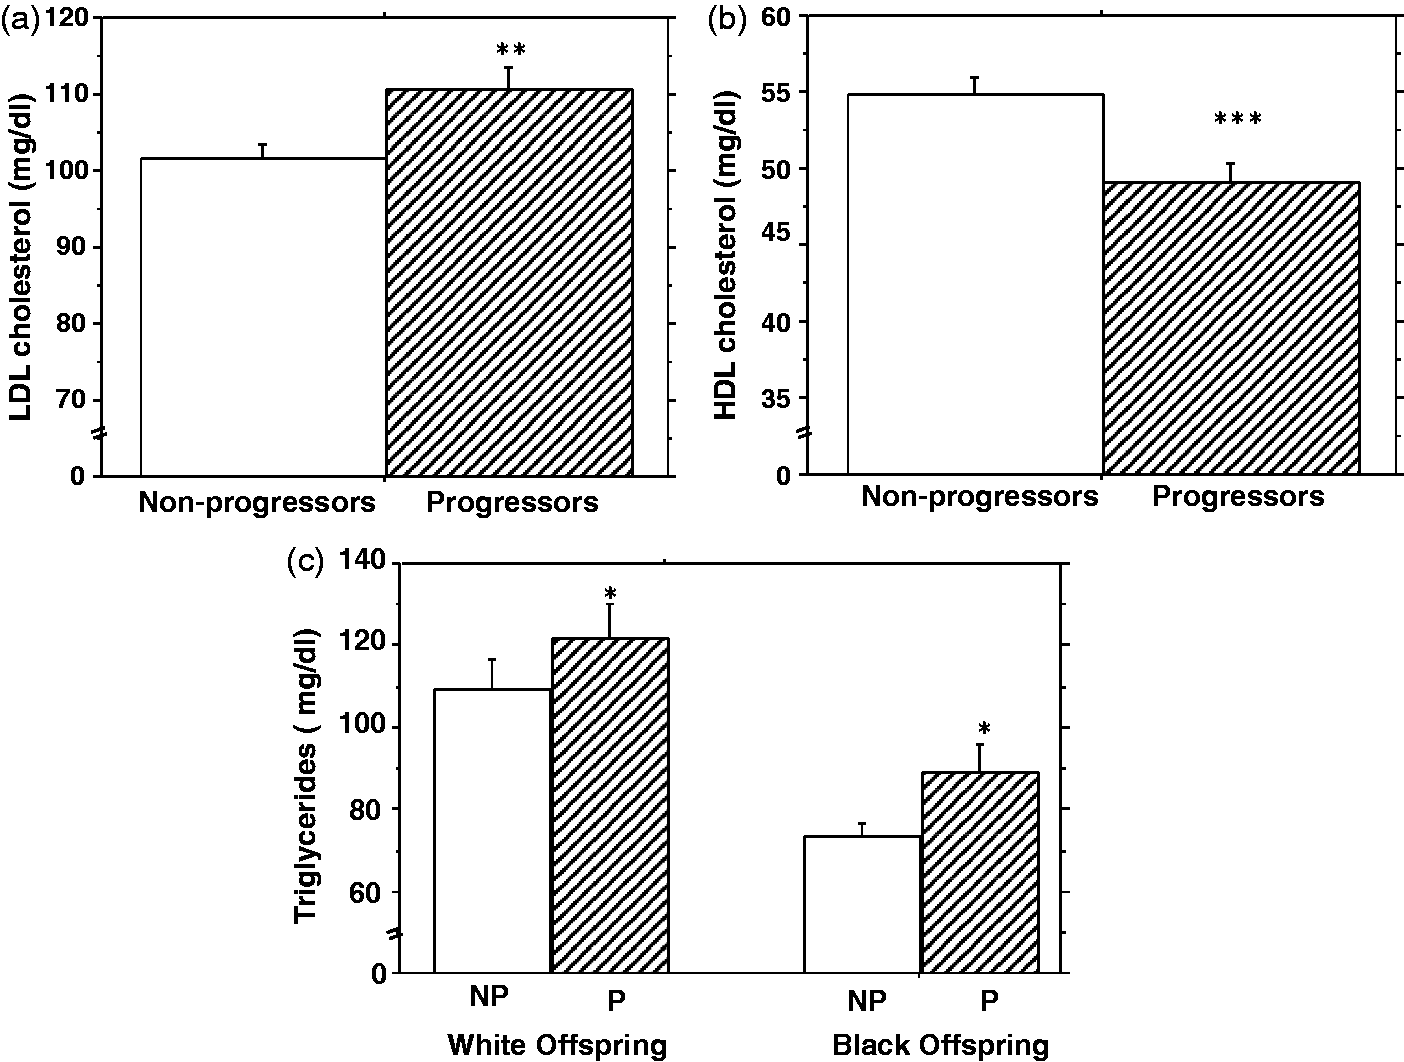
Potential mechanisms linking lipid moieties to dysglycemia
Pearson correlation coefficients between plasma lipid moieties and selected glycemic and glucoregulatory variables in normoglycemic subjects by ethnic group
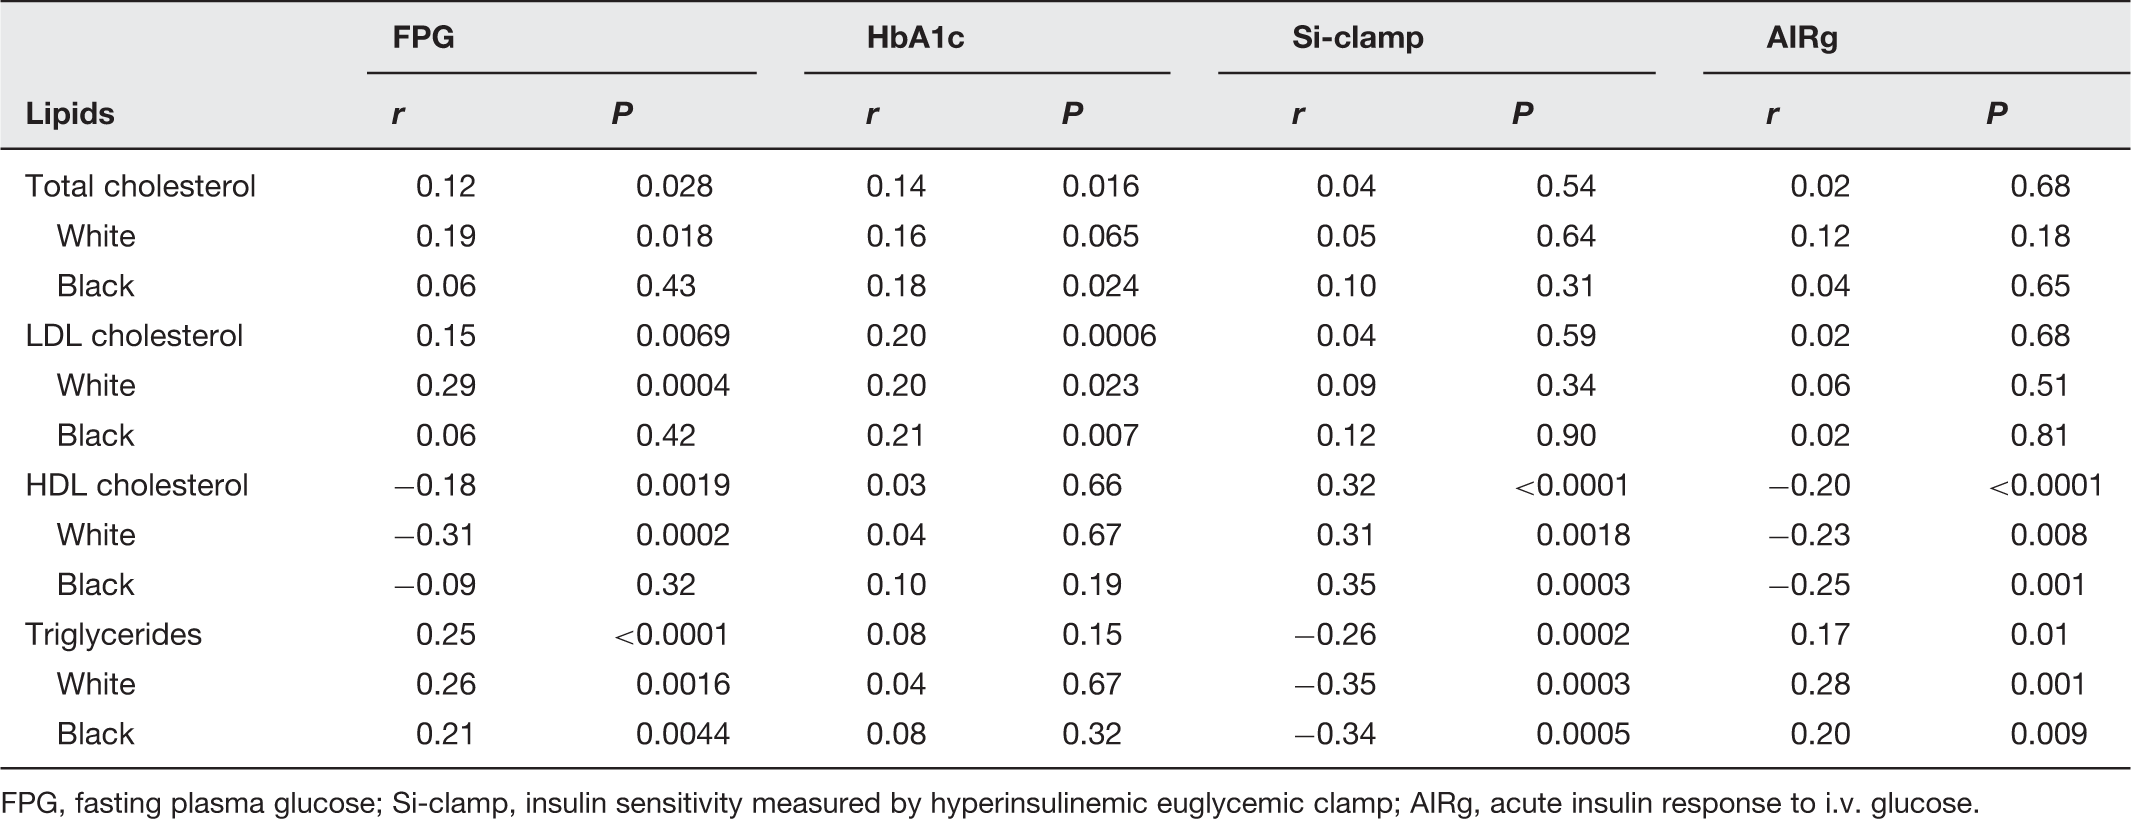
FPG, fasting plasma glucose; Si-clamp, insulin sensitivity measured by hyperinsulinemic euglycemic clamp; AIRg, acute insulin response to i.v. glucose.
To explore possible mechanisms for the association of lipid moieties with incident prediabetes, we examined the relationship between circulating lipids and both insulin sensitivity and insulin secretion, measured at baseline. We found no discernible association between total cholesterol or LDL cholesterol levels and insulin sensitivity (Si-clamp) (Table 4) or insulin secretion (AIRg) (Table 4) in our study population. However, HDL cholesterol levels correlated positively with insulin sensitivity (Table 4) and inversely with insulin secretion (Table 4). Also, fasting triglyceride levels correlated inversely with insulin sensitivity (Table 4) and positively with insulin secretion (Table 4). Although triglycerides were lower in black participants than white participants (Table 1), the correlation of triglycerides with insulin sensitivity and insulin secretion were consistent by ethnicity (Table 4). Overall, the strongest associations that were concordant in both ethnic groups were the positive correlations between triglycerides and FPG (P < 0.0001), HDL cholesterol and insulin sensitivity (P < 0.0001), LDL cholesterol and HbA1c (P = 0.006), and the negative correlation between triglycerides and insulin sensitivity (P < 0.0001) (Table 4).
Discussion
As previously reported from our study cohort, 16 the significant predictors of progression from normoglycemia to prediabetes included older age and higher BMI at baseline, as well as male gender. The gender pattern of incident prediabetes in our cohort is consistent with national data showing a preponderance of men over women in the prediabetes population.20,21 The mechanism(s) for such gender disparity in prediabetes are unclear. However, the lack of a significant gender difference in diagnosed diabetes indicates that equilibration does occur during transition from prediabetes to T2DM. 22 The present report, focused on plasma lipids, showed that the combination of lower (10th vs. 90th percentile) baseline HDL cholesterol and higher (90th vs. 10th percentile) LDL cholesterol and triglycerides levels quadrupled the relative risk of developing prediabetes during a follow-up period of 5.5 years in our biracial cohort of healthy offspring of parents with T2DM.
In further exploration of potential mechanisms, we demonstrated significant associations between lipid moieties and measures of adiposity, glycemia, insulin sensitivity, and insulin secretion obtained at baseline. Although some of the associations between lipid moieties and metabolic measures displayed ethnic disparities, the strongest associations that were most concordant in both African Americans and European Americans were the positive correlations between triglycerides and FPG (P < 0.0001), HDL cholesterol and insulin sensitivity (P < 0.0001), LDL cholesterol and HbA1c (P = 0.006), and the negative correlation between triglycerides and insulin sensitivity (P < 0.0001). Plasma triglyceride levels in the present study were much lower in African American participants that their European American counterparts, a well-known finding. 6 Despite that difference, the correlation coefficient of plasma triglycerides with directly measured insulin sensitivity in African Americans (r = −0.34, P = 0.0005) was identical to that of European Americans (r = −0.35, P = 0.0003) (Table 4). The latter finding provides direct support for the notion that African Americans manifest insulin resistance at lower triglyceride levels, compared to European Americans. 23
Baseline levels of HDL cholesterol and triglycerides had opposite correlations with insulin sensitivity and insulin secretion, which is a physiologically congruent finding. Theoretically, improvement of insulin sensitivity via putative apolipoprotein A or HDL-associated mechanisms24–26 can be expected to decrease insulin requirement, whereas insulin resistance associated with circulating triglycerides and their hydrolytic products (e.g. non-esterified fatty acids) would demand increased insulin secretion.27,28 Triglycerides and free fatty acids also acutely augment insulin secretion.29,30 A stimulatory effect of HDL on insulin secretion has also been shown in vivo 26 and in vitro; 31 however, that effect occurs under high-glucose, but not low-glucose, conditions.26,31 As our study participants were selected for normoglycemia, the lack of positive correlation between HDL cholesterol levels and insulin secretion was not surprising. The observation that total and LDL cholesterol levels correlated positively with both FPG and HbA1c levels in our healthy cohort, and predicted incident prediabetes, was unexpected. Unlike HDL cholesterol and triglycerides, LDL cholesterol levels are not substantially altered in patients with T2DM. 32 As we did not observe any correlation between total cholesterol or LDL cholesterol levels and insulin sensitivity or acute insulin secretion, alterations in these traditional glucoregulatory mechanisms would not explain the association between glycemia and total or LDL cholesterol levels. Studies in animal models indicate that intra-islet accumulation of LDL cholesterol is associated with impaired glucose homeostasis.33,34
Our observation of a significant association between plasma lipids and the risk of prediabetes/T2DM is congruent with experimental and clinical data.3,4,35–39 Elevations in circulating levels of non-esterified fatty acids and triglycerides precede the development of hyperglycemia in the Zucker diabetic fatty rat model. 35 Cross-sectional studies have reported associations between glycemia and plasma lipids, including the finding of higher triglycerides and lower HDL cholesterol levels in individuals with prediabetes.37,38 In the present report, we show that higher baseline levels of triglycerides and lower levels of HDL cholesterol predict the development of prediabetes during longitudinal follow-up. The strengths of the present report include the prospective study design, a diverse study population, and the use of robust methodologies for assessment of insulin sensitivity and secretion. Despite these strengths, our study has some limitations. First, the associations between lipid moieties and prediabetes risk, and the related mechanisms that we observed, do not equate to causality. Second, we studied a special population (offspring of T2DM parents), which may limit the extrapolation of our findings to the general population of individuals without a family history of T2DM. Furthermore, our conclusions are based on baseline values of lipid profile, insulin sensitivity, and insulin secretion, without consideration for possible temporal changes in lipid levels and the other parameters that might have occurred during the follow-up period.
In conclusion, among healthy offspring of parents with T2DM, baseline lipid profiles predicted incident prediabetes/T2DM, and exhibited pathophysiologically congruent associations with adiposity and glucoregulatory mechanisms. As prediabetes is a toxic cardiometabolic state, with significant complications,40,41 the ability of simple routinely measured lipid levels to predict incident prediabetes would be a valuable step toward early recognition of at-risk persons. Indeed, our longitudinal study showed that a baseline lipidemic signature identified normoglycemic individuals at risk for future glycemic progression, via congruent pathophysiological mechanisms. Based on the distribution of plasma lipids in our study cohort, the actual values that correspond to high risk for incident prediabetes/T2DM translate to LDL cholesterol levels of ≥144 mg/dL (90th percentile), HDL cholesterol levels of ≤38 mg/dL (10th percentile) and triglycerides of ≥160 mg/dL (90th percentile). We recommend, on empirical grounds, that persons with a family history of T2DM who harbor these high-risk lipid characteristics be considered for intensified lifestyle counseling, to decrease their risks of worsening dyslipidemia and dysglycemia.
Footnotes
Author contributions
All authors participated in the interpretation of the studies and review of the manuscript; SD-J designed study, analyzed data, wrote manuscript, IO and NU collected data, reviewed and revised manuscript, JW performed statistical analysis, reviewed, and revised manuscript.
Acknowledgments
The POP-ABC study was supported by Grant R01 DK067269 from the National Institutes of Health and Grant 7-07-MN-13 from the American Diabetes Association, awarded to SD-J. We are indebted to the participants who volunteered for this study.
Authors note
POP-ABC Research Group: Current: Samuel Dagogo-Jack, MD (Principal Investigator), Ann Ammons, BS, Fatoumatta Ceesay, BS, Ibiye Owei, MBBS, MPH, Nkiru Umekwe, MBBS, Jim Wan, PhD. Past members: Emmanuel Chapp-Jumbo, MBBS (2009–2011), Ruben Cuervo, MD (2006–2007), Sotonte Ebenibo, MBBS, MPH (2012–2015), Chimaroke Edeoga, MBBS, MPH (2007–2013), Nonso Egbuonu, MBBS (2007–2010), Nicoleta Ionica, MD (2007–2008), Dorota Malinowski, MD (2007–2008). Consultant: Steven Haffner, MD; Data and Safety Officer: Murray Heimberg, MD, PhD.
Declaration of Conflicting Interests
The author(s) declared no potential conflicts of interest with respect to the research, authorship, and/or publication of this article.