
Abstract
Adipose tissue dysfunction represents a hallmark of diabetic patients and is a consequence of the altered homeostasis of this tissue. Mesenchymal stem cells (MSCs) and their differentiation into adipocytes contribute significantly in maintaining the mass and function of adult adipose tissue. The aim of this study was to evaluate the differentiation of MSCs from patients suffering type 2 diabetes (dASC) and how such process results in hyperplasia or rather a stop of adipocyte turnover resulting in hypertrophy of mature adipocytes. Our results showed that gene profile of all adipogenic markers is not expressed in diabetic cells after differentiation indicating that diabetic cells fail to differentiate into adipocytes. Interestingly, delta like 1, peroxisome proliferator-activated receptor alpha, and interleukin 1β were upregulated whereas Sirtuin 1 and insulin receptor substrate 1 gene expression were found downregulated in dASC compared to cells obtained from healthy subjects. Taken together our data indicate that dASC lose their ability to differentiate into mature and functional adipocytes. In conclusion, our in vitro study is the first to suggest that diabetic patients might develop obesity through a hypertrophy of existing mature adipocytes due to failure turnover of adipose tissue.
Impact statement
In the present manuscript, we evaluated the differentiative potential of mesenchymal stem cells (MSCs) in adipocytes obtained from healthy and diabetic patients. This finding could be of great potential interest for the field of obesity in order to exploit such results to further understand the pathophysiological processes underlying metabolic syndrome. In particular, inflammation in diabetic patients causes a dysfunction in MSCs differentiation and a decrease in adipocytes turnover leading to insulin resistance.
Introduction
Adipocytes constitute an endocrine system that can adapt to different metabolic changes through the ability to synthesize and release a wide variety of hormones, cytokines, growth factors, extracellular proteins, and vasoactive factors which are known as adipokines. 1 Several studies suggested that adipose tissue dysfunction in obese or diabetic patients is characterized by the production of many proinflammatory cytokines that are involved in the genesis of the disease itself2,3 and can lead to other diseases such as dyslipidemia and hypertension.4,5 Therefore, the study of adipocytes turnover is important in order to understand the role of adipose tissue in metabolic syndrome. 6 New formed adipocytes derive from a pre-existing pool of adipose stem cells regardless of age; in particular, the adipose precursor cells are mesenchymal stem cells (MSCs) and their differentiation into adipocytes represents an useful tool to unravel the role played by these cells in different metabolic diseases including diabetes. 7 Severe obesity predisposes individuals to metabolic syndrome, and recent data suggest that MSCs contribute significantly to adipocyte generation by increasing the number of adipocytes8,9 thus playing an important role in maintaining the mass and function of adult adipose tissue. Furthermore, previous studies also showed that obesity results in adipocyte hyperplasia or hypertrophy in a non-functional state and with a secretory pattern of adipokines influencing the whole individual metabolism.10,11 From this point of view, few studies have been performed to understand how adipose tissue turnover is regulated in diabetes. Our hypothesis is that in diabetic patients there exists an increased precursor’s differentiation into adipocytes thus causing hyperplasia or rather a stop of adipocyte turnover resulting in hypertrophy of mature adipocytes. Therefore, the aim of this study was to investigate the differentiation potential of human adipose tissue MSCs obtained from healthy patients (hASC) and from patients suffering from type 2 diabetes (dASC).
Material and methods
Adipose stem cells (ASCs) culture and differentiation
hASC and dASC were purchased from Lonza (Basel, Switzerland). Cells were plated in 75 cm2 flasks at a density of 1 to 2 × 10⁴ cells and cultured in DMEM with 10% FBS for seven days. The culture medium was replaced with adipogenic medium and the cells were cultured for 21 days. Adipogenic medium consists of complete culture medium with DMEM-F12 high glucose concentration, 3% FBS, insulin 100 nM, 100 nM dexamethasone (Sigma-Aldrich, St. Louis, MO), 0.5 mM isobutilmetilxantina (Sigma-Aldrich), 60 μM indomethacin (Sigma-Aldrich), and transferrin 10 mg/mL. Culture medium was replaced every three days.
Oil Red O staining
Staining was performed using 0.21% Oil Red in 100% isopropanol (Sigma-Aldrich, St. Louis, MO, USA). Briefly, cells were fixed in 10% formaldehyde, stained with Oil Red for 10 min and rinsed with 60% isopropanol (Sigma-Aldrich). Nuclei, stained with NucBlue (ThermoFisher Scientific), and lipid droplets accumulation were examined by using inverted multichannel LED fluorescence microscope (Evos, Life Technologies, Grand Island, NY, USA).
RNA extraction and quantitative real-time-PCR (qRT-PCR)
PCR primers used in this study
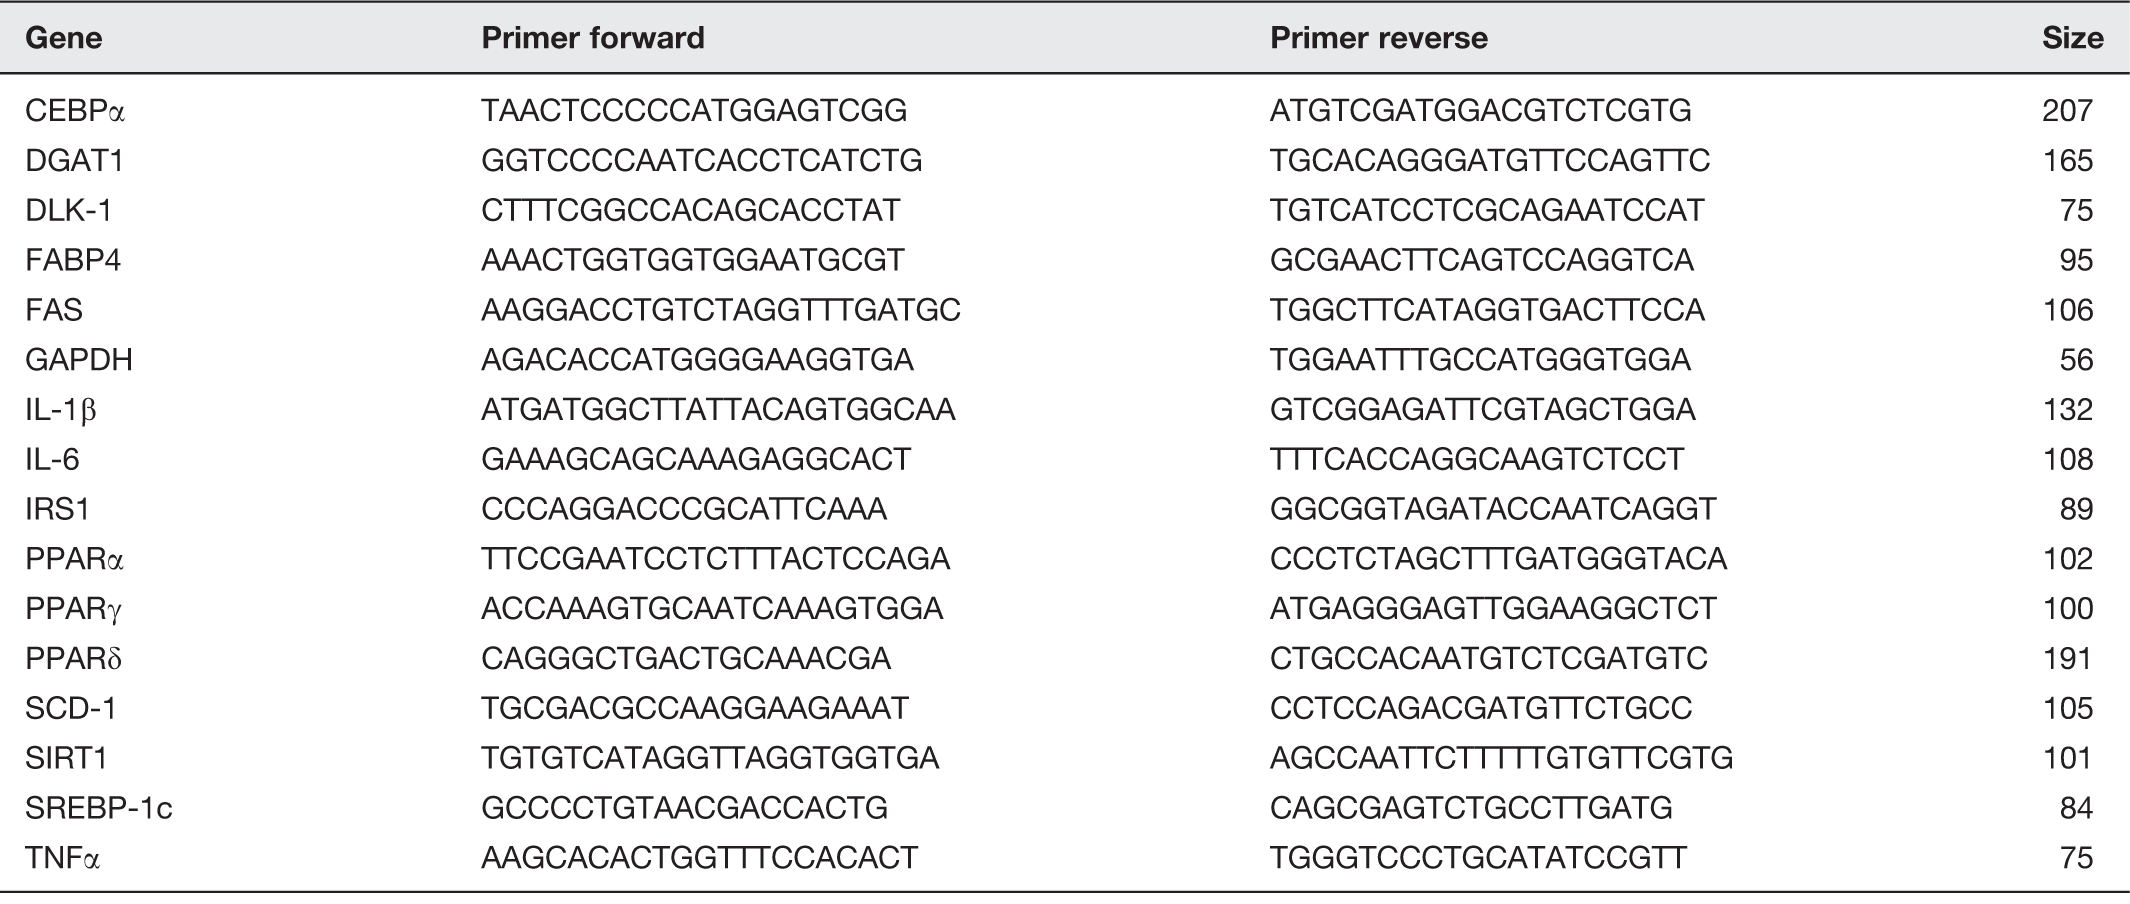
CEBPα: CCAAT/enhancer-binding protein alpha; DGAT1: diacylglycerol O-acyltransferase 1; DLK-1: delta like non-canonical Notch ligand 1; FABP4: fatty acid binding protein 4; FAS: fatty acid synthase; GAPDH: glyceraldehyde 3-phosphate dehydrogenase; IRS-1: insulin receptor substrate 1; IL: interleukin; PPAR: peroxisome proliferator-activated receptor; SCD-1: stearoyl-CoA desaturase-1; SIRT-1: sirtuin 1; SREBP-1c: sterol regulatory element-binding protein 1c; TNFα: tumor necrosis factor alpha.
Statistical analyses
Differences between experimental groups were determined by the Fisher method for analysis of multiple comparisons and statistical significance set at p < 0.05. For comparison between treatment groups, the null hypothesis was tested by either single-factor analysis of variance for multiple groups or the unpaired t-test for two groups. Data are presented as mean ± standard error (SEM).
Results
Adipocyte markers expression
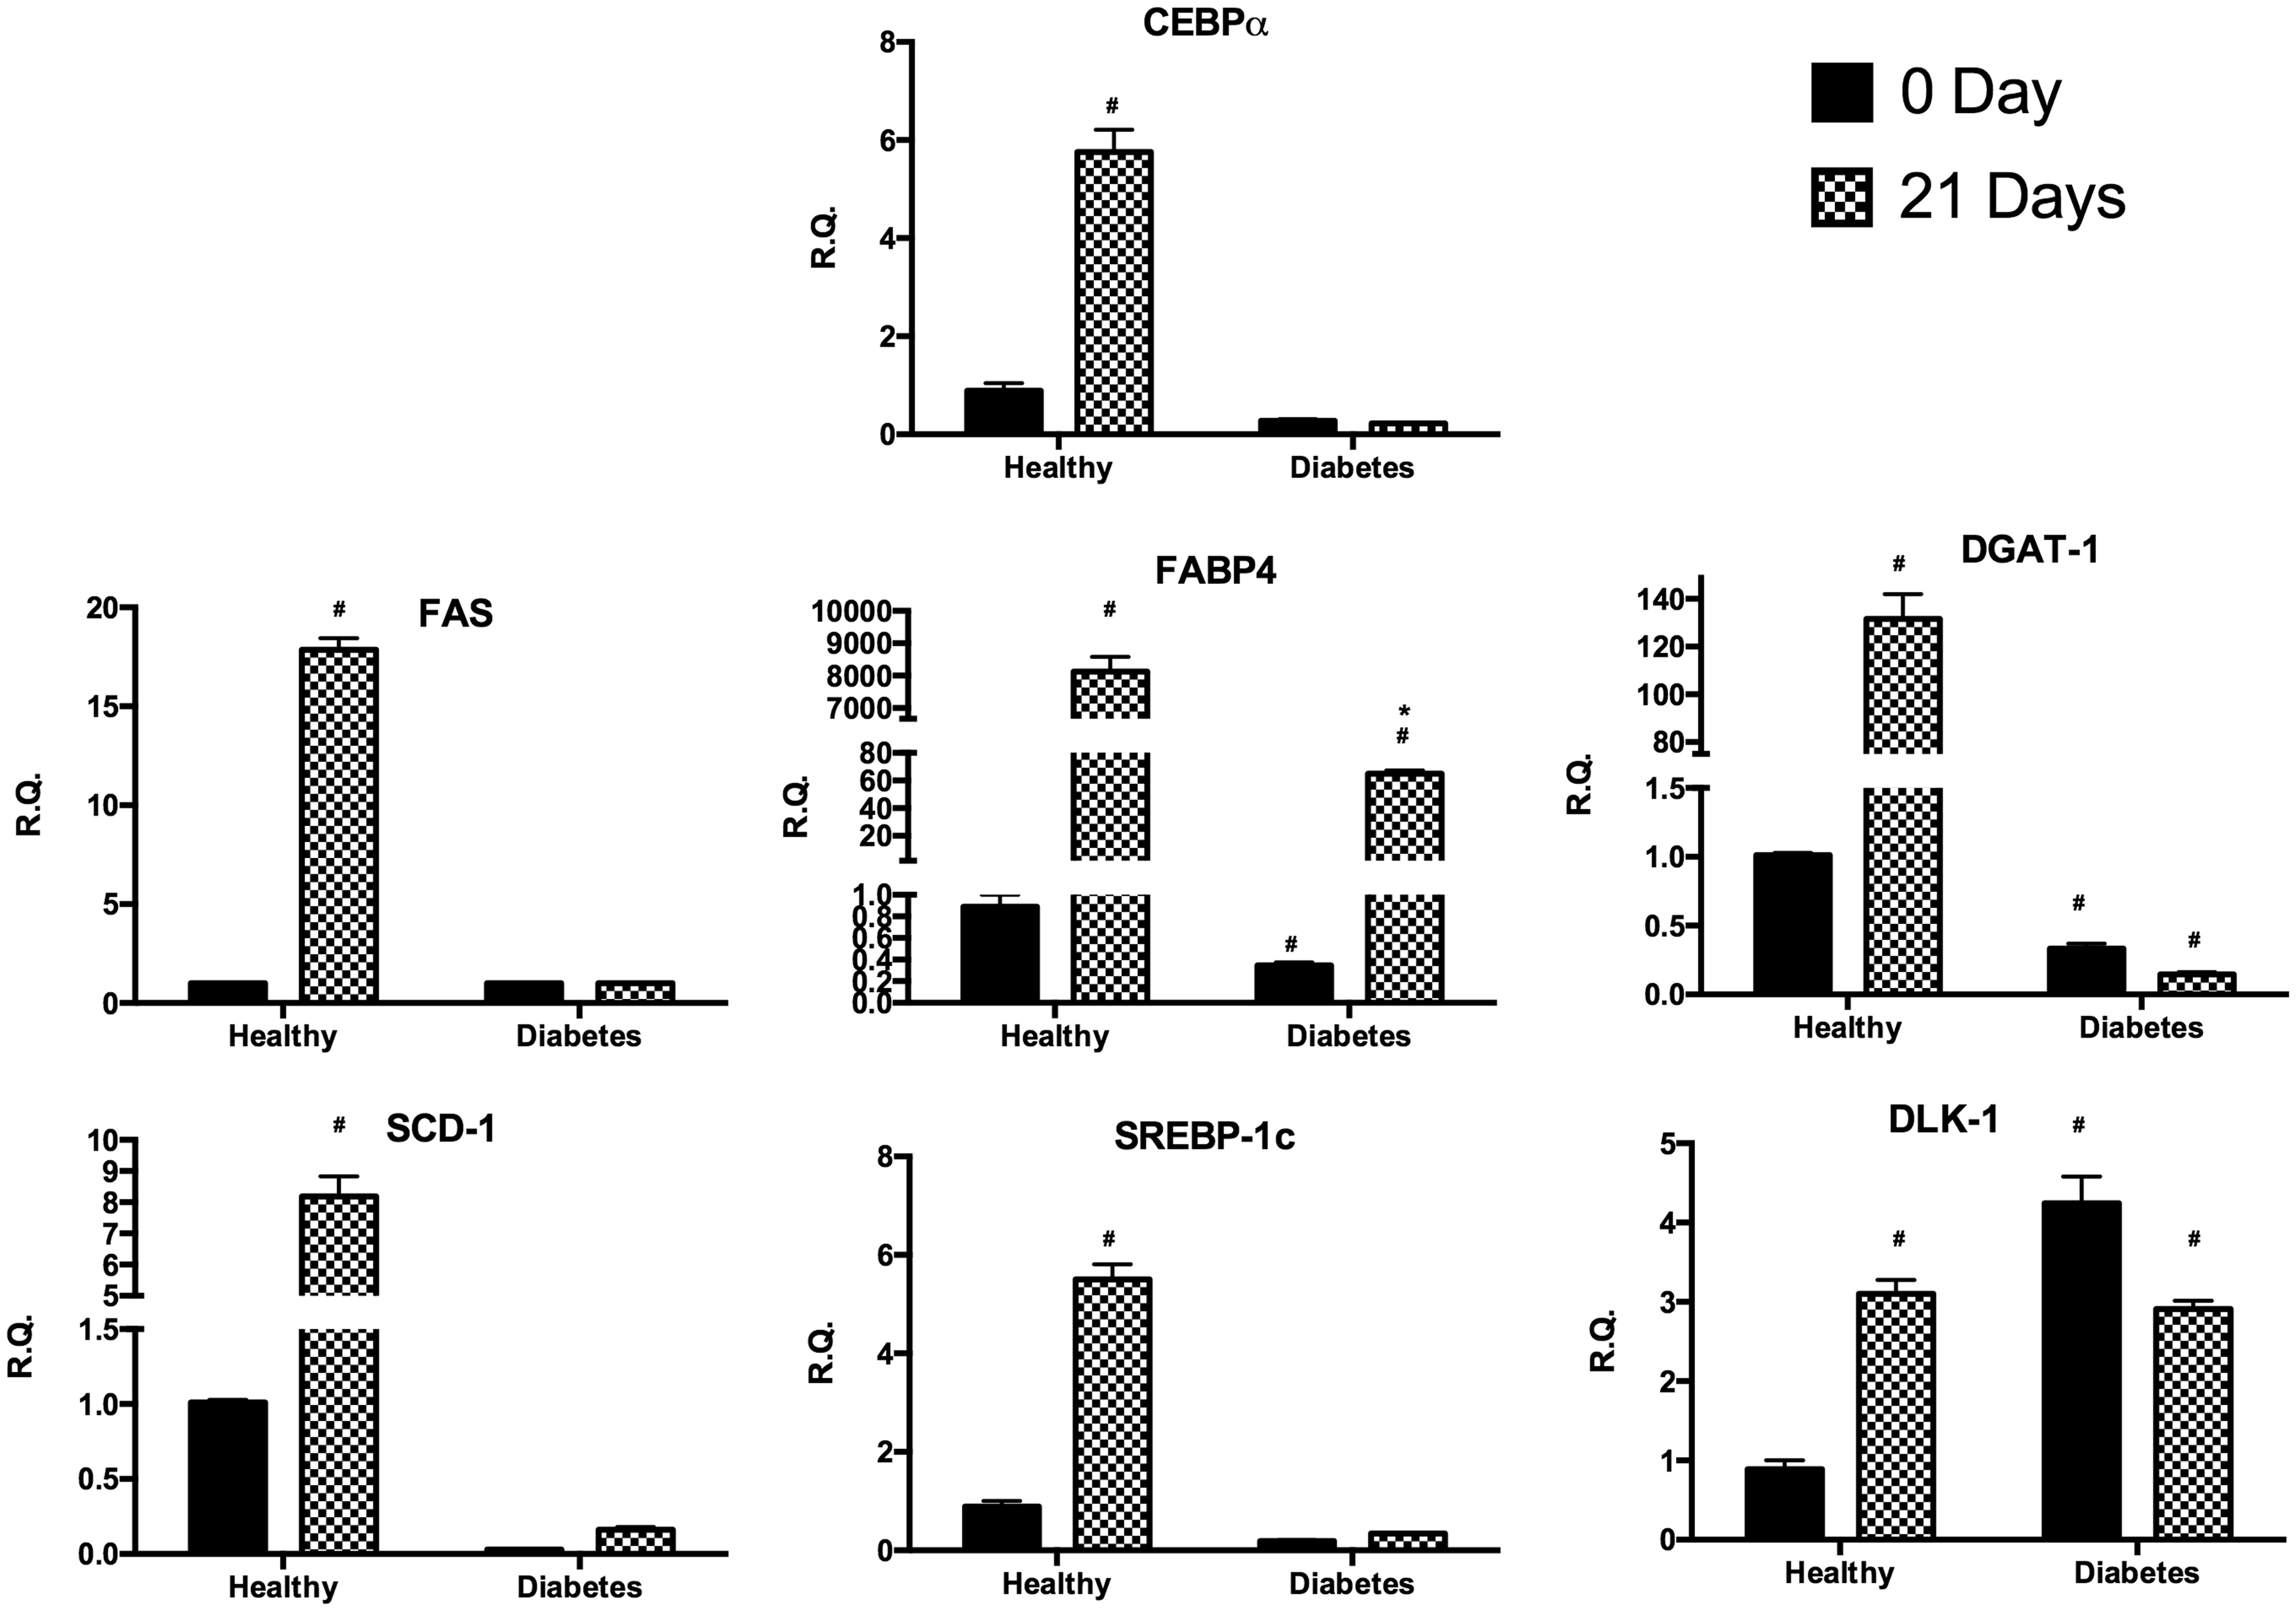
After the Oil Red staining, we observed several lipid droplets only in healthy cells after 21 days of adipogenic differentiation (Figure 1). In order to assess markers of differentiation, we measured the gene expression of CCAAT/enhancer-binding protein alpha (CEBPα), fatty acid synthase (FAS), fatty acid binding protein 4 (FABP4), diacylglycerol O-acyltransferase 1 (DGAT1), stearoyl-CoA desaturase-1 (SCD-1), sterol regulatory element-binding protein 1c (SREBP-1c), and delta like non-canonical Notch ligand 1 (DLK-1) (Figure 2). After 21 days of adipose differentiation we observed a significant increase of gene expression of CEBPα, FAS, DGAT-1, SCD-1, and SREBP-1c only in hASC. Furthermore, FABP-4 gene expression was increased in both type of cells, but in hASC overexpression of this gene was significantly more evident compared to dASC. Finally, the gene expression of DLK-1 shows that DLK-1 was up-regulated in diabetes cells with respect to healthy cells under normal condition while after differentiation the gene expression shows an increase in healthy cells and a decrease in diabetic cells.
hASC (healthy) (a) and dASC (diabetes) (b) cells after 21 days of adipogenic differentiation viewed by light microscopy. Lipid droplets accumulation measured by Oil Red staining in hASC (c) and in dASC (d) after 21 days of adipogenic differentiation. ASC: adipose stem cell. (A color version of this figure is available in the online journal.) Analysis of gene expression by real-time PCR of CEBPα, FAS, FABP4, DGAT1, SCD-1, SREBP-1c, and DLK-1 of hASC (healthy) and dASC (diabetes) before and after 21 days of adipogenic differentiation. All values are expressed as mean ± SEM of four experiments (n = 4) in duplicate. (#p < 0.05 versus hASC at 0 day; *p < 0.05 versus dASC at 0 day.) ASC: adipose stem cell; CEBPα: CCAAT/enhancer-binding protein alpha; DGAT1: diacylglycerol O-acyltransferase 1; DLK-1: delta like non-canonical Notch ligand 1; FAS: fatty acid synthase; FABP4: fatty acid binding protein 4; hASC: healthy adipose stem cell; PCR: polymerase chain reaction; SCD-1: stearoyl-CoA desaturase-1; SREBP-1c: sterol regulatory element-binding protein 1c.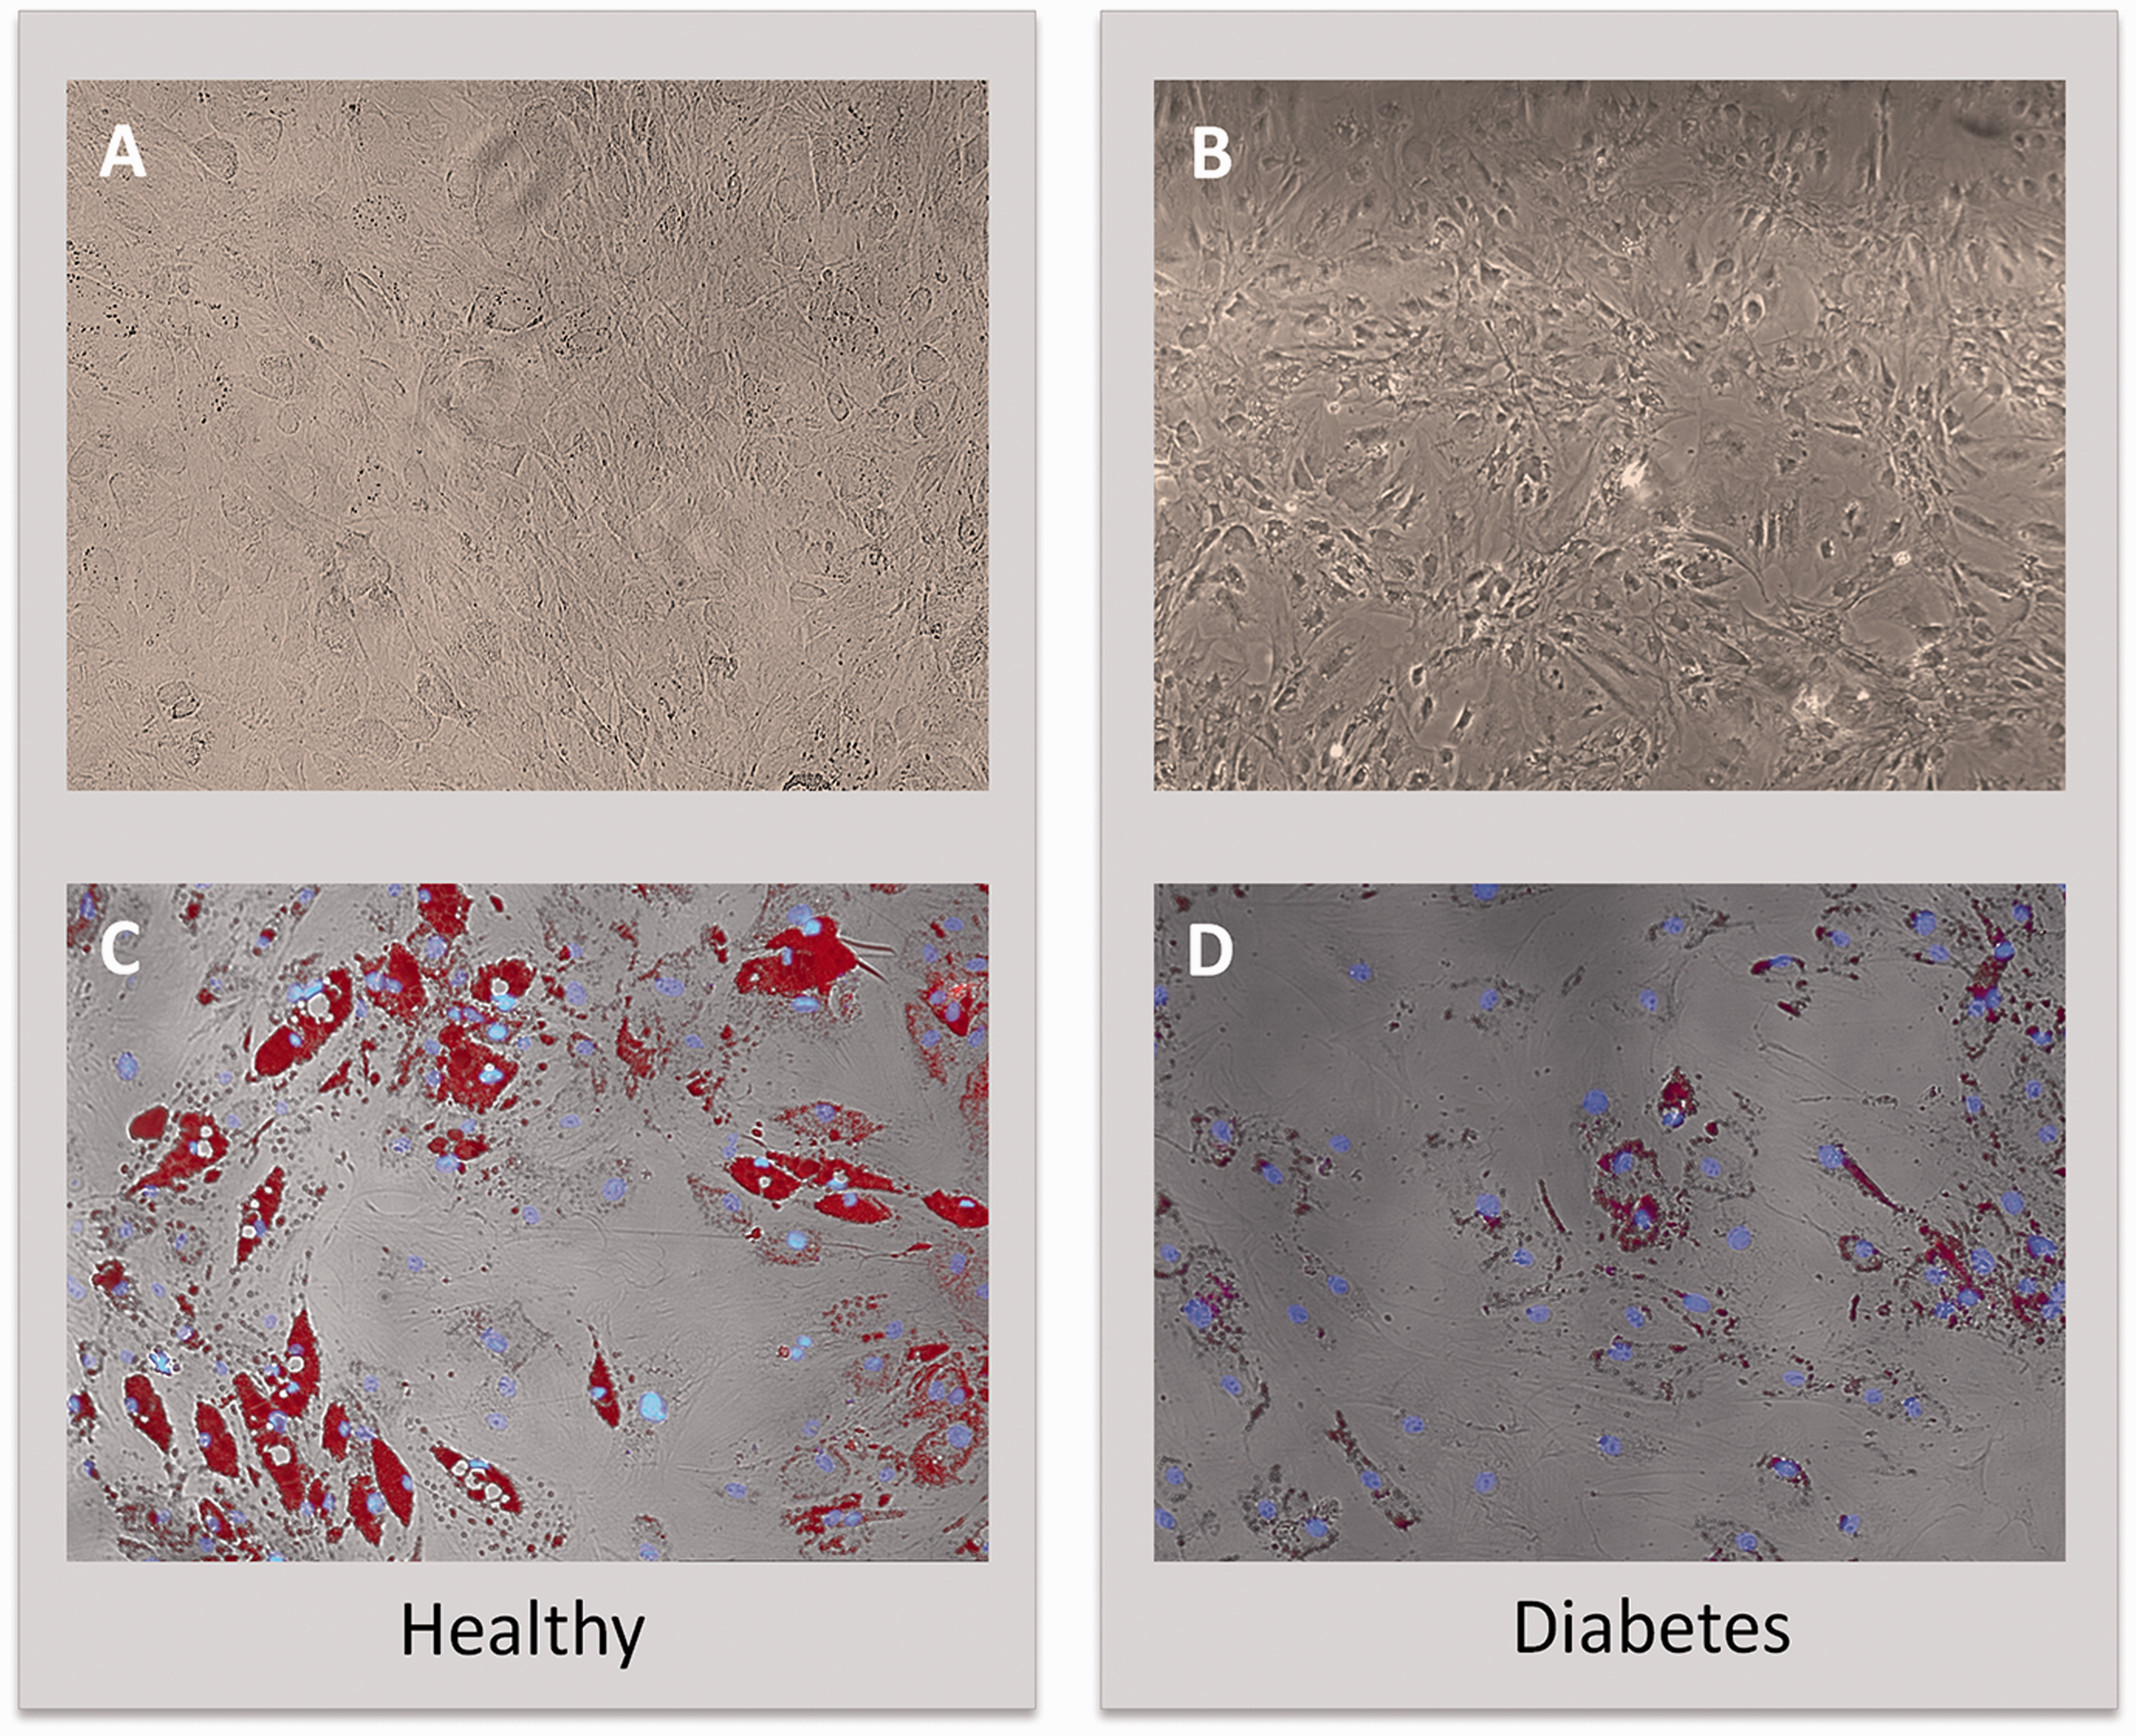
Expression of inflammatory cytokines
In order to investigate the potential inflammatory status of the different cultures, we measured the proinflammatory cytokines interleukin 1β (IL-1β), IL-6, and TNFα before and after differentiation (Figure 3). In undifferentiated cells IL-1β gene expression resulted significantly higher in dASCs with respect to hASCs under basal condition whereas after differentiation its expression was upregulated in hASCs and downregulated in dASCs. On the other hand, IL-6 and TNFα gene expression were higher in the undifferentiated hASC compared to dASC whereas after adipose differentiation only hASC exhibited a significant increase of these cytokines.
Analysis of gene expression by real-time PCR of cytokines IL-1β, IL-6, and TNFα of hASC (healthy) and dASC (diabetes) before and after 21 days of adipogenic differentiation. All values are expressed as mean ± SEM of four experiments (n = 4) in duplicate. (#p < 0.05 versus hASC at 0 day; *p < 0.05 versus dASC at 0 day.). ASC: adipose stem cell; IL: interleukin; PCR: polymerase chain reaction; SEM: mean standard error; TNFα: tumor necrosis factor alpha.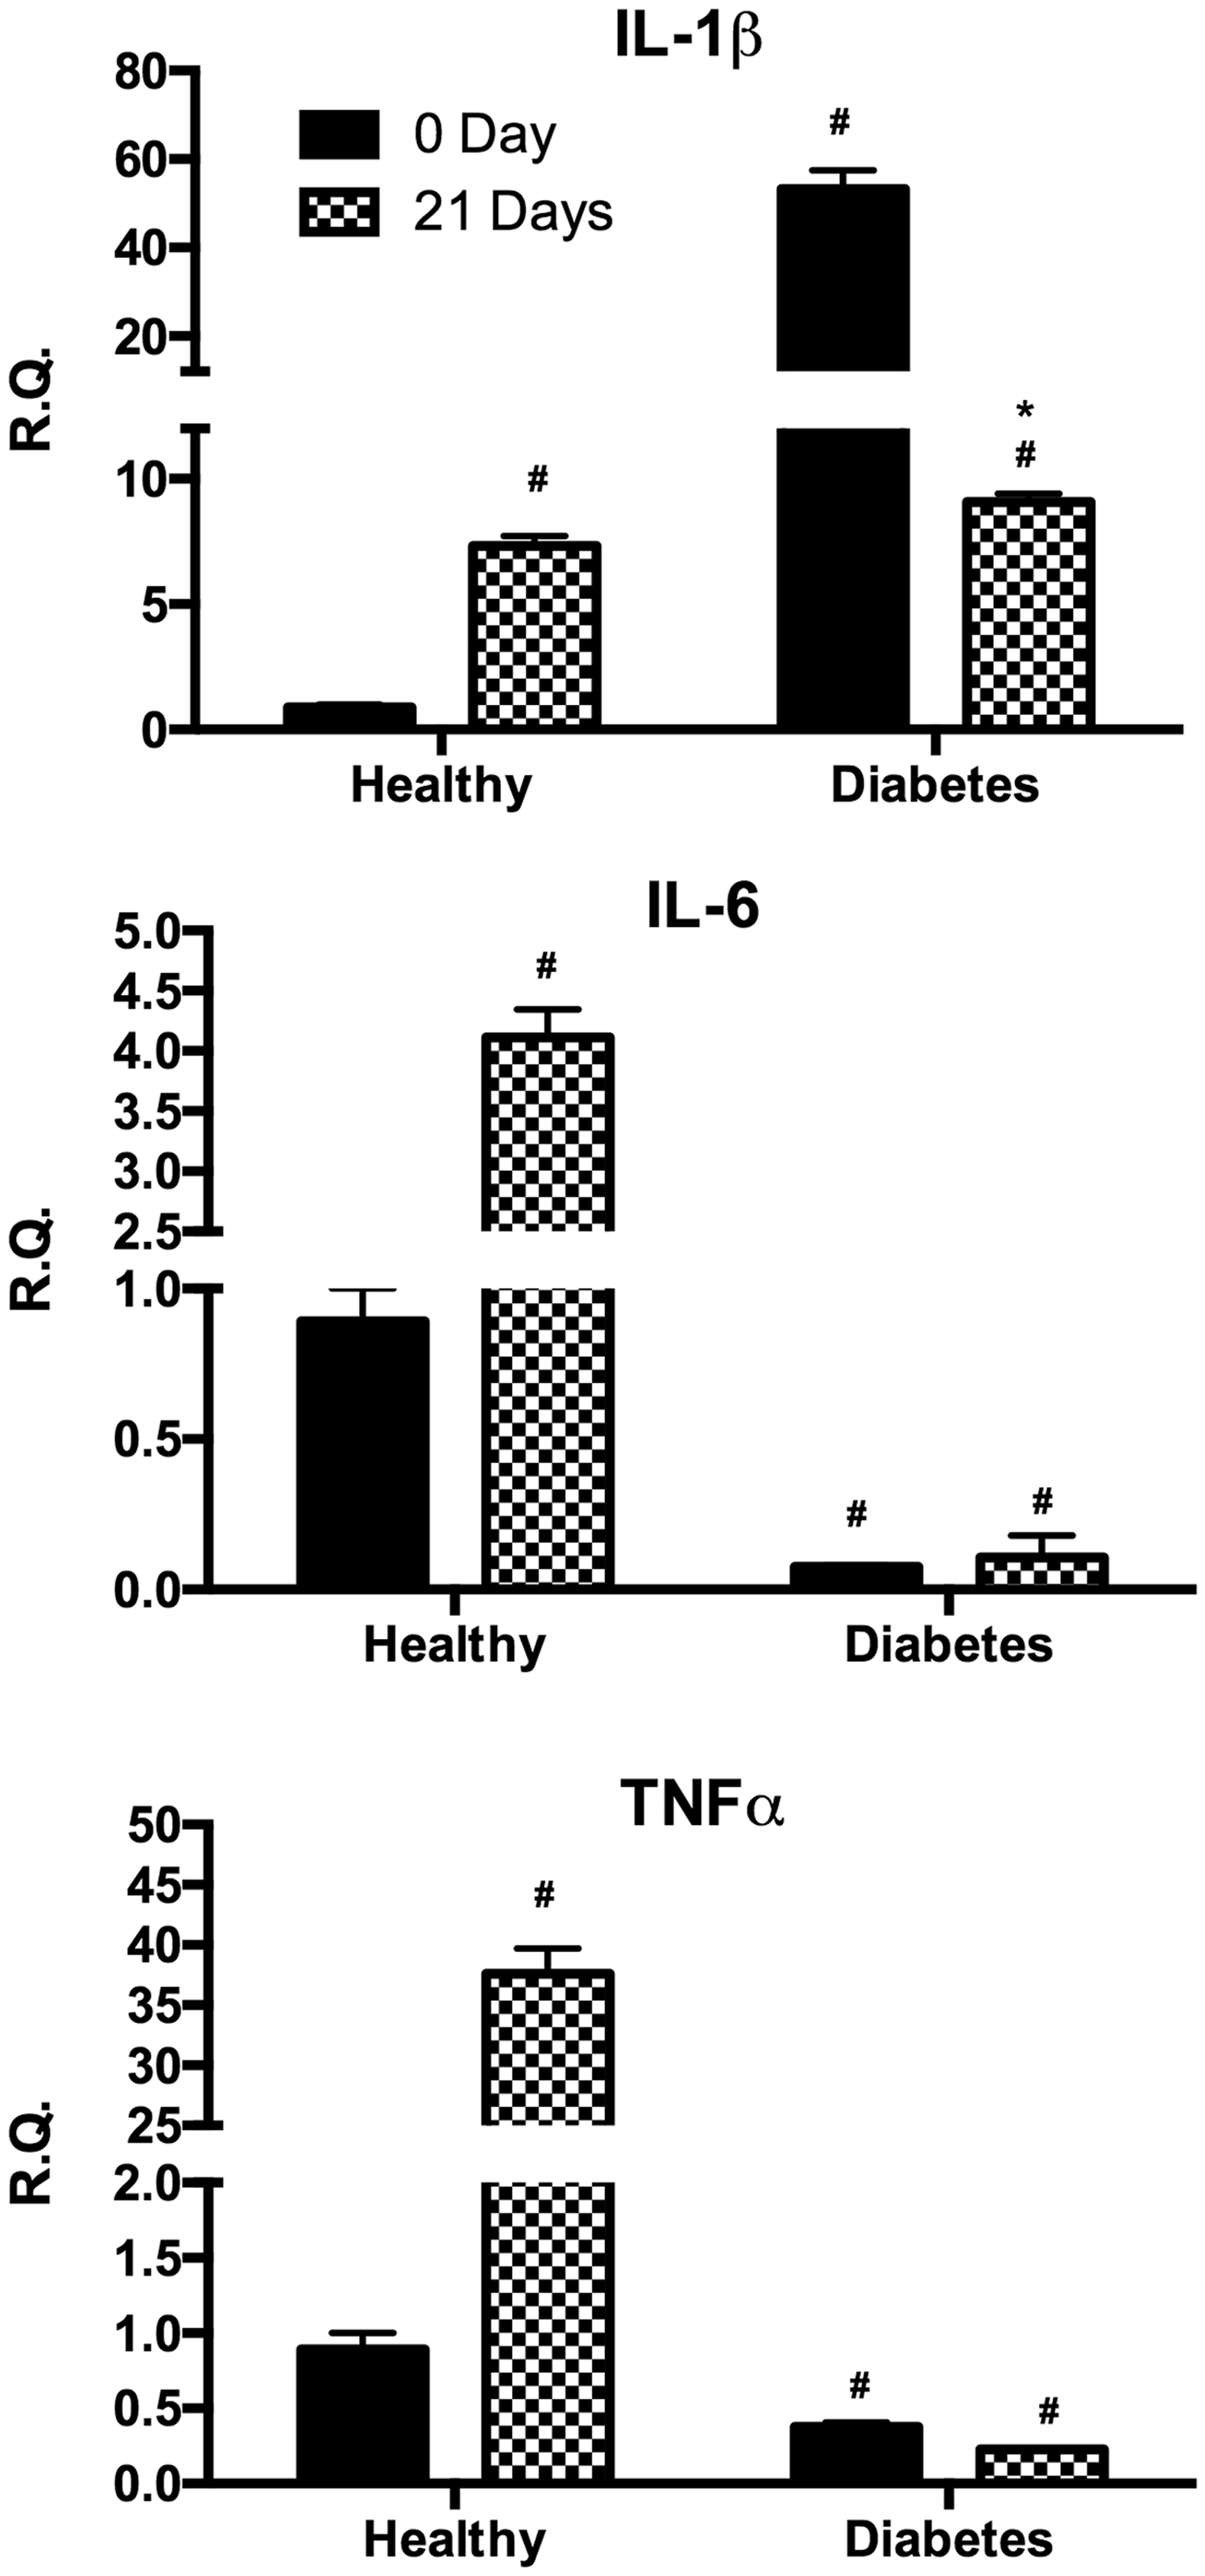
Expression of peroxisome proliferator-activated receptors
In order to investigate signals underlying the regulation of lipid metabolism, we analyzed the expression of peroxisome proliferator-activated receptor family (PPARα, PPARδ, and PPARγ) (Figure 4). In undifferentiated cells, PPARα gene expression resulted significantly higher in dASC with respect to hASC whereas after differentiation only hASC presented a significant increase of this gene. Similarly, after differentiation only hASC resulted in a significant increase of PPARδ and PPARγ.
Analysis of gene expression of PPARα, PPARδ, and PPARγ by real-time PCR of hASC (healthy) and dASC (diabetes) before and after 21 days of adipogenic differentiation. All values are expressed as mean ± SEM of four experiments (n = 4) in duplicate. (#p < 0.05 versus hASC at 0 day.). ASC: adipose stem cell; PCR: polymerase chain reaction; PPAR: peroxisome proliferator-activated receptor.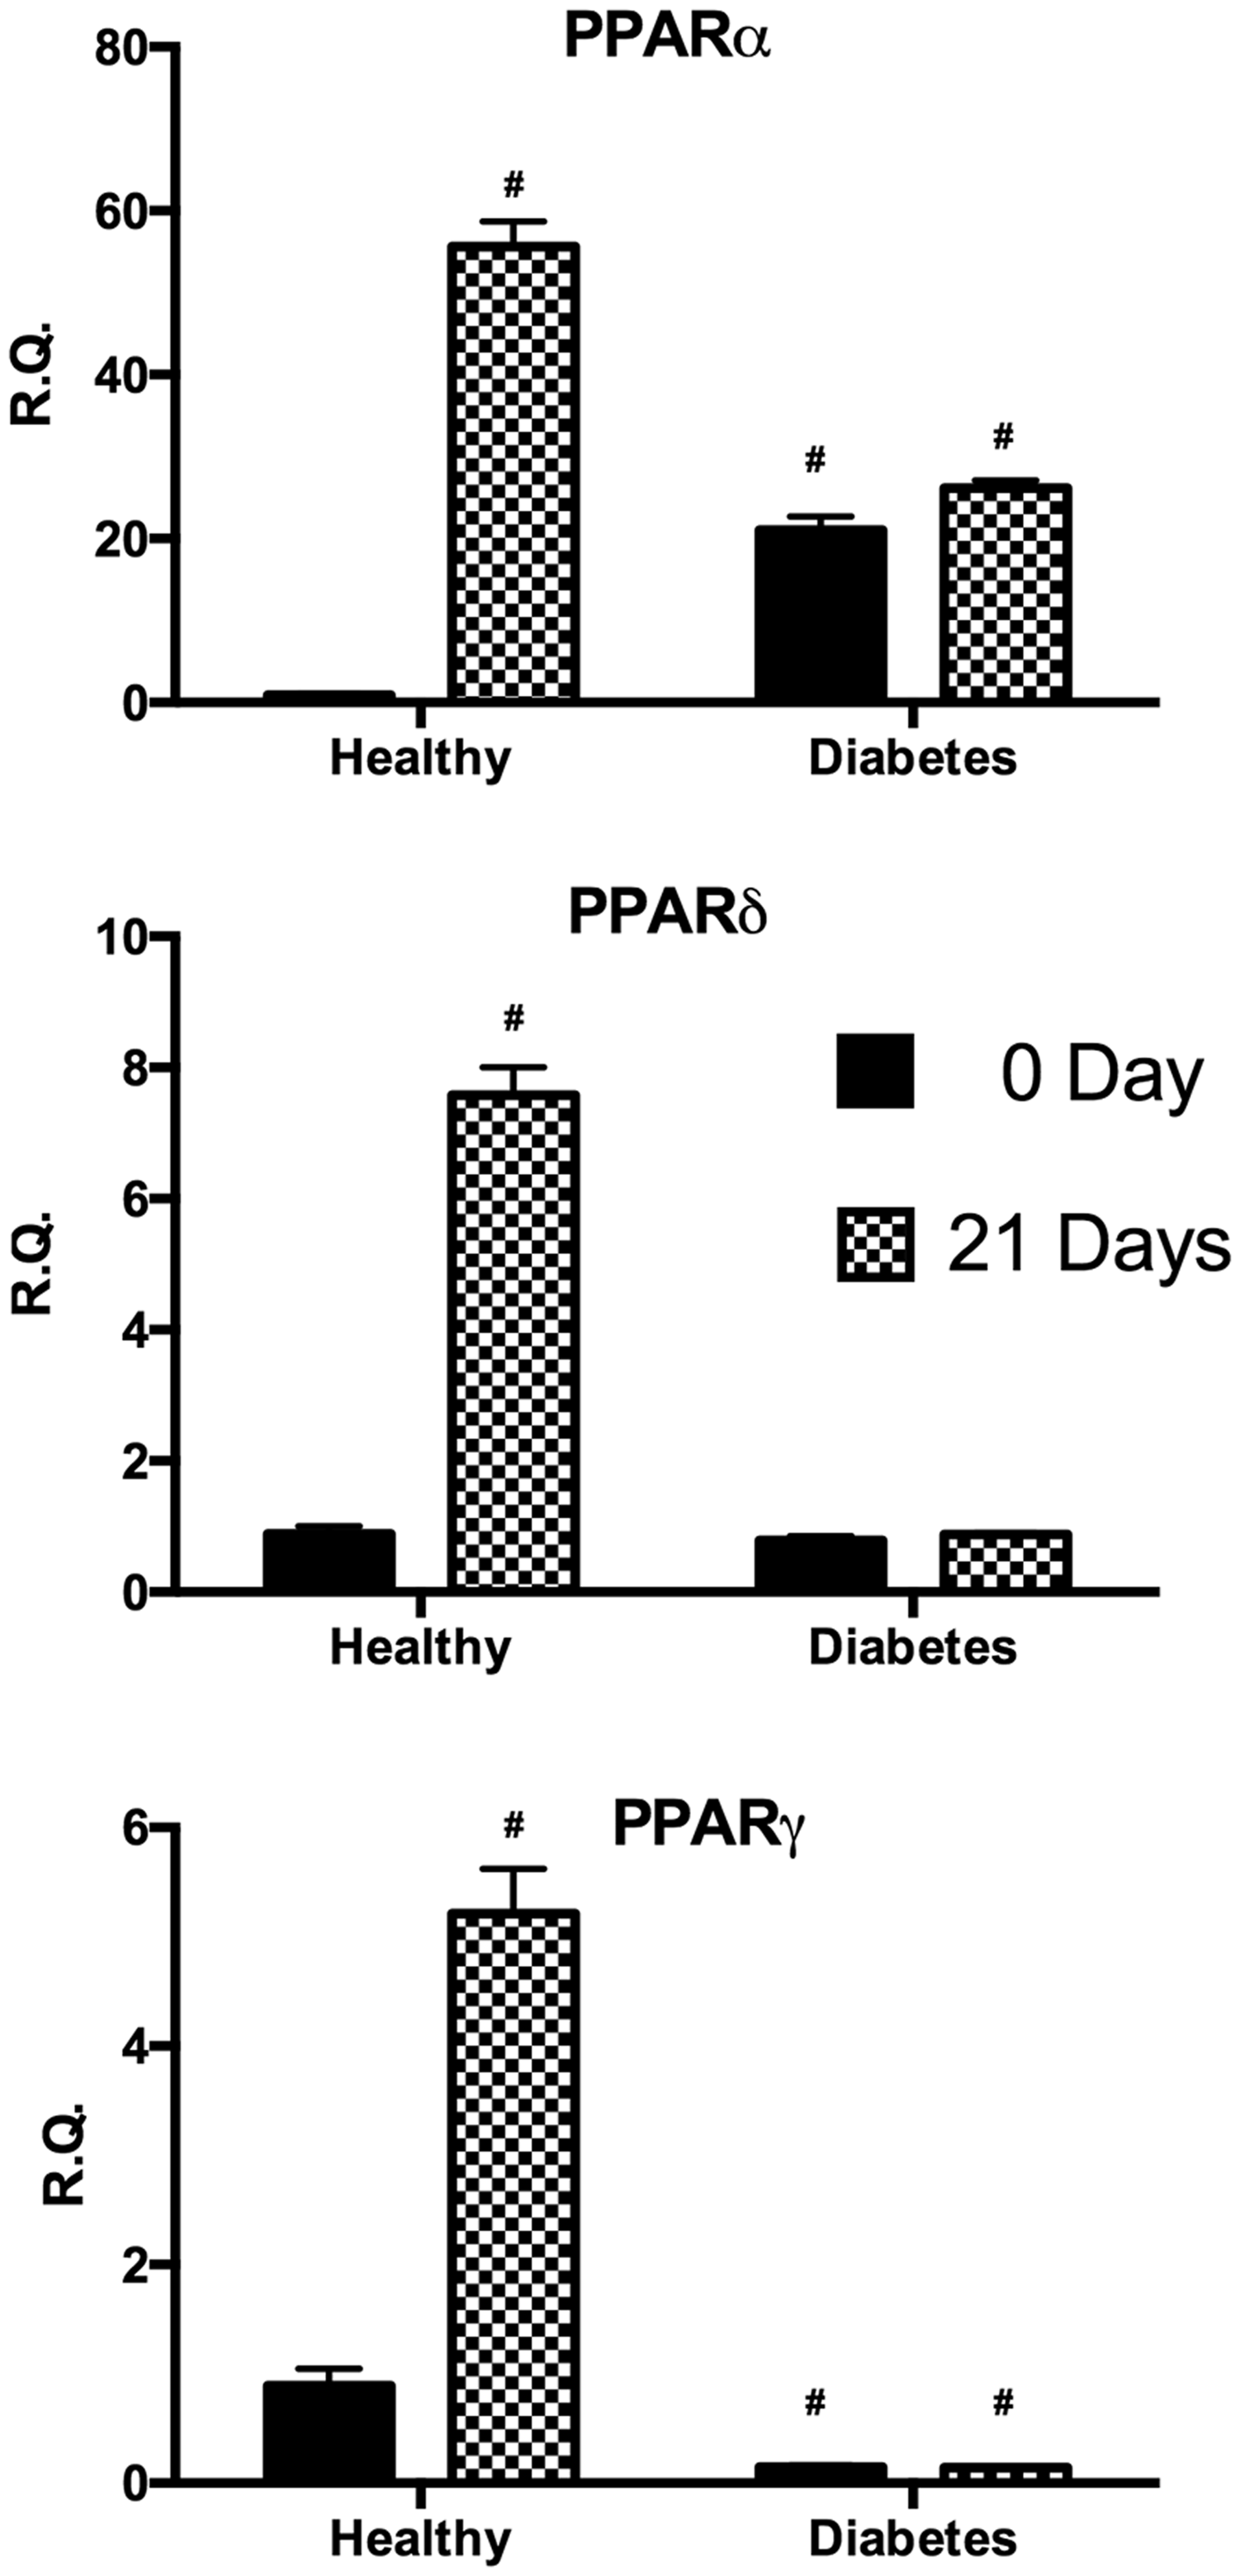
Expression of insulin receptor substrate 1 (IRS-1) and sirtuin 1 (SIRT-1)
In both undifferentiated and differentiated cells, SIRT1 and IRS-1 gene expression was found to be significantly reduced in dASC when compared to hASC. Furthermore, after differentiation hASC showed a significant decrease of IRS-1 gene expression while no difference was observed for dASC. Finally, SIRT-1 gene resulted in upregulation after differentiation exclusively in hASC (Figure 5).
Analysis of gene expression by real-time PCR of IRS-1 and SIRT1 of hASC (healthy) and dASC (diabetes) before and after 21 days of adipogenic differentiation. All values are expressed as mean ± SEM of four experiments (n = 4) in duplicate. (#p < 0.05 versus hASC at 0 day.). ASC: adipose stem cell; IRS-1: insulin receptor substrate 1; PCR: polymerase chain reaction; SIRT-1: sirtuin 1.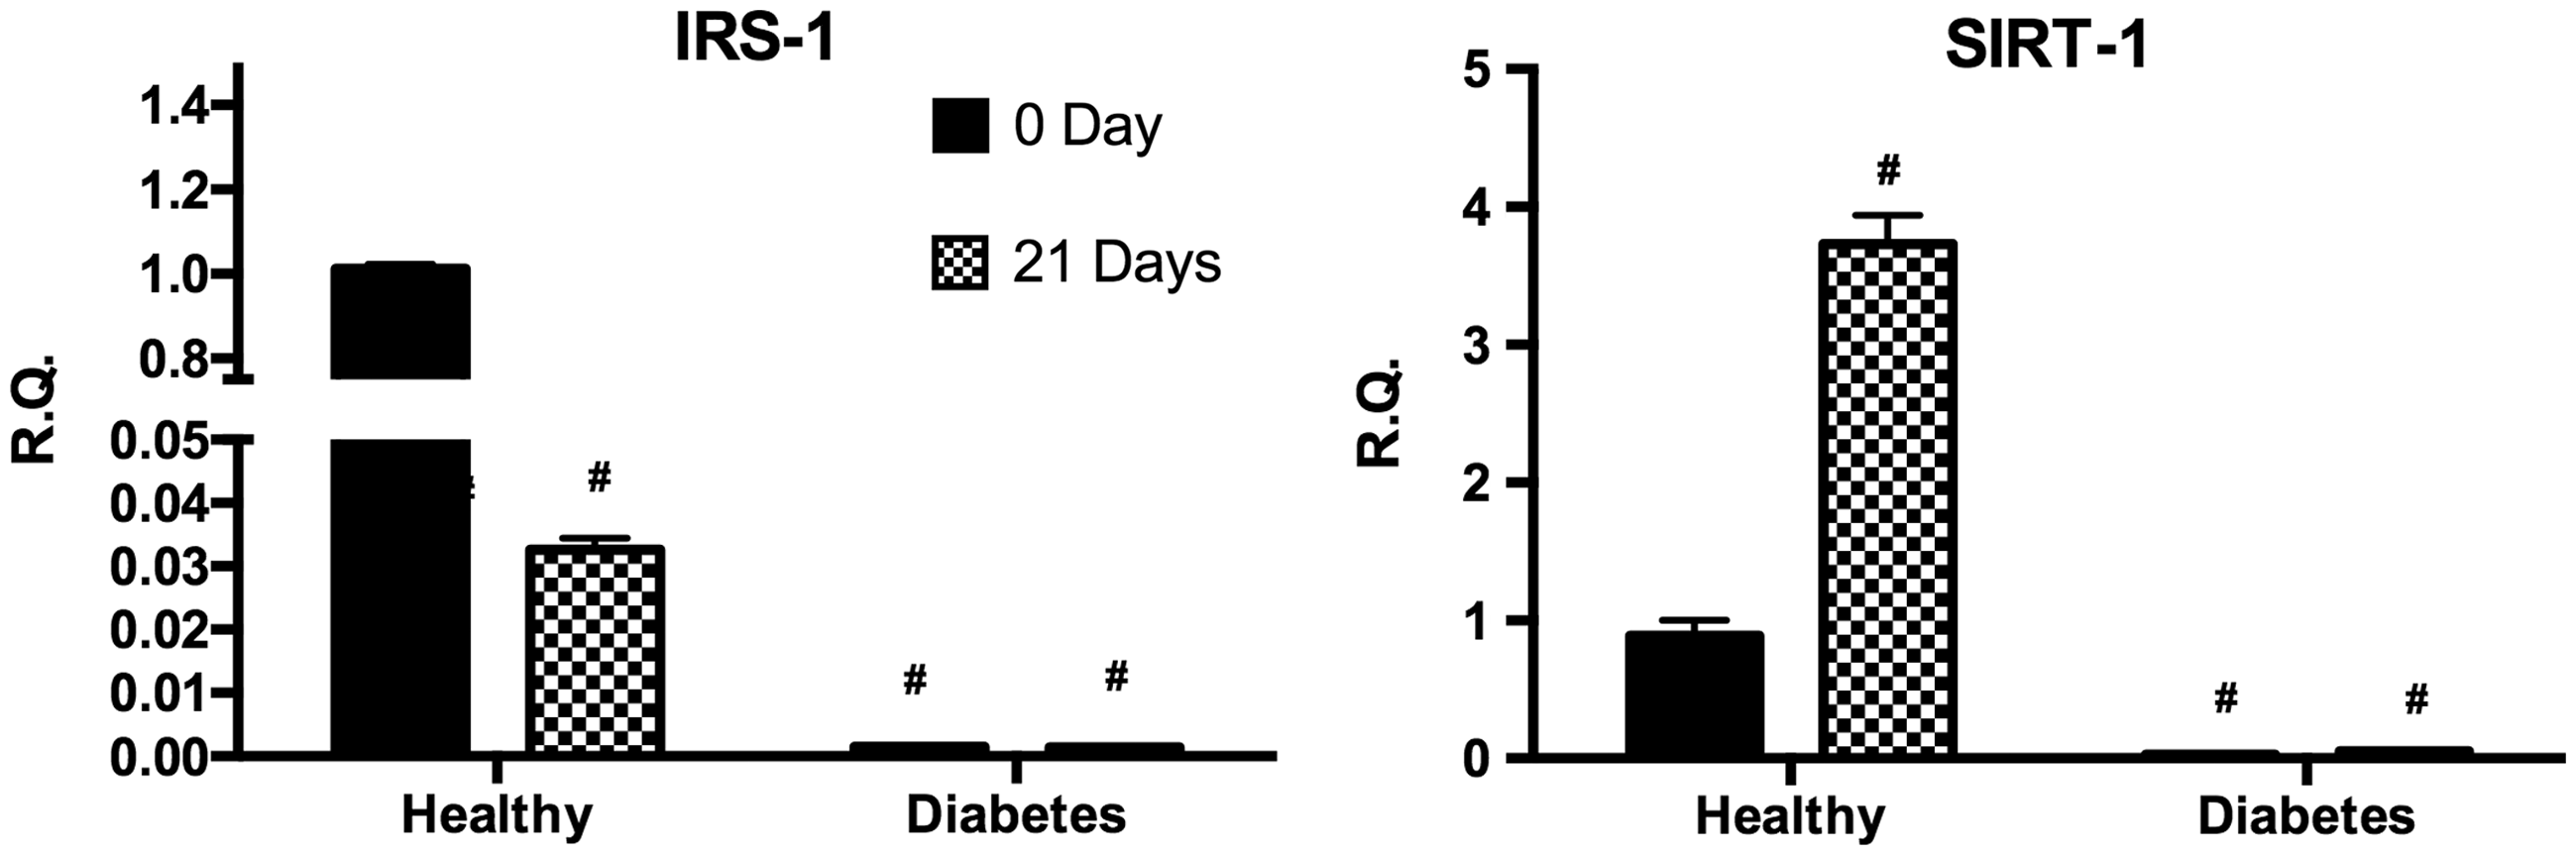
Discussion
The physiological role of adipocytes and adipose tissue includes providing body isolation both mechanically and thermally, storing fat when it is in excess and providing it when energy demand increases. Insulin plays an important role in maintaining the homeostasis of lipid in adipocytes as it is a potent activator of lipoprotein lipase inhibitor and the hormone-sensitive lipase. 16 Insulin resistance can be caused or be a result of adipose tissue dysfunction and therefore such cells become an important target for research in the metabolic syndrome field. Further, dysfunction of adipose tissue such as obesity is commonly associated with type 2 diabetes. The coexistence of obesity and type 2 diabetes suggests the possibility of a strong link between them, and over the last two decades, a number of positive correlations among them were determined by numerous studies.17–19 In obese patients, adipose tissue expands via differentiation of preadipocytes into adipocytes (i.e. adipogenesis) and/or hypertrophy of existing adipocytes. Several and severe are the metabolic consequences of a low adipogenic capacity, as it leads to adipocyte hypertrophy, causing inflammatory macrophage accumulation; insulin resistance; and also ectopic fat accumulation in liver, muscles, kidney, and pancreas. 20 In the present study, we showed that adipose-derived MSCs from type 2 diabetic patients fail to differentiate into adipocytes. In particular, we investigated the expression profile of well-established mature adipocyte genes related to lipid metabolism and inflammation. Our results showed that, with the exception of FABP4 and DLK-1, all adipogenic markers are not expressed in diabetic cells after differentiation, confirming that diabetic cells do not differentiate into adipocytes. Furthermore, FABP4 gene expression in diabetic stem cells after differentiation is still lower than the healthy cells. As concern DLK-1, the gene is significantly overexpressed in diabetic undifferentiated cells compared to healthy undifferentiated cells. Following adipocyte differentiation, DLK-1 gene expression was increased in hASC while it was decreased in dASC. This finding is consistent with previous studies showing that DLK1 expression inhibits the differentiation of MSCs into adipocytes.21,22
In our study we evaluated PPARs (α, δ, and γ) gene expression, a receptor family considered to play a role in linking obesity and T2DM. 23 PPARα interferes with several steps of lipid metabolism, the main outcomes of this receptor activation increase fatty acid oxidation leading to the decrease in plasma levels of triglycerides lowering its synthesis and storage in adipocytes. 24 PPARδ activation results instead in an increase of the oxidation of fatty acids contributing to decrease insulin resistance and consequently to increase insulin sensitivity. 25 Finally, PPARγ induces adipogenic differentiation in new small adipocytes that are more insulin sensitive and produce lower amount of inflammatory adipokines. PPARγ may directly and indirectly inhibit inflammation altering the level of adiponectin and leptin.26,27 The results of activation of these three receptors, particularly activation of PPAR-α and PPAR-γ, are beneficial in insulin resistance and insulin sensitivity through their interference with adipocyte number and function. 28 Our data showed that all three receptors were overexpressed after adipocyte differentiation in normal cells whereas no difference was found in diabetic cells. Interestingly, PPARα levels in diabetic cells under basal condition resulted overexpressed compared to normal cells. These data are consistent with previous studies supporting that activation of PPARα increased fatty acid oxidation genes and decreased de novo lipogenic enzymes.29,30
In order to investigate cellular inflammatory status, we measured the levels of IL1β, Il-6, and TNFα. Consistently with our observations, numerous studies have shown that the mentioned cytokines induce adipogenesis.26,31–33 In particular, we reported that IL1β level in untreated diabetic cells is overexpressed compared to control cells. To this regard this finding correlates with reduced IRS-1 gene expression only in diabetic cells under our experimental conditions. Indeed, it has been shown that IL1β induces insulin resistance in adipocytes by downregulation of IRS-1. 34 Furthermore, it was reported that decreased expression of IRS-1 inhibits adipogenesis by decreasing CEBPα and PPARγ expression.35,36 Finally, the expression of SIRT1 turned out to be downregulated compared to healthy cells; this finding is consistent with other studies showing that inhibition of this enzyme increases the senescence and decreases proliferation of MSCs losing their adipogenic potential.37,38
In conclusion, our study is the first to show that, in diabetic patient-derived cells, adipose precursors lose their ability to differentiate into mature and functional adipocytes. Thus, diabetic patients may develop insulin resistance through a hypertrophy of existing mature adipocytes due to failure turnover of adipose tissue, forming non-functional adipocytes and leading to secretion of adipokines influencing metabolism and contributing to the onset of metabolic syndrome and type 2 diabetes.
Footnotes
Authors’ contribution
IB, GLV, and LV designed and performed the experiments and critically reviewed the manuscript; FG, GT, FRP, and SB designed the experiments, contributed to data interpretation, and critically reviewed the manuscript.
Acknowledgements
This work was supported by a grant from the University of Catania, Italy (FIR 2014-2016).
Declaration of Conflicting Interests
The author(s) declared no potential conflicts of interest with respect to the research, authorship, and/or publication of this article.