
Abstract
Vitamin A status assessment is not straightforward. Retinol isotope dilution (RID) testing requires time for the tracer dose to mix with the total body stores of vitamin A (TBS). Researchers are interested in shortening the time interval between tracer administration and follow-up blood draws, and in re-examining current assumptions about liver mass for calculation of total liver vitamin A reserves (TLR, in µmol/g liver). Schoolchildren (aged 7–12 years; n = 72) were recruited from one school in Burkina Faso. After a baseline blood draw, 1.0 µmol [14,15]-13C2-retinyl acetate was administered to estimate TBS and TLR by retinol isotope dilution with follow-up blood samples at days 7 and 14. Correlations were determined to evaluate if sampling at day 7 could be used to predict TLR compared with day 14. Liver mass was estimated using body surface area and compared with the currently used assumption of liver weight equivalent to 3% of body weight. (This trial was registered at Pan African Clinical Trial Registry: PACTR201702001947398). Liver mass calculated using body surface area did not differ from the standard assumption of 3% of body weight and yielded similar TLR values. The children in this study had mean TLR (0.67 ± 0.35 µmol/g) in the adequate range, while serum retinol concentrations (0.92 ± 0.33 µmol/L) predicted 25% vitamin A deficiency. TLR values at seven days were highly correlated with, but significantly different from day 14 (P < 0.0001, r = 0.85) and needed a correction factor added to the equation to yield equivalency. Blood drawing at day 7, using correction factors in the prediction equation and the current assumption of liver mass as 3% of body weight, can be used to estimate TLR in schoolchildren with adequate vitamin A status in 13 C2-RID applications, but further investigations are needed to verify the seven-day predictive equation.
Impact statement
Biomarkers of vitamin A status that reflect the gold standard, i.e. liver biopsy, are available but undergoing refinement to increase accessibility in community-based applications. Retinol isotope dilution testing is one such biomarker. Researchers are interested in decreasing the length of time between isotope administration and follow-up blood draws. This study compared a 7-day blood draw with a 14-day sample. With the simple addition of a correction factor to the prediction equation, the values for total body vitamin A stores were similar, but variation increased with increasing liver reserves. The assumption of 3% of body weight as liver weight in school-aged children was also investigated and confirmed as appropriate in the calculation for total liver vitamin A reserves. Simplifying isotope dilution for population evaluation and building capacity for mass spectrometry analyses are important areas of nutrition development to inform public health programs.
Keywords
Introduction
Several indicators are used to assess vitamin A (VA) deficiency, including clinical signs, serum and breast milk retinol concentrations, relative dose response tests, retinol isotope dilution (RID), and direct liver samples. 1 Serum retinol concentration is a common population biomarker of VA deficiency,1,2 but it is homeostatically controlled, negatively affected by inflammation, 3 and may not assess change in VA status in response to interventions. 1 Other than liver biopsy, which is generally inaccessible and not feasible, RID techniques provide the most sensitive and accessible quantitative assessment of total body VA stores (TBS) across a wide range of VA statuses. As currently implemented in the field, however, RID is not satisfactory to all researchers because of the two to three-week mixing period considered essential for the test, during which time illness or consumption of VA could impact the accuracy of the measurements.4–6
The RID technique requires the oral administration of a physiological dose of VA labeled with either a stable or radioactive isotope followed by measurement of the isotopic tracer to unlabeled tracee (endogenous VA) in serum using mass spectrometry after a mixing period of the tracer with TBS. 7 RID techniques respond to VA supplementation 8 and have been used in children and adults to assess VA efficacy;9,10 however, both the field work and analysis are technically demanding, and the necessary two to four blood draws can deter its widespread use. Data in US adults demonstrated that the natural abundance of 13 C was different among individuals but total liver VA reserve (TLR) values derived from pooled baseline values did not differ from individual values, 11 indicating that baseline blood draws may not be necessary in all individuals in evaluation studies where only group VA status is needed to inform existing programs and policies.
Earlier studies and more recent work indicate that TBS might be determined using the serum tracer-to-tracee ratio after shorter periods, in as few as three to five days following administration of the isotope dose.5,12–14 The RID calculations are dependent on absorption, distribution, mixing, and catabolism of the tracer dose using a series of assumptions derived from human and animal studies. 15 During equilibration, various factors change retinol dynamics, such as infection or fever, which affect isotopic enrichment and interfere with accurate TBS determinations. In VA-deficient piglets, mean TLR calculations at 7 and 14 days after isotope administration did not differ. 16 Thus, we tested whether a shorter sampling period (seven days) could be used in children, which might be more practical in field settings.
Once TBS has been estimated, a further pair of assumptions are used to calculate the concentration of VA in the liver, i.e. TLR, which is sometimes considered the biologically relevant marker of VA status. 1 These variables are the proportion of TBS found in the liver, which has been estimated to be 50% in VA-deficient individuals or 80% in VA-sufficient individuals based on work in rats, 17 and an estimate of the mass of the liver. 15 Values for liver mass that have been used are 2.4, 3, and 4% of body weight as liver for adults, children, and infants, respectively. 15 Accurate estimates of liver mass (or volume) in children are vital to the success of liver transplantations;18,19 therefore, literature from the transplantation field could provide a more accurate estimate of liver mass than current assumptions.
The current work in schoolchildren from Burkina Faso: (1) explored the relevance of a decrease to one blood collection from most individuals, easing logistics and increasing compliance; (2) determined the feasibility of decreasing the sample collection interval to 7 days from 14; and (3) applied a validated formula to estimate child liver mass or volume based on measured anthropometric data including weight and height in comparison with the assumption of 3% in all children.
Subjects and methods
Subjects and study design
The study was carried out in a primary school in the Western part of Burkina Faso, in Bama, a village at the outer edge of Bobo Dioulasso. Most inhabitants of the village are middle-income farmers and their families. Informed consent was obtained from eligible children’s parents (n = 72) before participation (Figure 1). The study was approved by the Ethical Review Committee of Center MURAZ and registered at Pan African Clinical Trial Registry (www.pactr.org) database under the unique identification number PACTR201702001947398. Burkina Faso is one of the countries involved in the consortium VITAAFRO (VA in Africa) that is interested in accurately determining VA status to inform existing interventions and policies.
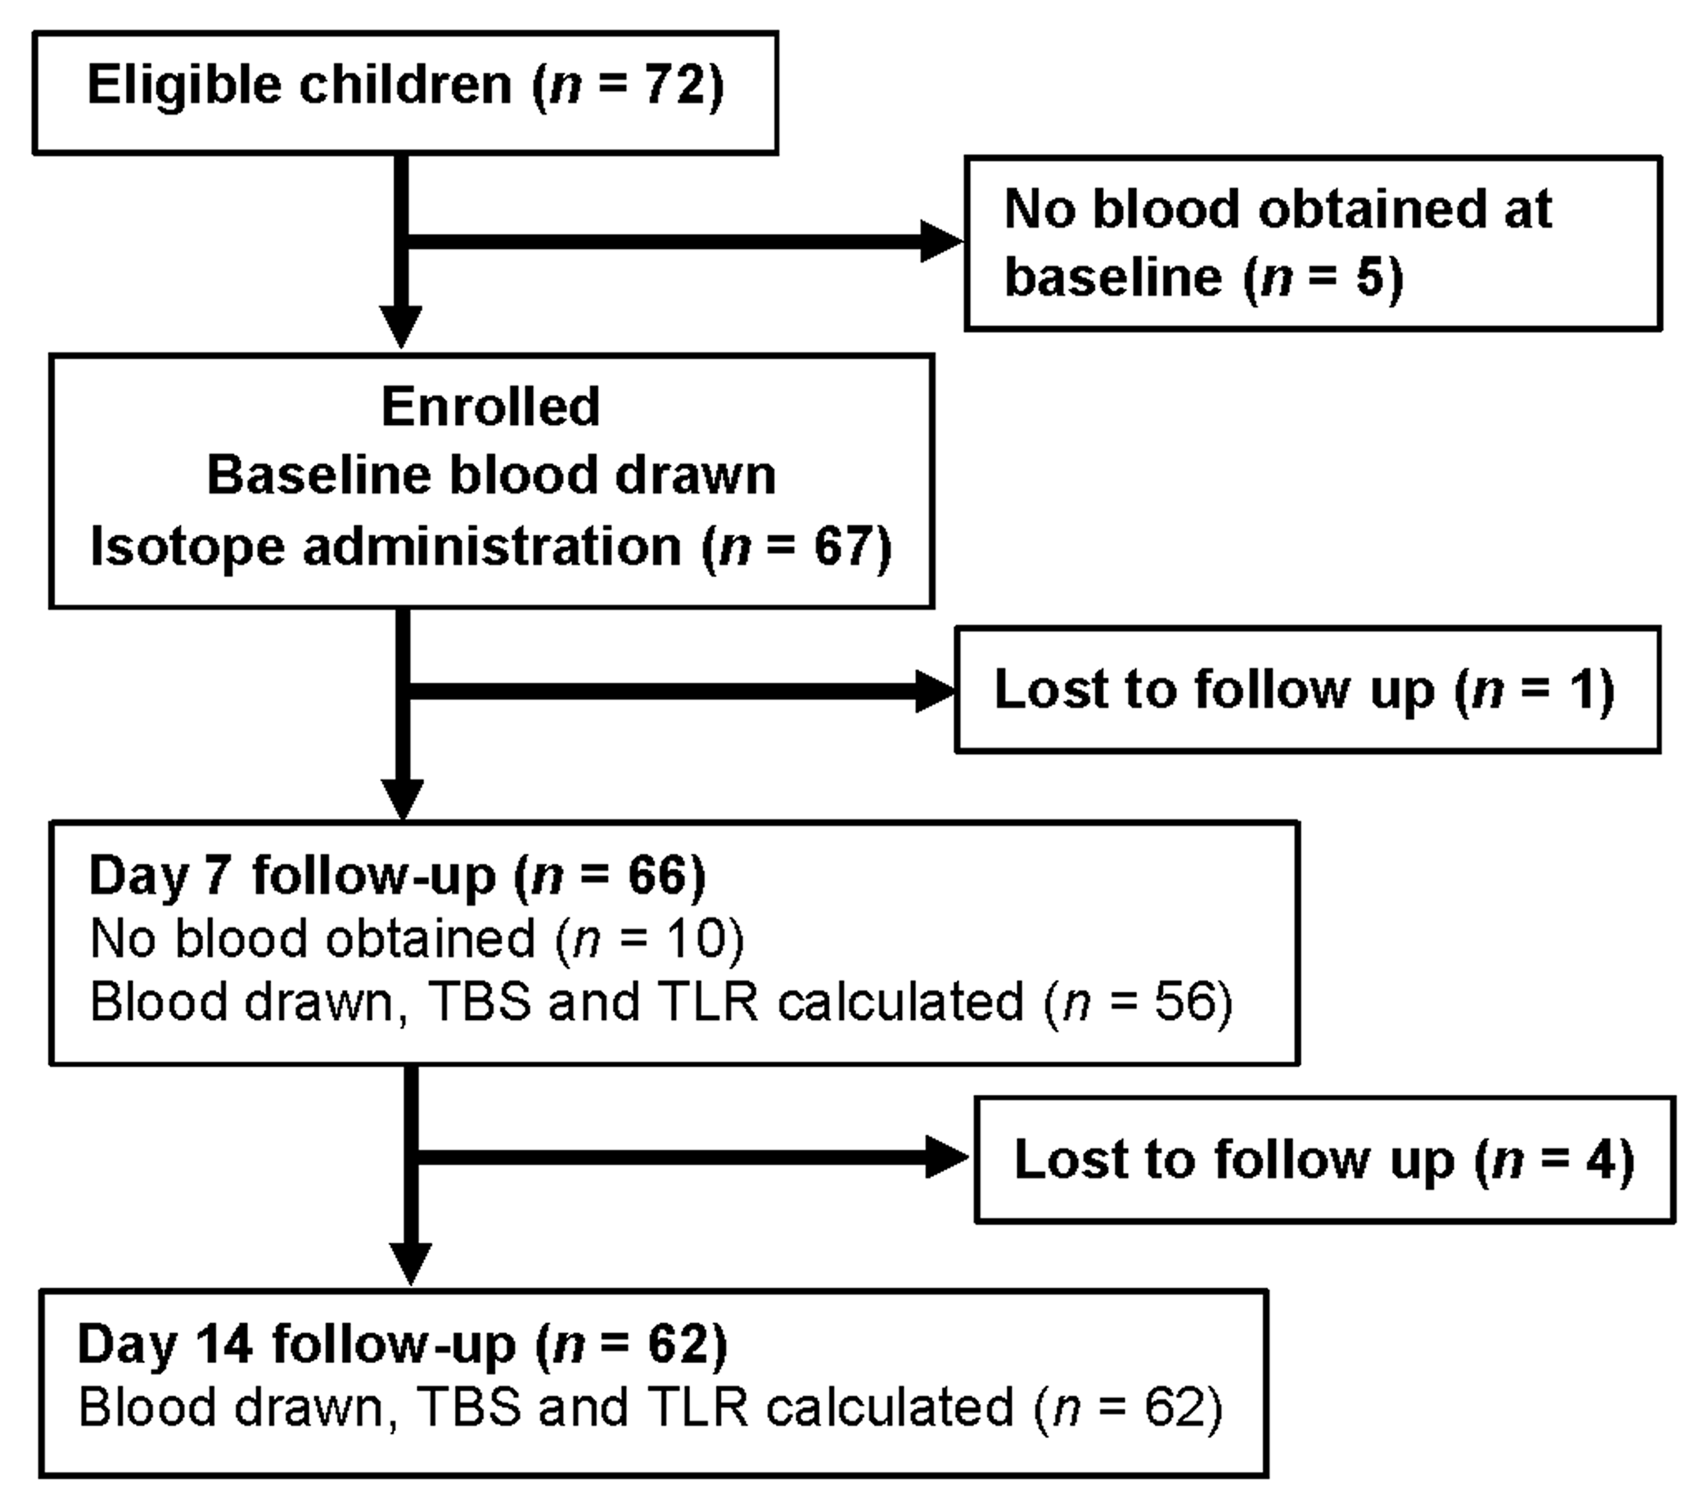
CONSORT flowchart of children who were eligible to participate in a school-based evaluation of vitamin A status in Burkina Faso using retinol isotope dilution. Some of the children did not have a successful blood draw at seven days but did return 14 days after the baseline blood draw. A total of 52 children had both 7- and 14-day blood draws.
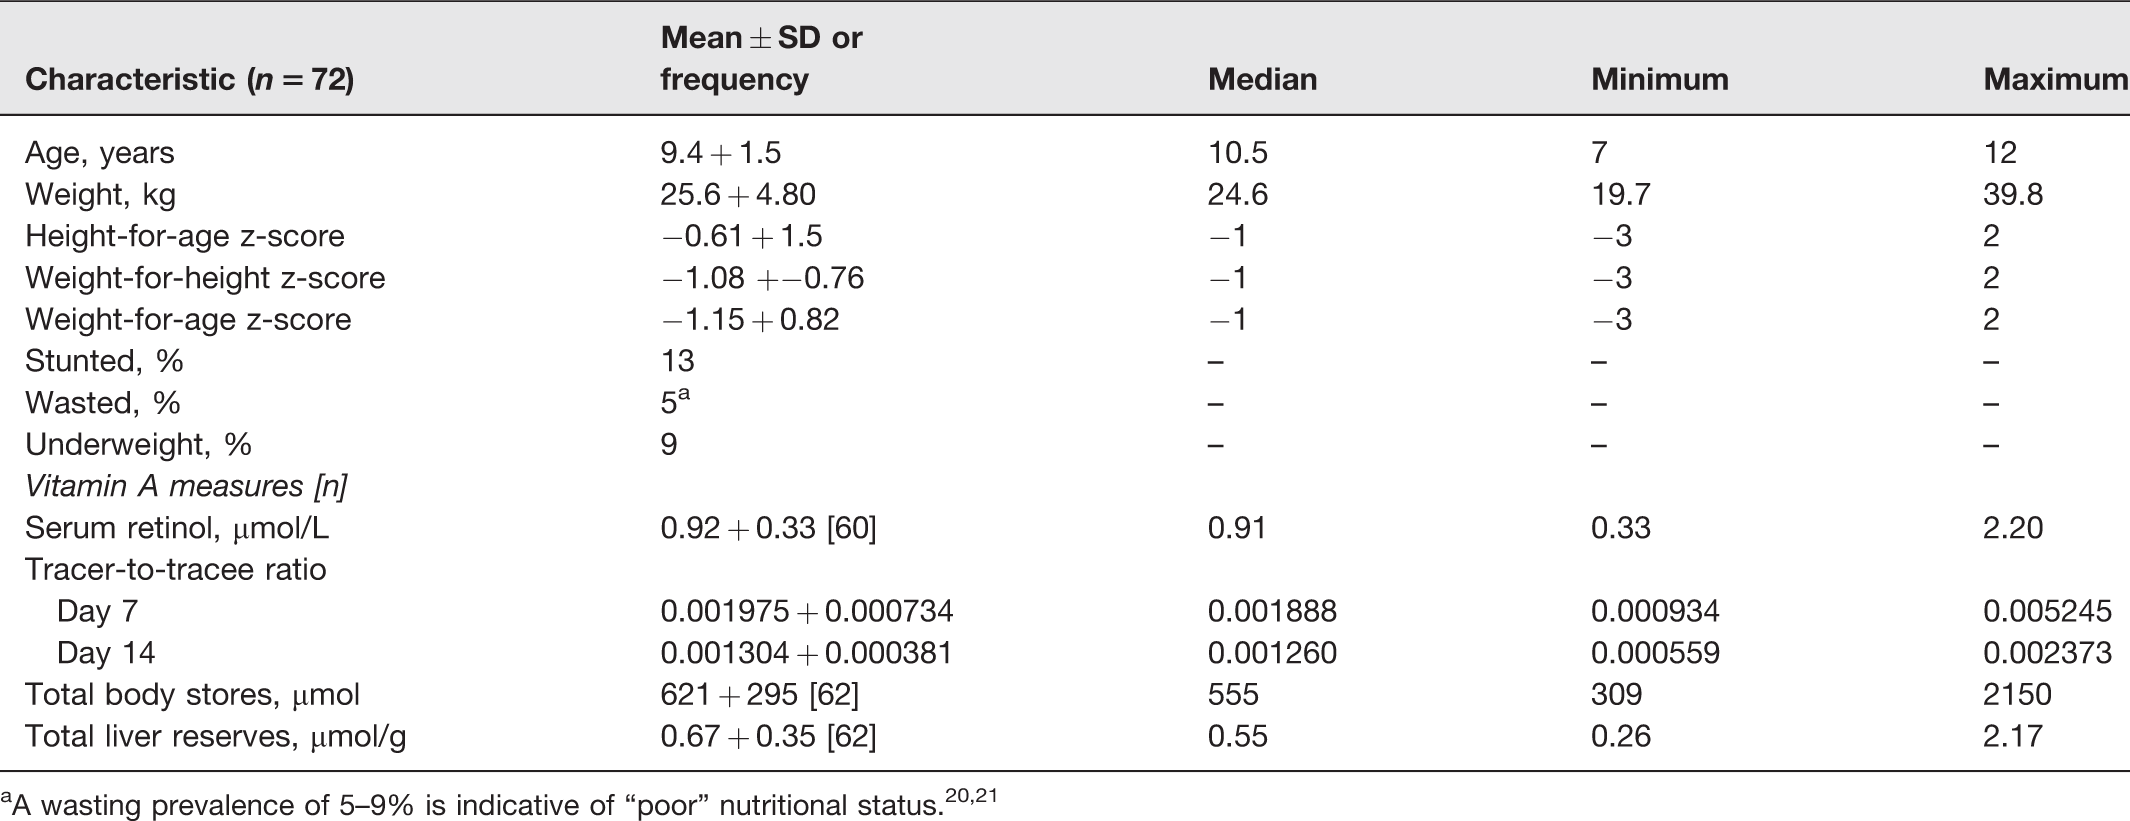
Children were aged 7 to 12 years. Baseline subject characteristics are listed in Table 1. At baseline, a venous blood sample (7 mL) was drawn and each child (n = 67) was given an oral dose of 1.0 µmol [14,15]-13C2-retinyl acetate, which was synthesized as published, 22 dissolved in soybean oil, and administered with a 250 µL positive displacement pipet. The dose was immediately followed by one teaspoon of olive oil to aid absorption of the dose. Children ate a standardized breakfast of white bread with chocolate-flavored hazelnut paste. Blood was further collected by Bama’s clinic nurses on days 1, 7, and 14 after the dose, stored immediately on ice, and transported to the Institut de Recherche en Sciences de la Santé located in Bobo-Dioulasso. [Note: Day 1 samples were not analyzed for the purposes of this paper].
Anthropometric parameters and baseline characteristics of schoolchildren from Burkina Faso who were enrolled in a study to evaluate various parameters of the 13C-retinol isotope dilution test at 14 days after administration of 1.0 µmol 13C2-retinyl acetate.
Sample analysis
Blood samples were protected with aluminum foil to avoid degradation of retinol and centrifuged the same day at 3000 r/min for 10-min with a Universal 320 R centrifuge (Hettich Zentrifugen, D-78532, Tuttlingen, Germany). Serum was transferred to brown Eppendorf tubes (Hamburg, Germany) and stored at −20°C up to two months until shipment to the University of Wisconsin–Madison, USA on dry ice, where they were subsequently stored at −80°C. Samples were analyzed in the VA Assessment Laboratory at University of Wisconsin-Madison by gas chromatography-combustion-isotope ratio mass spectrometry (GC-C-IRMS) as published. 23 Extraction, quantification, and purification of retinol from serum samples (0.7 to 1.2 mL) were performed as previously reported. 9 The GC-C-IRMS software calculates atom percentage in reference to carbon dioxide. A sucrose standard (National Institute of Standards and Technology, 8542) is used for calibration. Both individual values and a random computer-selected subsample of five children were used for natural abundance measurements in the calculation of TLR as done in a prior study of US adults. 11
Estimation of liver mass according to body surface area
We identified in the hepatic transplantation literature a published formula (1) for the estimation of liver volume in 142 autopsied children (ages 1–16 years, body weight 4–93.5 kg, body length 53–193 cm), which was based on body surface area.
19
Body surface area can be estimated using body length or height in cm and body weight in kg
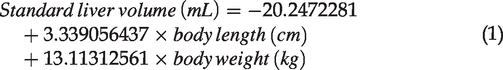
Assuming that 1 mL liver weighs approximately 1 g (because most soft tissue is primarily water), liver weights were calculated for the children in the study using the standard RID value of 3% of bodyweight 15 and the above formula for comparison.
Comparison of total body stores and liver reserves at 7 and 14 days
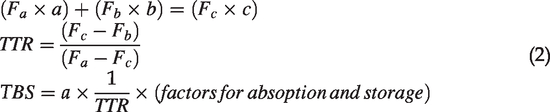
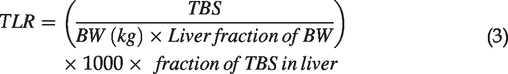
TBS (µmol) were calculated as published
8
with the mass balance equation that includes the tracer-to-tracee ratio (TTR) and factors for absorption and storage (2)
Statistical evaluation
Statistical analysis was performed with GraphPad Prism 7 Software (San Diego, CA). Normality was assessed by Shapiro–Wilks test. The percent of body weight as liver by the Herden et al. formula 19 was compared with the standard value of 3% by one-sample Student’s t test. Calculated TLR values were compared between liver weight formulae; between subsampled natural abundance and individual natural abundance; and between time points by Wilcoxon matched-pairs ranked sign test and Mann–Whitney test as noted due to non-normality (Shapiro–Wilks P < 0.001); correlation between TLR at both time points was also analyzed by linear regression, from which a predictive equation at day 7 was determined from the assumed “true” TLR at day 14 based on the value calculated. The distribution of residuals was normal, which was analyzed using the built-in test for homoscedasticity function of Prism 7. 26
Results
Study participants and VA status
From the 67 subjects who were enrolled and received the isotopically enriched dose, 98.5% and 94% were available for follow-up at days 7 and 14, respectively (Figure 1). Not all blood draws were successful in these children at day 7. The children had poor nutritional status, which was reflected in 5% of them being wasted. 21 On the other hand, the VA status of this cohort of schoolchildren was adequate with values of 619 ± 299 µmol and 0.67 ± 0.35 µmol/g liver for TBS and TLR, respectively (Table 1). No children had deficiency, defined as ≤0.1 µmol VA/g liver, 1 even when we assumed 50% of TBS in the liver (data not shown). At baseline, the mean serum retinol concentration was 0.92 ± 0.33 µmol/L (Table 1) and 25% of this cohort had values ≤0.7 µmol/L, a common cutoff used for VA deficiency. 2
Comparison of pooled baseline with individual data
In order to test the influence of subsampled natural abundance values of 13 C on TLR calculations, five baseline samples were randomly computer-chosen from the sample set. Their mean natural abundance (1.07440% of total C as 13 C, 0.21% CV) was used to calculate TLR in addition to the standard method using each individual’s baseline samples for their own follow-up (1.0758%, 0.14% CV). While the TLR values differed between subsample-baseline and individual-baseline for each subject (Wilcoxon matched-pairs signed rank test P ≤ 0.01), they did not differ when the entire group’s TLR means were compared (Mann–Whitney test P > 0.5; Table 2).
The comparison of total liver vitamin A reserves (TLR) in schoolchildren from Burkina Faso using either each subject’s paired baseline measure of natural abundance and follow-up at 7 (n = 56) or 14 (n = 62) days after the isotope dose in the same child or using a random computer-selected subsample of 5 children as a mean baseline for natural abundance with each subject’s follow-up at 7 or 14 days.
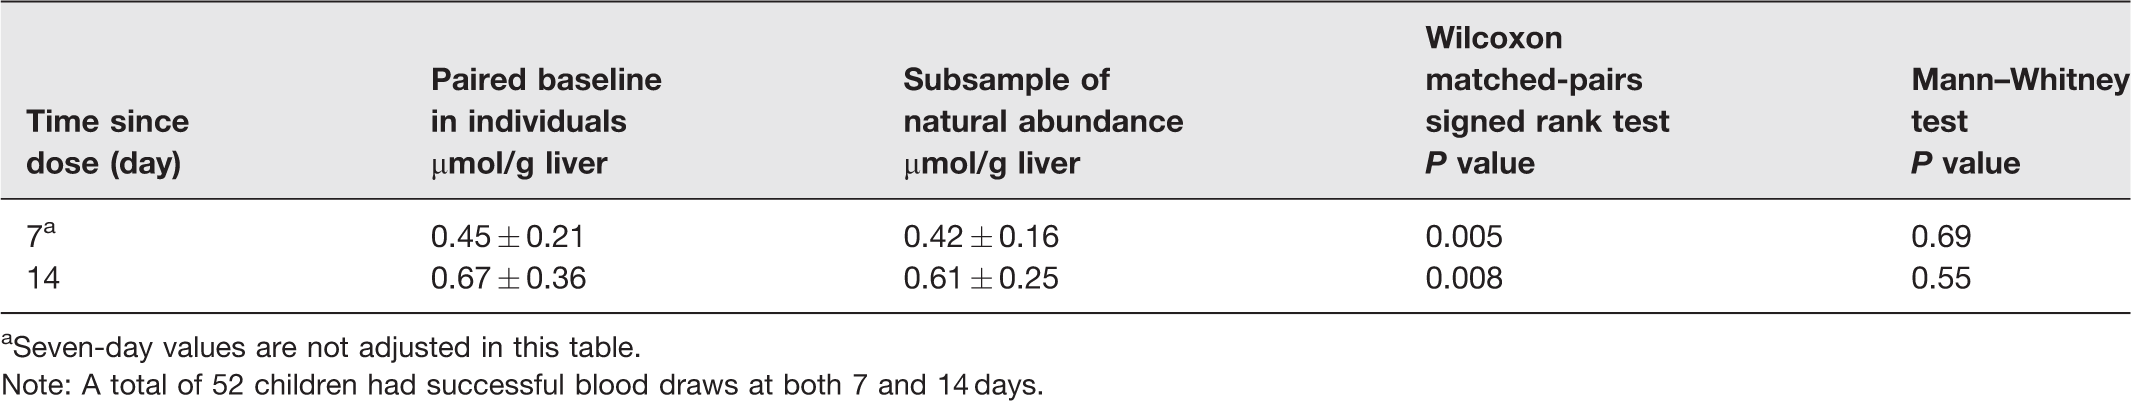
aSeven-day values are not adjusted in this table.
Note: A total of 52 children had successful blood draws at both 7 and 14 days.
Comparison of TLR using different estimations for liver mass
Liver masses were calculated using the standard 3% of body weight as liver or the formula described by Herden et al. 19 The mean liver mass using this formula predicted liver masses equivalent to 2.97 ± 0.21% of body weight for all 70 children with known body weight and height, which was not significantly different from 3%. Mean calculated TLR at day 14 (n = 62) using this formula or 3% of body weight were 0.66 ± 0.35 and 0.67 ± 0.35 µmol/g liver, respectively, which were not different by Wilcoxon matched-pairs signed rank test.
Comparison of estimated TBS and TLR between time points
Paired (n = 52) 7-day and 14-day TBS (418 ± 174 and 635 ± 322 µmol VA, respectively) and TLR (0.45 ± 0.20 and 0.68 ± 0.38 µmol VA/g liver) were significantly different by Wilcoxon matched-pairs signed rank test using standard calculations without adjustment (P < 0.0001). Nonetheless, TLR values were significantly correlated between the two time points (r = 0.85, P < 0.0001; Figure 2), which indicated that 7-day values could be used to predict 14-day values according to the inverted linear regression formula (4)

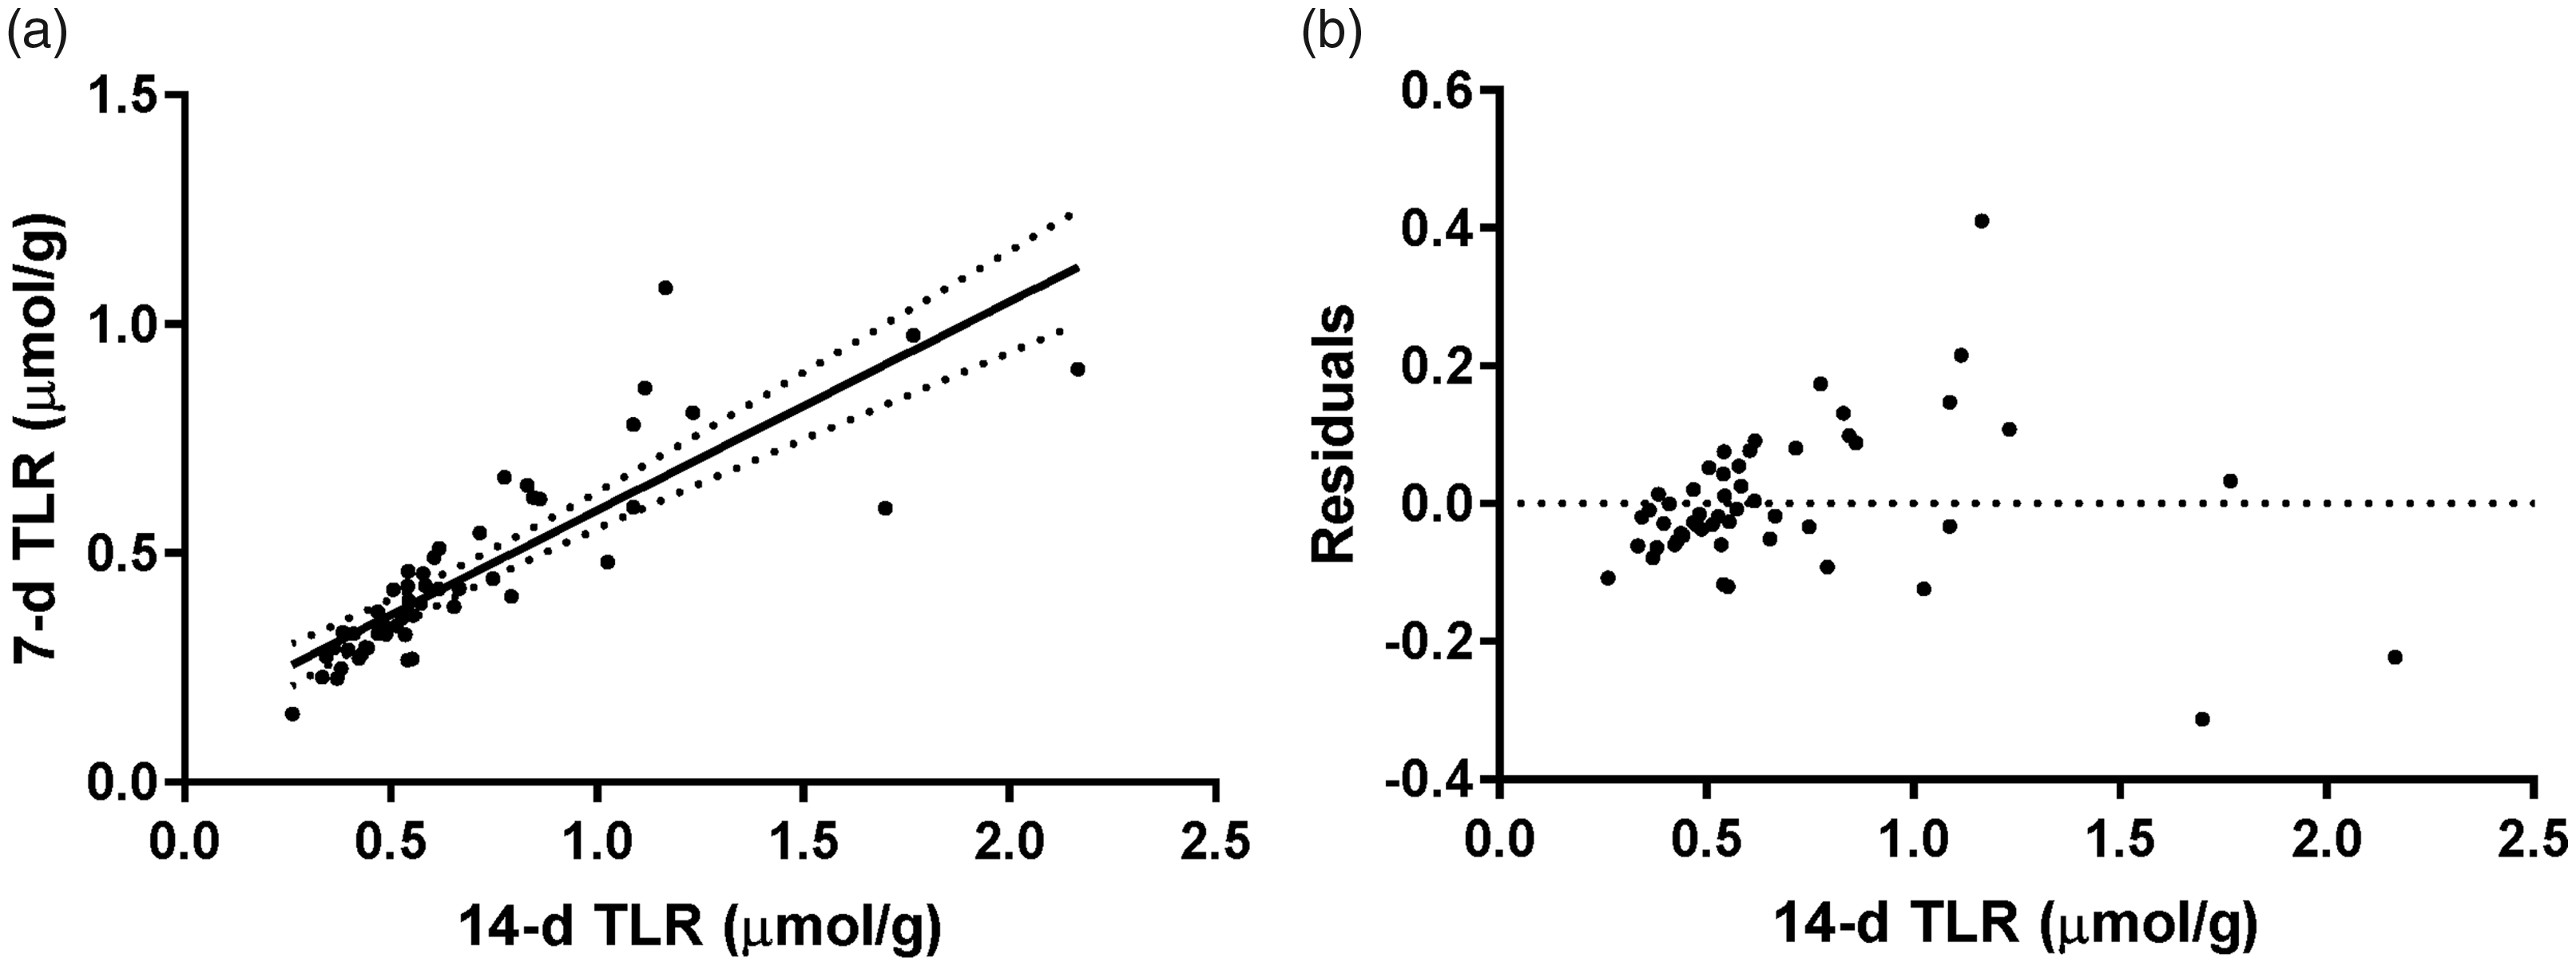
(a) Linear regression and 95% confidence intervals of total liver vitamin A reserve (TLR) values at 7 and 14 days determined by retinol isotope dilution (n = 52). The slope and y-intercept of the regression were 0.456 (95% CI: 0.374–0.537) and 0.138 (95% CI: 0.0744–0.201). For TBS (data not shown), the slope and y-intercept of the regression of 14-day against 7-day TBS were 0.470 (95% CI: 0.393–0.545) and 120 (95% CI: 66.3–174), respectively. (b) Residuals of the linear regression of 7 and 14 day TLR. The residuals clearly increase as TLR increases (test for homoscedasticity P < 0.0001), 26 which was not fully accounted for by analyzing the ratio of the residual to the 14-day TLR instead of the absolute difference (test for homoscedasticity P < 0.05, data not shown).
Discussion
Researchers using RID lack standardized methods with regard to isotopes, dose size, blood sample timing, and TBS calculations. This limits comparison of RID results across studies. 15 This study investigated several parameters in regard to the RID technique in schoolchildren in Burkina Faso including blood draw timing, liver volume estimates, and using a randomly selected baseline value for natural enrichment. It is essential to understand appropriate dose levels, sample volumes needed, and the instrument that will ultimately analyze the samples being collected because analytical sensitivity and mass requirements differ among instruments.7,15,27 The method reported here uses a relatively low dose size (i.e. 1.0 µmol) but a large serum volume (0.4–0.7 mL current requirement) for analysis. Various types of mass spectrometers are used to measure isotope enrichment. Among them, GC-C-IRMS is exclusively used for 13 C/12C determination through the combustion of retinol and analysis of the resulting 13 CO2/12CO2 mass ratio, which enhances sensitivity because only three masses are analyzed, i.e. 44, 45, and 46. This technique requires a baseline blood sample from at least a subsample of study participants to determine 13 C-natural abundance in serum retinol and a blood sample after dosing to determine the enrichment of 13 C in serum retinol due to tracer response.
If only a group mean is desired, a baseline blood does not need to be drawn from all children, which is likely the case for most future applications of the RID test for population evaluations. While individual values differed, the group means did not differ when a randomly selected subsample was used. It is well-documented that field settings are sometimes challenging in regard to blood draws and community reaction can negatively influence study results. 28 In this regard, interventions in Thai 29 and Ghanaian 30 children chose to use a non-intervened group baseline to lower the number of blood draws per child. One sample reduces the risks due to blood drawing in evaluations, such as bruising at the site of the puncture. The higher number of blood draws (n = 4) that were originally suggested by members of the VA Tracer Task Force 31 was often the reason for withdrawal or not enrolling in studies in Burkina Faso. Clinical trials that involve blood draws are often more challenging in low- and middle-income countries because of impoverishment, social inequity, and cultural beliefs that create mistrust in research settings.28,32 Community engagement during recruitment, building capacity, and designing studies that are ethical and relevant to current needs of vulnerable groups may improve equity and desired outcomes.28,32
While unadjusted day 7 TLR was approximately 67% of day 14 TLR estimates, the values were strongly correlated and a simple correction equation was able to compensate for this difference. It must be noted that these children were VA adequate. This relationship may differ in children who are VA deficient because complete mixing may occur by seven days due to the smaller body VA pool. A correction factor was not needed in VA-deficient piglets between 7 and 14 days. 16 While a seven-day draw could assess the TLR during VA program evaluation, the underlying VA status might affect the early calculations because of incomplete mixing of the dose with the body pool. Modification of the method to evaluate RID in blood samples seven days after dosing has the potential to quantitatively assess TBS in a shorter timeframe and because of less catabolic loss of the labeled retinol, it may reduce sample volumes needed for analysis on some mass spectrometers. 10
We chose a seven-day mixing period instead of earlier times because of incomplete mixing of the tracer in VA-adequate rats with the 13 C-RID test suggesting that four days were not sufficient for all VA statuses. 17 More recent data in rats suggest that there is more variability in the serum to liver ratio at five days among individual rats than at 10 and 15 days (unpublished observations). It is clear in this study that as the estimated TLR became high (>0.7 µmol/g) and hypervitaminotic (≥1.0 µmol/g), 1 more variability occurred in the data. These cutoffs were originally defined in 1990 as excessive and toxic, 33 but lack of evidence of adverse effects at these concentrations led some experts to define the cutoffs as high and hypervitaminotic. 1 Adverse effects have been noted in liver reserves of ∼3 µmol/g in humans, 34 which should be considered toxic.
Due to differences in VA status, we must reiterate that a single correction for early sampling may not suffice for all individuals. If one expects a large prevalence of hypervitaminosis A in the studied cohort, such as children reported in South Africa 8 and Zambia, 9 the longer sampling time frame of 14 days is probably more appropriate for mixing with pools of VA that take more time for turnover. A study carried out in China with deuterium-labeled VA, showed that percentage enrichment at three days could be used to evaluate TBS in humans with appropriate changes to the equation. 12 The three-day enrichment data correlated with 21-day enrichment data, and therefore a predictive equation was derived so that the three-day data could be used to predict enrichment at pseudo-equilibration. 12 It may be necessary to always have a subset of individuals sampled at a longer time to derive the correction equation. In prior applications evaluating early sampling times, as few as 34 Chinese children 12 and 15 Guatemalan adults 13 were used to derive equations at three days.
Compartmental mathematical modeling using theoretical or real data has been used to analyze the effect of changes to the RID, including reductions of the mixing period to four 5 or seven days, 35 and the use of composite “super-child” models to describe population VA kinetics with a smaller number of blood draws per subject than is required in a normal kinetic model. 36 Previous modeling work using partially simulated data suggested that the CV of the composite factor S × Fa (where S is the ratio of tracer enrichment in serum to that in liver and Fa is the factor for absorption, storage, and catabolism of the dose) was lowest at day 4 or 5 (15%), which led the authors to propose that this was the ideal sampling time for both population and mean TLR values, verified by comparing model-derived TBS values with RID-calculated values using model-derived factors. 5 Research in U.S. women, however, indicated that models using short sampling periods tend to overestimate the rate of catabolism of VA and exclude a slower-turning over pool of VA from the models, leading to inaccuracies that cannot be detected by comparing a model against factors derived from that model. 37 Studies that have included the slower-turning-over pool and fixing the rate of catabolism35,36 have resulted in the updating of the four to five days RID recommendation to seven days. 35
Modern transplantation research-derived predictive equations for liver mass based on body weight and height 19 were in agreement with the currently applied liver mass as 3% of body weight in this cohort of children. Another formula from the transplantation field, 38 based on 60 pediatric subjects (body surface area ≤1.0), predicted a lower % of body weight as liver mass (2.82 ± 0.13%). This is due to the inclusion of a “pediatric factor” of −38 g when body surface area is <1; removal of this factor brought predictions to 2.93 ± 0.19%, which is in line with the pediatric-focused Herden et al. equation. 19 This is encouraging because of the prior use of 3% in the RID literature, and therefore correction of published work is not necessary when comparing across studies. 15 Future studies in infant cohorts should confirm the use of 4–4.2% as a valid prediction of liver mass in children less than one year old using the infant liver volume prediction equation reported in the same article. 19
Challenges in using RID techniques include the expense, technical expertise, and infrastructure required to successfully operate mass spectrometry equipment. 39 The method is complicated because samples need to be transported to distant laboratories under constant frozen conditions. However, this is no different than the handling required for serum retinol concentrations by HPLC. 1 Stable retinol isotope tracers are safe, non-radioactive tools to follow VA metabolism because the absorption and kinetics of the tracer are similar to the tracee. 27 RID techniques have been used in generally healthy children and adults to assess the VA efficacy of food-based interventions in a variety of settings. 15 Tracer absorption, metabolism, and serum to liver difference in light of unique study designs need to be considered. 15 Host characteristics, such as concurrent infection or other nutrient deficiencies may reduce isotope absorption; 4 thus, excluding subjects with fever is recommended until further research is done with inflammatory biomarkers. Evaluating other concurrent deficiencies combined with early blood sampling may be recommended. 10
This study provided data that the percent enrichment at seven days to evaluate TBS in schoolchildren with adequate VA status may be used instead of a 14-day waiting period with an appropriate correction factor. This may ease problems related to field settings and reduce costs associated with timing. Future investigations will be needed to verify if the seven-day predictive equation can be used in children who are affected by VA deficiency or hypervitaminosis A, and in other groups of children and adults at different age ranges and with varying dietary VA intakes. Both the early and 14-day blood samples would be needed from the same children with VA deficiency after administration of the labeled tracer to test the appropriate correlation.
Footnotes
Authors’ contributions
JFB, prepared the first draft and analyzed samples. ANZ, JBO, and SAT, conceptualized the study. NDC assisted in the field site logistics. JS interpreted data, performed calculations, and prepared figures. CRD trained JFB on the GC-C-IRMS methodology, compiled data, and assisted in manuscript preparation. IHNB, NB, and SAT offered supervision. SAT designed the parameters to test, revised the paper, and had primary responsibility for final content. All authors read and approved the final manuscript.
DECLARATION OF CONFLICTING INTERESTS
The author(s) declared no potential conflicts of interest with respect to the research, authorship, and/or publication of this article.
FUNDING
The author(s) disclosed receipt of the following financial support for the research, authorship, and/or publication of this article: Support was provided by the International Atomic Energy Agency for the isotopes and Global Health funds at University of Wisconsin-Madison during sample analysis and manuscript preparation.