
Abstract
Chondrocyte viability is a crucial factor for evaluating cartilage health. Most prevalent cell viability assays rely on dyes and are not applicable for in vivo or longitudinal studies. Here we demonstrated that the two-photon excited autofluorescence and second harmonic generation microscopy provided high-resolution imaging of cartilage tissue and distinguished live/dead chondrocytes by visual assessment. Furthermore, the normalized autofluorescence ratio was proposed as a quantitative indicator to determine chondrocyte viability. Based on the indicator, a curve fitting and simulated receiver operating characteristic method was proposed to identify the live/dead cell populations as well as the indicator threshold without dye labeling. Thus, it established the label-free imaging method for chondrocyte viability assay in cartilage tissue.
Impact statement
Chondrocytes are the only cellular component found in the cartilage, playing a critical role in maintaining the homeostasis of articular cartilage. The viability of chondrocytes is a crucial factor for evaluating cartilage health. However, the current prevalent cell viability assays rely on dye staining and thereby are not applicable in vivo or in longitudinal assessments. In this study, we demonstrate that the intrinsic signals such as two-photon excited autofluorescence and second harmonic generation can be used to classify live and dead chondrocytes in cartilage tissue. A quantitative measure is also proposed allowing development of automated assessment algorithms. The nonlabeling nature of this method suggests the potential applicability to nondestructive and in vivo assessment of cartilage health.
Keywords
Introduction
Articular cartilage is a soft tissue covering the ends of bones that creates a smooth surface and lubricates the movement of joints by absorbing impacts and distributing loads. This function is facilitated by the cartilage extracellular matrix (ECM), a molecular framework rising from three classes of macromolecules: collagens (predominantly type II collagen), proteoglycans (mainly aggrecan), and a variety of non-collagenous proteins. 1 Being the only cellular component found in the cartilage, chondrocytes are responsible for maintaining the aforementioned macromolecule synthesis as well as homeostasis. As such, the viability of chondrocytes is of great concern in assessing the health status of cartilage during repair and preventative treatment. For example, chondrocyte death is a central feature for osteoarthritis (OA), a cartilage degeneration disease that affects over 30.8 million people in the U.S. 2 No proven disease-modifying treatments for OA are currently available. As a significant portion of OA cases among young adults are related to joint trauma, an interesting area in OA research encompasses interventions to delay or avoid the progression of post-traumatic osteoarthritis (PTOA).3–5 In these studies, chondrocyte viability has been a primary factor to assess the progression stage and treatment effectiveness. Chondrocyte viability is also a primary interest in assessing the quality of osteochondral allografts6,7 used in the treatment of large cartilage defects, which are often seen in young patients. In general, chondrocyte viability could be an important indicator in assessing cartilage health in vivo though clinical measurement has yet to be possible. One of the fundamental hurdles for performing in vivo chondrocyte viability assessment is the lack of methods that forgo exogenous dyes for labeling.8–12 Besides their cytotoxicity that may disrupt cell functions, dyes are not suitable for labeling tissues because of the poor penetration depth and difficulties with in situ applications. Moreover, dye-labeled cartilage samples cannot be reused in further studies or transplantation.
It has long been known that autofluorescence from intracellular fluorescent coenzymes, such as reduced pyridine nucleotides (NADH and NADPH; hereafter NAD(P)H) and oxidized flavoproteins (FPs), can be used as a non-labeling tool to study metabolic states of cells.13–15 Viable and dead cells present different cellular energy metabolism and NAD(P)H are primary electron transporters in oxidative phosphorylation for ATP production. Decreased autofluorescence or concentration levels of NAD(P)H have been reported as indicators for cell injury and death. 16 Some other studies suggested that the overall level of autofluorescence was decreased among dead cells.17,18 In contrast, studies also suggested that the overall autofluorescence levels of dead cells were increased due to the significant contribution of the increased autofluorescence level of FPs.19,20 The rather contradictive results might be due to different cell types or cell death stages. Nevertheless, all these studies have suggested that autofluorescence of NAD(P)H and FPs likely provides useful information to assess cell viability, though different cellular systems may need to use different criterions for cell classification. To the best of our knowledge, no studies have been performed to demonstrate the use of autofluorescence for assessing the chondrocyte viability in articular cartilage. The objective of our study, which we report herein, is twofold: (1) to determine the feasibility of using the autofluorescence to assess the chondrocyte viability and (2) to find reliable quantitative measures that can be applied to further studies or applications.
To determine the feasibility of using autofluorescence for the chondrocyte viability assessment, we performed two-photon excitation fluorescence (TPF) and second harmonic generation (SHG) imaging studies on cartilage of freshly harvested rat tibias. The dual imaging channels of the two-photon microscope allowed us to simultaneously collect two-photon excitation autofluorescence (TPAF) from NAD(P)H and FPs. SHG images were also acquired to depict the collagen structure and cell edges in the ECM. The acquired images were merged to form pseudo-colored images with red, green, and blue channels assigned to signals from FPs, NAD(P)H, and collagen, respectively. These pseudo-colored images were evaluated visually for the classification of live and dead chondrocytes according to their appearances. To validate the label-free imaging method, on the same cartilage samples we subsequently labeled cells with Calcein-AM and Ethidium homodimer-1 (EthD-1), which are commonly used dyes for classification of live and dead cells. Results showed that the visual assessment was a reliable method to discriminate live and dead cells. Methods of quantitative analysis are necessary for developing automated assessment for applications. We proposed to use the normalized autofluorescence ratio (NAR) as an objective quantitative measure for cell classification. The NAR describes how the NAD(P)H signal contributes to the overall TPAF signal. Viable and dead chondrocytes showed distinct populations with respect to the NAR value. To calculate the objective measure of NAR out of the relative detection from microscopes, we suggested a standard dye solution to characterize this factor so that it would be possible to compare results acquired from different microscopes.
Materials and methods
Cartilage preparation
Male Sprague-Dawley rats (n = 4; male; approved by the MUSC Institutional Animal Care and Use Committee) were used in this study. Whole tibias with intact condyles were harvested immediately from animals after euthanasia. With the cartilage on the tibial plateau exposed and facing down, the sample was held stable with a customized clamp holder in a glass bottom Petri dish filled with Dulbecco’s Phosphate-buffered saline (DPBS, Corning Inc., New York, US).
Two-photon excited autofluorescence and second harmonic generation imaging
The prepared samples were imaged with a commercial multiphoton optical microscope (FV1200 inverted, Olympus Corporation, Tokyo, Japan) equipped with a Ti:Sapphire ultrafast laser (MaiTai Deepsee, Newport) and two GaAsP photomultiplier tubes (PMTs) for recording two imaging channels simultaneously. In the two-photon excited autofluorescence imaging, the laser was tuned to 740 nm to excite endogenous fluorophores NAD(P)H and FPs simultaneously. 15 The collected fluorescence was first separated by a dichroic mirror and then passed through two bandpass filters (violet: 420–460 nm; red: 575–630 nm) to select the autofluorescence from NAD(P)H and FPs, respectively. In the SHG imaging, the laser was tuned to 860 nm and images were collected from the violet channel only.
The microscope settings, unless specified otherwise, were kept the same when acquiring all autofluorescence images throughout this study except for the laser power, which was adjustable to maintain the image contrast. The reason for doing so was to standardize the imaging protocol so that we could compare images acquired from different cartilage samples. For every specimen, the three-dimensional (3D) fluorescence images and SHG images were acquired one after another on the same volume defined by the z-stack imaging mode. The imaging settings are summarized as follows.
The voltage of both PMTs was set at 650 V, while the digital gain and the offset of preamps were set at 1.0 and 0, respectively. A 30×
Visual classification with pseudo color images acquired from the TPAF and SHG imaging
As shown in Figure 1, the acquired TPAF (two channels) and SHG image stacks of a sample were merged to a single RGB-colored image stack (Red fluorescence channel (R), Violet fluorescence channel (G), and SHG channel (B)) in ImageJ (Fiji). During this image merging process, the raw images did not go through any image processing or enhancement. To validate the TPAF/SHG imaging assay for chondrocyte classification, we performed TPAF/SHG imaging on the freshly excised tibia condyles followed by dye labeling and two-photon fluorescence imaging. Observing the image stacks acquired from the same tissue area with both methods, a database of analyzed cells was established to include every cell appeared in both image stacks. As such, the database excluded cells that were not presented in either image stack due to either dye labeling deficiency or sample shift when switching imaging mode. A unique number was given to identify each cell in the database from both methods. To avoid bias in observers’ assessment, two methods were performed separately and blinded from the assessment results of each other. The result from the dye labeling established the gold standard to validate the TPAF/SHG assay.
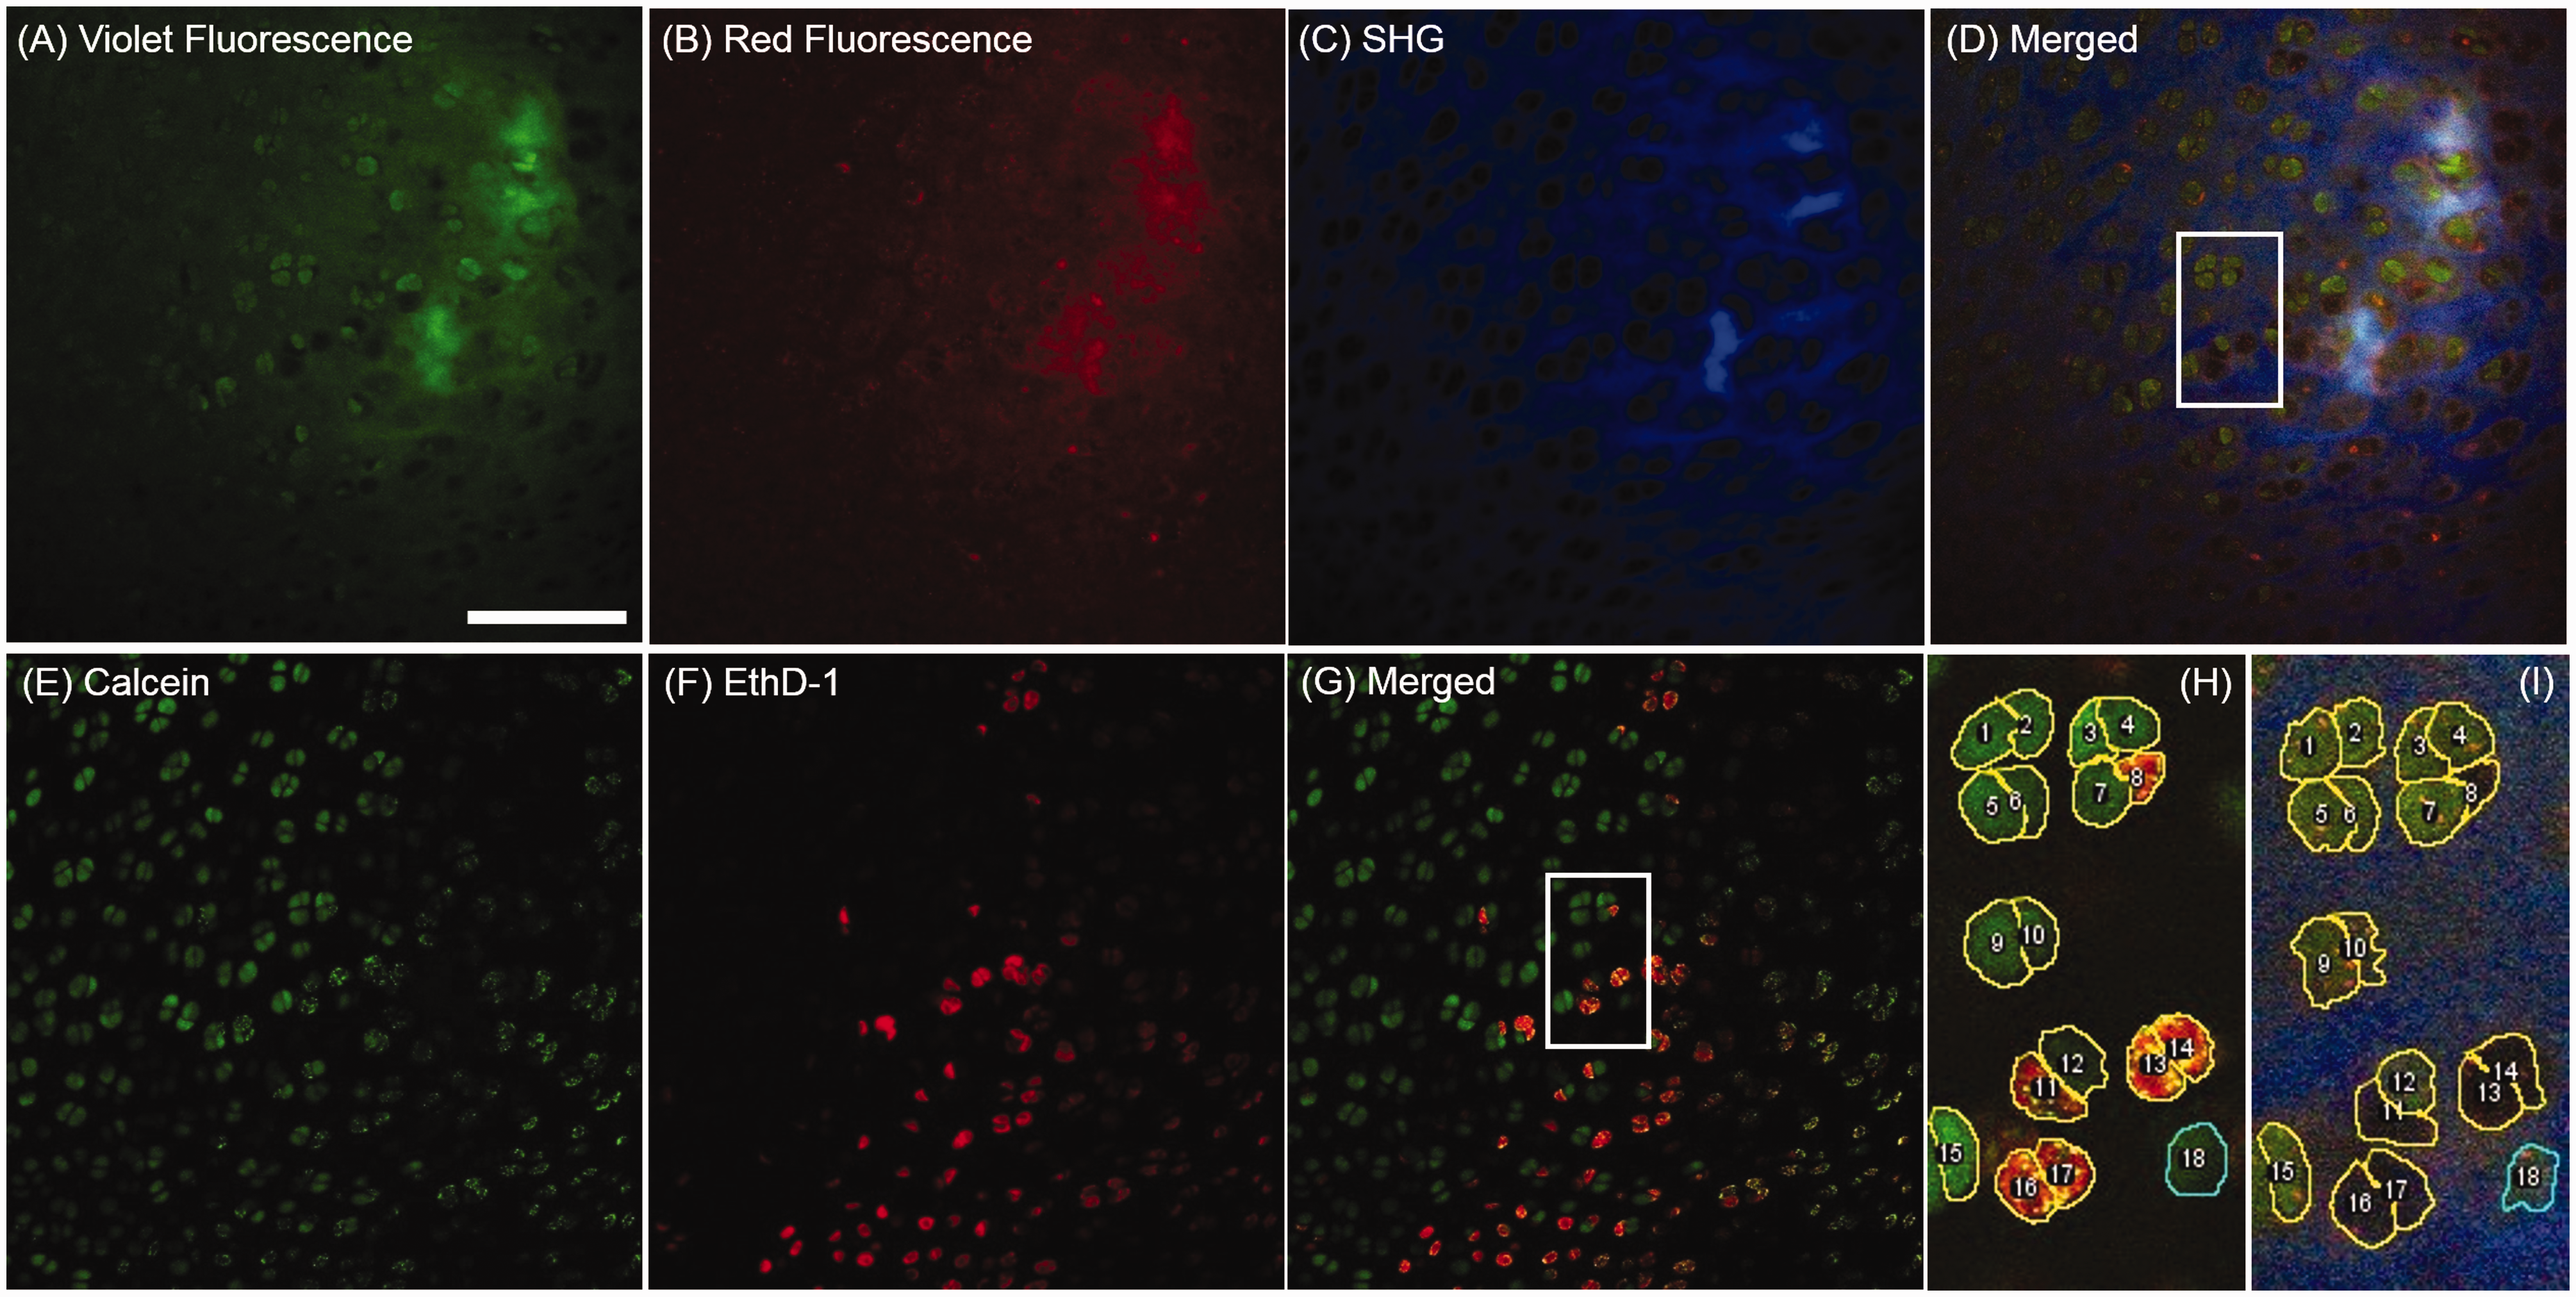
Cell-specific comparison of TPAF/SHG imaging (a–d) and Calcein-AM & EthD-1 dye-labeling (e–g) for chondrocyte viability assay. Zoomed images (h) and (i) illustrated the procedures to identify the same cell from the two imaging methods by the same ROI-sequence. Their viability was assessed visually. Scale bar: 100
Determination of chondrocyte viability with in situ dye staining and two-photon fluorescence imaging
Once the TPAF/SHG imaging was completed, cartilage samples were left on the microscope stage avoiding any movement for in situ dye labeling. Calcein-AM and EthD-1 (Thermo Fisher Scientific, Waltham, Massachusetts, U.S.) were used to label live and dead chondrocytes in cartilage samples, respectively. Specifically, dye mixture working solution of EthD-1 (8 μM) and Calcein-AM (2 μM) in DPBS was gently added to the sample Petri dish and incubated with samples at room temperature (25°C). After 20 min of incubation, the laser was tuned to 800 nm to excite both EthD-1 and Calcein via two-photon absorption. The dye solution was not removed to avoid sample movement. The fluorescence of the two dyes was separated by a filter set to two channels: green (495–540 nm) and red (575–630 nm) channels, which imaged Calcein-AM and EthD-1 labeled chondrocytes, respectively. By performing the above procedures, we recorded TPAF/SHG and dye staining images of each individual cell under assessment. The cell classification with the dye-labeled images was performed independently by observers who were blinded from the results of the TPAF/SHG imaging experiments; therefore, allowing cell-specific comparison of the viability assessment.
Quantitative measures for determination of chondrocyte viability
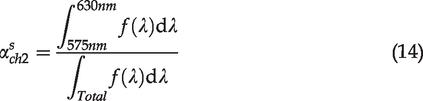
In the TPAF/SHG imaging method for chondrocyte viability analysis, the merged multichannel color images were used to perform visual classification of chondrocytes. This method is not suitable for the computer-based automated analysis, for which quantitative measures have to be used. Examining the TPAF/SHG based cell classification, we found that the relative image intensity between the NAD(P)H (violet) and FPs (red) channels was the most essential parameter to determine the color and brightness of images for the visual classification. As such, we simply define the normalized grayscale-value ratio (NGR) based on the pixel intensity in images as follows
However, this ratio does not consider the fact that different imaging conditions may result in different image contrasts. For example, adjusting the gain of PMT can modify image contrasts (Figure S1). To characterize the factor associated with the imaging condition, we propose the normalized autofluorescence ratio (NAR) shown below
In the TPF microscopy, the fluorescence is generated in the focal volume that is defined by the point spread function (PSF) of the microscope. The fluorescence power can be expressed as
21
For the dual channel TPAF imaging, the emissions from both fluorophores are excited simultaneously by the laser beam at the focus. The fluorescence then passed through exactly the same collection optics until they reach the dichroic mirror, which separated them to two detection channels. For each detection channel, the emission passes a band-pass filter and reaches a photon sensor (PMT), which converts photons to voltage signals. An amplifier is used to boost the signal levels. The analog-to-digital converter (ADC) ultimately digitizes the signal to a number (in our case, a positive integer between 0 and 4095), which is the gray-scale value of a pixel in the acquired image. If we assume that each channel only detects either of NAD(P)H or FPs (no crosstalk) and we also maintain that zero pixel intensity corresponds to no photons detected by sensors, the gray-scale value of an acquired image can be written as
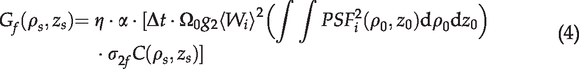
In our experiments, images of the NAD(P)H and FPs channels were acquired simultaneously. The excitation- and scan-related parameters as well as the light collection efficiency were the same. Accordingly, the ratio of the gray-scale values of the two channels for autofluorescence imaging is simplified as
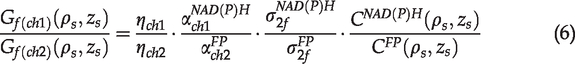
Equation (6) can be rewritten as
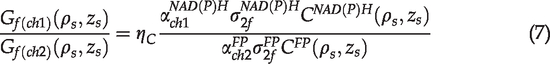
In the TPAF imaging experiments with specified bandpass filters,
Curve fitting method to separate live/dead cell populations in cartilage tissues
In order to apply the non-labeling imaging method in cell viability assessment, a method to determine the NAR threshold to separate live and dead cell population without staining is required. Here we describe a way to determine the threshold by fitting the live/dead cell population distribution functions and the receiver operating characteristic (ROC) analysis.
Since the NAR values of chondrocytes are clustered in two populations as shown in Figure 2(a) and assuming that each population is a Gaussian distribution, we can use two Gaussian functions to fit a histogram of the cell count distributed at different NAR values. The optimized bin numbers (OBN) of the histogram are chosen according to Sturges’ formula:
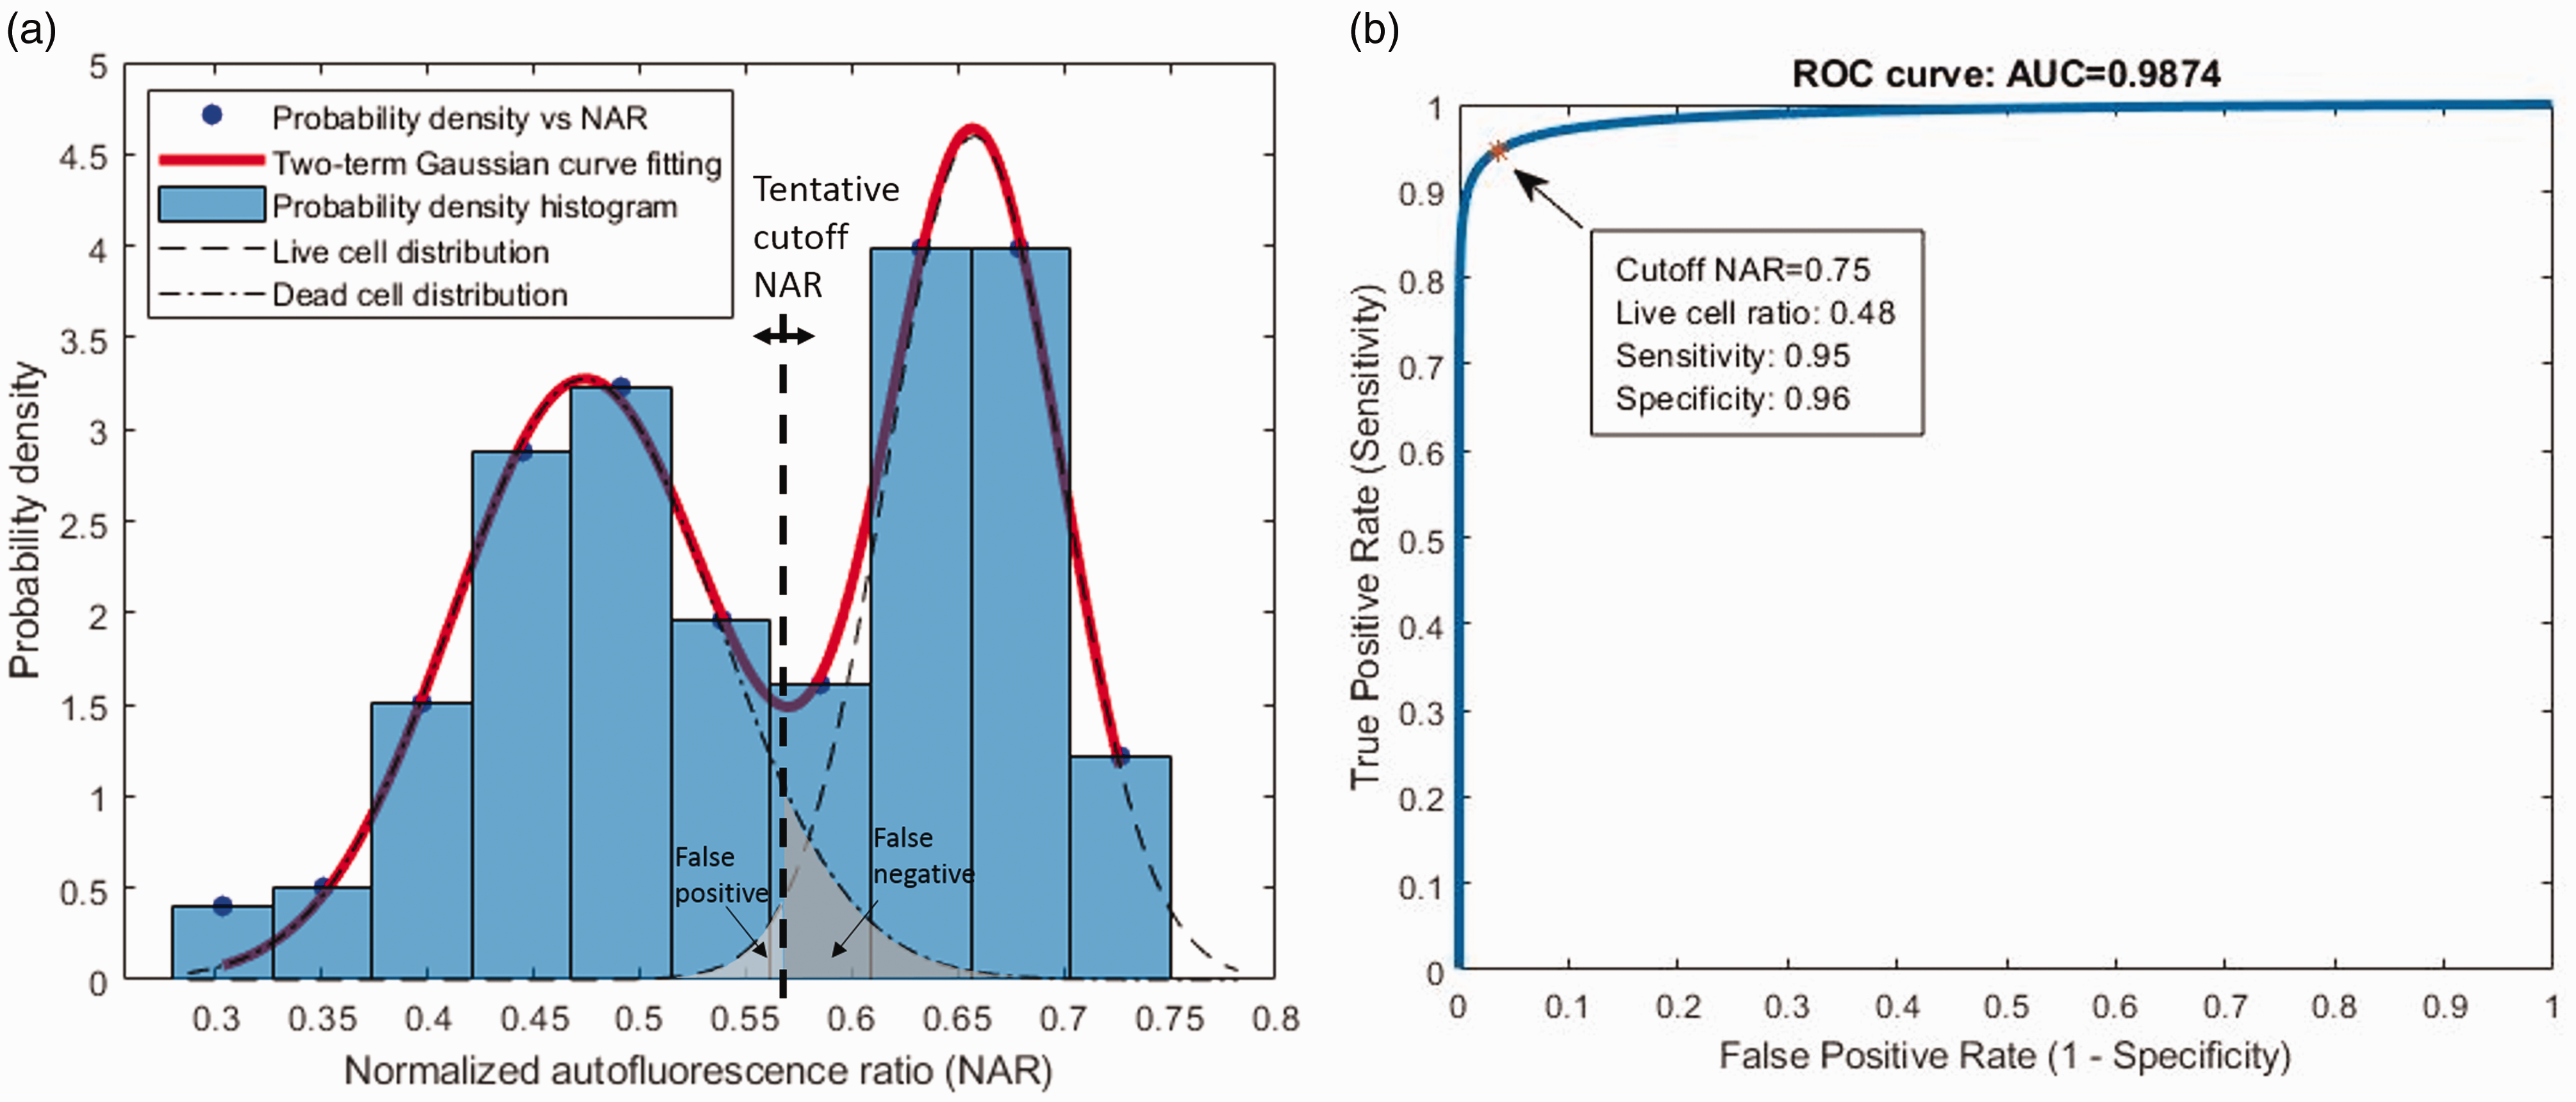
(a) Two-term Gaussian curve fitting of probability density histogram of collected NARs (Tissue 1). (b) Applying the two components from curve fitting, a scanning tentative cutoff NAR generates the corresponding sensitivity and specificity pair and thus acquired a simulated ROC curve. Cutoff NAR is selected from the point nearest to (0,1) on the ROC curve. (A color version of this figure is available in the online journal.)
According to the normalized probability density function (PDF) of two-term Gaussian distribution

The statistically meaningful parameters can be acquired by comparing equations (9) and (10):
Once the distribution function of the two populations was calculated, the
Removal of the fluorescence contribution from collagen in the channel for NAD(P)H fluorescence detection
Prior to the calculation of the NAR for each cell using equation (8), images from the violet detection channel (NADH channel) were corrected by removal of possible fluorescence contribution from collagen. The primary fluorophore in the ECM of cartilage tissue is type II collagen; the fluorescence of which falls into the violet detection channel.23–25 Removal of the collagen fluorescence improves the cell contrast and accuracy of quantitative analysis due to the following reasons: The manually depicted cell-ROIs inevitably cover some pixels containing ECM that emits violet fluorescence. Furthermore, an interesting finding was that some cellular areas showed strong signals in the SHG imaging channel as well as in the violet fluorescence channe1. Removal of collagen fluorescence helps separate live/dead cells by NAR values (Figure 3).
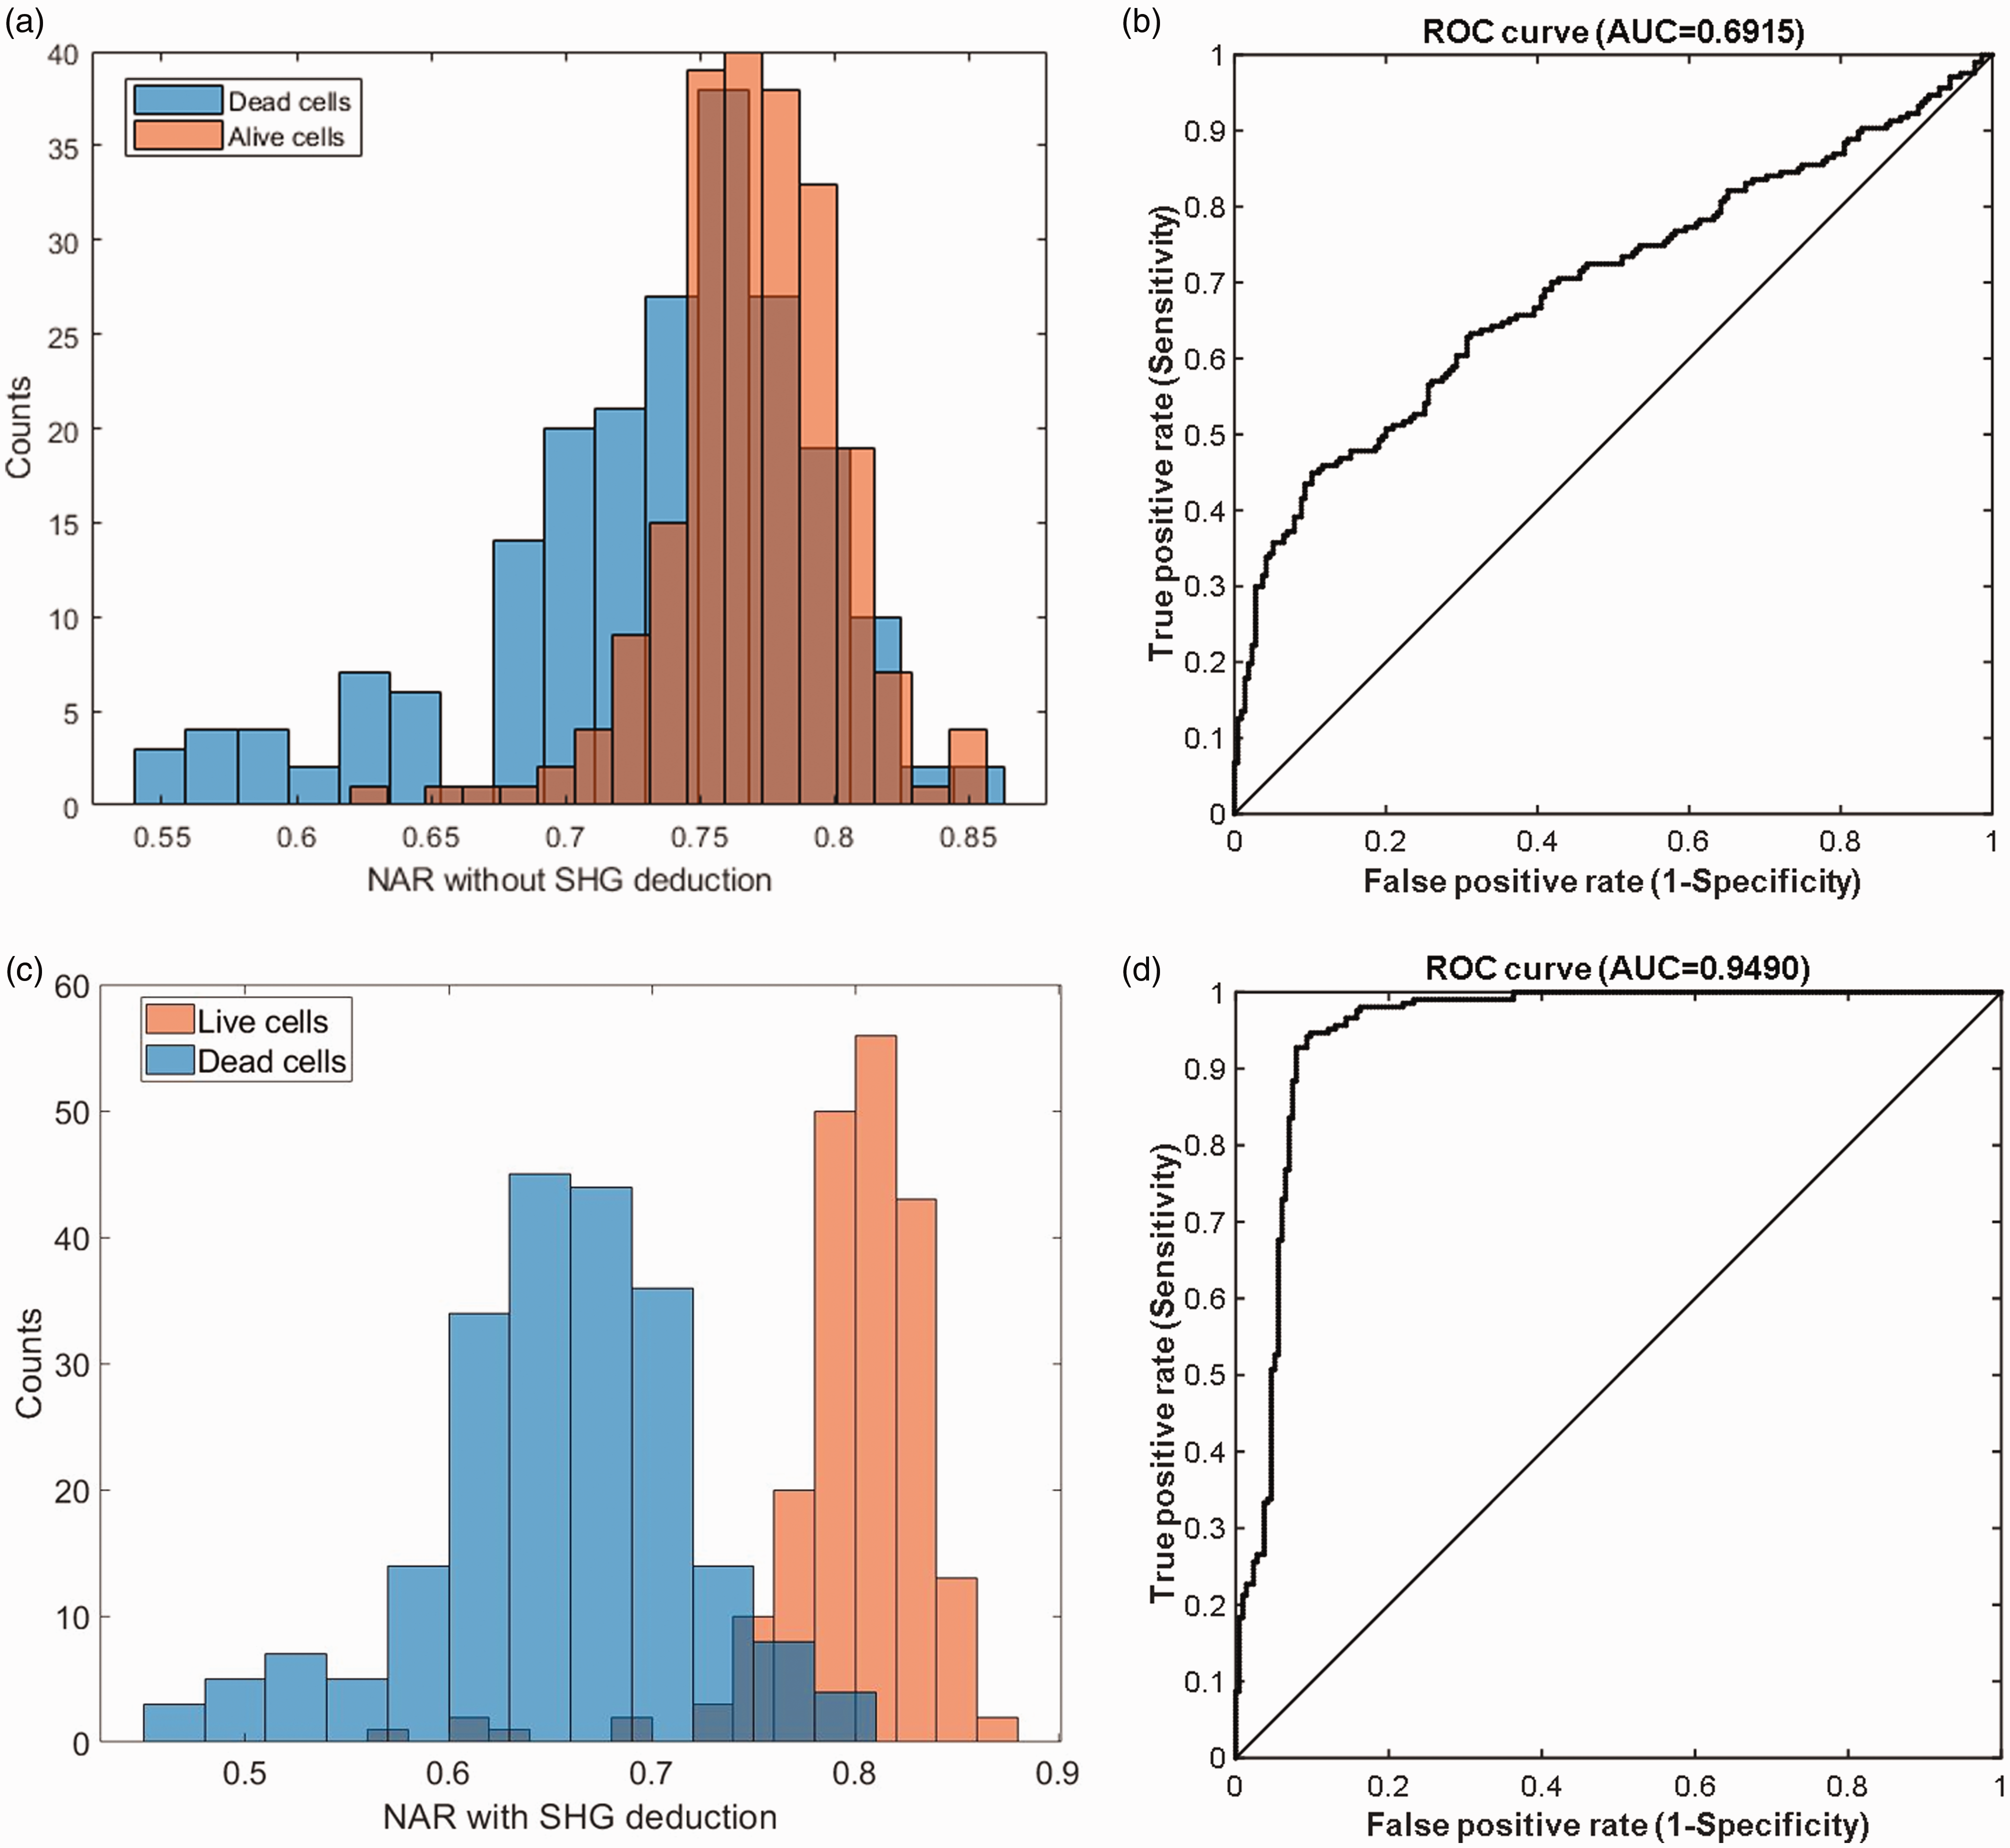
Histogram of NAR values with (c) and without (a) deduction of collagen fluorescence (calculated by SHG signal) separated with staining live/dead assay. ROC analysis shows that NAR with deduction (d) improves the ability to classify live and dead cells than without (b). Data were from Tissue 1 with live cells n = 215 and dead cells n = 207. (A color version of this figure is available in the online journal.)
To remove the collagen contribution in the fluorescence channel, the SHG intensity was used to estimate the amount of fluorescence from collagen in cellular ROIs. It is assumed that the SHG intensity reflected the amount of collagen content, which determined the corresponding fluorescence intensity with a position independent factor, r. ROIs in the ECM-only areas were selected to determine r by calculating the ratio,
Measurement of two-photon excited spectrum of dye mixtures
To calculate the NAR, we first needed to determine the
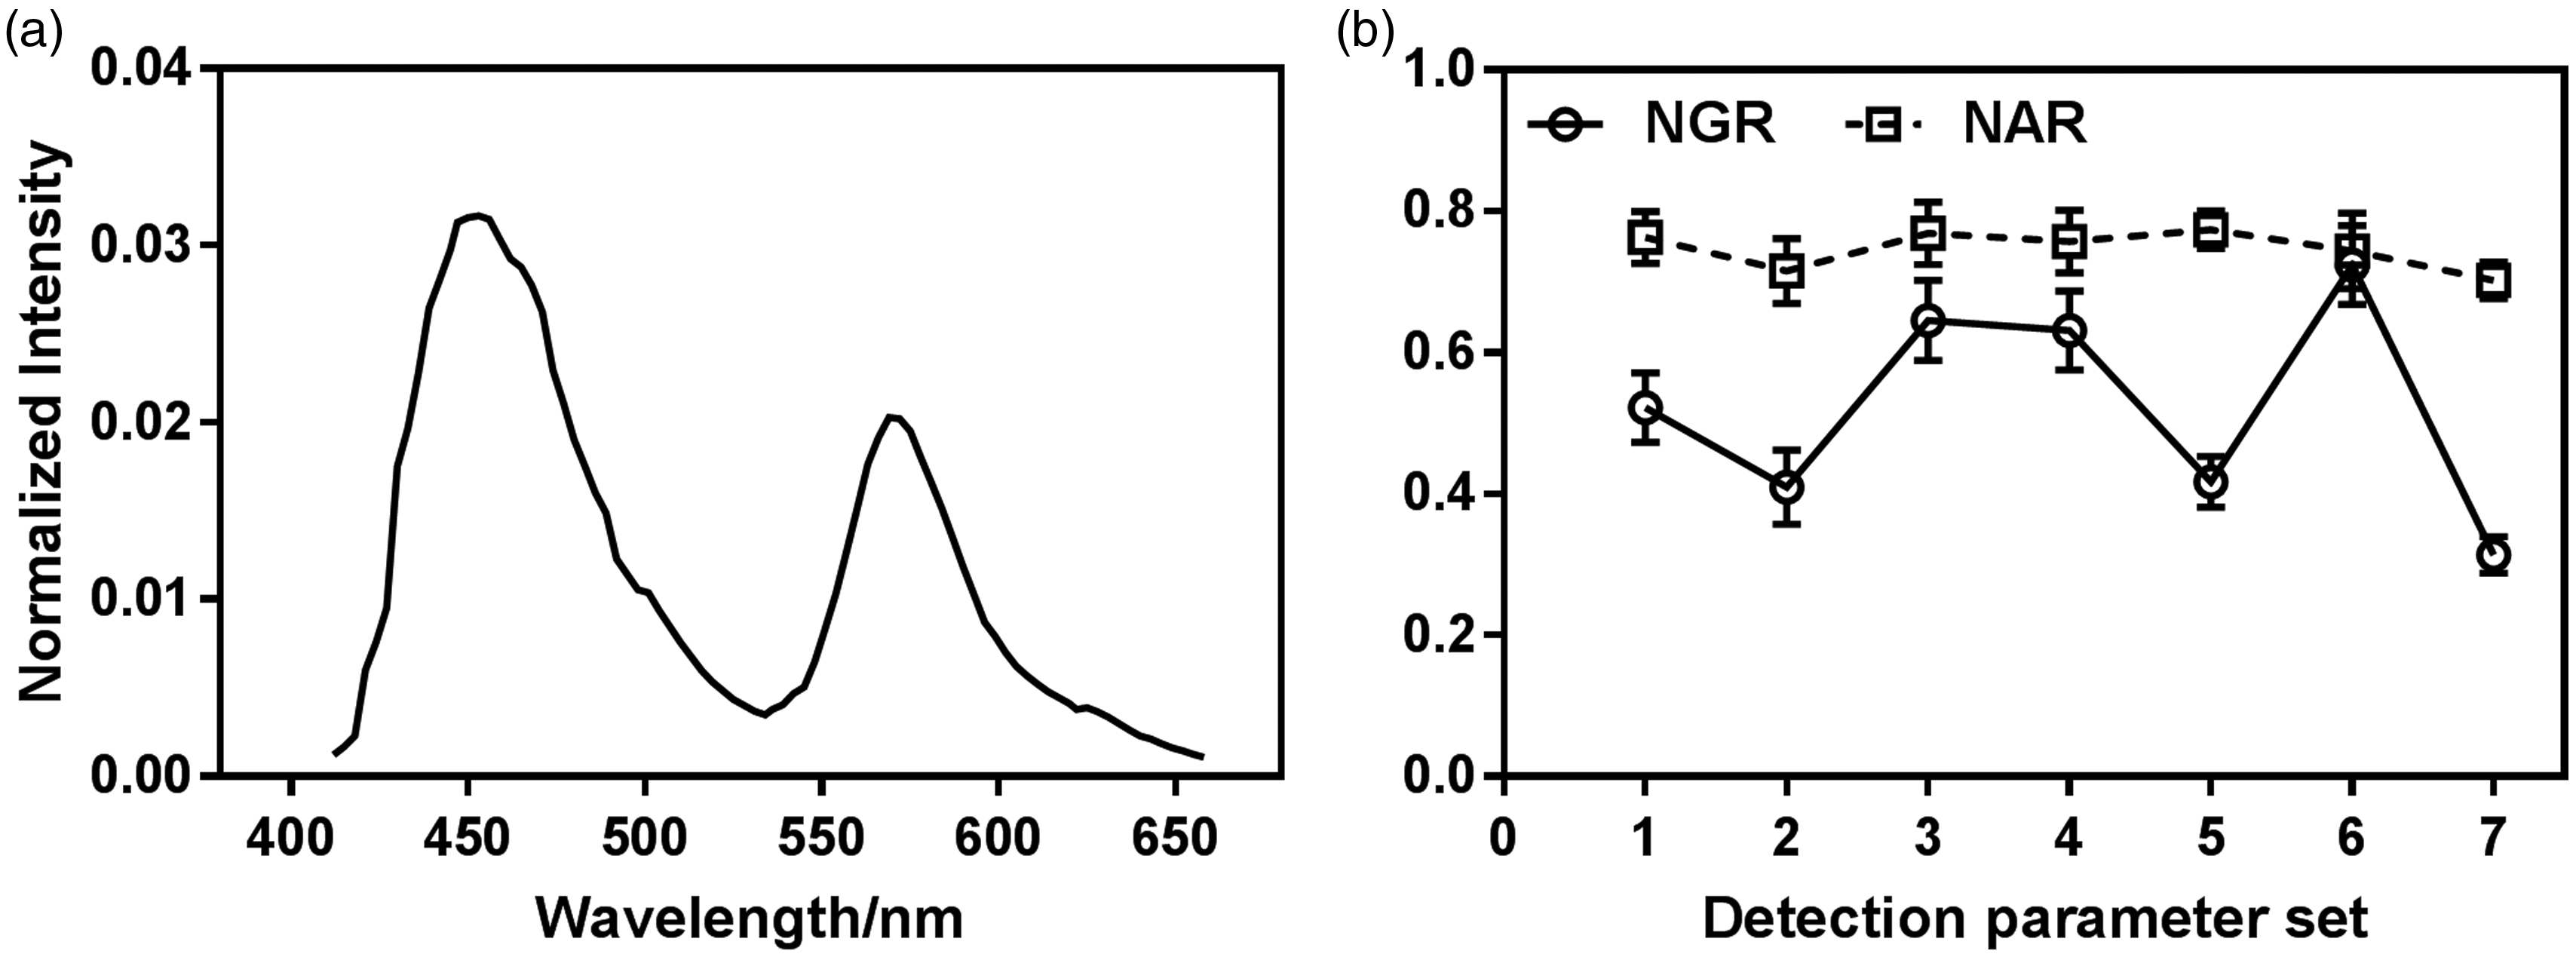
(a) Two photon excited fluorescence spectra of Courmarin-1 (contributing to the left peak) and Rhodamine B (contributing to the right peak) dye mixtures in ethanol excited by 740-nm laser and measured by Zeiss LSM 880 microscope for fluorescence detection calibration for tissue autofluorescence imaging. (b) Normalized autofluorescence ratio (NAR), which is calibrated by
Based on equation (5),
Statistics and curve fitting
Once we collected the ROI pairs showing cell-specific comparison from TPAF/SHG imaging and dye labeling assay in each sample, live/dead assessment was judged visually for each method, respectively. The mean values of each ROI from each channel in TPAF/SHG imaging were measured for further analysis. The staining assay was set as the gold standard and the accuracy of TPAF/SHG imaging assay was evaluated by sensitivity and specificity (live cells were noted as negative, while dead cells noted as positive), where


For comparing the three methods (visual assay, curve fitting method, and ROC analysis with staining), a repeated measures general linear model, with the sensitivity and specificity as within-subject factor, was used to test if there is any difference in the performance among the three methods. Descriptive statistics were reported as mean ± standard deviation. Statistically significant differences were reported at P < 0.05. Statistical analysis was performed using SPSS (Version 24.0, IBM Corp., Armonk, NY).
In total, 1617 cells from four ex vivo fresh cartilage tissues were included in the study. Receiver operating characteristic 26 (ROC) analysis was performed in MATLAB (MATLAB R2018a) to evaluate the performance of NAR to classify live/dead cells. Two-term Gaussian curve fitting was performed for the probability density histogram of NARs by “Curve Fitting Tools” in MATLAB APPS to determine the live and dead cell populations.
Results
Validation of TPAF/SHG imaging assay for chondrocyte classification in ex vivo cartilage tissue
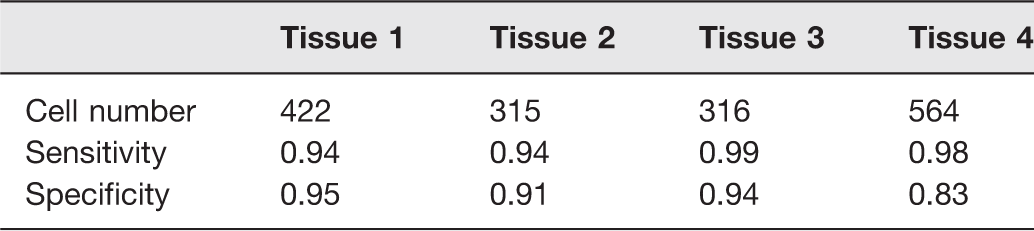
A typical set of multiple channel images and their merged color image are shown in Figure 1. The merged images clearly showed the tissue structure and cell morphology. Assessing the merged color images, we found that two distinct populations of cells could be recognized by their color and brightness: one was brighter and greener and the other dimmer and redder. We hypothesized that the former was live cells, while the latter was dead cells. The validation of this classification method was performed by the in situ dye labeling assessment, and blinded from the results of the TPAF/SHG assessment. The sensitivity and specificity were determined for the four tissues (Table 1). The sensitivity and specificity of the four tissues were 0.96
Visual assessment of chondrocyte viability.
Feasibility of using the NAR indicator to classify dead/live chondrocytes
The visual assessment described above, though reliable, relies on human perception for cell classification and manual counting for the population measurement. The manual work is laborious and not suitable for high throughput analysis. Here we tested if the NAR indicator defined by equation (8) provides a quantitative measure for cell classification. To acquire NAR values, we calculated the coefficient
The dye mixture of Coumarin-1 and Rhodamine B was the standard sample to calibrate the microscopy detection settings. Its two photon excited fluorescence spectrum
Removal of the fluorescence contribution from collagen is necessary. After the removal processing, the NARs are separated naturally in two populations (Figure 3(c)) and it showed a good capability to discriminate cell viability with NARs in ROC analysis (Figure 3(d)). It introduced great improvements than its unremoved counterparts (Figure 3(a) and (b)). The point nearest to (0,1) on the ROC curve and the corresponding cutoff NAR are selected for cell live/dead discrimination. The area under the curve (AUC) ranging from 0.5 to 1 reflects how consistent the NAR-indicator is with the gold standard in the ROC analysis.
With the above processing, we acquired the quantitative indicator to reflect the visual judgment criteria: the normalized autofluorescence ratio (NAR) as defined in equation (2). Taking the dye labeling assay as the gold standard, here we justified the capability of NAR to discriminate live and dead cells by ROC analysis and assessed the NAR threshold of each tissue. Showing an excellent classification capability, the AUC of the four tissues are 0.95, 0.97, 0.98, 0.94, respectively, with the threshold NAR at 0.75, 0.67, 0.63, 0.66, respectively (Table 2). The results demonstrated that the NAR of NAD(P)H and FPs by TPAF/SHG imaging was an effective indicator for chondrocyte viability assay.
Results of ROC analysis of cell NARs with staining assay.
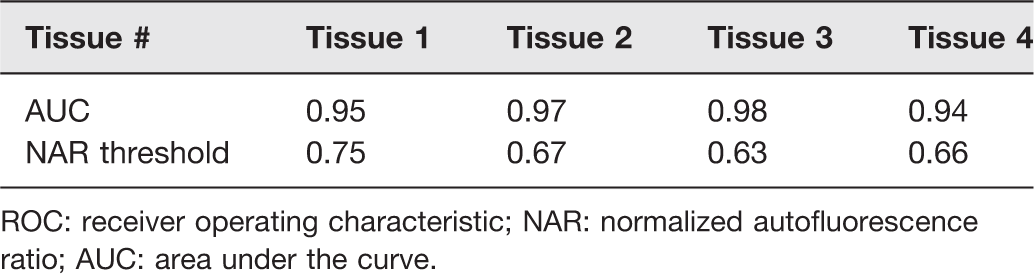
ROC: receiver operating characteristic; NAR: normalized autofluorescence ratio; AUC: area under the curve.
Determination of the NAR threshold for the cell classification using the population distribution function
It has been demonstrated above that NAR is a feasible measure to classify live versus dead cells. The TPAF/SHG imaging is potentially applicable to cell viability assessment in cartilage without staining. However, the ROC analysis requires staining as the gold standard and the best NAR threshold varies in different tissues (Table 2). Based on the curve fitting method and simulated ROC analysis, the point nearest to (0,1) on the ROC curve was applied to determine the corresponding cutoff NAR for live/dead cell discrimination at 0.75, 0.79, 0.62, and 0.70, respectively, for the four tissues. The separated live and dead cell populations with the cutoff NAR of each tissue are presented in Figure 5(a). Using these cutoff NARs from curve fitting, live and dead cell counts were determined and the sensitivity and specificity were calculated to assess the performance according to the staining gold standard. Figure 5(b) compares the performance of all three methods: visual judgment, ROC analysis with staining, and curve fitting ROC analysis of the four tissues. The sensitivity and specificity from simulated ROC analysis were determined to be 0.92
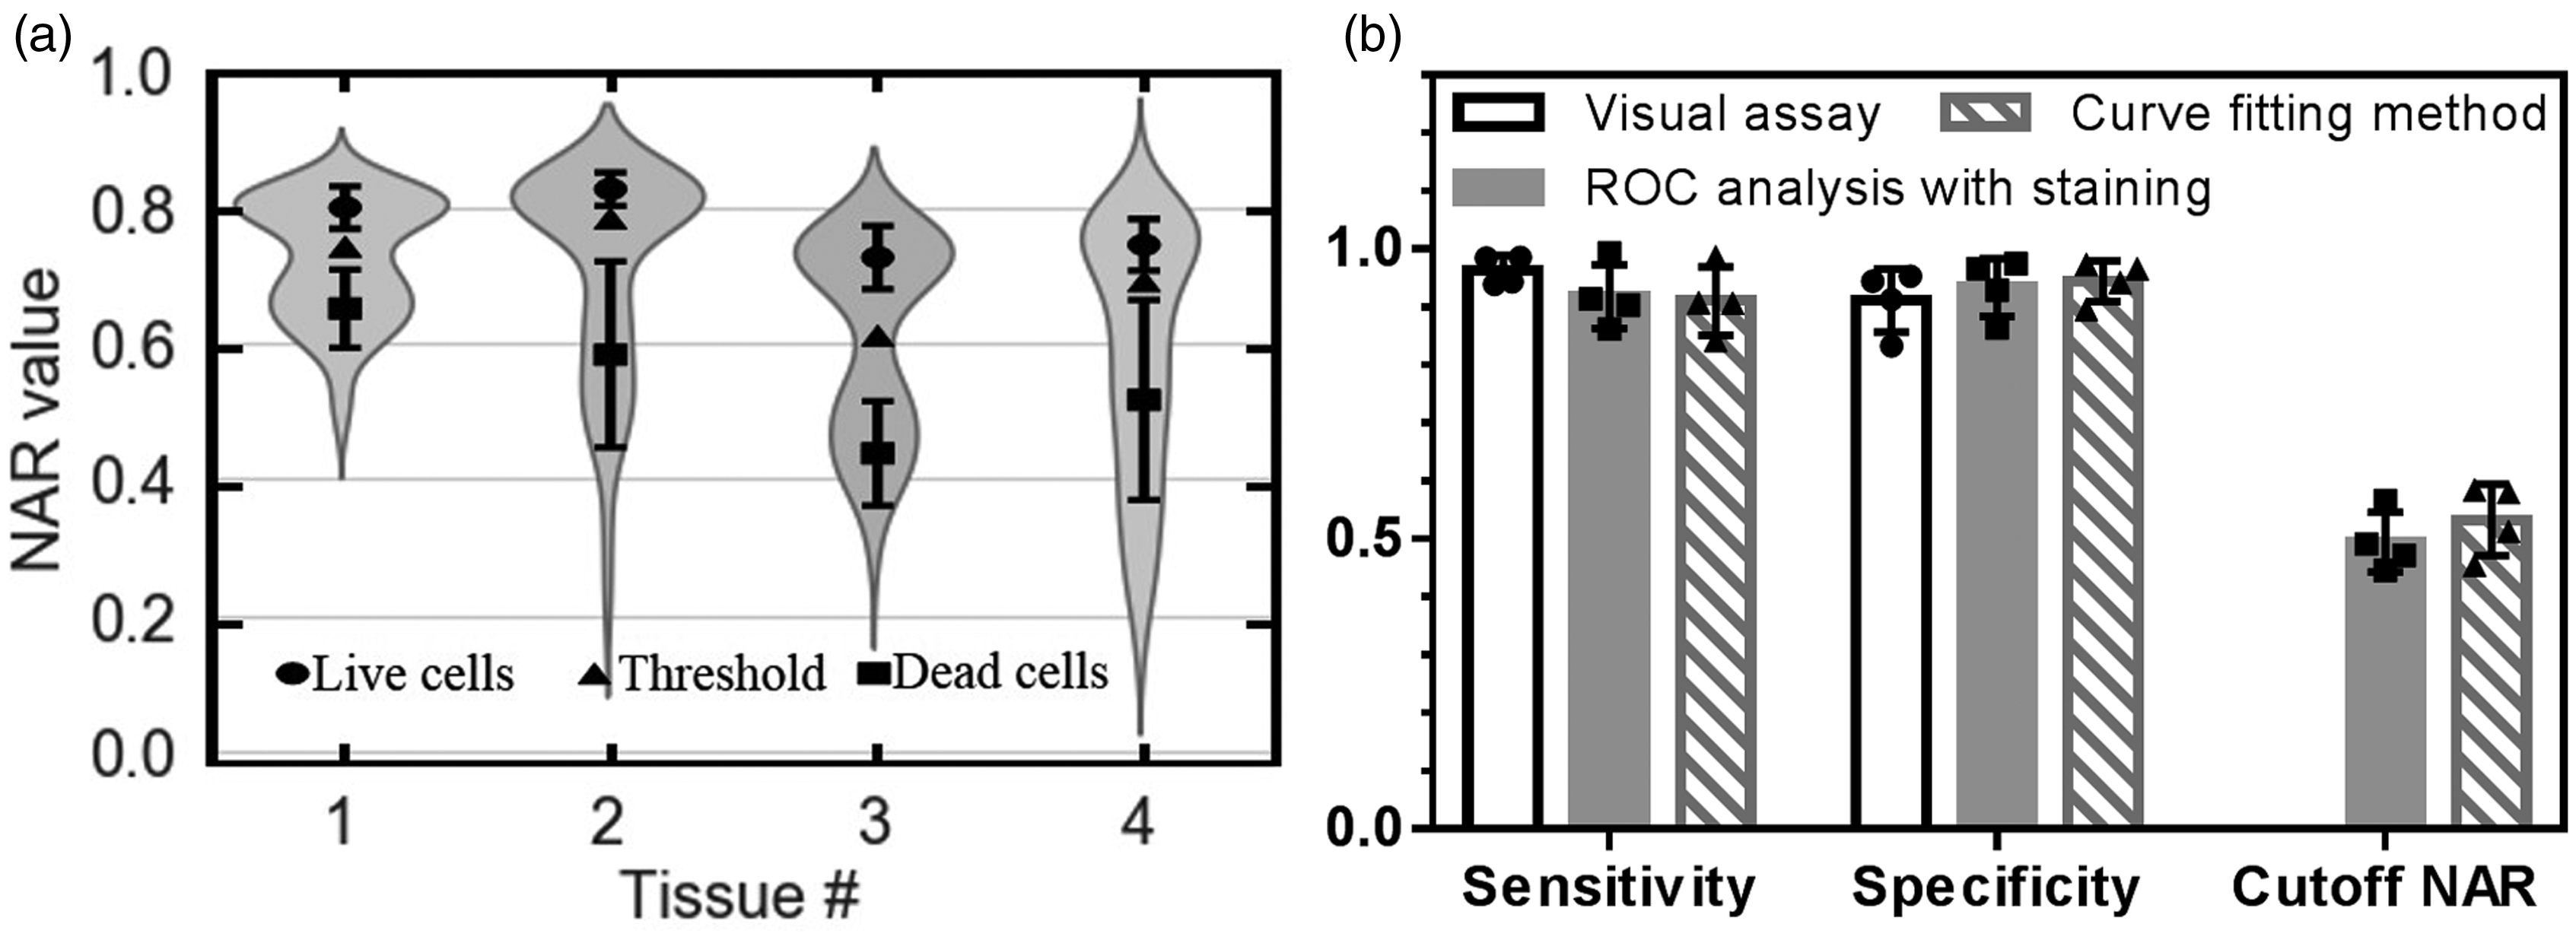
(a) Curve fitting method to determine live/dead cell populations with mean
Discussion
In the live/dead dye assay using Calcein-AM/EthD-1, live cells are typically stained uniformly in the calcein channel with no signals in the EthD-1 channel, while dead cells appear in the EthD-1 channel with no signals in the Calcein channel. However, we found that some dead cells also appeared in the Calcein channel but with quite different morphologies than live cells. This atypical appearance of dead cells in the Calcein channel was confirmed by imaging dead (frozen) cartilages. As shown in Figure 6, although some dead cells are labeled in the Calcein images, they show many punctate, vesicle-like compartments instead of uniformed staining for live cells. Since Calcein-AM essentially labels esterase effect, we hypothesized that this false positive staining of Calcein indicates esterase-active vesicle-like compartments existing in dead or dying chondrocytes. The false labeling of Calcein was reported by others in chondrocyte viability studies. 27 Here we provide high-resolution images to demonstrate that, if morphologies of stained cells are taken into consideration, the reliability can be improved in the chondrocyte viability study with Calcein. Although the exact reason for the appearance of dead cells in the Calcein channel was unknown, the EthD-1 labeling indicated those cells were dead. This suggests that staining with both Calcein-AM and EthD-1 is necessary when the live/dead assay is applied to cartilage tissues in the chondrocyte classification.

Calcein-AM and EthD-1 staining (a, d and b, e respectively) of fresh ex vivo cartilage (a–c) and one-week frozen cartilage (d–f) as a dead cell model. False positive staining of Calcein with clustered vesicles is observed in dead cells from both tissues. Alive cells are stained with Calcein in smooth green while not labeled with EthD-1. Cells specified in the rectangle show the comparison of stained Alive (left) and dead (right) cell patterns. Scale bar: 50 μm. (A color version of this figure is available in the online journal.)
Although autofluorescence of chondrocytes is the major factor in cell classification, acquisition of SHG images of cartilage samples is necessary because of several benefits for the analysis. First, the SHG signal is dominantly generated from type II collagen in the ECM 28 and provides margins for cell occupied areas called lacuna. In the visual assessment, the SHG signal is assigned to the blue channel, which enhances the image contrast of cells. In the quantitative analysis, the SHG images help identify and circle cellular regions. Secondly, an interesting finding seen in Figure 7 is that the SHG signal occasionally recorded inside lacunae. This phenomenon was reported as an intracellular collagen fibril formation in a study of Kif5b-depleted mutant mice cartilage. 29 However, to the best of our knowledge, this type of collagen formation has not been reported in normal chondrocytes of articular cartilage. It is unknown whether this is a pathological or a normal physiological process. With lack of further analysis, it is hard to tell if collagen fibrils are forming inside those chondrocytes or if those areas have cells at all. Nonetheless, since only a handful of macromolecules can generate such a strong SHG signal, the collagen fibril (either type I or type II) formation likely happens in those areas. Those collagen-filled, cell-shaped lacuna were excluded in our analysis. Finally yet importantly, the SHG signal is used to estimate the amount of autofluorescence in the ECM region. As we demonstrated in Figure 3, subtraction of the possible contribution of collagen in the NADH channel has a significant impact on cell classification. With the subtraction, live and dead cell populations are easily differentiable by the NAR value. This demonstrates that the combination of two-photon excited autofluorescence and second harmonic generation provides a unique tool in the chondrocyte viability analysis.
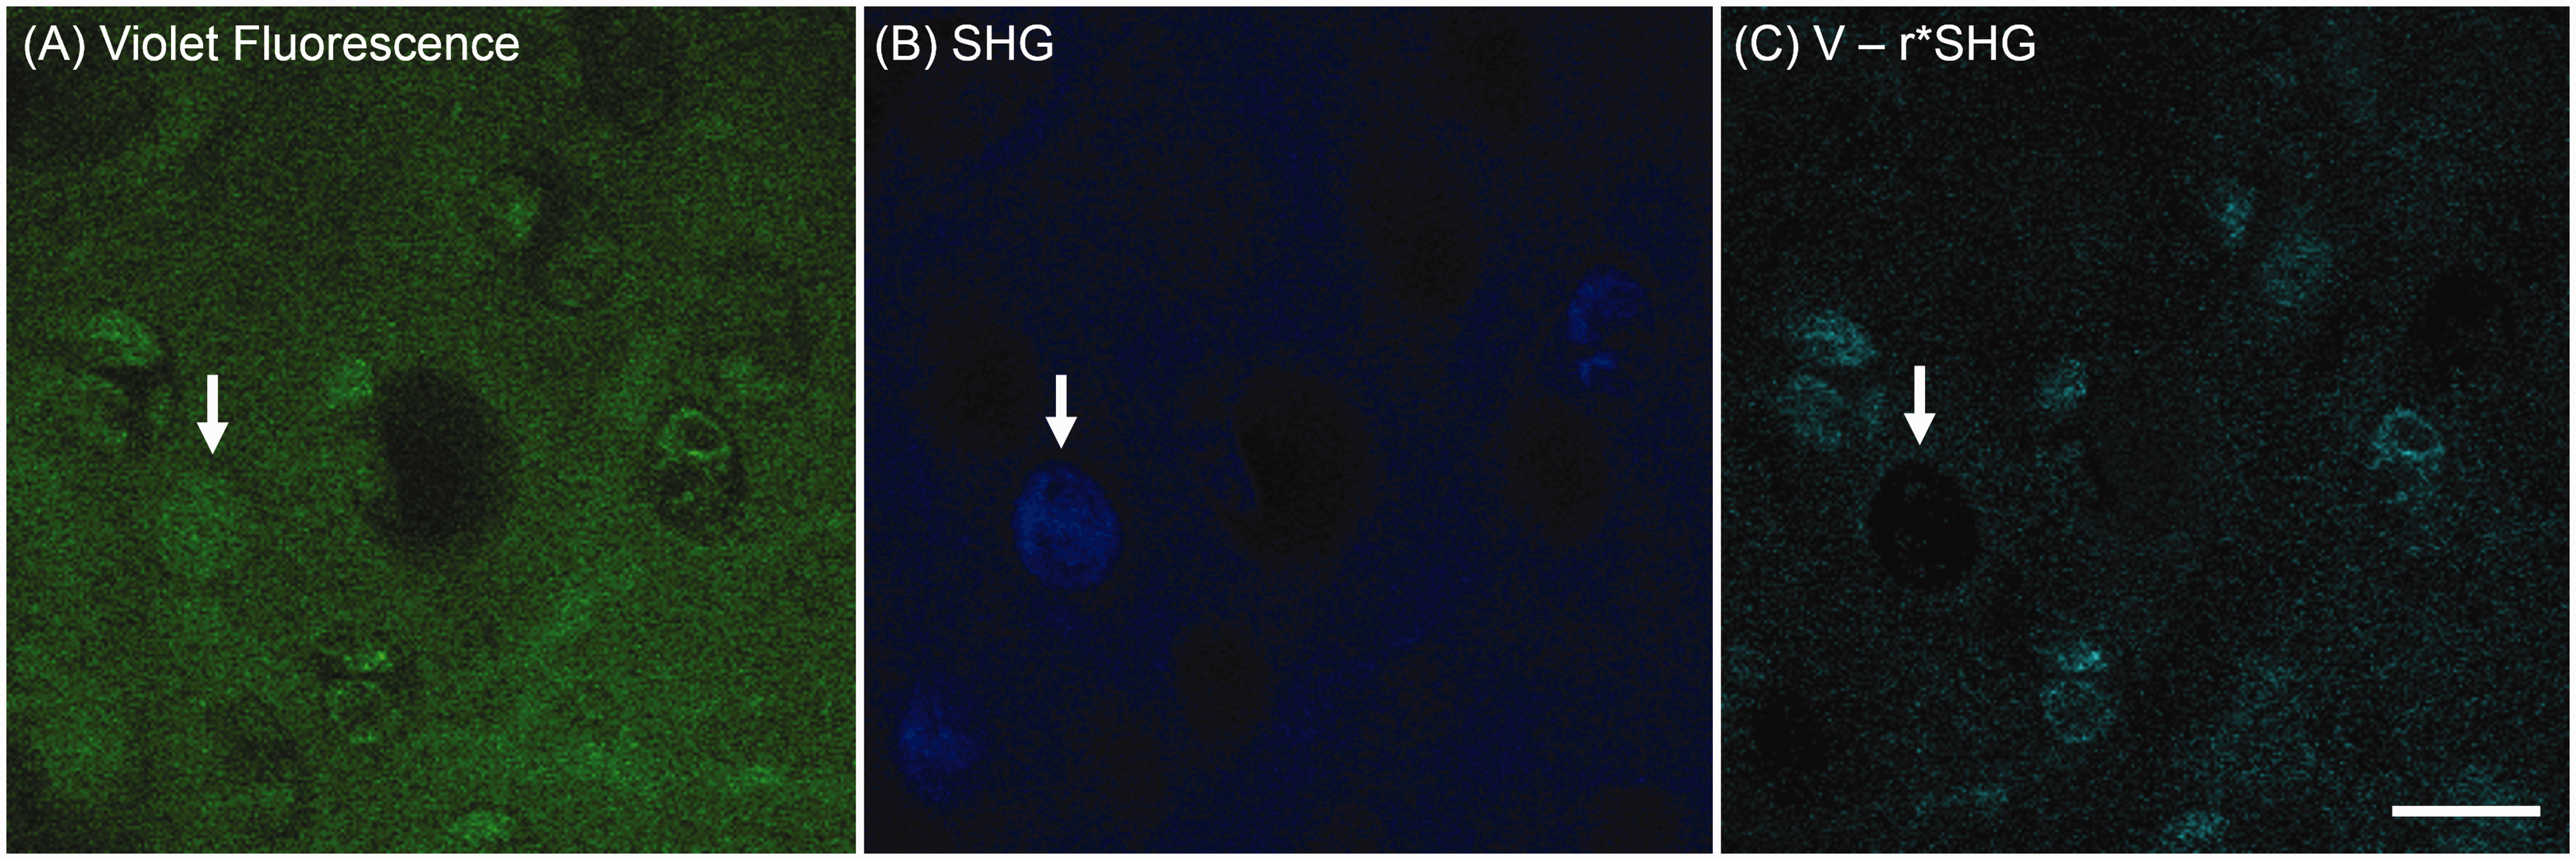
Collagen-filled lacunae in ex vivo rat tibia cartilage observed by label-free nonlinear optical microscopy. The strong SHG signal in areas indicated by arrows (b) suggested the collagen content in the cell-shape lacunae instead of a cell. The image (c) is acquired by the deduction of collagen fluorescence calculated from SHG imaging (b) out of violet fluorescence imaging (a) by the equation
The source molecules of autofluorescence in cells have been well studied. Intrinsic fluorescent coenzymes such as NAD(P)H and FPs are dominant in almost all types of cells and play crucial roles in cellular metabolism and energy production. The autofluorescence imaging has been widely used in studies such as the stages of stem cell differentiation 30 and differentiation of cancerous from normal cells/tissues of many different types, including epithelia, 31 human colonic tissue, 32 human breast cell line, 33 and human oral tissues. 34 In this study, it is assumed that chondrocytes have autofluorescence primarily from NAD(P)H and FPs as other well-studied cell types do. The results were consistent with this assumption in two aspects: (1). The excitation and detection light wavelength were designed according to the NAD(P)H and FPs fluorescence properties and clear autofluorescence signals were detected forming cellular images. (2). The autofluorescence signals reflecting chondrocyte viability were consistent with the biochemical functions of NAD(P)H and FPs in cellular metabolism.
The nonlinear optical microscopy viability assay was performed on a commercial multiphoton microscope. For the visual assessment, it is hard to define a set of parameters that can be suited to various microscopes. We suggest using the same laser excitation wavelength and dichroic or bandpass filters with the same transmission bands as we did. Microscope settings have to be optimized to acquire high quality images of cartilage samples, which means that the images need reasonable contrasts and background levels. For the quantitative method, we introduce the factor
In the curve fitting method, the NAR threshold for cell classification is determined by fitting cell populations with the two-term Gaussian model. When either live or dead cells are dominant in the analyzed tissue, two-term Gaussian functions are not suitable for fitting the population distribution. In that situation, a control tissue with the opposite class may be included to fill the missed population. Alternatively, the mean of NAR thresholds from multiple tissues in the same experiment can be applied to all cells in the group if tissues are from similar locations of the same species. In this study, cells are identified and circled manually, but there are image segmentation and classification algorithms available for enabling fully automated analysis. The recent advances in deep learning algorithms also provide possibilities for automated cell viability assessment without defining explicit quantitative measures.
Conclusions
In this study, we demonstrated the use of nonlinear optical microscopy in the assessment of chondrocyte viability of articular cartilage tissue. Without introducing any exogenous dye labeling, a combination of two-photon excited autofluorescence and second harmonic generation provides a reliable visual method for chondrocyte viability assessment in freshly excised articular cartilage. We also suggest a quantitative measure, the normalized autofluorescence ratio (NAR), for classification of live/dead cells. The NAR threshold for cell classification can be found by fitting the population distribution functions. The nonlabeling nature of the proposed methods holds a great potential in clinical applications if compact endoscopic imagers are developed.
Supplemental Material
EBM896545 Supplemental Material - Supplemental material for Nonlabeling and quantitative assessment of chondrocyte viability in articular cartilage with intrinsic nonlinear optical signatures
Supplemental material, EBM896545 Supplemental Material for Nonlabeling and quantitative assessment of chondrocyte viability in articular cartilage with intrinsic nonlinear optical signatures by Yang Li, Xun Chen, Beckham Watkins, Neal Saini, Steven Gannon, Elizabeth Nadeau, Russell Reeves, Bruce Gao, Vincent Pelligrini, Hai Yao, Jeremy Mercuri and Tong Ye in Experimental Biology and Medicine
Footnotes
Authors’ contributions
Yang Li and Dr. Tong Ye perceived the idea. Yang Li implemented imaging experiments and formulated the theoretical interpretation of the signal collection. Xun Chen and Beckham Watkins helped with data processing. Neal Saini, Dr. Zhi Gao, Dr. Hai Yao, and Dr. Jeremy Mercuri contributed to the design of the experiments. Elizabeth Nadeau, Russell Reeves, and Dr. Vincent Pelligrini contributed to sample preparation and data interpretation. Yang Li and Dr. Tong Ye drafted the manuscript. Yang Li, Steven Gannon and Dr. Tong Ye revised the manuscript. All of the authors reviewed and approved the final manuscript.
DECLARATION OF CONFLICTING INTERESTS
The author(s) declared no potential conflicts of interest with respect to the research, authorship, and/or publication of this article.
FUNDING
This research was supported by South Carolina IDeA Networks of Biomedical Research Excellence (SC INBRE), a National Institutes of Health (NIH) funded center (Award P20 GM103499). This work was also supported by MTF Biologics Extramural Research Grant, South Carolina Translation Research Improving Musculoskeletal Health (TRIMH), a NIH funded Center of Biomedical Research Excellence (Award P20GM121342), Clemson University’s Robert H. Brooks Sports Science Institute (RHBSSI) Seed Grant and a grant from the National Science Foundation (1539034). The imaging experiments were performed on the commercial microscopes in the user facility supported by Cell & Molecular Imaging Shared Resource, Hollings Cancer Center, Medical University of South Carolina (P30 CA138313).
Supplemental material
Supplemental material for this article is available online.
References
Supplementary Material
Please find the following supplemental material available below.
For Open Access articles published under a Creative Commons License, all supplemental material carries the same license as the article it is associated with.
For non-Open Access articles published, all supplemental material carries a non-exclusive license, and permission requests for re-use of supplemental material or any part of supplemental material shall be sent directly to the copyright owner as specified in the copyright notice associated with the article.