
Abstract
Obesity involves genetic and environmental factors. The co-expression gene network in relevant tissues in different obesity groups provides an entrance for profiling and identifying associated pathways and genes. We aim to identify the meaningful co-expressed gene network in mRNA extracted from adipose tissues representing different obesity phenotypes in a new tree shrew model. Furthermore, to find the potential drug target based on analyzing the possible pathways and hub genes responsible for obesity. Ten tree shrews were selected from F1 populations and divided into three groups based on their Lee’s index for mRNA sequencing. We identified clusters of highly correlated genes (modules) in differently expressed genes by weighted gene co-expression network analysis. Three modules were firmly correlated with not less than one obesity phenotype (associations ranging from −0.94 to 0.85, P < 0.01). The genes from the blue module (including 481 genes) are mostly enriched in the ribosome pathway. The genes from the brown module (including 389 genes) are mostly enriched in the lysosome pathway. The genes from the turquoise module (including 1781 genes) are mostly enriched in the ubiquitin-mediated proteolysis pathway. The hub gene in each module was determined, including UBA52 in the blue module, AKT1 in the brown module, and LRRK2 in the turquoise module. After profiling and analyzing the co-expression gene network of obese tree shrew, we identified differently expressed genes and pathways (ribosome, lysosome and ubiquitin-mediated proteolysis pathway) that might be involved in the development of obesity. Further study of the differently expressed genes and pathways might provide new targets for the prevention and therapy of obesity.
Impact statement
We constructed the transcriptomic network in adipose tissue in lean, moderate obesity and severe obesity groups of tree shrew for the first time. Compared to other laboratory animal models, the tree shrew is a prospective laboratory animal that has a closer genetic association with primates than with rodents. It is widely used in biomedical researches. Enrichment analyses revealed several molecular biological processes were involved in the ribosome, lysosome, and ubiquitin-mediated proteolysis process. These results provided insights into new targets for the prevention and therapy of obesity and a novel research model for obesity.
Introduction
Obesity is a rapidly expanding worldwide disease that causes cancer, metabolic disorders, and cardiovascular diseases. Obesity is an over-nutrition condition, which harms systemic metabolic balance and evokes stress.1,2 Chronic inflammation in white adipose tissue (WAT) is a characteristic of obesity pathophysiology and is highly associated with other severe diseases. 3 The initiation and exacerbation of chronic inflammation primarily occur in WAT. 4 However, the lack of recognition of the pathogenesis has delayed the relevant pharmacological approaches. Existed medications are often accompanied by many unintended adverse events. The precise mechanisms of adipose tissue, especially its co-expression network profiles, in the development from lean to moderate obesity, and then to severe obesity are still less understandable.
Compared to other laboratory animal models, the tree shrew (Tupaia belangeri) is a prospective laboratory animal that has a closer genetic association with primates than with rodents.5,6 Additionally, other advantages, including easy maintenance, small body size, and rapid reproduction, make the tree shrew an excellent model animal. Many studies use the tree shrew for fundamental biological mechanisms,7,8 modeling human diseases,9–13 organism responses,14,15 and molecular evolution.16,17 The tree shrew has been proposed as a substitute choice for primates in biomedical research. The available annotated genome data provide a solid foundation to analyze the genes of tree shrew at the transcriptomic level.18,19
Therefore, considering the central role of WAT in energy homeostasis, we used subcutaneous adipose tissue from the tree shrew model of spontaneous obesity to study the mRNAs of three extreme groups. We performed the WGCNA method using RNA-sequencing (RNA-Seq) data. 20 We aimed to elucidate transcriptomic mechanisms of obesity in tree shrews and to shed light on the mechanism of human obesity by detecting mRNAs and pathways involved in the pathogenesis of obesity.
Materials and methods
Profile of tree shrew obesity
Three hundred and twenty-nine F1 tree shrews (168 males and 161 females) were bred in the Centre of Tree Shrew Germplasm Resources, Institute of Medical Biology, Chinese Academy of Medical Science and Peking Union Medical College (IMBCAMS). The age of the 329 tree shrews ranged from 1.5 to 4.5 years. All methods were conducted in accordance with ethical and relevant guidelines and regulations. The institutional Animal Care & Welfare Committee of IMBCAMS approved all experimental protocols (NO. DWLL2016012).
The body weight and Lee’s index [(body weight (g)× 1000)(1/3)/body length (cm) × 100] were determined as before. 21 Based on the normal distribution curve of Lee’s index, tree shrews were categorized into three groups: lean (Lee’s index < mean + 2SD), moderate obesity (Lee’s index > mean + 2 SD), and severe obesity (Lee’s index > mean + 4 SD). Through calculation, the range of these three groups is: lean (Weight < 178.66), moderate obesity (Weight ≈ 178.66–208.84), and severe obesity (Weight > 208.84).
We chose 10 animals from these three groups and used the subcutaneous adipose tissue for RNA-Seq: three severe obesity (O), three moderate obesity (M), and four lean (L) tree shrews.
Phenotypic characterization of the selected tree shrews
Data acquisition on all 329 tree shrews was completed within a one-week time in April 2017. All tree shrews were fasted for12 h before measuring. Each tree shrew was caught in a pocket, and the body weight/length was measured twice. Biochemical parameters and related data on the 10 selected tree shrews were determined as described previously. 21 An Aquillon ONE 320-row helical CT scanner (Toshiba, Tokyo, Japan) was used to determine fat volume in vivo. The results were regarded as significant at P < 0.05. After anesthesia, a biobank of tissues was created by sampling subcutaneous adipose tissue for each animal.
Sample collection and preparation
The mRNA was extracted using TRIzol™ Reagent (Thermofisher, MA, USA). The RNA purity was assessed by a NanoPhotometer® spectrophotometer (IMPLEN, CA, USA). The RNA concentration was determined by Qubit® RNA Assay Kit in a Qubit® 2.0 Fluorometer (Life Technologies, CA, USA). The RNA integrity was measured by RNA Nano 6000 Assay Kit. Libraries were created by NEBNext® UltraTM RNA Library Prep Kit afterward. The clustering of the index-coded samples was executed on a cBot Cluster Generation System. Then the library was sequenced on an Illumina Hiseq platform and 125 bp/150 bp paired-end reads were created. The clean reads were aligned to the reference genome TupChi_1.0 using STAR (v2.5.1b) with the method of maximal mappable prefix (MMP).
Quantification of gene expression level and (DEGs) expression analysis
The number of reads aligned to every gene was estimated by HTSeq v0.6.0. Subsequently, the FPKM of all genes was determined, resulting in an average of 10,838 genes per sample. The DEGs analysis between every two groups was conducted by DESeq2 R package (1.10.1). DESeq2 provides statistical methods for determining DEGs from sequencing data that rely on the negative binomial distribution. The resulting P-values were adjusted by Benjamini and Hochberg’s method. Genes with an adjusted P-value <0.05 were considered as DEGs.
WGCNA
We reduced the data set further before network construction, and genes were selected based on variation (SD > 0.25), leading to 7115 genes. We conducted WGCNA as mentioned previously. 20
Gene ontology and the Kyoto encyclopedia of genes and genomes analysis
GO and KEGG were used to interpret gene data in each module. 22 The DAVID database (https://david.ncifcrf.gov/) is a combined data source for annotation, visualization, and integrated GO/KEGG analysis for a set of genes. Functional and pathways analyses were conducted using this database to identify the gene function and most enriched pathways of DEGs. The cut-off criterion was an adjusted P-value <0.05. We selectively showed the top 20 significantly enriched GO terms and showed all the significantly enriched KEGG pathways.
Construction and analysis of the protein–protein interaction network
DEGs in each module were matched to the PPI data through the Search Tool for the Retrieval of Interacting Genes (STRING) database v.9.1 (http://www.stringdb.org/) to demonstrate potential protein–protein interaction (PPI) networks.23,24 The STRING database applies a meta-method to assess PPI relationships and identifies functional or physical links between proteins. The extended network was built based on the minimum required interaction score of 0.9, which indicates that only interactions with the highest confidence score were selected. Cytoscape is a useful software tool for visually exploiting biomolecular interaction networks. The DEGs in each module were mapped to STRING at first and then visualized using Cytoscape. The criterion for screening hub genes was based on the node degree.
Analysis of transcription factors related to nine shared genes
We used a Cytoscape plugin, iRegulon, to predict the possible transcription factors (TFs) of the nine target genes. And then a new network was built with the output result. The parameter values were as following: the maximum false discovery rate on motif similarity is 0.001; the minimum identity between orthologous genes is 0.05, the normalized enrichment scores (NES) is 7.
Hub gene analysis and validation
Hub genes are highly linked with one another in one module and are involved in their function. We identified the hub genes based on both their module membership (>0.9) and their node degree in the PPI network.
According to the Sangon Biotech manufacturer’s protocol (SK1321), we got total RNA from adipose tissue samples using Trizol reagent. The quality and quantity of extracted RNA were evaluated. The isolated RNA concentration was normalized to the same. We conducted qRT-PCR by ABI Stepone plus (Thermofisher scientific, ABI, US). The reverse transcription (RT) reaction was carried out by incubating RNA 5 μL, with random primer p(dN) 6 1 μL, dNTP Mix 1.0 μL, Rnase-free ddH2O 7.5 μL, 5 × RT Buffer 4 μL, RNase Inhibitor 0.5 μL, and reverse transcriptase 1.0 μL (Kit code No: EP0733, Thermo Scientific) at 50°C, for 30 min. The total reaction volume used in RT was 20 μL. The PCR reaction was carried out by incubating cDNA from the previous step 2 μL, with SybrGreen qPCR Master Mix 10 μL, forward primer 0.4 μL, reverse primer 0.4 μL, ddH2O 7.2 μL. The PCR conditions were as follows: denaturation at 94°C for 30 s, annealing at 60°C for 30 s, and polymerization for 70°C for 1 min with DNA polymerase (Kit code No: B639273, ABI). SangonBio-tech (Shanghai, China) synthesized the primer sequences of DEGs and GAPDH. The primer sequences are:
GAPDH-F5ʹGACCTGACCTGCCGCCT3ʹ GAPDH-R5ʹGTGGGTGTCGCTGTTGAAGT3ʹ UBA52-F5ʹTCCAAGACAAGGAGGGCAT3ʹ UBA52-R5ʹGAGGGTGGACTCTTTCTGGAT3ʹ AKT1-F5ʹCACGCCACCTGACCAAGA3ʹ AKT1-R5ʹAGCGAGACAGCAAAACCCT3ʹ
Results
Weight and Lee’s index of surveyed tree shrews
The phenotype of animals in the severe obese group was fairly different from that of their lean counterparts as shown in Figure 1(a). Body length and body weight measurements shown in Figure 1(b) and (c) of the 329 breeding tree shrews were conducted within a one-week period in April 2017. Tree shrew age was between 1.5 and 4.5 years as shown in Figure 1(d). The average body weight of the 329 tree shrews was 148.47 ± 15.09 g, and the average Lee’s index was 280.67 ± 15.09. Although the body weight and Lee’s index were variable, the data followed a Gaussian distribution as shown in Figure 1(e). However, Pearson’s correlation analysis suggested that body weight (r = 0.27, P < 0.001, shown in Figure 1(f)) and Lee’s index (r = 0.41, P < 0.001, shown in Figure 1(g)) were positively correlated with age, which was equal to feeding time. The body weight and Lee’s index were significantly higher than those previously reported for wild tree shrews (128.66 ± 0.66 g and 274.46 ± 8.16, respectively).
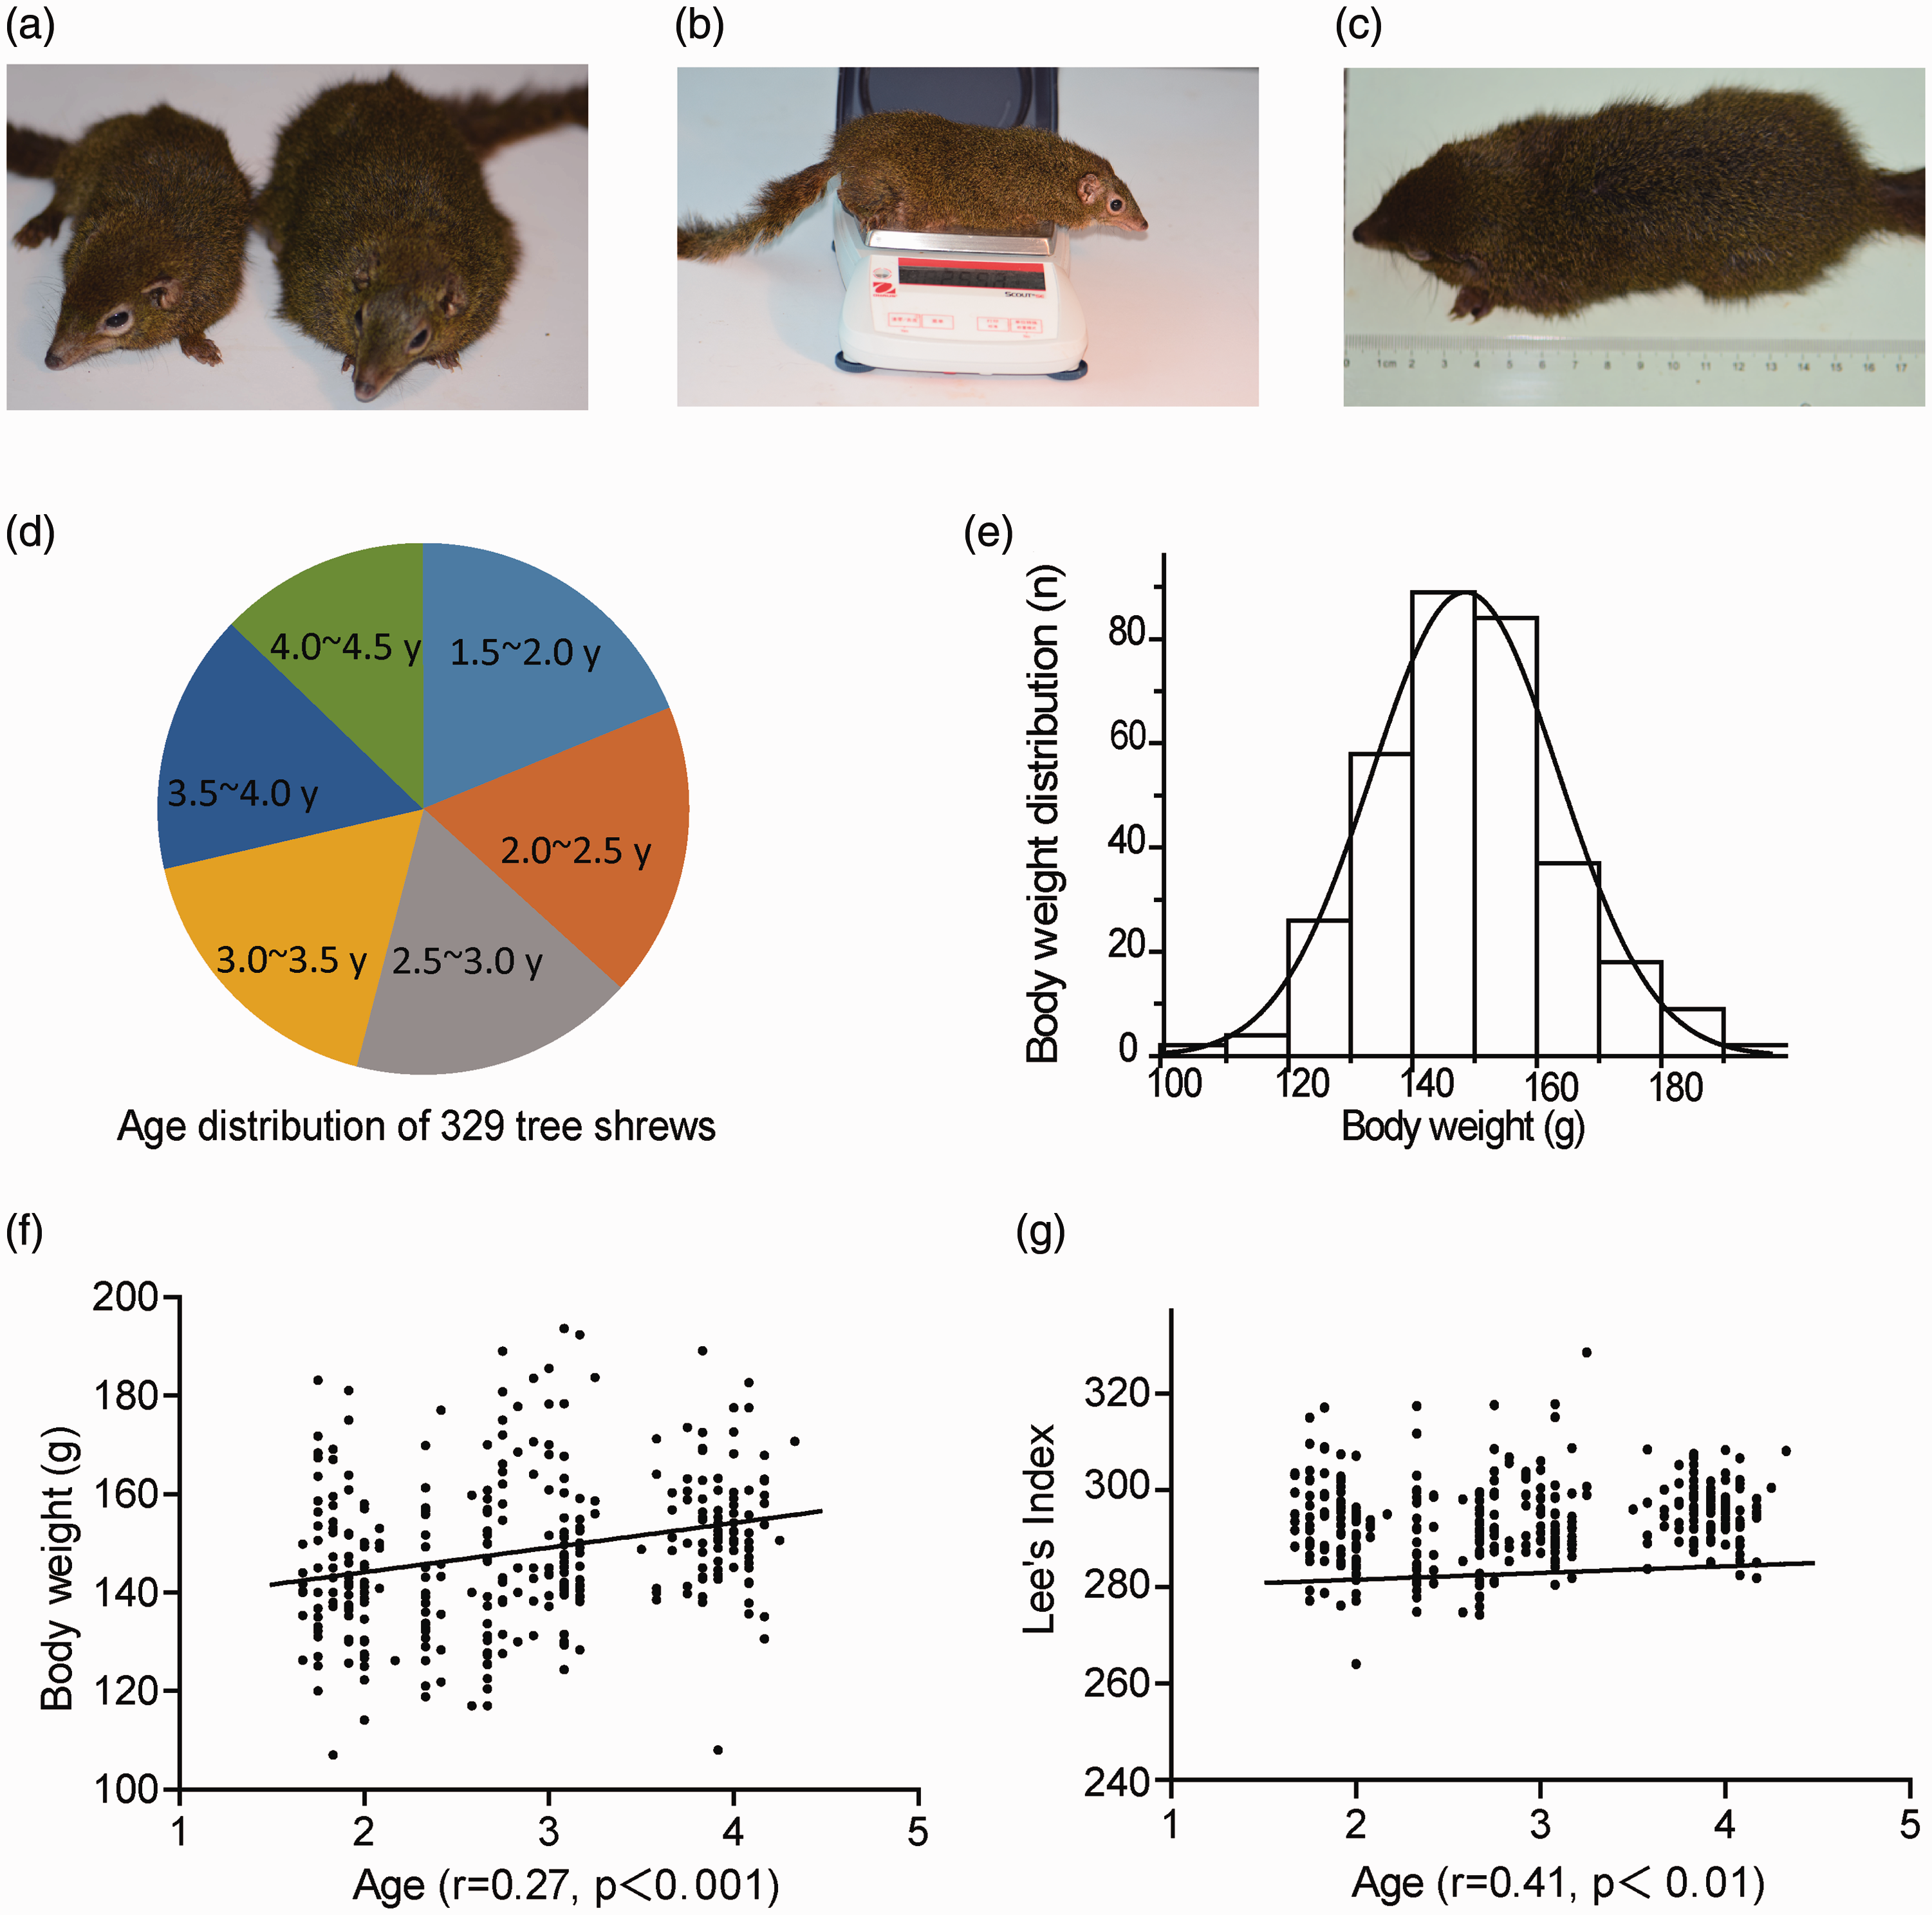
Survey of body weight and Lee’s index of tree shrews. (a) Obese tree shrew with lean counterpart. (b) Body weight measurement. (c) Body length measurement. (d) Age distribution. (e) Body weight distribution. (f) Correlation between body weight concentration and age in tree shrews. (g) Correlation between Lee’s index and age in tree shrews. (A color version of this figure is available in the online journal.)
Animals selected based on body weight, body length, and Lee’ index
The normally distributed body weight and Lee’s index for the entire population clearly showed that the degree of obesity varied widely in these animals. Based on the population distribution of body weight and Lee’s index, we categorized the animals into three groups: lean, moderate obesity, and severe obesity. Based on the above criteria, we selected 10 tree shrews. The body weight, Lee’s index, and abdominal circumference were significantly different among the three groups. The blood glucose concentration after fasting in severe and moderate obesity groups was significantly higher than that in the lean group. The level of serum HbA1c in the moderate obese tree shrews (7.83 ± 4.56) was the highest of the three groups. In spite of the numeral differences in fasting blood glucose and serum HbA1c concentrations, no statistically significant differences in these parameters were detected between any two groups. CT scan analysis showed 3 and 6-fold increases in total fat volume in the moderate and severe obese tree shrews, respectively, compared with the volume in the lean group. These results are typical of obese humans and other commonly utilized models of obesity.
Adipose tissues from four lean (L), three moderate obese (M), and three severe obese animals (O) were obtained for RNA-Seq for a total of 10 samples. Descriptive statistics for each obesity phenotype group are shown in Table 1. The average age of the selected tree shrews was between two and four years at slaughter.
Descriptive statistics (mean and standard deviation) and test of difference in means for a selection of obesity-related traits for the three subgroups.
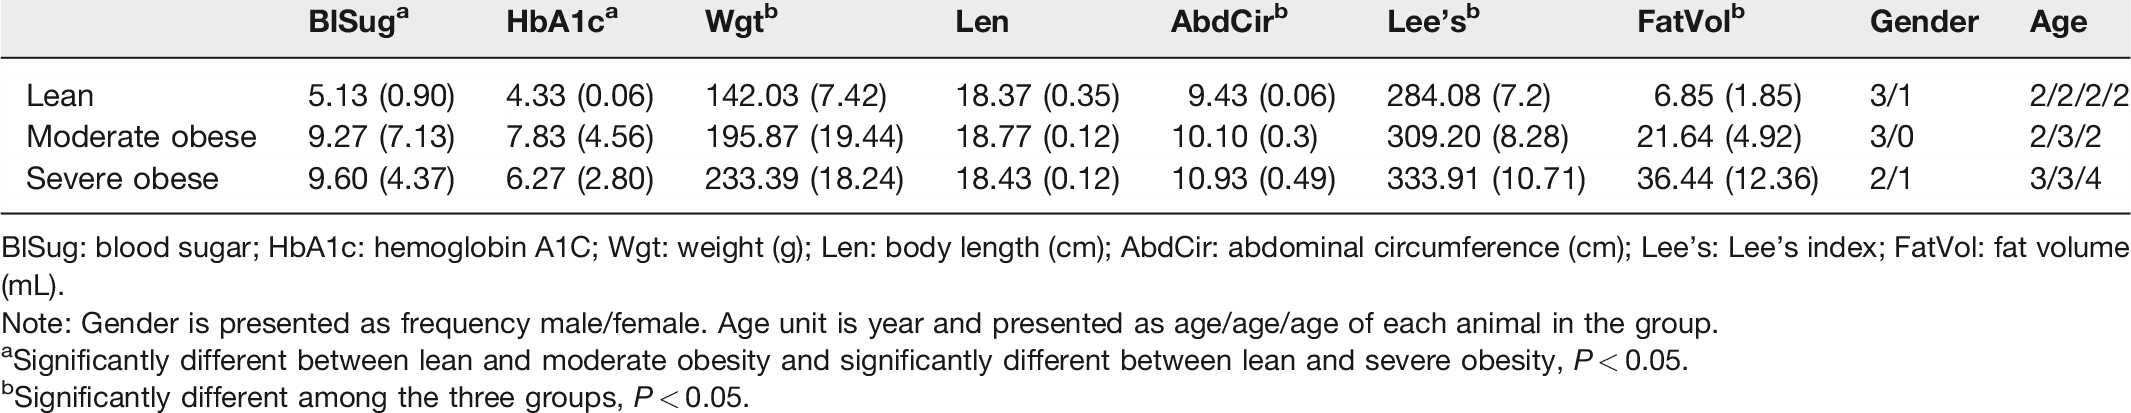
BlSug: blood sugar; HbA1c: hemoglobin A1C; Wgt: weight (g); Len: body length (cm); AbdCir: abdominal circumference (cm); Lee’s: Lee’s index; FatVol: fat volume (mL).
Note: Gender is presented as frequency male/female. Age unit is year and presented as age/age/age of each animal in the group.
aSignificantly different between lean and moderate obesity and significantly different between lean and severe obesity, P < 0.05.
bSignificantly different among the three groups, P < 0.05.
Differential gene/transcript expression
A total of 1679 DEGs were identified between M and L group, 6961 DEGs were identified between M and O group, and 6376 DEGs were identified between O and L group. We selected these DEGs (fold change >2) for subsequent bioinformatics analysis. The heat map of Pearson’s correlation matrix for the DEGs among the three extreme groups indicated that the three groups also differed at the transcriptomic level, consistent with the obesity phenotypes as shown in Figure 2(a). DEGs among the three groups are shown together in Figure 2(b) by Venn diagram. The obtained clean data were submitted to NCBI Sequence Read Archive database (accession number: PRJNA310673).
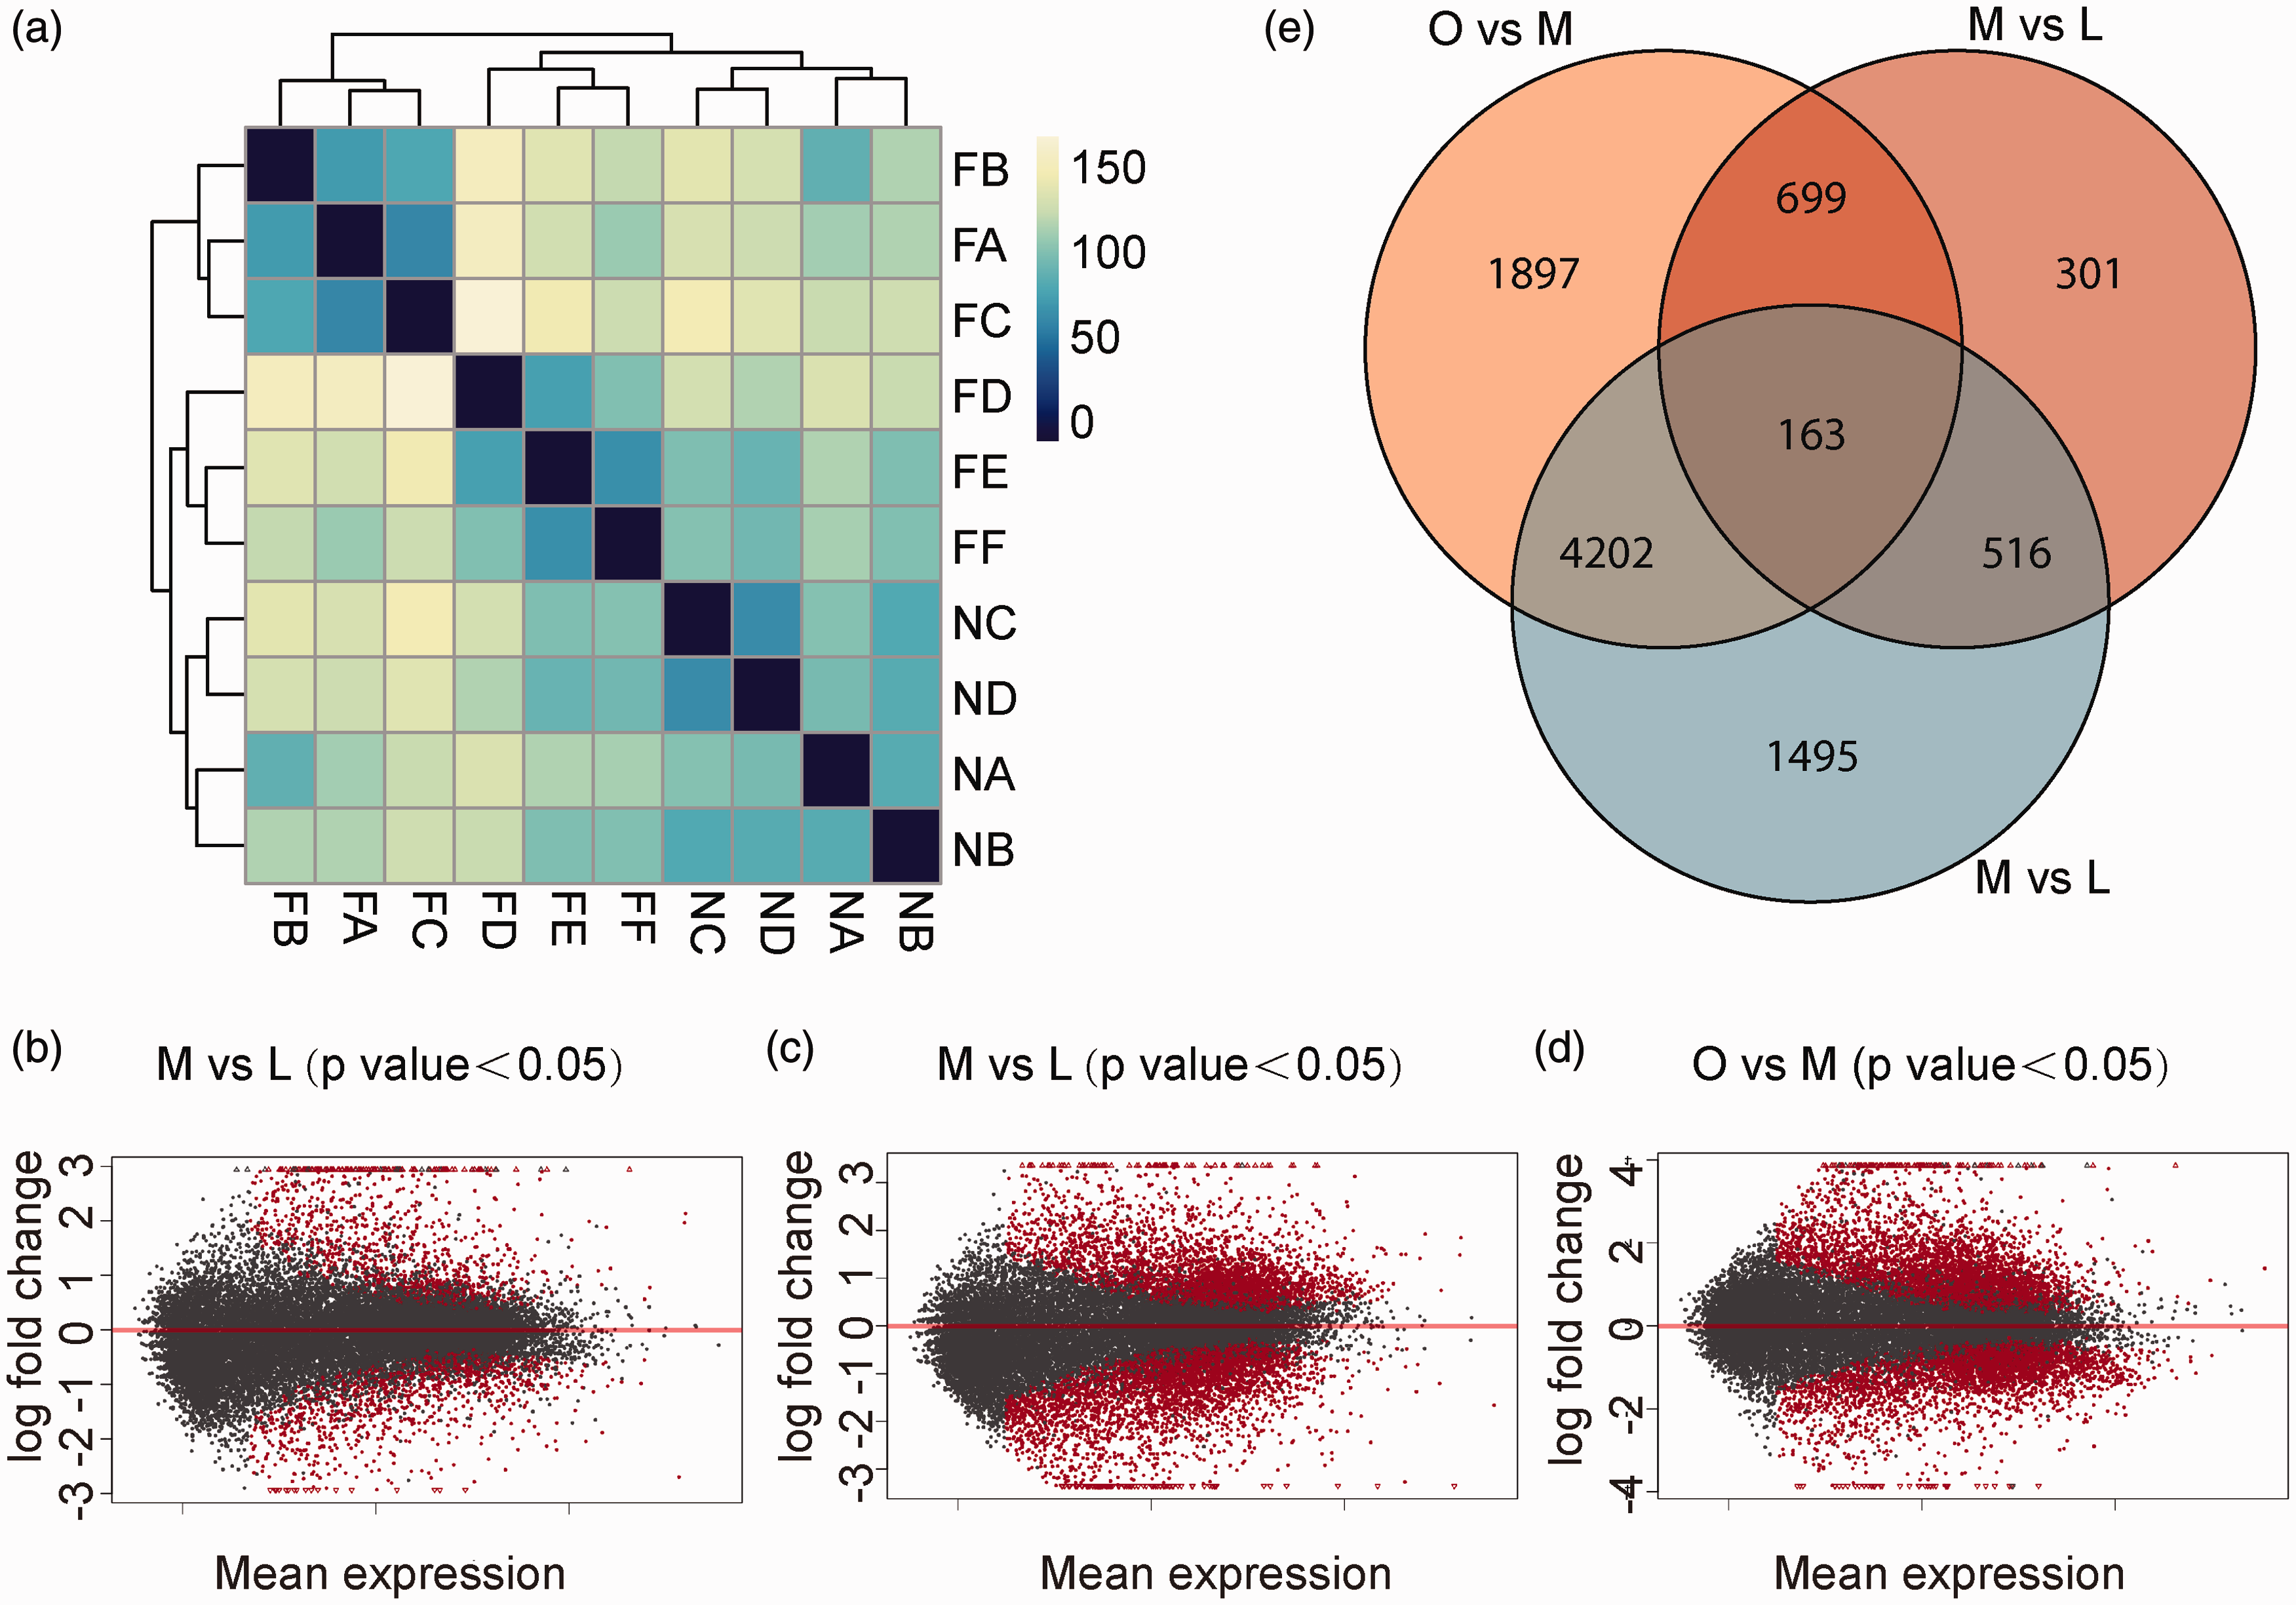
Differentially expressed genes (DEGs). (a) Pearson correlation matrix of transcriptome data. (b) The mean expression distribution of DEGs between M vs L group. (c) The mean expression distribution of DEGs between O vs M group. (d) The mean expression distribution of DEGs between O vs L group. (e) Venn diagram of DEGs among 3 groups. (A color version of this figure is available in the online journal.)
WGCNA
We employed WGCNA to evaluate the RNA-Seq data. The WGCNA assumes that highly co-expressed genes work cooperatively, contributing to the corresponding phenotype. The network was constructed using 7115 count genes. Strongly co-expressed genes in clusters (modules) were found and assigned to module colors as shown in Figure 3(a). In all, we found three modules with each covering at least 300 genes.
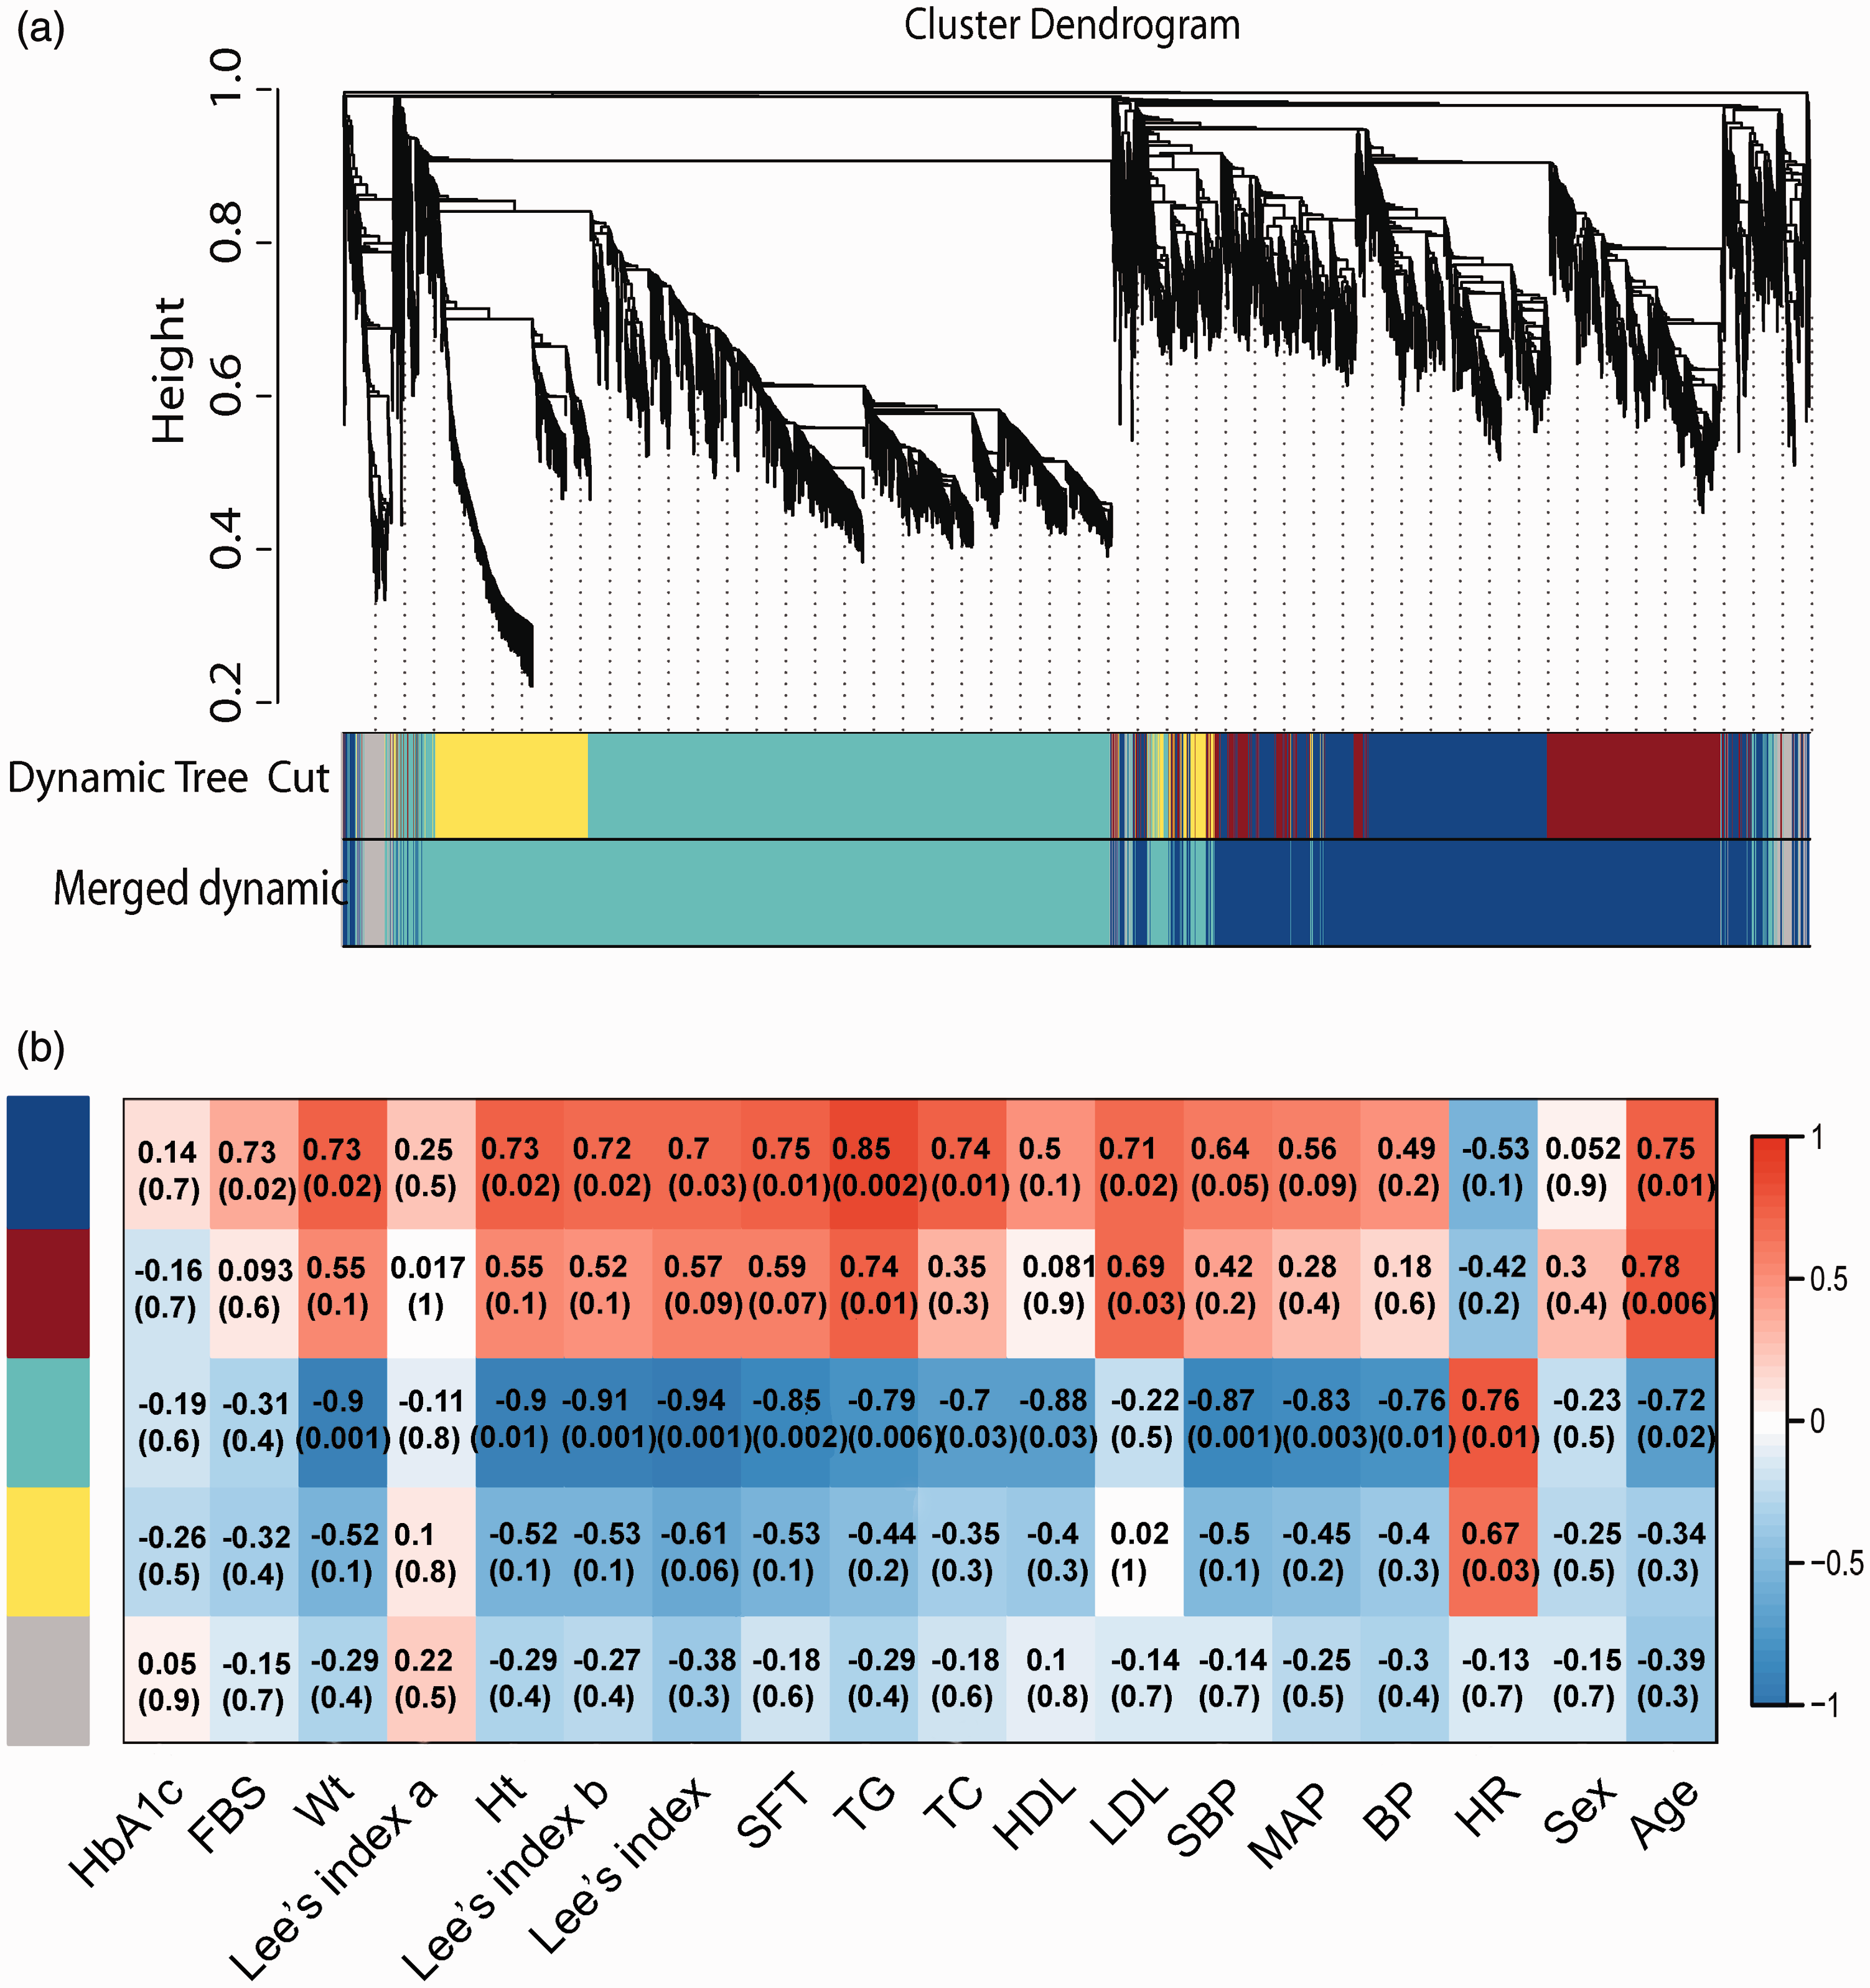
WGCNA results. (a) Average linkage clustering tree (dendrogram) defined by WGCNA representing the co-expression modules. Branches of the dendrogram correspond to modules labeled with different colors below the dendrogram. (b) MTRs and matching P-values between the modules and their related traits. The discovered modules are on the y-axis, and the discovered traits are on the x-axis. Other color rows showed the MTRs’ degree of correlation. Red indicates a strong positive association; blue indicates a strong negative correlation. HbA1c: glycated hemoglobin; FBS: fasting blood sugar: Wt: weight: Ht: height; Lee’s index a/b: results of intermediate calculation of Lee’s index; SFT: subcutaneous fat thickness; TG: triglycerides; TC: total cholesterol; HDL: high density lipoproteins; LDL: low density lipoproteins; SBP: systolic pressure; MAP: mean arterial pressure; BP: blood pressure; HR: heart rate. (A color version of this figure is available in the online journal.)
An eigengene was calculated, representing each module to explain the gene expression variation. The module-trait relationships (MTRs) were measured by linking the eigengene to the traits. Then, MTRs were used to select relevant modules for further analysis as shown in Figure 3(b). Based on the criteria of both MTRs > 0.5 and their gene intra-modular connectivity mentioned previously, we selected three modules for further annotation: The blue module (481 genes), the brown module (389 genes), and the turquoise module (1781 genes).
Functional enrichment of DEGs in modules
We found enriched GO terms and KEGG pathways in the three modules. P-values were adjusted using the Benjamini-Hochberg (BH) correction. We selectively showed the top 10 significant GO biological process terms and all the significant KEGG pathways as shown in Supplementary Table 1.
The most interesting and relevant module was the blue module, which showed high MTRs with obesity-related traits, such as triglycerides (0.85), subcutaneous fat thickness (0.75), and age (0.75). The genes in the blue module were highly expressed in obese tree shrews and showed low expression in lean tree shrews. This module showed significant translation and metabolism-related GO terms and KEGG pathways after BH correction. The most enriched GO term was a multi-organism metabolic process (Padj = 2.93E-39). The highest enriched pathways were related to pyrimidine, purine, and cysteine metabolism.
Enrichment analysis of KEGG pathways found five pathways at the P <0.05 level. The most notable were the “ribosome,” “spliceosome,” and “RNA polymerase” pathways. The enriched pathways and contained genes are collectively presented in Supplementary Table 2. The fourth significant KEGG pathway was “protein processing in the endoplasmic reticulum (ER),” with protein translation, folding, sorting, and degradation occurring in the ER. The ER can also coordinate various cellular processes through unfolded protein response (UPR) signaling. Obesity murine models are accompanied by chronic UPR activation in liver and/or adipose tissues. 25
The brown module (eigengene) exhibited an overrepresentation of immune stress relevant GO terms and KEGG pathways, e.g. 83 genes enriched in immune system processes (Padj =6.75E-12) and 102 genes enriched in the regulation of response to stimulus (Padj =7.36E-07) in GO biological processes. These expression profiles are consistent with previous studies. Much previous works demonstrate chronic inflammation in hypertrophied adipocytes and increased levels of proinflammatory cytokines. Macrophages play a key role in the initiation and exacerbation of the inflammatory state in obesity. 26 Phagocytosis is a primary mechanism used to remove pathogens and cell debris by fusing phagosome and lysosomes to form a phagolysosome in macrophages. As expected for the 389 genes whose module membership was greater than 0.9, we observed the phagocytosis-related GO pathways, e. g. “endocytosis” (Padj =0.001) and “phagocytosis” (Padj =0.001). The most significant pathway was also phagocytosis-related. A significant immune-related KEGG pathway was “natural killer cell-mediated cytotoxicity” (Padj =0.0077). High BMI in tree shrews is associated with “increased activation of peripheral NK cells.” A recent study reported that the activated NK cells in obesity patients were hard to degranulate or to produce signal cytokines. Thus, constant stimulation of NK cells may lead to an abnormal response, which could make obese individuals more susceptible to infectious diseases. 27 The cellular responses to stimulus and inflammation can inhibit or activate one another. The immune system regulates the cellular stress through signaling proteins and pathways, e.g. “regulation of response to stimulus” (GO: 0048583, Padj =1.76E-11), “regulation of immune response-regulating cell surface receptor signaling pathway” (GO: 0002768, Padj =6.78E-11), ultimately causing metabolic changes and subsequently altered insulin sensitivity.
The turquoise module showed a strong negative correlation with Lee’s index (−0.94). The module also showed significant signaling-related GO terms and KEGG pathways. We identified 13 pathways at the level P <0.05. Notable among the pathways were “ubiquitin-mediated proteolysis” (Padj =1.60E-05), “phosphatidylinositol signaling system” (Padj =0.00562), “TGF-beta signaling pathway” (Padj =0.012), and “mTOR signaling pathway” (Padj =0.017).
To further elucidate the enriched trend of each module, we selected the top 50 eigengenes in each module to demonstrate the expression levels of the genes therein. The genes in the blue module were highly expressed in severe obesity, moderately expressed in moderate obesity, and expressed at low levels in lean animals as shown in Figure 4(a). The genes in the brown module were highly expressed in both severe obesity and moderate obesity and expressed in low levels in lean animals as shown in Figure 4(b).
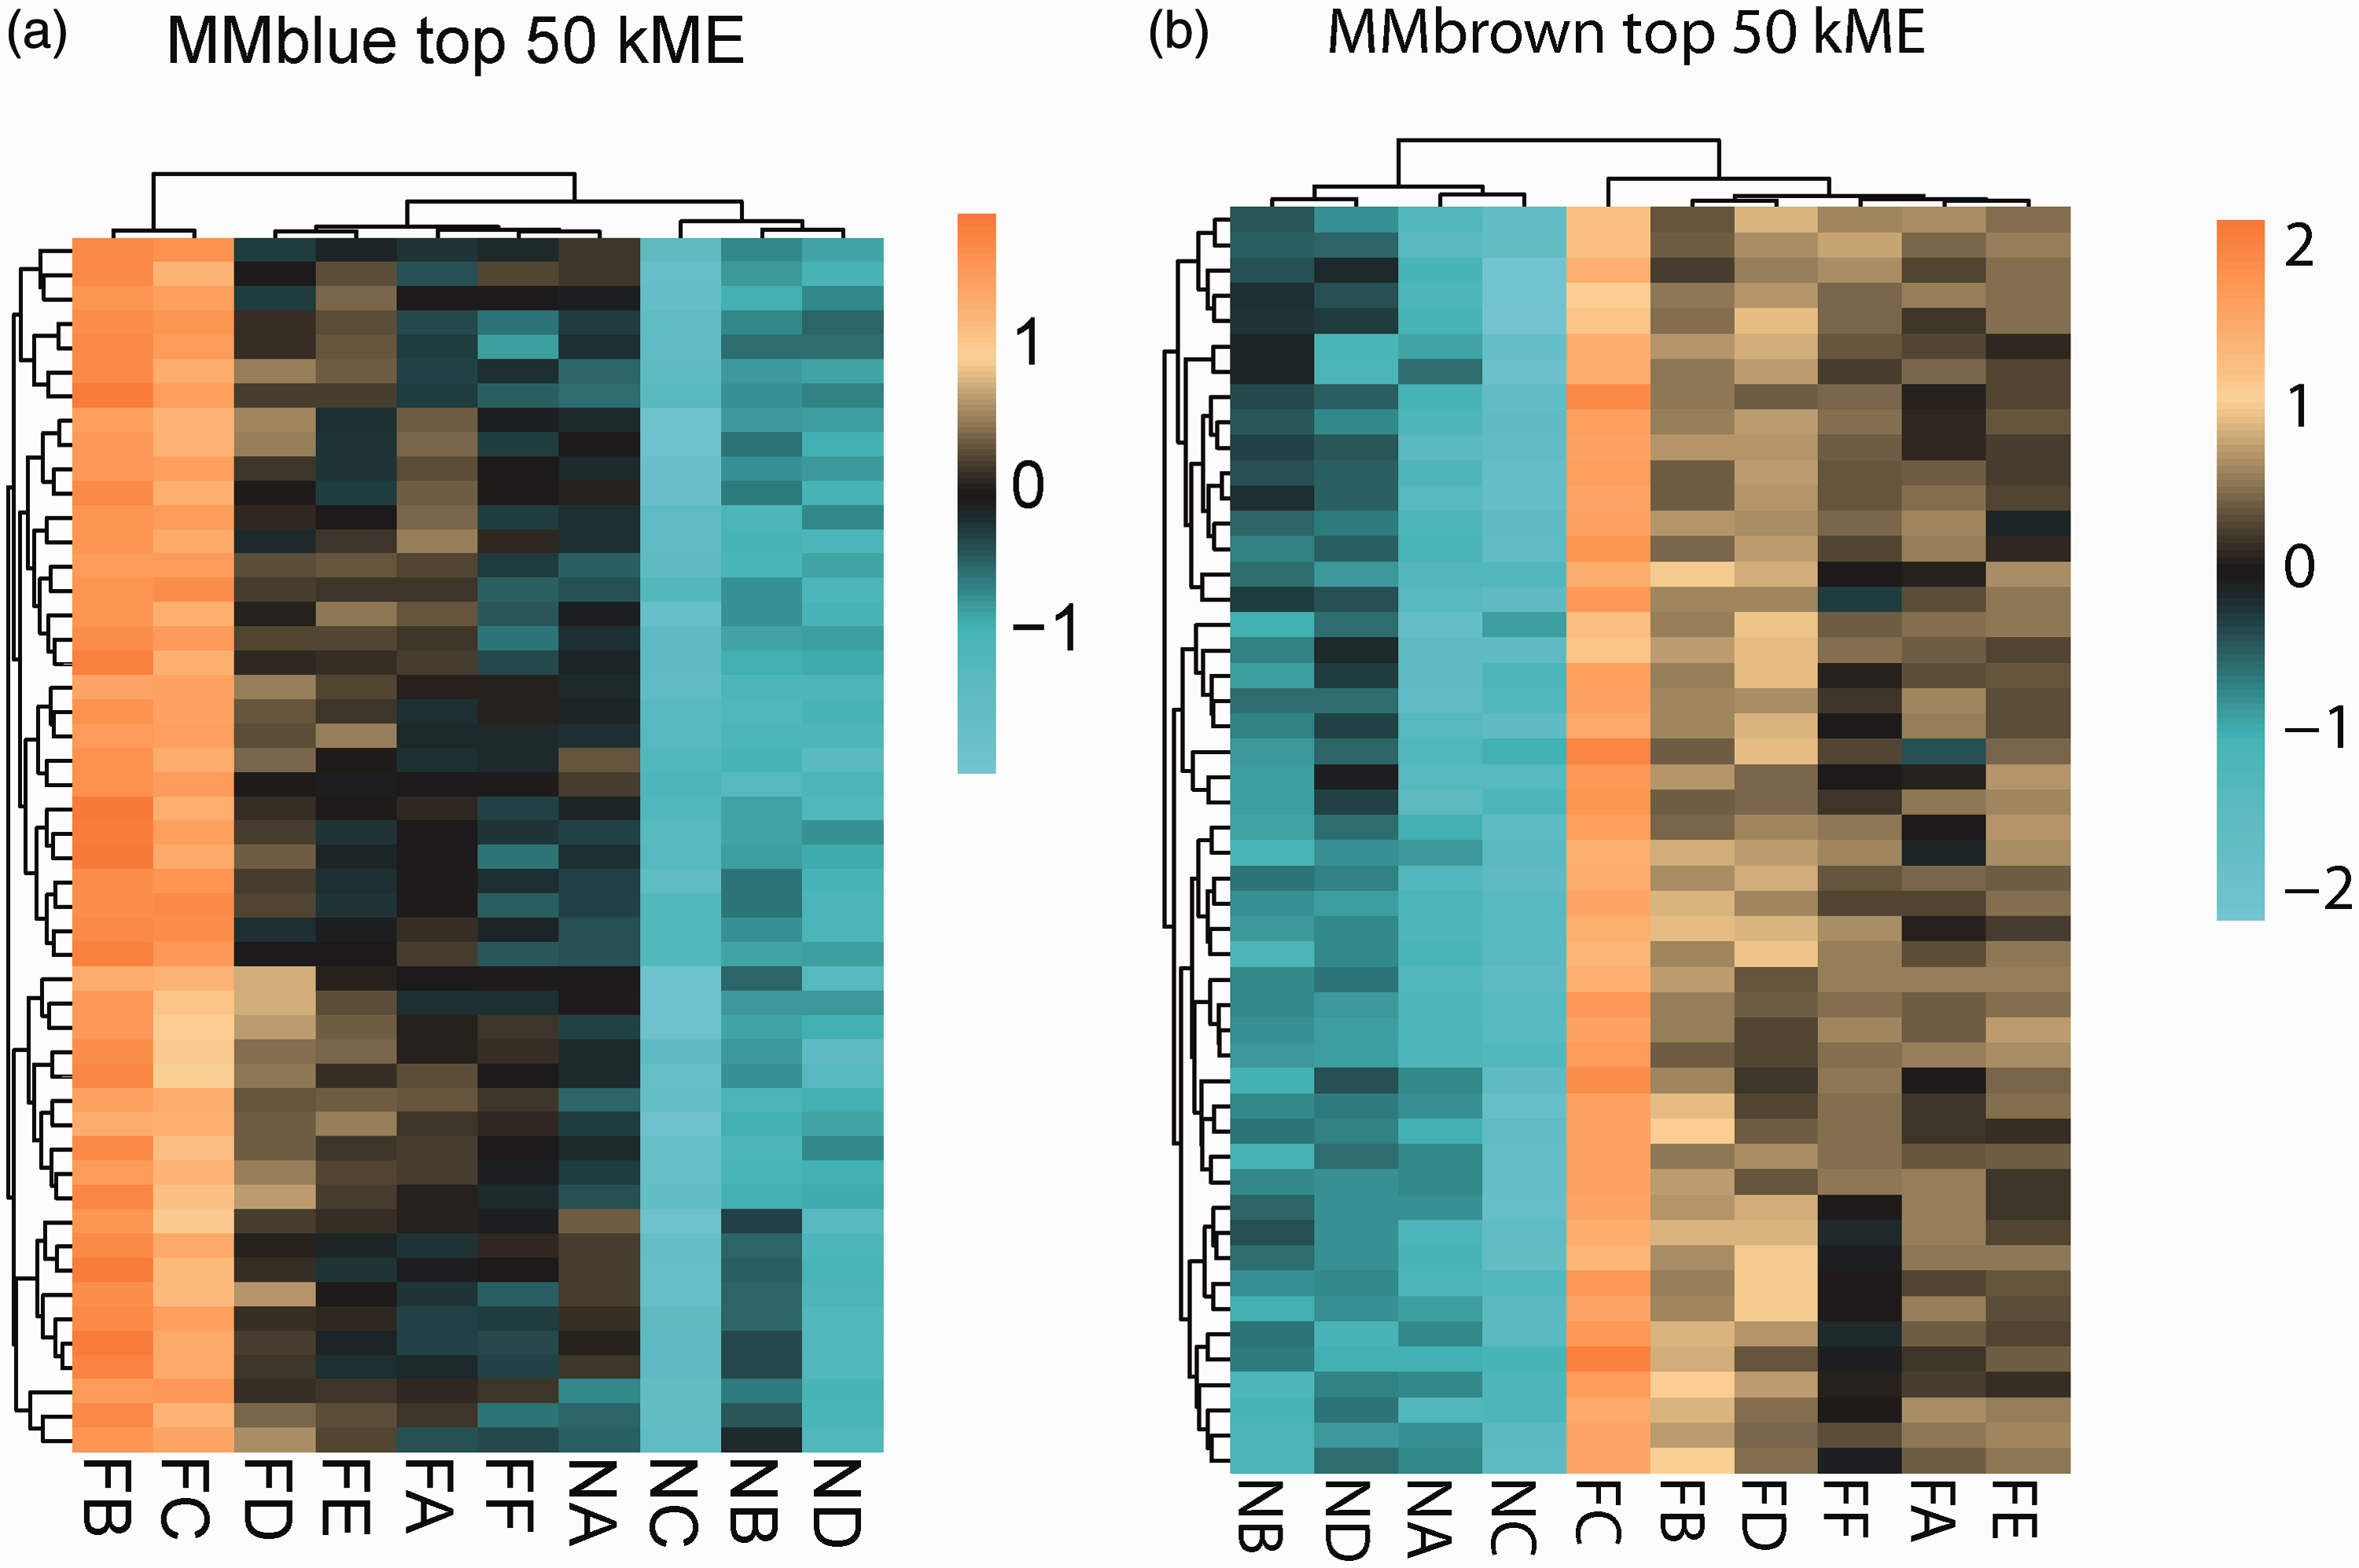
Expression profile of top 50 highly expressed genes in blue and brown module and GO (biological process)/KEGG analysis. (a) Expression levels of the top 50 highly expressed genes in blue module. (b) Expression levels of the top 50 highly expressed genes in brown module. (A color version of this figure is available in the online journal.)
GO/KEG analysis
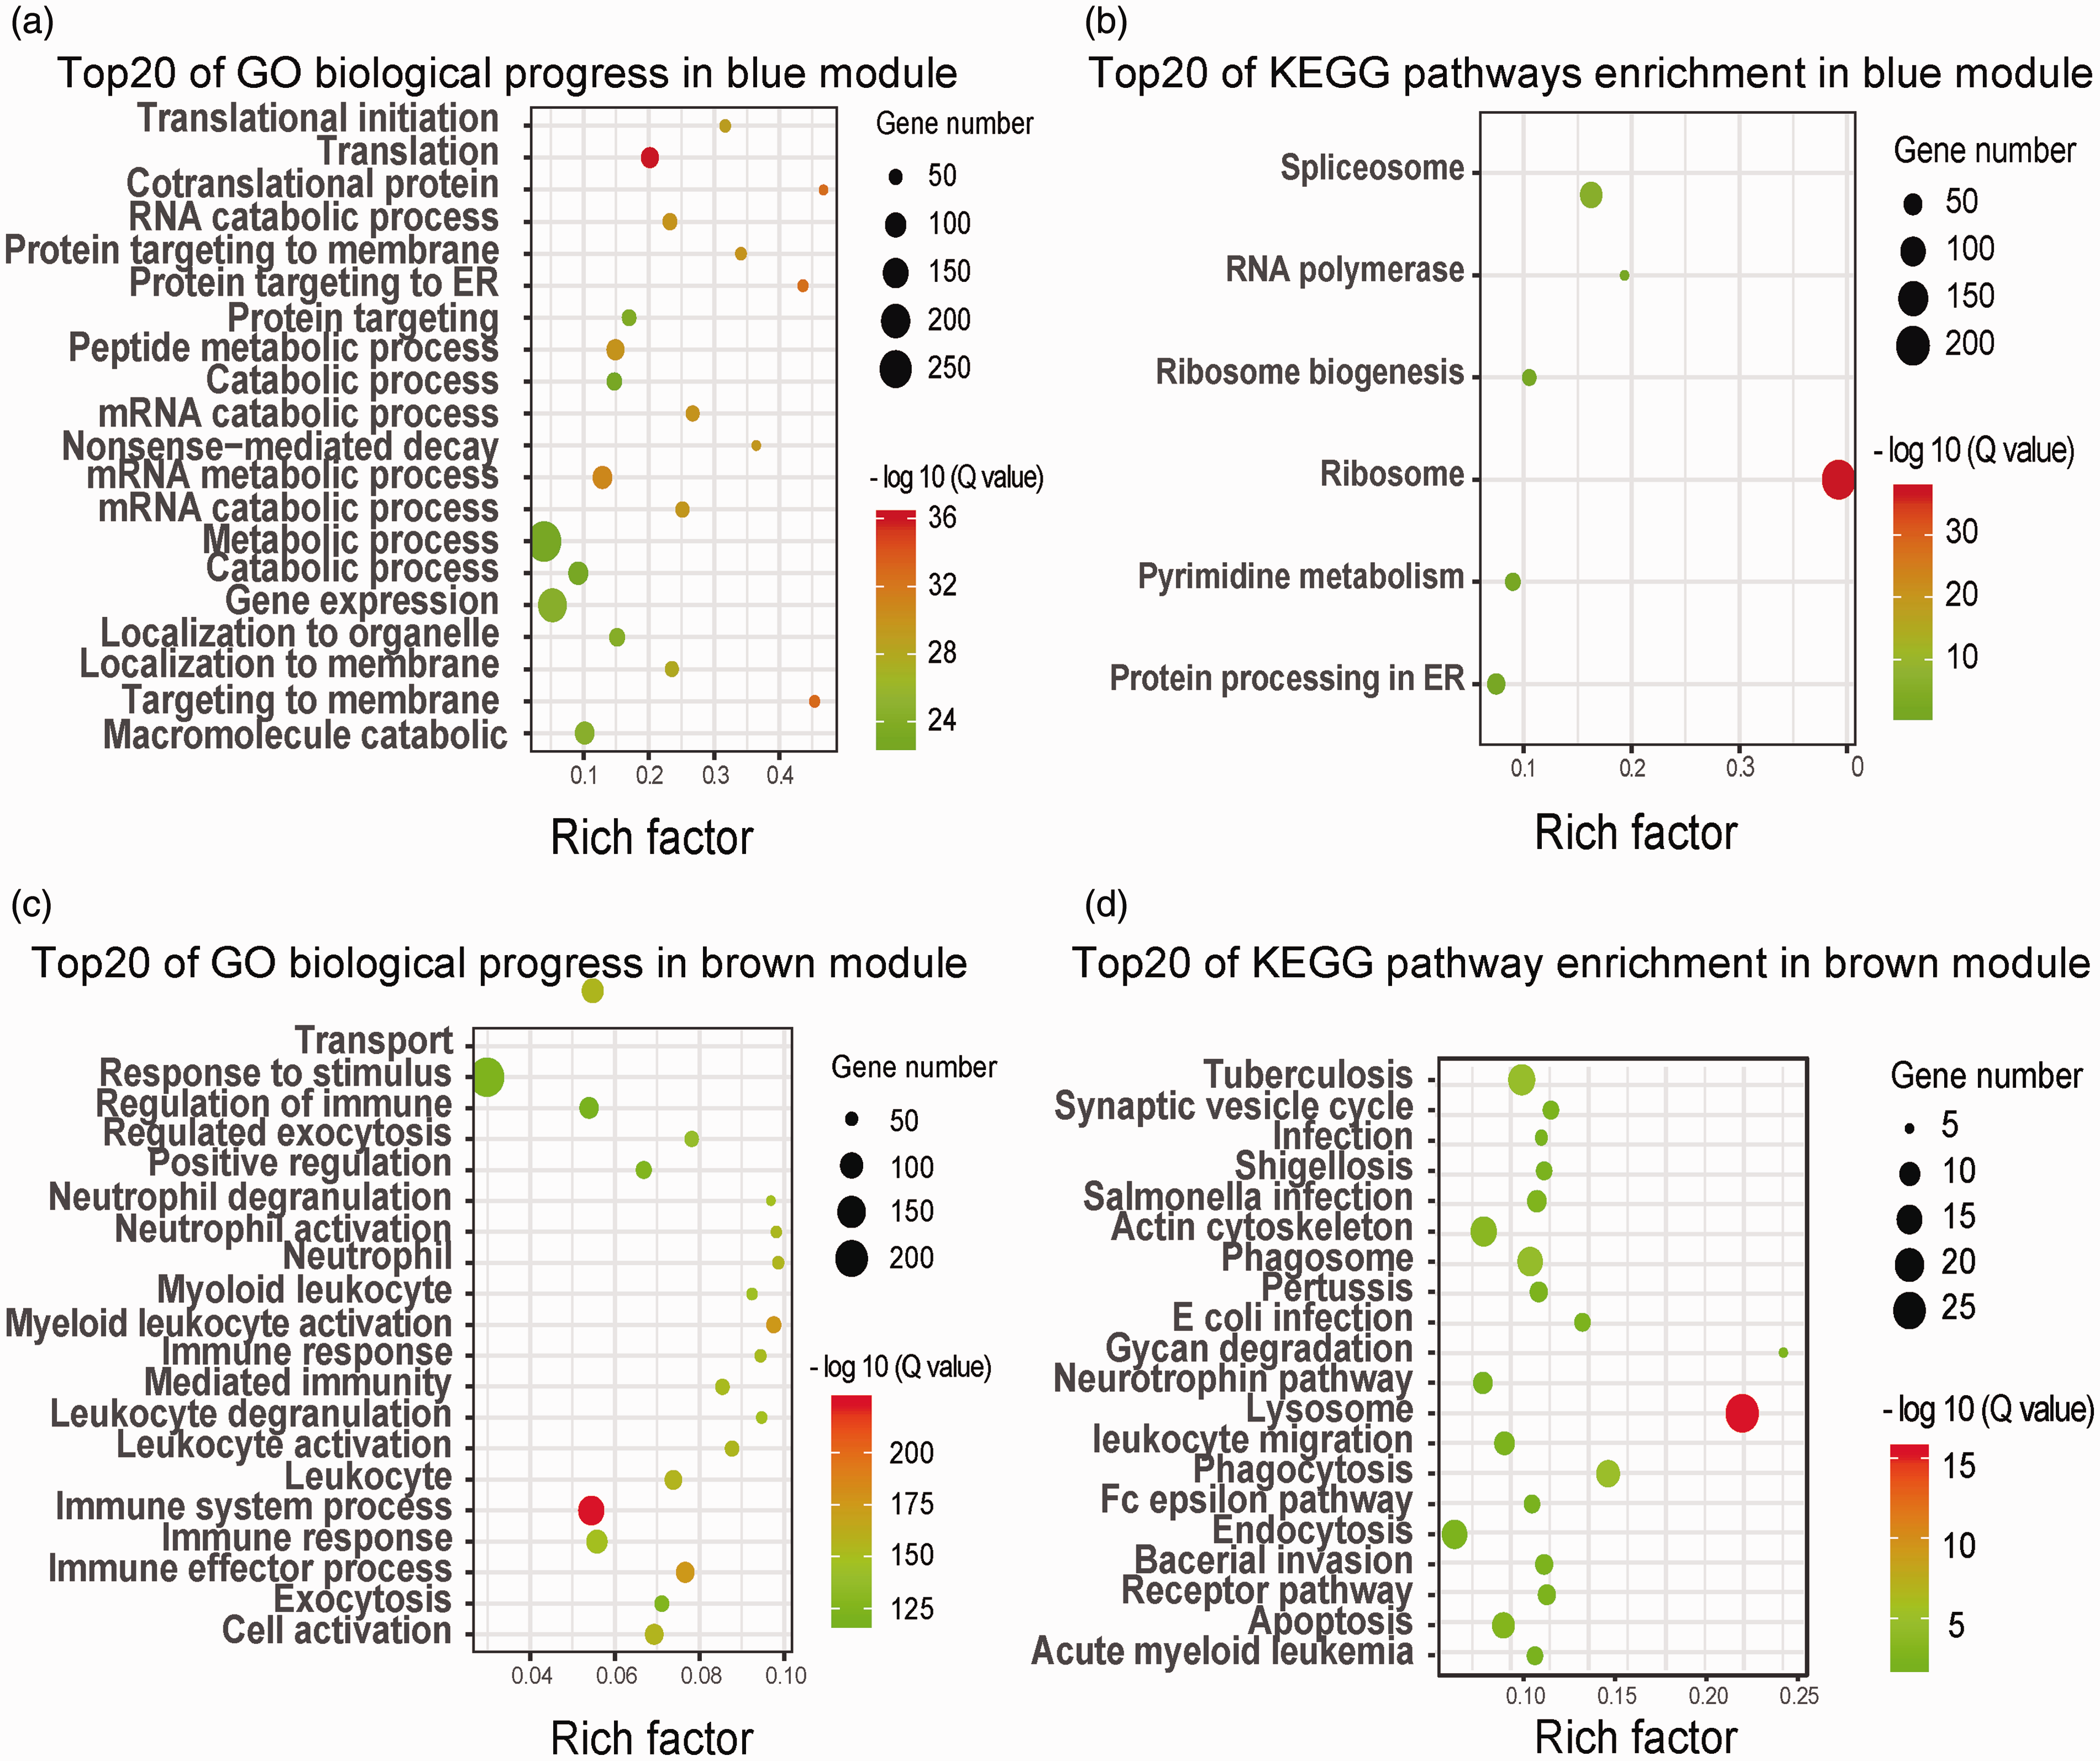
The GO/KEGG pathways of the genes in the blue are shown in Figure 5(a) and (b) and brown modules are shown in Figure 5(c) and (d) were further analyzed to show the most relevant GO biological process terms and pathways.
PPI regulatory network and hub gene verification by qPCR. (a) Top 20 gene relationships in blue module. (B) Top 20 gene relationships in brown module. (c) Top 20 gene relationships in turquoise module. (d) The analysis of TFs regulatory network. The pink and green nodes stand for the key genes identified by previous analysis and the TFs that have regulatory function, respectively. (e) The relative expression of AKT1 in 3 different obesity phonotype groups. (f) The relative expression of UBA52 in 3 different obesity phonotype groups. (A color version of this figure is available in the online journal.)
PPI regulatory network analysis of different modules and analysis of the TFs of marker genes
A PPI regulatory network of the top 20 genes in degree in three modules, including 20 up-regulated genes in the blue/brown modules and 20 down-regulated genes in the turquoise module, was constructed. Top 20 genes in the blue module consisted of 20 nodes and 137 edges as shown in Figure 6(a). Top 20 genes in the brown module consisted of 20 nodes and 35 edges as shown in Figure 6(b). Top 20 genes in the turquoise module consisted of 20 nodes and 79 edges as shown in Figure 6(c).
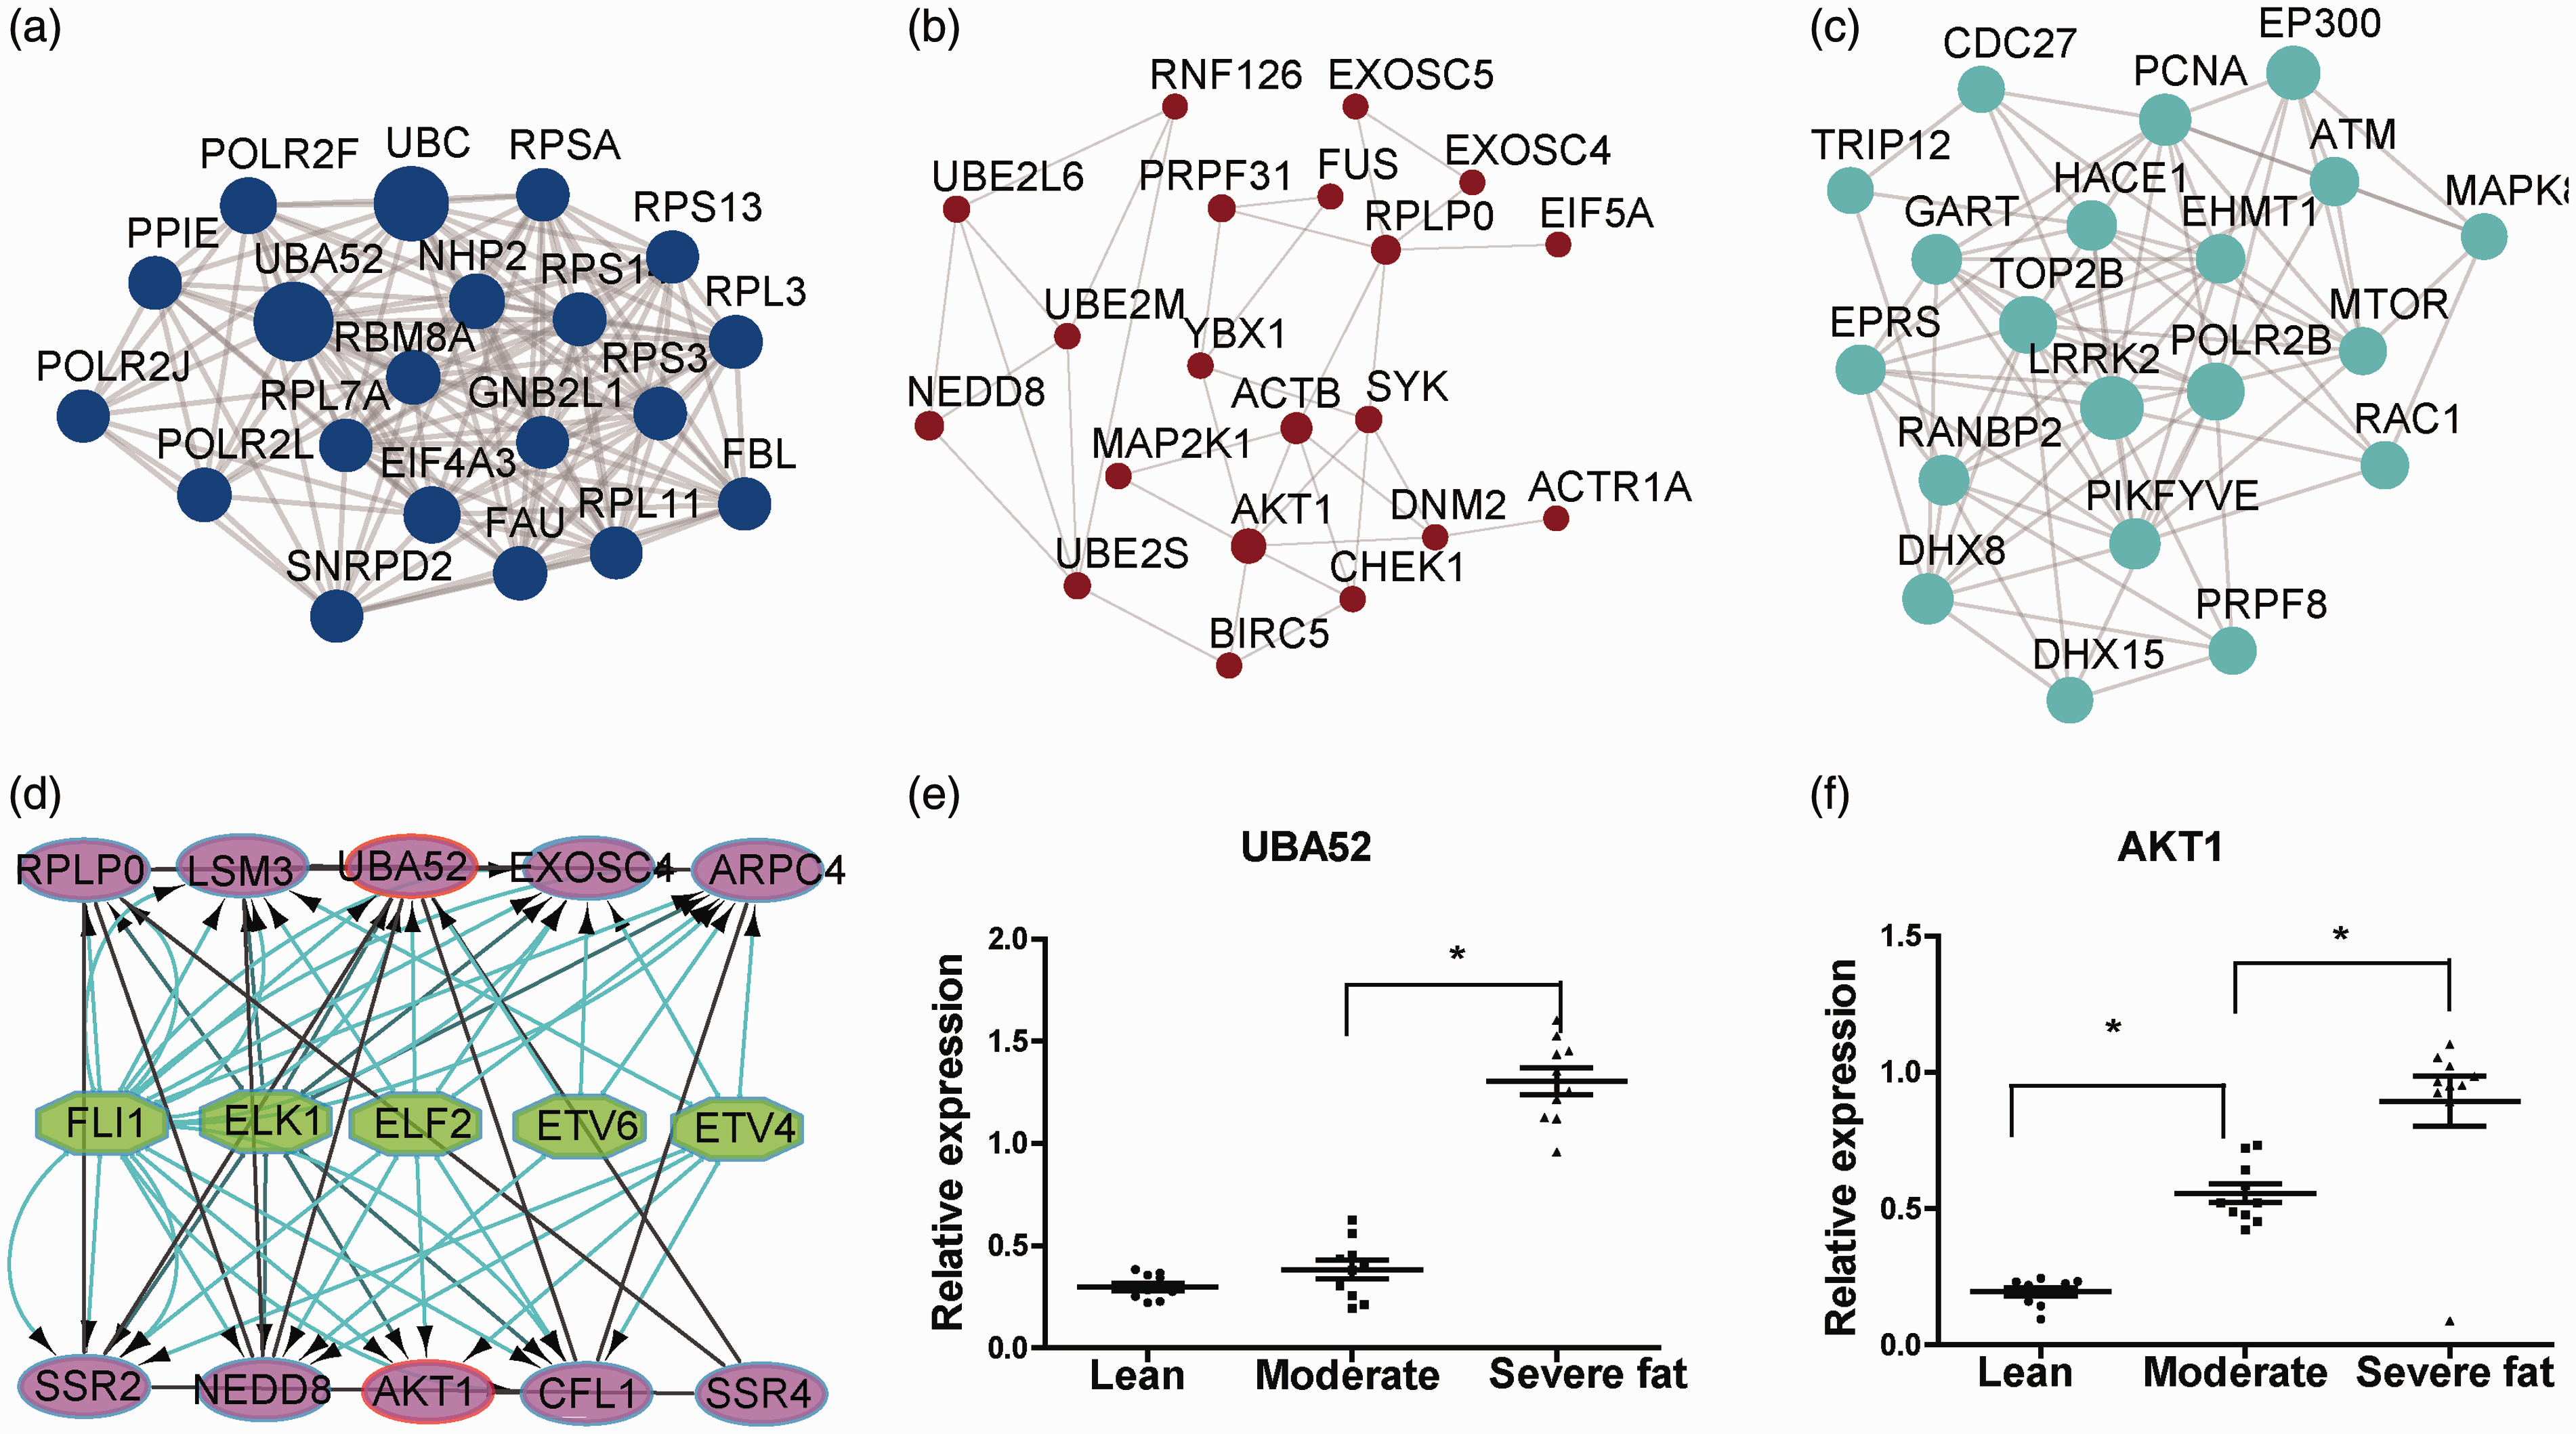
PPI regulatory network and hub gene verification by qPCR. (a) Top 20 gene relationships in blue module. (b) Top 20 gene relationships in brown module. (c) Top 20 gene relationships in turquoise module. (d) The analysis of TFs regulatory network. The pink and green nodes stand for the key genes identified by previous analysis and the TFs that have regulatory function, respectively. (e) The relative expression of AKT1 in 3 different obesity phonotype groups. (f) The relative expression of UBA52 in 3 different obesity phonotype groups. (A color version of this figure is available in the online journal.)
AKT1, RPLP0, NEDD8, SSR4, SSR2, EXOSC4, LSM3, ARPC4, and CFL1 belonged to both blue and brown modules (intra-modular connectivity > 0.9 in both modules). All nine shared genes are highly conserved in all species, including humans. We further identified AKT1 as the hub gene of this PPI network in the blue and brown modules using the same strategy according to node degree. Nine shared genes and hub gene UBA52 in the blue module were used for further analysis and are reportedly linked with obesity. We further analyzed the TFs’ regulatory network of these genes. We found that five TFs with the highest NES was: FLI1, ELK1, ELF2, ETV6 and ETV4 as shown in Figure 6(d).
Validation of hub genes in obesity samples
We selected the AKT1 and UBA 52 as hub genes of positively correlated modules for certification. RT-PCR was conducted to measure the expression of 2 hub genes in adipose tissue from 10 normal, 10 moderate obesity, and 10 severe obesity tree shrews. The expression of AKT1 was up-regulated in moderate obesity group and severe obesity group compared to the normal group as shown in Figure 6(e). The expression of UBA52 was unchanged in moderate obesity group and significantly up-regulated in severe obesity group compared to the normal group as shown in Figure 6(f).
Discussion
Obesity is a complicated metabolic and multifactorial status strongly associated with metabolic diseases, such as cancer, insulin resistance, and cardiovascular disease, 28 leading to public health burden and economic cost. 29 Obesity in humans is classified according to the body mass index (BMI), which is divided into three categories: normal BMI (18.5–24.9 kg/m2), moderate obesity (25.0–34.9 kg/m2), and severe obesity (35.0–50.1 kg/m2) (Thagaard et al., 2017). 29 A BMI of 30 or higher in humans is currently classified as a disease. 29 To identify the co-expressed genes network for the progression of obesity may provide an entry point for the molecular pathogenesis of obesity.
Notably, obesity phenotypes were similar in our artificial breeding tree shrews. In this study, we characterized the spontaneous obesity phenotypes of tree shrew for the first time and explored the possible mechanism of obesity development based on the transcriptomic data. Like the phenotypes, the transcriptomic data of 10 tree shrews clustered in lean, moderate, and severe obesity groups. Clear between-group differences from RNA-Seq data were detected among the three groups.
WGCNA revealed some specific pathways that might play an important role in the progression of obesity (e.g. translational and metabolic pathways in the blue module, immune and stress-related pathways in the brown module, and signal pathways in the turquoise module). Particularly, WGCNA revealed highly co-expressed genes in clusters.
Some of these genes were related to translation-relevant pathways in the blue module, e.g. the “ribosome,” “spliceosome,” “RNA polymerase,” and “protein processing in the ER” pathways in the obese cohort. In obese animals, an increase in protein synthesis resulted in the increased ribosomal pathways and was accounting for the increase in energy demands. 30
The brown module contained genes previously associated with immune function and stress, which confirmed the accepted close relation between obesity and other metabolic disorders, e.g. congenital disorders of metabolism (Padj = 4.80E-07), immune system diseases (Padj = 0.0001.3907–04), and cancers (Padj = 1.98E-03).
Because we focused mostly on up-regulated genes, we further identified AKT1, which belonged to both blue and brown modules, as the hub gene of this PPI network according to node degree. We also obtained the highest degree genes in each module, which were UBA52 in the blue module, AKT1 in the brown module, and LRRK2 in the turquoise module.
UBA52 is the abbreviation of ubiquitin A-52 residue ribosomal protein fusion product 1. UBA52 not only supplies ubiquitin but also regulates the ribosomal protein complex. In previous studies, UBA52 was a key player in both ubiquitin-related cell cycle control and the ribosome complex in translational processes. 31 In the present study, obese tree shrews exhibited up-regulation of UBA52 at the mRNA level, suggesting its contribution to obesity possible via interference with the cell cycle and the ribosome complex.
LRRK2 is the abbreviation for leucine-rich repeat kinase 2. Because it contains multiple conserved domains, the lrrk2 protein could interplay with many other proteins. In previous studies, LRRK2 kinase activity changes are associated with activation of the cellular death process and autophagy. Mutations in LRRK2 correlate with inherited and sporadic Parkinson’s disease. So, its contribution to obesity is possible via interference with cell death and autophagy in accordance with cellular nutrient conditions. 32
Akt1 is a conserved serine/threonine kinase that regulates and controls cell cycle progression, cell growth, cell metabolism, and cell survival in many tissues and cell types. Shearin et al. 33 reported that lack of AKT in adipocytes causes severe lipodystrophy. Wan et al. 34 reported that loss of AKT1 increased energy expenditure and protected against diet-induced obesity in rats. In the present study, severe obese tree shrews exhibited up-regulation of AKT1 at the mRNA level, whereas moderate obese and lean tree shrews exhibited the same level of AKT1 mRNA expression, suggesting that AKT1 contributes to severe obesity development possibly via interference with signaling pathways and is a very important molecule linking severe obesity to cancer and diabetes. 34
System biology approaches are advantageous in unraveling transcriptional architecture of complex diseases. We found the mRNA network, pathways, and hub genes that were related to obesity. Furthermore, the tree shrew with different obesity phenotypes is a potentially useful model for studying the association of obesity with other diseases.
Conclusions
System biology approaches are advantageous in unraveling transcriptional architecture of complex diseases. We found the mRNA network, pathways and hub genes that were related to obesity. Furthermore, the tree shrew with different obesity phenotypes is a potentially useful model for studying the association of obesity with other diseases.
Supplemental Material
EMS915180 Supplemental Material - Supplemental material for WGCNA analysis of the subcutaneous fat transcriptome in a novel tree shrew model
Supplemental material, EMS915180 Supplemental Material for WGCNA analysis of the subcutaneous fat transcriptome in a novel tree shrew model by Yuanyuan Han, Wenguang Wang, Jie Jia, Xiaomei Sun, Dexuan Kuang, Pinfen Tong, Na Li, Caixia Lu, Huatang Zhang and Jiejie Dai in Experimental Biology and Medicine
Footnotes
Authors’ contributions
All authors participated in the design, interpretation of the studies and analysis of the data and review of the manuscript; Wenguang Wang, Jie Jia, Xiaomei Sun, and Dexuan Kuang conducted the experiments, Yuanyuan Han wrote the manuscript.
DECLARATION OF CONFLICTING INTERESTS
The author(s) declared no potential conflicts of interest with respect to the research, authorship, and/or publication of this article.
FUNDING
The author(s) disclosed receipt of the following financial support for the research, authorship, and/or publication of this article: The Yunnan science and technology talent and platform program (2017HC019), the Joint Support for the National Program of Yunnan Province (grant no. 2015GA009) and the Yunnan Province major science and technology project (2017ZF007) supported this study.
SUPPLEMENTAL MATERIAL
Supplemental material for this article is available online.