
Abstract
This study aimed to track and evaluate the effect of low-dose irisin on the browning of white adipose tissue (WAT) in mice using magnetic resonance imaging (MRI) noninvasively in vivo. Mature white adipocytes extracted from mice were cultured, induced and characterized before being treated by irisin. The volume and fat fraction of WAT were quantified using MRI in normal chow diet and high fat mice after injection of irisin. The browning of cultured white adipocytes and WAT in mice were validated by immunohistochemistry and western blotting for uncoupling protein 1 (UCP1) and deiodinase type II (DIO2). The serum indexes were examined with high fat diet after irisin intervention. UCP1 and DIO2 in adipocytes showed increases responding to the irisin treatment. The size of white adipocytes in mice receiving irisin intervention was reduced. MRI measured volumes and fat fraction of WAT were significantly lower after Irisin treatment. Blood glucose and cholesterol levels were reduced in high fat diet mice after irisin treatment. Irisin intervention exerted browning of WAT, resulting reduction of volume and fat fraction of WAT as measured by MRI. Furthermore, it improved the condition of mice with diet-induced obesity and related metabolic disorders.
Impact statement
Irisin can be used to activate and facilitate browning of WAT for treating obesity-related metabolic diseases and disorders. MRI is capable of noninvasively monitoring the process of WAT browning and the effect of irisin intervention.
Introduction
The increasing prevalence of obesity and defective adipose tissue function are inextricably linked to the development of metabolic diseases such as type 2 diabetes.1,2 In addition to white adipocytes and brown adipocytes, the “brown-like” beige adipocytes within white adipose tissue (WAT) found in both mouse and human 3 are derived from MYF5-negative white fat, which, like classical brown adipocytes, respond to cyclic AMP stimuli with a high level of uncoupling protein 1 (UCP1) expression and respiratory rate.4,5 Evidence has shown that brown and beige adipocytes make significant contributions to systemic energy expenditure and regulation of metabolic homeostasis.6,7 It is possible to control and treat obesity and diabetes by induction of the beige adipocytes in WAT. 8
Irisin, a hormone secreted by muscle, 9 is produced by cleavage and modification of fibronectin type III domain containing protein 5. 10 Irisin acts on white adipocytes to stimulate UCP1 expression and browning. 11 Even more, a slight increase in the level of irisin in the blood resulted in an increase in the energy expenditure by exercise in mice without change in food intake, 12 raising the question whether irisin could modulate glucose homeostasis and exert the pharmaceutic effect to control the obesity. 13 Interestingly, irisin in mice and humans is 100% identical, suggesting its highly conserved function.13,14
Noninvasive measurement of a specific type of adipose tissue and its distribution is of great significance for monitoring metabolic diseases and their treatment. 15 Imaging technologies such as contrast-enhanced ultrasound, positron emission tomography (PET), and magnetic resonance imaging (MRI) are currently used for determining the fatty tissue and contents in both research and clinical applications. Compared to ultrasound and PET, MRI offers high spatial resolution and soft-tissue contrast with capability of spectroscopically detecting and quantifying specific metabolites without introducing radiation. 16 T1-weighted imaging is commonly used to distinguish WAT from others and can be used to measure the volume of WAT. 17 Chemical shift-selective imaging (CSSI) can be tuned to the specific chemical shift or frequency of fat components to detect changes in the fat fraction (FF). 18 In the past, the effect of irisin on browning process of WAT was only investigated ex vivo by traditional molecular biology and pathology techniques. Herein, we report the noninvasive in vivo tracking and evaluation of the dose-dependent effect of irisin on the browning of WAT in mice using MRI.
Materials and methods
Culture and identification of primary white adipocyte
All animal studies were approved by Institutional Animal Care and Bioethical Committee of the Medical school of Southeast University (SYXK2016-0014). Mature primary adipocytes were cultured and induced as previously described. 19 After C57/BLKS/J male mice (n = 2, 3–4 weeks) were sacrificed by excessive anesthesia, the inguinal subcutaneous adipose tissue (sWAT) was dissected, washed with PBS (Hyclone, Logan, Utah, USA), minced 1–2 mm and digested in PBS containing collagenase II (1 mg·mL− 1 , Sigma–Aldrich, USA) for 90 min at 37°C. Digested tissue was filtered and centrifuged at 1000 r/min for 5 min to pellet the stroma-vascular cells. The pellets were then resuspended in Dulbecco’s Modified Eagle (DMEM/F12, Gibco, Paisley, UK) supplemented with 10% fetal bovine serum (FBS, Gibco, Paisley, UK). The cells proliferated to fill the cell culture dish more than 80%, then induced for three days by an adipogenic cocktail containing 1 μM dexamethasone, 5 μg mL−1 insulin, 1 μM rosiglitazone, and 0.5 μM isobutylmethylxanthine in adipocyte culture medium. Three days after induction, cells were maintained in adipocyte culture medium containing 5 μg mL−1 insulin and 1 μM rosiglitazone. Finally, cells were incubated in the adipocyte culture medium and harvested. Mature adipocytes were characterized by Oil Red O (Sigma–Aldrich, USA) staining, which confirmed the adipocyte differentiation. Preparation of 60% isopropanol solution: 98% isopropanol (60 mL) was added into distilled water (40 mL) and mixed. Preparation of oil red O staining solution: 100 mL of 100% isopropanol was added with 0.5 g of oil red O dry powder to fully dissolve and filter. The oil red O staining solution mentioned above and distilled water were diluted at 3:2 and filtered (filter paper or polar filter film with 1 mL syringe).
Culture medium was discarded carefully and gently, rinsed with pre-cooled PBS for three times, added 10% neutral formaldehyde and fixed it for 30 min. Oil red O dye solution was added for 0.5 h. About 60% isopropanol was used to decolorize. Selected sections were examined in 5 min with inverted microscopy (IX71, Olympus, Tokyo, Japan) for lipid deposition analysis.
Irisin intervention and evaluation
Cultured white adipocytes were treated with irisin (R&D systems, USA) at different concentrations (0, 20, and 40 nmol·L− 1 ) for six days. After the treatment, the cells immunohistochemical staining was performed as before. 20
Proteins were extracted from cultured cells and immunoblotting was processed as previously described. 21 Specific experimental steps were located at supplemental materials.
Mouse model and irisin intervention
Male C57BLKS/J mice were randomized to feed a normal chow diet (NCD) or a high fat diet (HFD) and were housed in standard cages at a temperature of 22–24°C with a 12-hour light/dark cycle. The sources of HFD and NCD are provided directly by the mouse purchase center. NCD mice were fed with normal food directly, while HFD mice were fed with high-fat food (Research Diets, #D12492, USA) and normal food in the ratio of 6:4 for three months. High-fat food was composed of protein (20% kcal), carbohydrate (26.3% kcal), and fat (60% kcal). NCD mice (n = 24, 10–12 weeks, 28.07 ± 1.36 g) and HFD mice (n = 10, 20–22 weeks, 42.94 ± 4.31g) were randomized into the irisin treatment group and control group. NCD (n = 12, 28.23 ± 1.17 g) or HFD (n = 5, 43.31 ± 3.15 g) mice were treated daily with irisin (0.8 ng·g− 1 ·day− 1 , 200 μL each) by intraperitoneal injection for 14 days, while NCD (n = 12, 27.92 ± 1.52 g) or HFD (n = 5, 42.56 ± 5.20 g) mice in the control group were given phosphate-buffered saline (PBS; 200 μL each) daily at the same volume. Food intake and body weight of mice were monitored at regular intervals every day.
MRI scan and image analysis
After intervention, the two groups of NCD mice and two groups of HFD mice were scanned with MRI (n = 5/group). MRI examinations were performed at day 15 after irisin treatment on a preclinical 7 T MR imager (Bruker Pharma Scan MRI, Ettlingen, Germany) using a transmit-receiver quadrature volume coil. The animals were anesthetized by inhalation of a mixture of air and 5% isoflurane (Keyue, Shandong, China) delivered through a nose cone, and anesthesia was maintained with 1–2% isoflurane during MRI scan.
T1-weighted spin echo images were acquired with a multislice multiecho sequence in the axial direction. See the supplementary document for T1-weighted scanning parameters. No fat suppression and slice spacing were used. WAT includes subcutaneous WAT (sWAT) and visceral WAT (vWAT). The sWAT is found mostly underneath the skin. The vWAT, also known as organ fat, is located inside the peritoneal cavity packed in between the internal organs. The volume of sWAT, epididymal WAT (eWAT), vWAT, and total WAT (tWAT) in the whole body of mice were measured and analyzed. The WAT volume was measured using ImageJ software (National Institutes of Health, USA). T1-weighted analysis by Image J software was conducted on the whole volume on manually sketching.
See the supplementary document for data acquisition parameters of CSSI. A region of interest (ROI) was placed at the site of the WAT in both fat and water images. ROIs contained 15–20 pixels (about 0.25 mm2) for sWAT in inguinal region, eWAT, eWAT was chosen as the representative of vWAT, because eWAT was relatively concentrated, which could reduce the measurement error. The signal intensity (SI) in the ROI was measured using a program (ParaVision5.0; Bruker PharmaScan) from both fat selective images (SIfat) and water selective images (SIwater). FF of WAT was computed following the equation

R is the ratio of the fat-to-water proton densities in their pure form, which has a value of 0.9 as used in the early publication. 18
Histopathologic analysis
After imaging experiments, mice (n = 5/group) were sacrificed and then did cardiac perfusion with phosphate-buffered saline and 4% paraformaldehyde in 0.1 M phosphate buffer (pH 7.4). The sWAT and eWAT sections were fixed for 48 h, then dehydrated, embedded, and transversely cut into 4-μm-thick sections for hematoxylin and eosin (H&E) staining. 21 The areas such as blood vessels, were manually excluded by a pathologist.
Five random fields in the microscopic images of H&E staining sections from each mouse were captured. The area of adipocytes was measured using ImageJ software.
Immunohistochemistry analysis and western blotting
Portions of the sWAT samples of irisin treatment group and the control group (n = 3/group) in NCD and HFD mice were harvested for immunohistochemistry staining or western blot. See the supplementary document for specific steps.
Measurement of blood glucose, plasma triglyceride, total cholesterol
Mice with HFD were fasted for 24 h. For blood sample analysis, a 500 μL of blood sample was collected from each HFD mouse (n = 5/group). Samples were centrifuged, and plasma was stored at −70°C. Glucose, total cholesterol, and triglyceride concentrations in the blood as well as urea and blood nitrogen levels were measured by the autoanalyzer (Au5821, Beckman Coulter, USA).
Statistical analysis
All statistical analyses were performed using SPSS software (SPSS for Windows, version 11.0, 2001; SPSS, Chicago, IL). Numerical data were presented as the mean ± standard deviation (SD). For statistical comparisons, the independent-sample t-test and one-way ANOVA were applied. A P value of less than 0.05 was considered to indicate a statistically difference.
In cell experiments, one-way ANOVA was used to evaluate the expression of browning protein after treatment using three different irisin concentrations. In animal experiments, independent-sample t-test was performed to analyze the body weight, food intake, volume and FF of WAT measured by MRI, and their data of histopathologic and western blotting between irisin treatment and control groups.
Results
Irisin caused browning primary white adipocytes
To investigate the effect of irisin on browning the white adipose adipocyte, we first examined cultured primary white adipocytes derived from C57/BLKS/J male mice. Primary vascular stromal cells were fusiform adherent and fused up to 80%. After six days of induction and two days of basic culture, the cells began to show lipid droplets of different sizes (Figure 1(a)). The characteristics of primary white adipocytes with the absorption of oil red O by lipid droplets can be seen in the microscope (scale bar = 20 μm; Figure 1(b)).
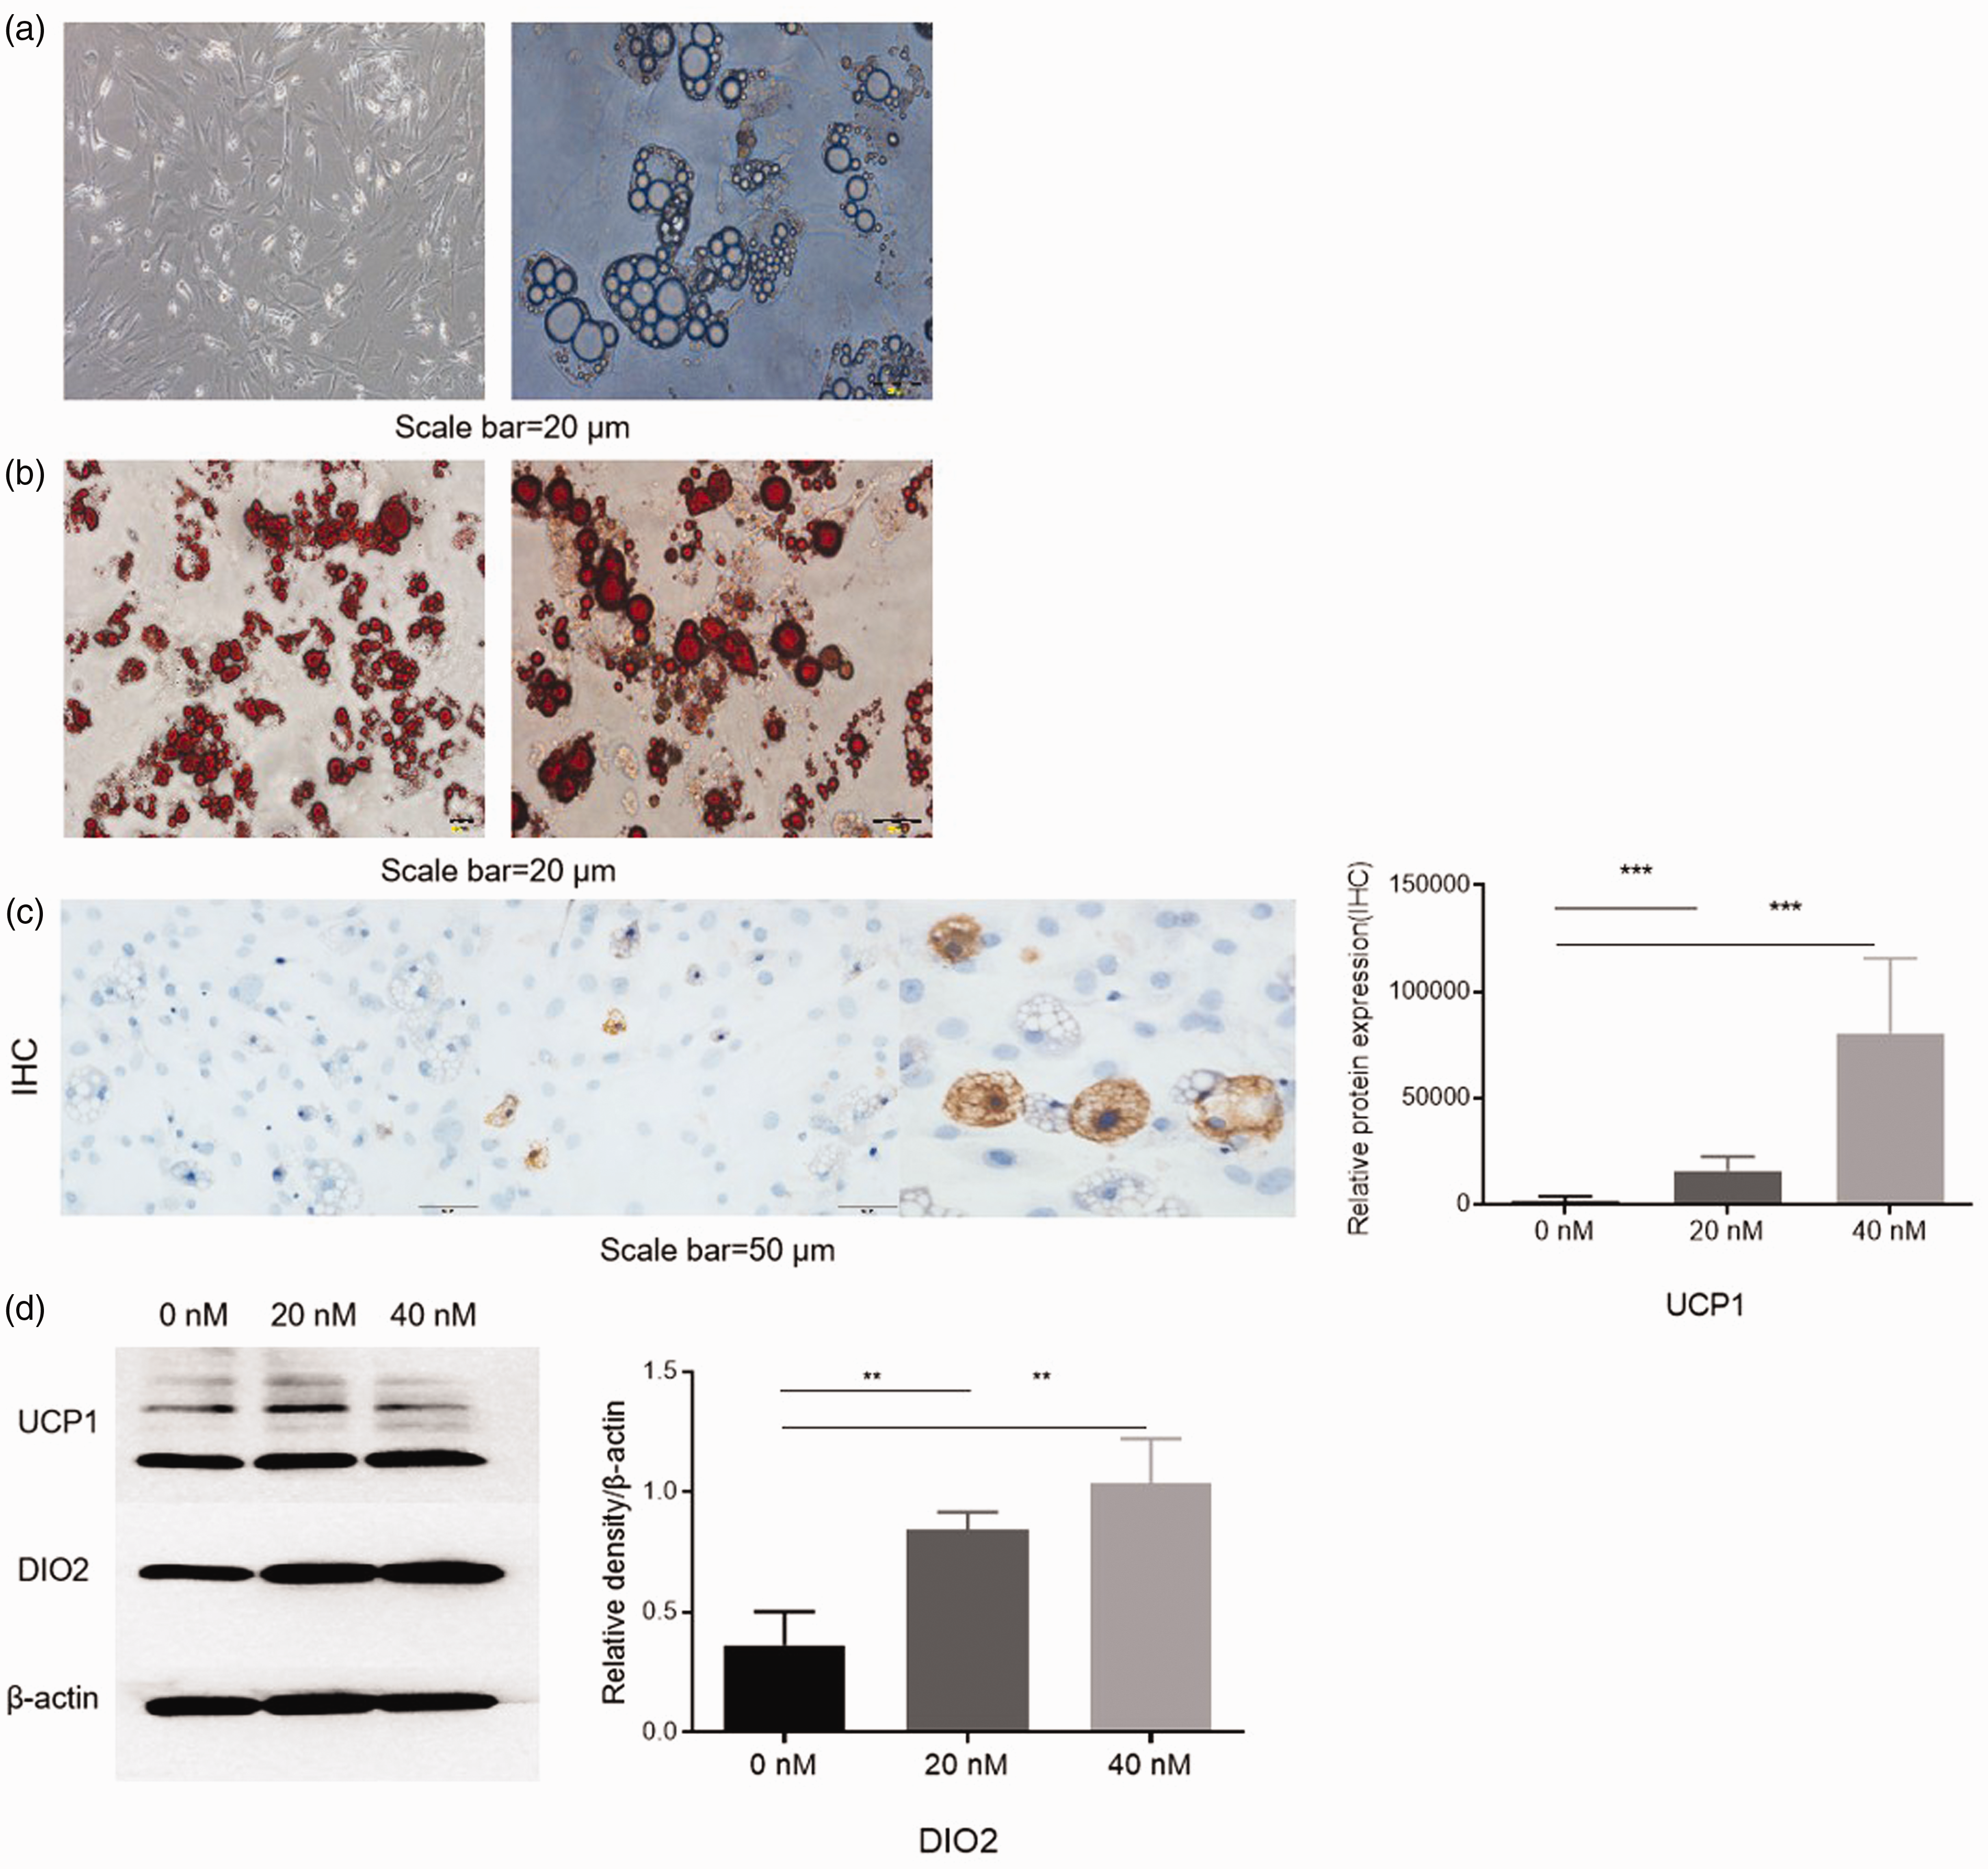
Microscopic images of primary white adipose cells and browning of white adipocytes after applying irisin at different concentrations. Morphology of primary white adipose precursor cells (scale bar=50 μm), a large amount of lipid droplets after induction of maturity (scale bar=20 μm) (a); high magnification at 200× and at 400× of mature fat cells are stained with oil red O, and the lipid droplets appear as orange-red of different sizes (scale bar=20 μm) (b). Immunohistochemistry staining of UCP1 protein mainly expressed in the cytoplasm (scale bar=50 μm) and the content of UCP1 increased significantly with the increase of irisin concentration (c). Western blot showed after irisin intervention at 20 and 40 nmol/L, the gray scale of UCP1 and DIO2 bands was significantly enhanced due to sWAT browning. With the increase of irisin concentration, the expression of DIO2 was also increased (d). (A color version of this figure is available in the online journal.)
After treatment, immunohistochemistry analysis showed a significant upregulation of UCP1, the brown adipocyte marker, in primary white adipocytes treated with irisin (P < 0.05) compared with the controls treated with PBS. UCP1 was identified in the form of intracellular expression. Moreover, quantification of UCP1 revealed that the upregulation as the concentration of irisin increased (scale bar = 50 μm) (Figure 1(c)). The treatment response at the protein level evidenced with increase in DIO2 content in primary white adipocytes was also confirmed by the Western blotting (Figure 1(d)). Significant increases of DIO2 were seen in white adipocytes after irisin intervention (P < 0.01) compared to the controls treated with PBS (Figure 1(d)).
Irisin led to weight loss in NCD mice without changing food intake
We found no statistically significant difference in food intake between the NCD mice treated with irisin (n = 12/group) or PBS (P > 0.05; Appendix 1, Supplementary Figure S1A). However, irisin-treated mice appeared to be resistant to the weight gain during the experiment period compared to the controls (Appendix 1, Supplementary Figure S1B). The average weight of the irisin-treated group (27.54 ± 1.60 g) was lower than mice treated with PBS (28.23 ± 1.58 g) at the end of the experiments. The averaged change of weight was −0.69 ± 0.99 g in the irisin-treated group during the treatment comparing to 0.31 ± 0.54 g in the control group treated with PBS (P < 0.01) (Appendix 1, Supplementary Figure S1C).
Irisin promoted WAT browning as measured by MRI in vivo in NCD mice
We used two different MRI methods to individually measure the volume and FF of WAT in the NCD mice (n = 5/group) noninvasively. T1-weighted spin echo imaging was used to measure the volume of sWAT, eWAT, vWAT, and total WAT (tWAT), while CSSI was used to determine the FF of sWAT and eWAT. The MRI measured volumes of sWAT, eWAT, vWAT, and tWAT deposits in mice with irisin intervention are 0.86 ± 0.42 cm3, 0.46 ± 0.26 cm3, 0.81 ± 0.34 cm3, and 1.67 ± 0.74 cm3, respectively, which are significantly lower than those in animals of the control groups, i.e. 1.52 ± 0.22 cm3, 0.79 ± 0.20 cm3, 1.24 ± 0.27 cm3, 2.76 ± 0.31 cm3, respectively (Figure 2(a) and (b)). Furthermore, the selective water imaging and fat imaging with CSSI allowed for measuring FFs of sWAT and eWAT. Analyzing CSSI data revealed that mice with irisin intervention had lower FF of sWAT (77.82 ± 1.53%) than that of controls (81.42 ± 1.64%) as shown in Figure 2(c) and (d). Meanwhile, FF of eWAT in mice after irisin intervention was 80.20 ± 1.80%, which is statistically significant lower than that of controls (82.62 ± 0.74%; Figure 2(e) and (f)). These findings suggested that the irisin treatment not only reduced the overall volume of fat tissue in different compartments, but also decreased FF of WAT.
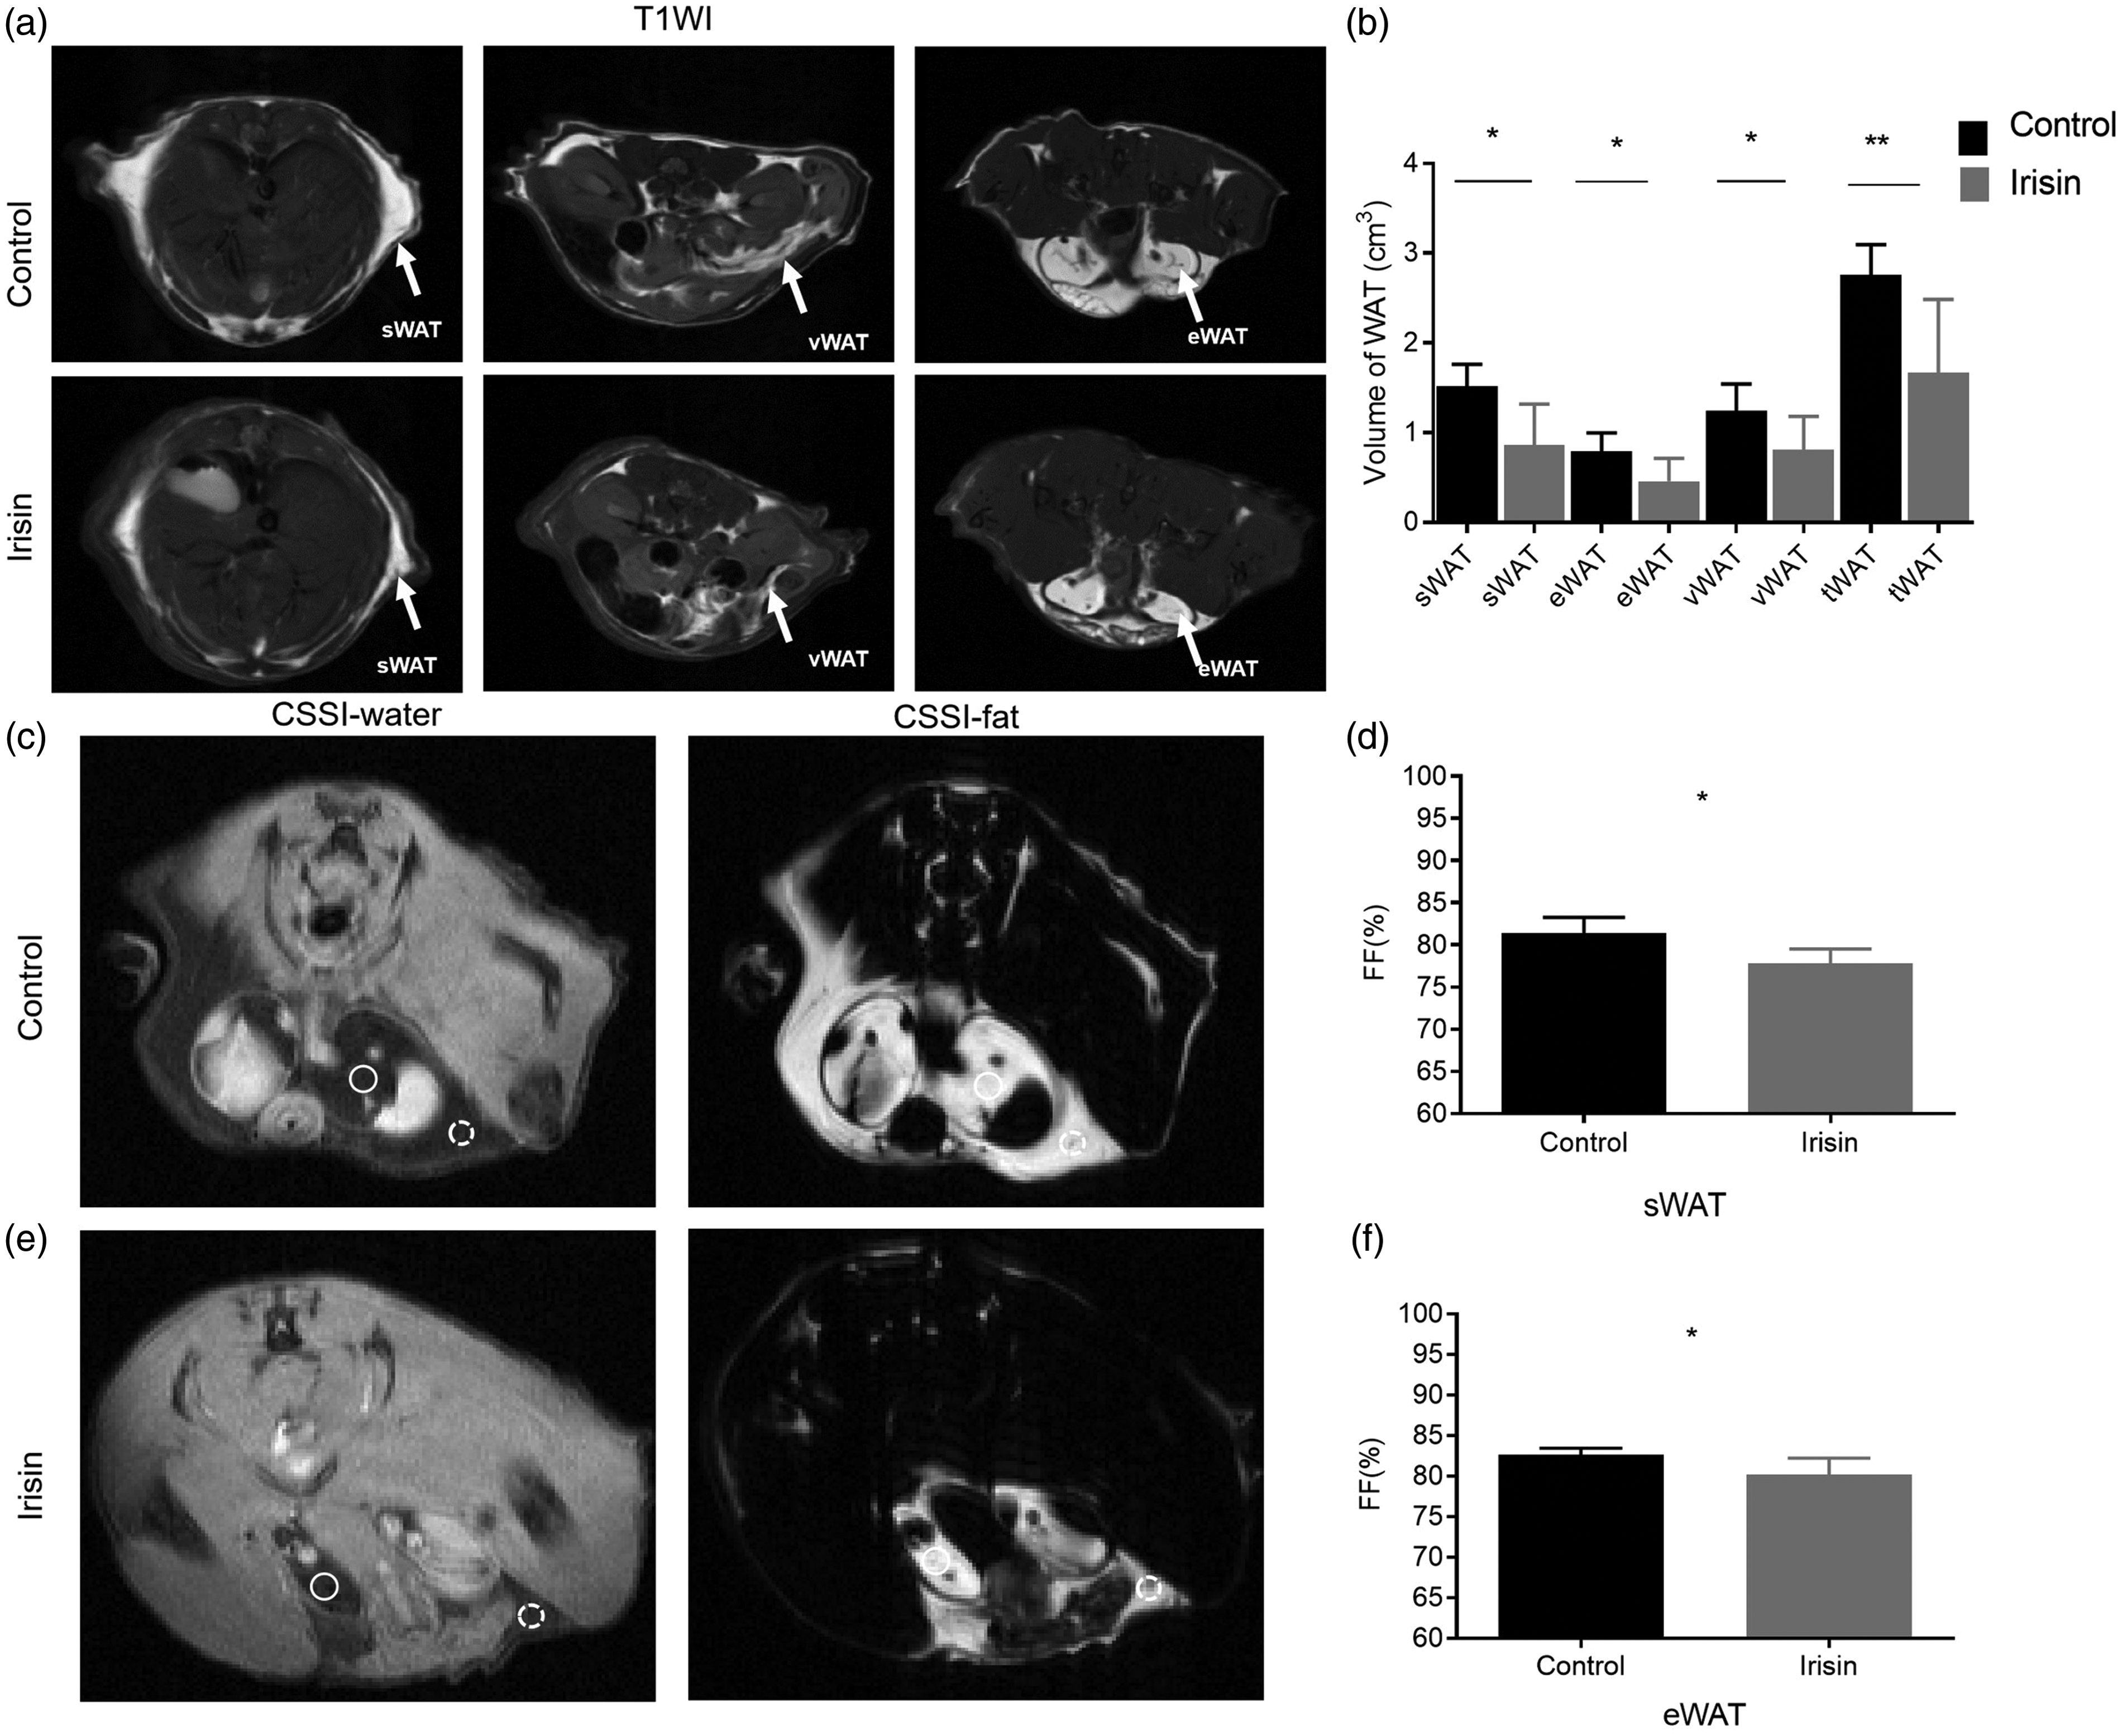
MRI measured in vivo change in the WAT after irisin intervention in NCD mice. T1-weighted images show that the subcutaneous, epididymal, visceral and total WAT (a), white arrows indicated the location of each fat pad; after irisin intervention, the volume of each fat pad in mice decreased significantly (b). The selective water imaging (left) and fat imaging (right) with two sequences of CSSI show the different contrasts and signal intensities of sWAT (c) and eWAT (e) of the mice in different groups. Quantitative analysis reveals statistically significant difference in the FF between the two groups of mice (d, f). ROIs are indicated with white circles.
H&E staining confirmed that the sizes of white adipocytes in sWAT of NCD mice (n = 3) treated with irisin intervention (Figure 3(a)) were significantly smaller than those of the control group (Figure 3(b), P < 0.05). No lipid droplet change was present in eWAT of mice treated with irisin (Figure 3(c) and (d)). Immunohistochemistry showed that the UCP1 and DIO2 proteins were present in fat cytoplasm (Figure 3(e) and (g)). Similarly, contents of UCP1 and DIO2 proteins were significantly increased in mice (n = 3) receiving irisin intervention. The brown-type color features of sWAT were evidenced by the presence of much more abundant multilocular UCP1-positive, DIO2-positive beige adipocytes in sWAT (Figure 3(f), P < 0.001; Figure 3(h), P < 0.01). Additionally, upregulation of UCP1 and DIO2 was observed in the western blot (n = 3) (Figure 3(i)) in NCD mice treated with irisin.

Changes of lipid droplets and immunohistochemistry analysis of specific protein in NCD mice. The morphological changes of adipocytes in WAT (scale bar=50 μm) can be observed, left image showed the WAT in control, and right image was the WAT after irisin treatment (a, c), with size and area of adipocytes in sWAT significantly reduced (b) in mice received irisin intervention. While there is no difference between the size and diameter in eWAT of two groups (d). Immunohistochemistry analysis showed the content of white adipose tissue-associated specific proteins UCP1 and DIO2 (scale bar=50 μm) in the sWAT and increases in irisin group (e–h). Expression levels of UCP1 and DIO2 proteins were significantly increased (I). (A color version of this figure is available in the online journal.)
Irisin ameliorated obesity and metabolic dysfunction in HFD mice
To further determine the effect of irisin on diet-induced obesity, we treated C57BLKS/J mice under HFD (male, n = 5) with irisin. The HFD mice had significantly higher averaged body weight than NCD mice at the age of 20–22 weeks (42.94 ± 4.31 g vs. 28.02 ± 0.29 g; Appendix 1, Supplementary Figure S2A). There was no statistical difference in the food intake between irisin treatment group and control group during three months of HFD challenge (Appendix 1, Supplementary Figure S2B). However, after the irisin treatment for 14 days, the averaged body weight of the treated animals (44.61 ± 4.28 g) was found to be significantly lower than that of the control group (48.17 ± 4.32 g; Appendix 1, Supplementary Figure S2(c) and (d)).
The MRI measured volumes of sWAT, eWAT, vWAT, and tWAT deposits in mice with irisin intervention are 3.85 ± 0.63 cm3, 0.84 ± 0.39 cm3, 7.82 ± 1.55 cm3, and 12.51 ± 1.97 cm3, respectively, which are significantly lower than those in animals of the control groups, i.e. 5.55 ± 0.66 cm3, 1.64 ± 0.31 cm3, 12.37 ± 2.49 cm3, and 19.56 ± 3.39 cm3, respectively (Figure 4(a) and (b)). Furthermore, analyzing CSSI data revealed that mice with irisin intervention had lower FF of sWAT (77.08 ± 2.96%) than that of controls (81.75 ± 1.75%) as shown in Figure 4(c) and (d). Meanwhile, FF of eWAT in mice after irisin intervention was lower than that of controls (75.78 ± 5.01%, 81.55 ± 2.22%, respectively; Figure 4(e) and (f)). These findings suggested that the irisin treatment not only reduced the overall volume of fat tissue in different compartments, but also decreased FF of WAT.
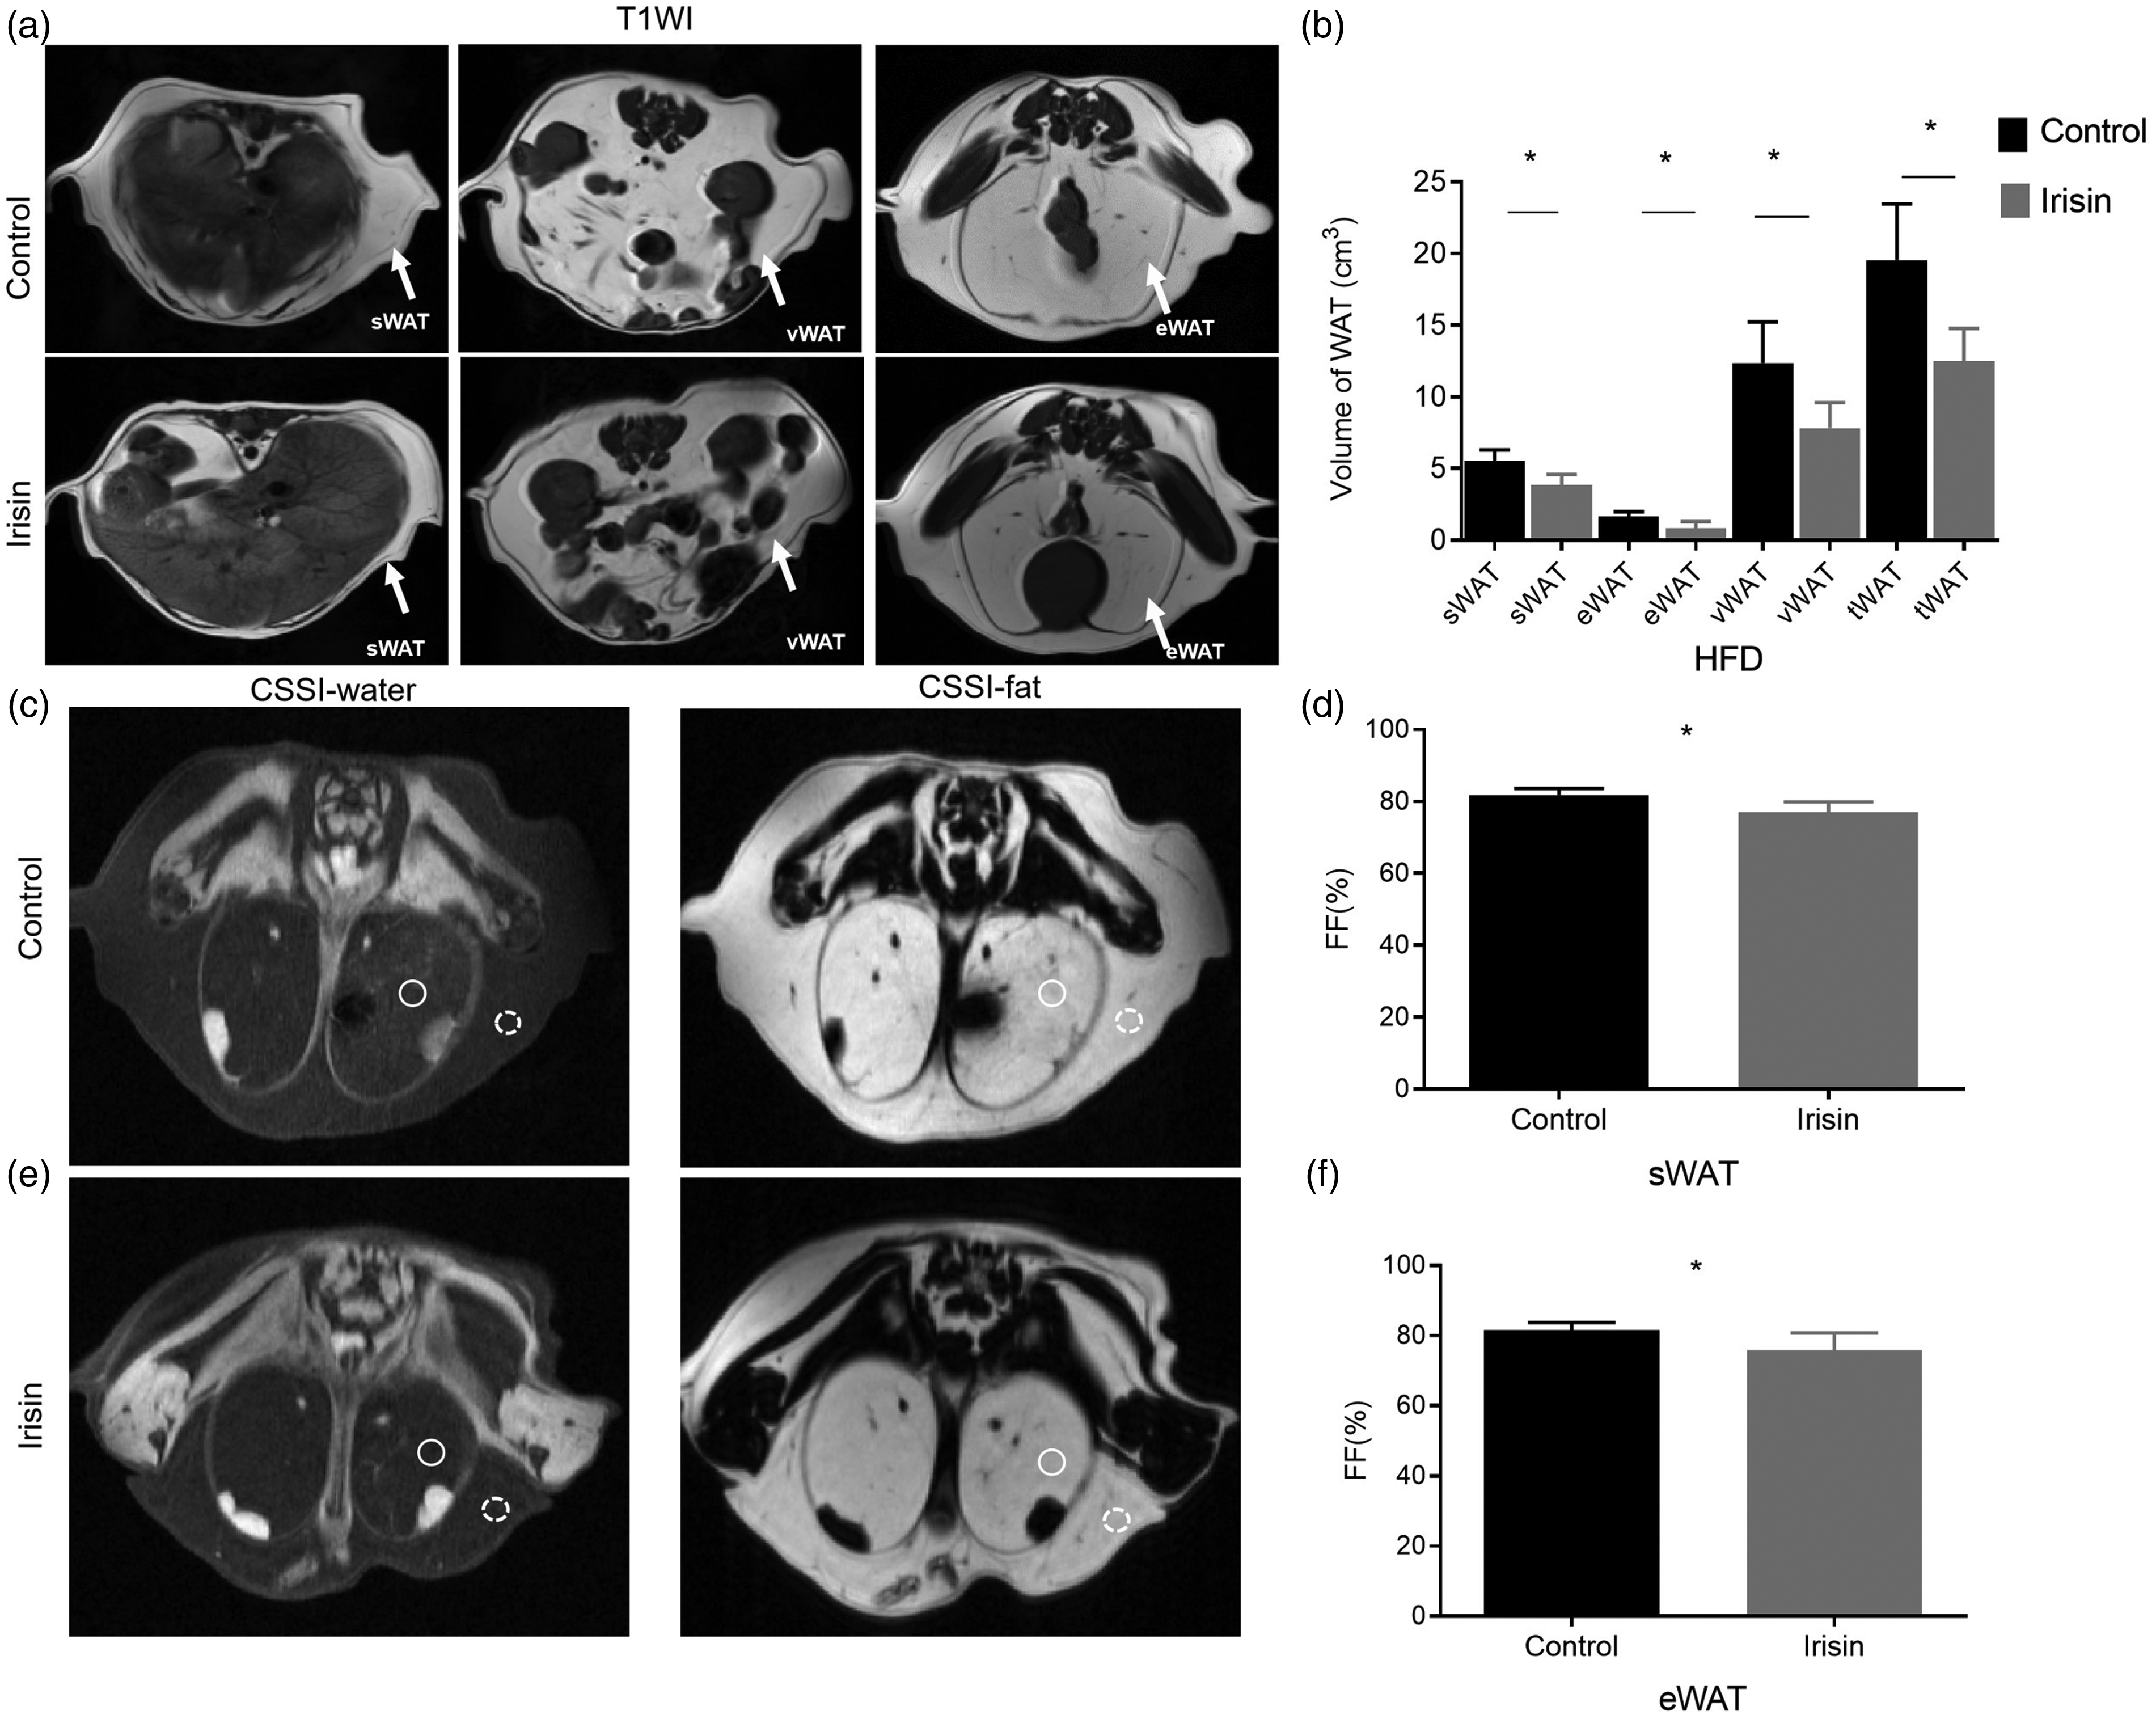
MRI measured in vivo change in the WAT volume and FF in HFD mice. T1-weighted images show that the subcutaneous, epididymal, visceral and total WAT (a), white arrows indicated the location of each fat pad; after irisin intervention, the volume of each fat pad in mice decreased significantly (b). The selective water imaging (left) and fat imaging (right) with two sequences of CSSI show the different contrasts and signal intensities of sWAT (c) and eWAT (e) of the mice in different groups. Quantitative analysis reveals statistically significant difference in the FF between the two groups of mice (d, f). ROIs in sWAT are indicated with white dot line circles, ROIs in eWAT are indicated with white solid line circles.
H&E staining confirmed that the sizes of white adipocytes in sWAT and eWAT of HFD mice (n = 5) treated with irisin intervention were significantly smaller than those of the control group (Figure 5(a) and (b), P < 0.01). Immunohistochemistry showed that the UCP1 protein significantly increased in mice (n = 5) receiving irisin intervention. The brown-type color features of sWAT and eWAT were evidenced by the presence of much more abundant multilocular UCP1-positive beige adipocytes (Figure 5(c), P < 0.05; Figure 5(d), P < 0.01).

Changes of lipid droplets, specific protein of WAT and metabolic dysfunction after intervention in HFD mice. The morphological changes of adipocytes in WAT (scale bar=100 μm) can be observed, with area of adipocytes in sWAT and eWAT significantly reduced (a, b) in mice received irisin intervention. Immunohistochemistry analysis showed the content of WAT-associated specific proteins UCP1 (scale bar=100 μm) in the sWAT and eWAT (c, d). Fasting cholesterol and blood glucose levels in the experimental group were significantly lower than those in the control group with statistical significance (e, f). There were no significant changes in triglycerides between treated and control mice (g). (A color version of this figure is available in the online journal.)
Moreover, when evaluating the metabolism of the serum metabolic profile, HFD mice with irisin treatment exhibited a lower fasting blood glucose level (7.72 ± 1.13 mmol·L−1) and a total cholesterol level (2.55 ± 0.40 mmol·L−1), comparing to those treated with PBS (glucose level = 12.88 ± 2.01 mmol·L−1, total cholesterol level = 3.77 ± 0.76 mmol·L−1) as shown in Figure 5(e) and (f). Interestingly, there was no change in the triglyceride level (Figure 5(g)).
Discussion
The main finding of our study was that a small dose of irisin can induce browning primary white adipocytes and weight loss in NCD and HFD mice without changing food intake. Furthermore, the irisin treatment may ameliorate obesity and metabolic dysfunction. We demonstrated that treatment induced change of WAT browning can be measured by noninvasive MRI in vivo.
Many studies confirmed that irisin acts on white adipocytes and induces their transformation into beige adipocytes. Activated beige adipocytes increase heat production by rapidly consuming glucose and fat, thereby promoting weight loss and improving glucose tolerance and insulin resistance. 22 Some studies showed that the irisin level can be increased by exercise and FNDC-associated virus injection that expresses irisin. 23 Other studies reported the effective response by administering irisin at higher doses (100 mg·kg−1·d−1, 4 weeks). 24 In our study, we observed that the browning primary white adipocytes can be achieved at low-dose irisin (20 nM) in vitro and 0.8 ng·g·d− 1 in vivo by intraperitoneal injection for 14 days.
We demonstrated that noninvasive MRI can be readily used to quantitatively assess the distributions of fat as a whole and as specific sub-types with good spatial resolution. The imaging methods provide a wide range of coverage of WAT, and ability to quantitatively analyze the FF of WAT in each region. CSSI offers noninvasive method to quantify the FF, which acquires separate fat and water images based on the frequencies of the protons from fat and water in our previous study. During the browning process of WAT, the fat content of WAT decreased, consequently the water increased, so the FF data of the CSSI decreases. 16 Therefore, quantitative analysis of FF value by MRI can judge the change of fat properties. Our study demonstrated that the browning of WAT was detected by CSSI noninvasively, due to the reduction of white adipocyte size and lipid droplets after irisin intervention. Comparing to traditional molecular biology and histopathology analyses on the tissue samples in the past, the imaging approach enables time-dependent monitoring the pharmaceutical effects in the same animal over the time. We showed that T1-weighted MRI was able to accurately assess the volume of each fat pad of the mouse specifically. The change of FF value in WAT indirectly reflected the change of cellular properties in the tissue, proving the information on the browning effect of irisin in WAT. Noteworthy, the previous studies found that irisin induced browning of sWAT, but the role of irisin in vWAT has been controversial. 25 Interestingly, our study detected that irisin could induce browning in eWAT, even though the morphological changes of visceral lipid droplets were not significant in NCD mice. These findings demonstrated that adipose tissue exhibits a wide range of plasticity showing in different anatomical depots even in different layers of the same fat pad. 26 Therefore, the browning effect of irisin on WAT in different regions may have different underlying mechanisms. Consequently, MRI can be an important tool to be used sampling overall and individual tissue compartments in the future investigations.
We presented the preliminary findings of the effect of irisin on obesity at a low dose. It is likely that the irisin effect on the serum triglycerides may not be as sensitive as blood glucose and cholesterol in HFD animals. Fat decomposition and glucose decomposition are the regulating nodes of heat production and energy consumption of beige fat tissue. The liposoluble effect of lipid droplets has been widely studied in white adipocytes. The results show that lipid droplets directly provide fatty acids for Brown mitochondria to produce heat, which need to be supplemented by lipid fuel obtained from blood. 27 Fatty acids are the main chemical fuel for heat production of bat, while glucose can be converted into fatty acids through fat production. 28 Therefore, in the state of obesity and other imbalances, irisin’s consumption of glucose in obese mice may make up for the consumption of triglycerides. In the future, we will use or include mouse models of diabetes to further verify the effect of irisin on metabolism.
There are a few limitations in the current study. Firstly, we did not investigate the delivery, accumulation and distribution of irisin in the tissue. In addition, the fat component change due to the effect of irisin was only monitored by noninvasive MRI in fairly short period (i.e. 14 days), thus the long-term effect is not fully investigated. Our follow-up studies in the future will seek better understanding of the effect of irisin on WAT by following up the medication and functional change with systematical and large cohort investigations on metabolic processes.
Irisin intervention exerts browning of WAT, resulting reduction of the WAT volume and decreased FF of WAT as measured by noninvasive MRI. Furthermore, it can improve the hyperglycemia in mice with diet-induced obesity. The findings from this study suggest that promoting the browning of WAT, as shown by irisin intervention, can be a new therapeutic approach to treat obesity or related metabolic disorders and diseases, such as diabetes.
Irisin can be used to activate and facilitate browning of WAT for treating obesity-related metabolic diseases and disorders. MRI is capable of noninvasively monitoring the process of WAT browning and the effect of irisin intervention.
Footnotes
AUTHORS’ CONTRIBUTIONS
YC, XGP, JD, SHJ conceptualized the problem; YC, XGP developed an experimental method; YC, YFZ, XGP conducted the experiments; YC, XGP did a literature research; YC wrote the manuscript; YC, YFZ collected resources; HM, XGP reviewed and edited; XGP, SHJ supervised.
DECLARATION OF CONFLICTING INTERESTS
The authors declared no potential conflicts of interest with respect to the research, authorship, and/or publication of this article.
FUNDING
The author(s) disclosed receipt of the following financial support for the research, authorship, and/or publication of this article: This study was funded by the National Natural Science Foundation of China (81501523, 81871412); the Fundamental Research Funds for the Central Universities (2242019k30035); the Research Funds for “333 project” in Jiangsu province (LGY2017100).
SupplementAL MATERIAL
Supplemental material for this article is available online.