
Abstract
Particulate matter exposure is a risk factor for lower respiratory tract infection in children. Here, we investigated the geospatial patterns of community-acquired pneumonia and the impact of PM2.5 (particulate matter with an aerodynamic diameter ≤2.5 µm) on geospatial variability of pneumonia in children. We performed a retrospective analysis of prospectively collected population-based surveillance study data of community-acquired pneumonia hospitalizations among children <18 years residing in the Memphis metropolitan area, who were enrolled in the Centers for Disease Control and Prevention sponsored Etiology of Pneumonia in the Community (EPIC) study from January 2010 to June 2012. The outcome measure, residence in high- and low-risk areas for community-acquired pneumonia, was determined by calculating pneumonia incidence rates and performing cluster analysis to identify areas with higher/lower than expected rates of community-acquired pneumonia for the population at risk. High PM2.5 was defined as exposure to PM2.5 concentrations greater than the mean value (>10.75 μg/m3), and low PM2.5 is defined as exposure to PM2.5 concentrations less than or equal to the mean value (≤10.75 μg/m3). We also assessed the effects of age, sex, race/ethnicity, history of wheezing, insurance type, tobacco smoke exposure, bacterial etiology, and viral etiology of infection. Of 810 (96.1%) subjects with radiographic community-acquired pneumonia, who resided in the Memphis metropolitan area and had addresses which were successfully geocoded (Supplementary Figure F2), 220 (27.2%) patients were identified to be from high- (n = 126) or low-risk (n = 94) community-acquired pneumonia areas. Community-acquired pneumonia in Memphis metropolitan area had a non-homogenous geospatial pattern. PM2.5 was associated with residence in high-risk areas for community-acquired pneumonia. In addition, children with private insurance and bacterial, as opposed to viral, etiology of infection had a decreased risk of residence in a high-risk area for community-acquired pneumonia. The results from this paper suggest that environmental exposures as well as social risk factors are associated with childhood pneumonia.
Impact statement
Residence in areas where ambient PM2.5 concentrations are greater than 10.75 μg/m3, which is less than the Environmental Protection Agency (EPA) allowable cut-point for PM2.5 (<12 μg/m3), is associated with high-risk for community-acquired pneumonia (CAP) in children.
Introduction
Respiratory conditions are the most frequent reason for non-neonatal hospitalization among US children, and pneumonia is the most common principal diagnosis. 1 Outdoor ambient air pollution is associated with higher rates of lower respiratory tract infections (LRTI) in children.2–6 Particulate matter (PM) can be generated from a variety of sources including anthropogenic and natural sources; and the contribution of these sources to the total concentration of PM can have significant health impacts. 7 Combustion sources contribute significantly to most of the PM found in PM2.5, while dusts comprise a significant portion of PM10. Since PM2.5 (and PM0.1 contained within PM2.5) is most strongly correlated with adverse health effects and children are known to be more vulnerable than adults to the adverse effects of PM2.5, our data are focused on this category of PM. Specifically, particulate matter less than or equal to 2.5 micrometers in diameter (PM2.5) is implicated in causing respiratory disease,4,8,9 and high PM2.5 exposure has been linked to increased risk for acute respiratory infection hospitalizations2,3,6,10,11 and prolonged length of stay for pneumonia.12,13 Particulate matter exposure is measured using monitoring data from on-road mobile emission sources, major industrial facilities emission sources, and a high-resolution surface 1 km by 1 km satellite-derived PM2.5 data. High-resolution 1 km by 1 km PM2.5 is emerging as a more sensitive measure for assessing PM2.5 effects on several health outcomes.14–18 Biologic and clinical risk factors for pediatric pneumonia have been well studied;19–22 however, few studies have investigated how geospatial patterns affect community-acquired pneumonia (CAP) risk in children23–28 and this has not directly been examined in U.S. children. Geographical Information Systems (GIS) provide the opportunity to examine associations between clinical factors, environmental factors, and spatial distribution of disease.25,29–34 An earlier study demonstrated associations between CAP hotspots hospitalizations for pneumonia and asthma in children under 10 years of age and exposure to air pollution over a moderate resolution grid of cells 30 km × 30 km. 13 However, our study used a much higher spatial resolution of PM2.5 grid (1 km × 1 km) to study exposure to air pollution among children under 18 years of age hospitalized with CAP in Memphis.
We used data from the Centers for Disease Control and Prevention (CDC) Etiology of Pneumonia in the Community (EPIC) Study, an active, population-based, surveillance study of pediatric CAP hospitalizations, to assess the geospatial patterns CAP in the Memphis Metropolitan area (MMA) and the impact of PM2.5 on geospatial variability of pneumonia in children. We hypothesized that geographical heterogeneity exists among pediatric CAP patients in the MMA, and that high PM2.5 exposure is associated with residence in high-risk CAP areas of the MMA.
Materials and methods
Study population, study design, and settings
The EPIC study was a prospective, population-based, multi-center active surveillance study of the incidence and etiology of CAP hospitalizations in the United States; details have been previously published. 35 In brief, between January 2010 and June 2012, children <18 years old were eligible for enrollment in the EPIC study, if they were hospitalized at one of three pediatric study hospitals in three different U.S. cities (Memphis and Nashville, TN; and Salt Lake City, UT); resided within a defined catchment area; and had evidence of clinical and radiographic evidence of pneumonia within 72 h of admission. Children were excluded if they were recently hospitalized (i.e. within the past 90 days), enrolled in the study in the preceding 28 days, severely immunocompromised, had cystic fibrosis or a tracheostomy. 35 This analysis is limited to the children enrolled at Le Bonheur Children’s Hospital (LBCH) in Memphis, Tennessee who resided in the MMA (Figure 1). The market share for LBCH for pneumonia for patients living in the study area is estimated to be 86% and is accounted for in data analysis. 35 The MMA is made up of eight counties (Arkansas: Crittenden; Mississippi: Desoto, Marshall, Tate, Tunica; Tennessee: Fayette, Shelby, Tipton) comprising a population of approximately 1,320,000 according to the U.S. 2010 Census Bureau. For this analysis, we defined the population at risk as all children <18 years old living in the MMA. The Institutional Review Boards for The University of Tennessee Health Science Center and the CDC approved the study protocol.
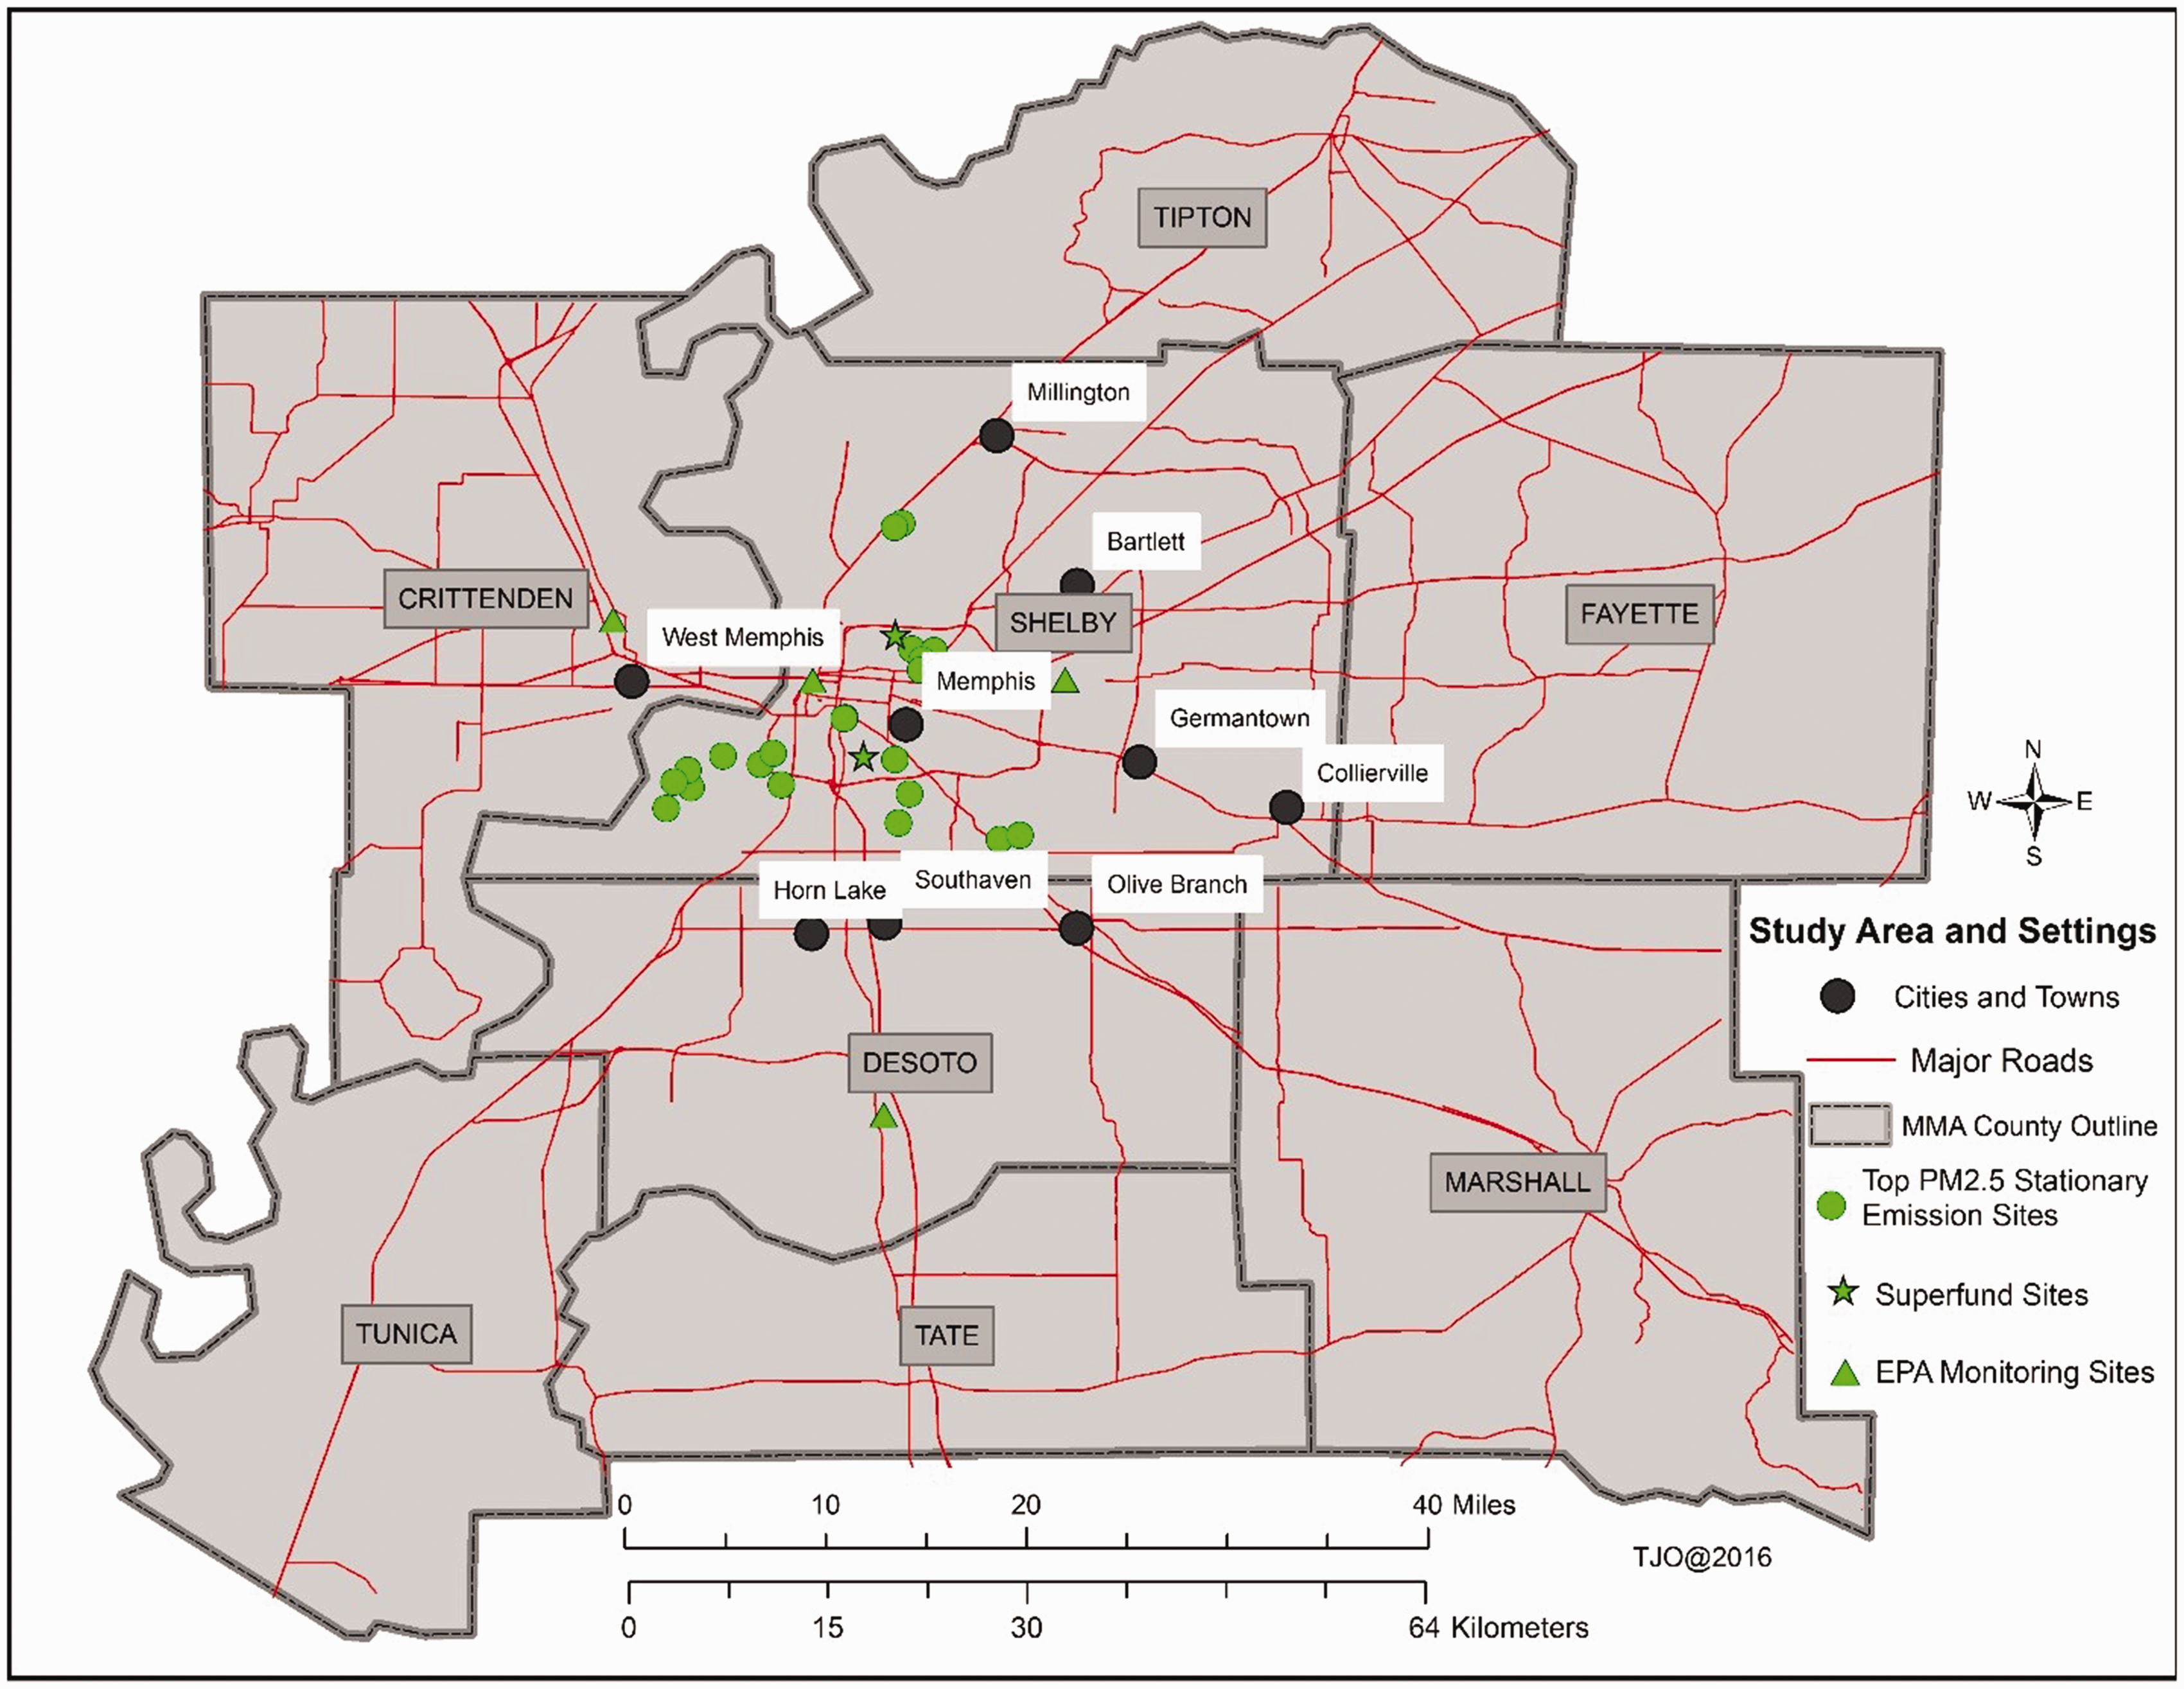
Map showing location of study area including eight major regions of the Memphis Metropolitan Area, EPA monitoring sites, major roads, Superfund sites, and top PM2.5 stationary emission sites based on tons of PM produced.
Demographic, clinical, and laboratory data were collected by caregiver interview and chart abstraction. Etiology of pneumonia was determined using a combination of samples collected for study purposes and clinical samples collected by treating physicians. 35 The methods for data collection, specimen collection, laboratory testing, and definitions for pathogen detection have been previously described. 35 For this analysis, patients were placed in two mutually exclusive categories; they had a bacterial etiology if they had detection of any bacteria with or without one or more viruses and a viral etiology if one or more viruses and no bacteria were detected, as defined by the EPIC study.
Residential addresses of CAP cases were geocoded and quality checked using ArcGIS Street Maps (ESRI Inc., Redlands, CA, USA), and any unmatched addresses were resolved using online Google maps (Google Maps/Google Earth, Google Inc. Mountain View, California, USA). Geographical information systems (GIS) mapping and local cluster detection were conducted using both ArcGIS 10.4 and SpaceStat 4.0.21 (ClusterSeer, a BioMedware Inc., Ann Arbor, Michigan). We accounted for inflated CAP rates caused by small numerator or denominator data by adjusting for population at risk using an Empirical Bayesian filter.36,37 Descriptive statistics, bivariate, and multivariable analyses were conducted using IBM SPSS Software version 24 (IBM SPSS Statistics, Armonk, New York).
Statistical analysis
Using the Memphis EPIC study dataset, we performed spatial analysis to assess if there were geographic clusters of CAP in the MMA, and if high PM2.5 exposure, along with other risk factors, could predict residence in high-risk versus low-risk CAP areas. All spatial analysis was done either at individual or census tract-level. Count of all children < 18 years of age living in the study region was compiled from the US Census data and served as the denominator (population at risk), while the numerator was the count of pneumonia (PN) cases. The outcome variable, residence in high-risk versus low-risk CAP areas, was determined by “hotspot” analysis using Turnbull’s method 38 which evaluates local spatial clusters using the number of CAP cases, user-defined population threshold, and population size (total population of children <18 years old in each census tract). Incidence calculations, adjusted for market share, were made to assess hotspots and cold spots. The lower and upper limits of the 95% confidence intervals for the incidence were derived using two methods previously described.39,40 For the first part of presented results, we are using bootstrap methods using 10,000 samples, while for the remaining analyses CI was derived from Chi-square tests and logistic regression. A map showing significant spatial clusters of locations of CAP cases was generated (Figure 2). Identified high- (hotspots) and low-risk (cold spots) areas of CAP incidence were used as the outcome variables. Patients who did not reside in high- or low-risk areas of CAP were not included in the final analysis.
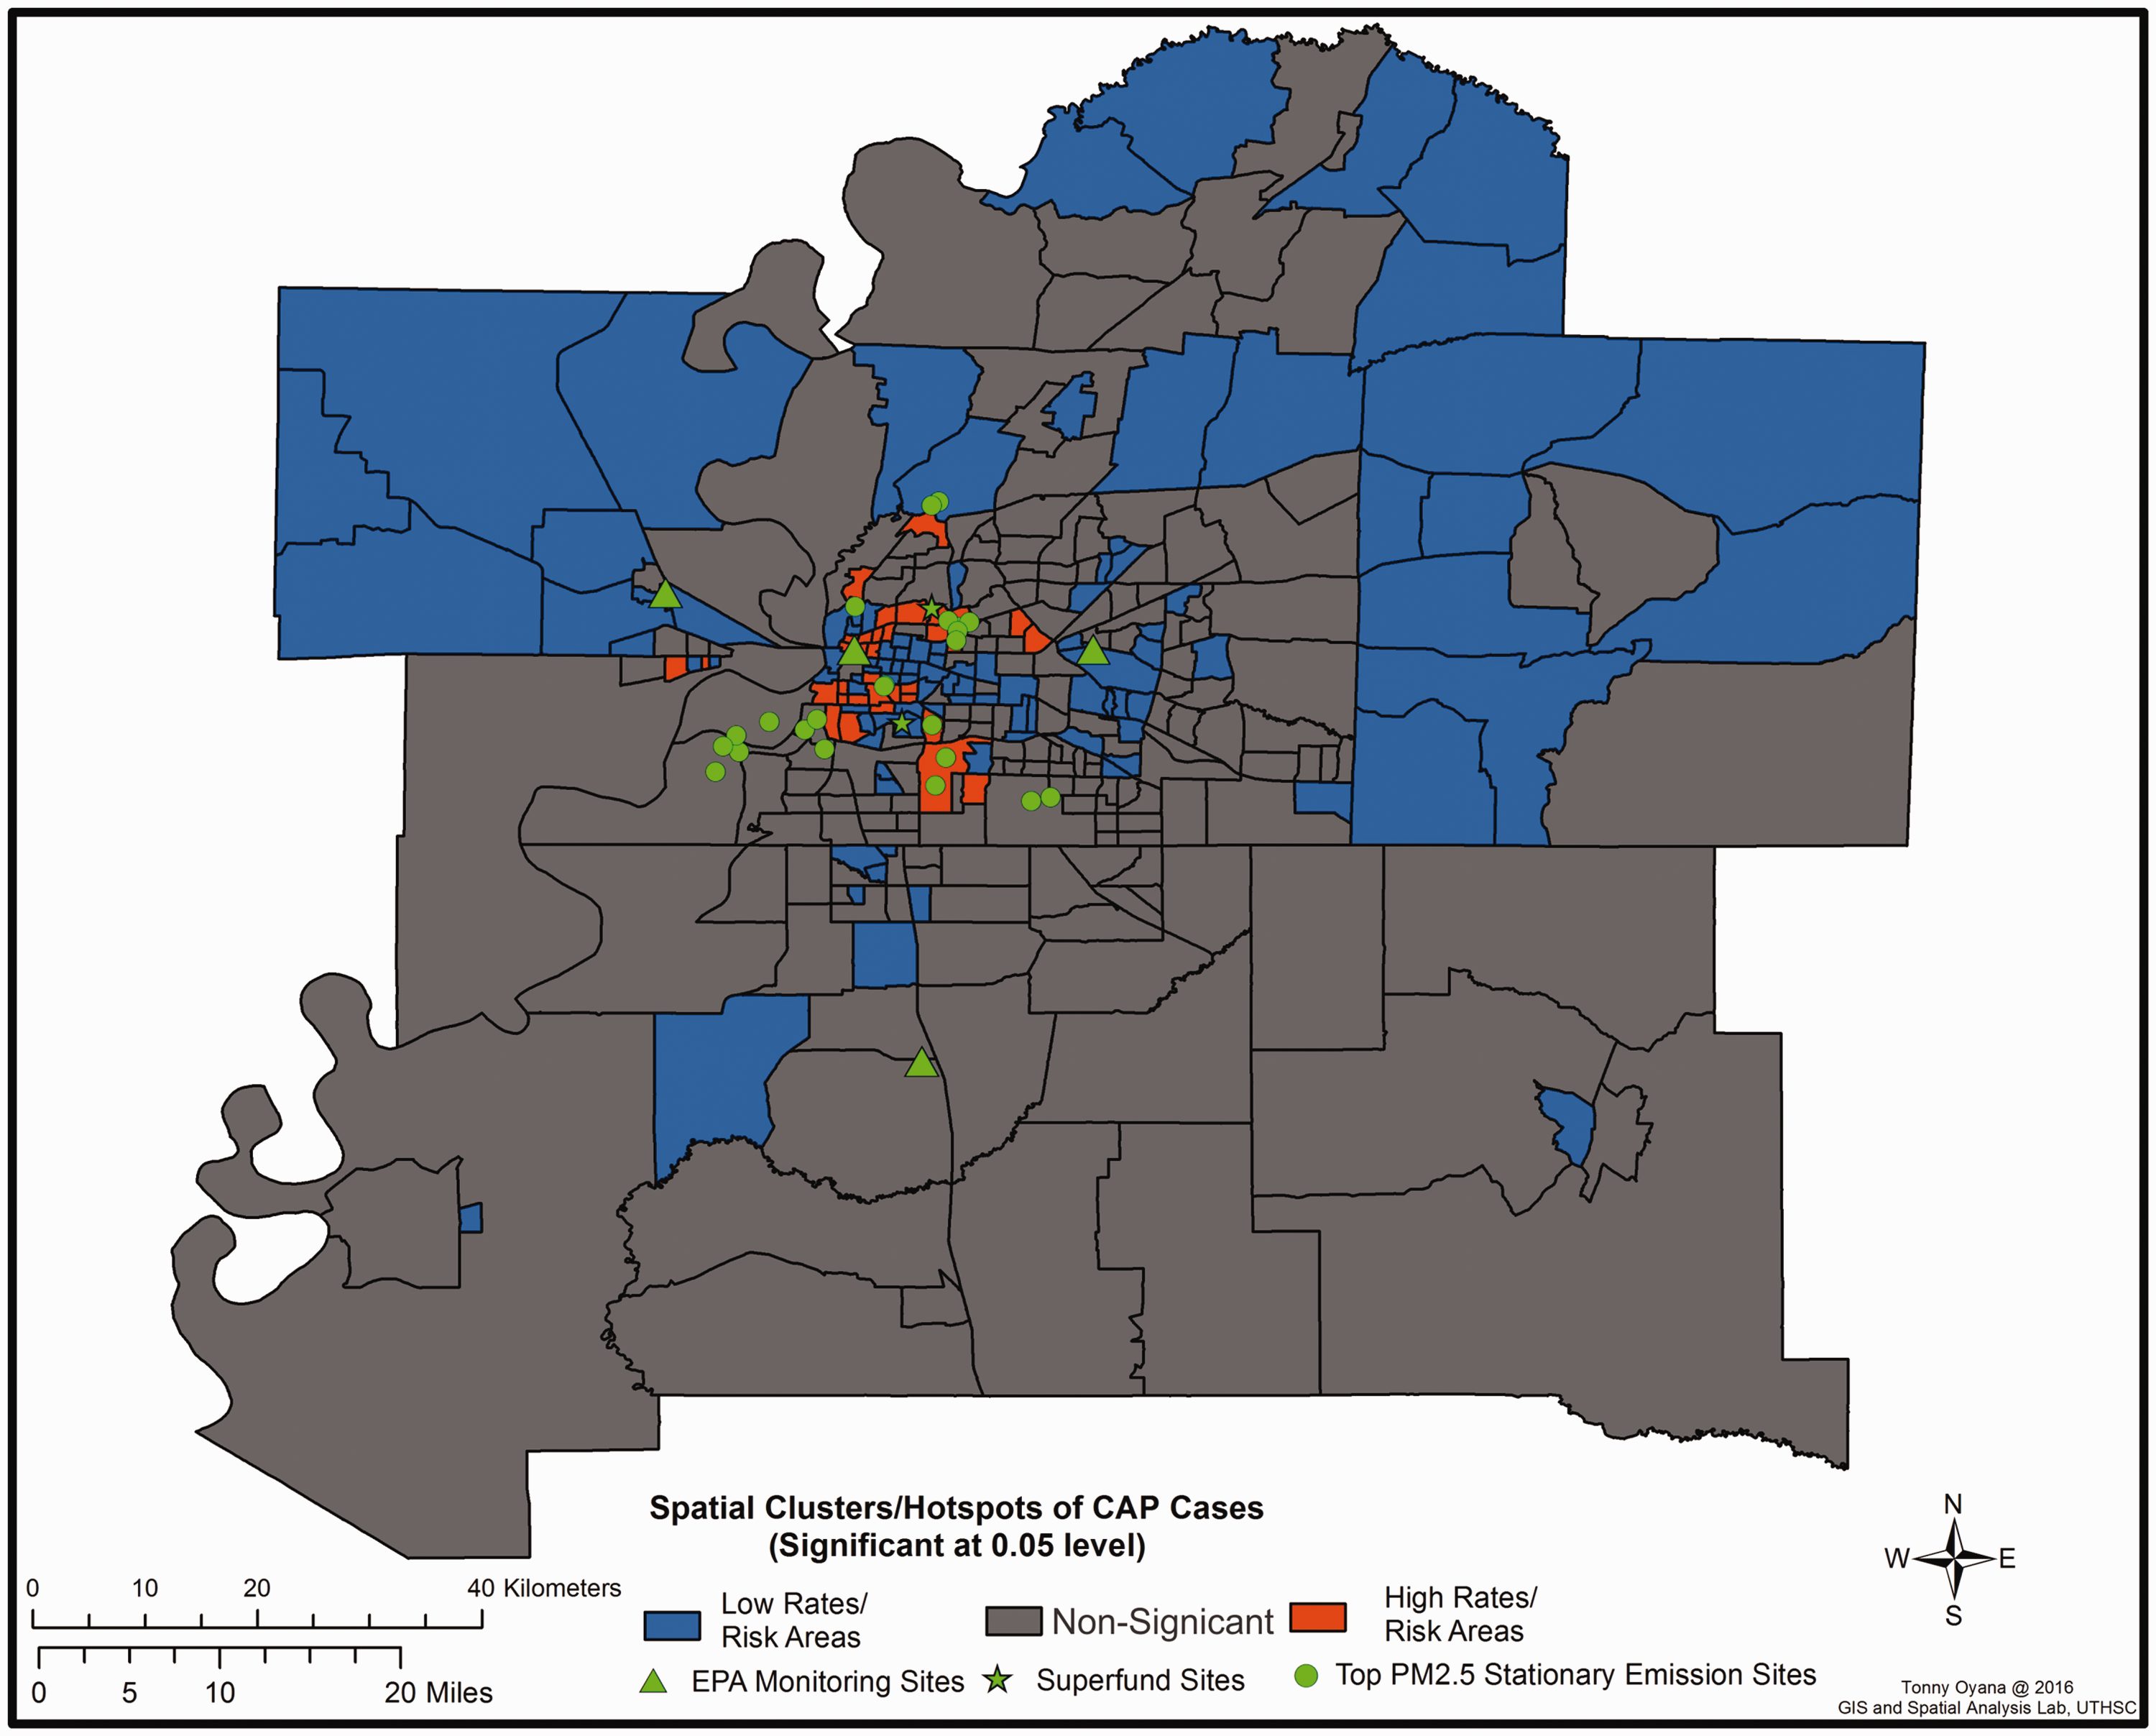
Map showing, at census tract level, spatial clusters/hotspots and cold spots for community acquired pneumonia cases.
Exposure to PM2.5 was the primary independent variable of interest. We assessed proximity to PM2.5 by looking at residence within 500-m radius of major roadways and residence within a 2.5-km radius from individual sources. Residential PM2.5 exposure was measured using a high spatiotemporal resolution 1 km by 1 km grid of satellite-derived PM2.5 concentrations (Supplementary Methods) and this was chosen as our primary PM variable of interest (Supplementary Discussion). PM2.5 data spanning the study period were obtained from a published source. 16 Individual-level residential geocodes for each child (point data) were used to extract a specific PM2.5 value from the PM2.5 surface (raster data). Each geocoded address was assigned this PM2.5 value, which was then compiled as an input variable for the model. The mean PM2.5 for the MMA during the study period was 10.75 μg/m3 (interquartile range (IQR): 10.30; 10.90; 11.30; 12.90; range 8.20–12.90 μg/m3), which is less than the Environmental Protection Agency (EPA) allowable cut-point for PM2.5 (<12 μg/m3). 41 We then converted this to a dichotomous variable, higher and lower exposure, based on the mean PM2.5 concentration of 10.75.
We also assessed the effect of other independent variables including: age (<2 years, 2–4 years, 5–9 years, 10–17 years), sex, race/ethnicity (White, non-Hispanic (NH) Black, Hispanic, and “other” encompassing other races, along with multiracial), history of wheezing, insurance type (private vs. public, other), tobacco smoke exposure (number of household smokers “0,” “1,” or “≥2”), bacterial etiology, and viral etiology of infection. We defined severe CAP as admission to the intensive care unit (ICU), prolonged length of stay (prolonged LOS; hospital stay longer than the median length of stay of 2.8 days), and/or any complication (invasive mechanical ventilation, severe sepsis, parapneumomonic effusion requiring intervention, extracorporeal membrane oxygenation, or continuous renal replacement therapy).
Chi-square tests and logistic regression were used to compute unadjusted and adjusted odds ratios (OR) to describe the association of residential PM2.5 exposure with residence in a high-risk CAP area. After identification of CAP clusters, a preliminary analysis revealed PM2.5 as the primary independent variable of interest to include in the model (Supplementary Table 1). Other variables, with P < 0.10, were considered for inclusion in the multivariable model. All comparisons were two-sided and P < 0.05 was considered statistically significant in the final multivariable model.
Results
Characteristics, demographics, and spatial distribution of study sample
The MMA comprises eight counties, with a population of 1,320,000 per the U.S. 2010 Census Bureau (Figure 1). At the Memphis study site, 977 children were enrolled; 842 (86.2%) had radiographic CAP and the specimens necessary to determine the etiology of infection. Of these, 810 (96.2%) resided in the MMA and were successfully geocoded (Supplementary Figure 1). The overall incidence of hospitalized pediatric pneumonia for the MMA was 28.72 cases per 10,000 children (95% confidence interval (CI): 28–30). Rates were higher for Hispanics, 75.2 cases per 10,000 (CI: 63–89) non-Hispanic Blacks, 33 cases per 10,000 (CI: 30–36), and other races, 37 cases per 10,000 (CI: 25–54) compared with White children (4 cases per 10,000 [CI: 3–5]). Most pneumonia cases 83.6% (184/220) were from Shelby County followed by Crittenden County 7.3% (16/220), and Desoto County 5% (11/220). The lowest number of cases was observed in descending order in the following counties: Marshall, Fayette, and Tunica.
Among 810 eligible CAP cases, 220 (27.2%) were identified to be from high- or low-risk CAP areas; 126 (57.3%) were from high-risk CAP areas, and 94 (42.7%) from low-risk CAP areas (Supplementary Figure F1). Figure 2 shows, at census tract level, spatial clusters for CAP in children included in our study. Most (44.1%) children admitted with CAP were <2 years of age (Table 1). The racial distribution of CAP cases was mostly NH-Black (76.3%), with a significantly higher proportion of NH-Black children living in high- compared to low-risk CAP areas (89.9% vs. 58.0%, P <0.01). The majority of children had public insurance (84.1%); and a greater proportion who reside in high-risk CAP areas, had public insurance (95.8% vs. 68.2%, P <0.01) compared to those who reside in low-risk CAP areas. Most of the included CAP cases were exposed to high levels of PM2.5 (63.8%), and a higher proportion of cases residing in high-risk CAP areas were exposed to high PM2.5 compared with cases living in low-risk CAP areas (75.6% vs. 47.7%, P <0.01).
Descriptive statistics for children hospitalized with community-acquired pneumonia (CAP) from higher than expected and lower than expected CAP areas (n = 220).a
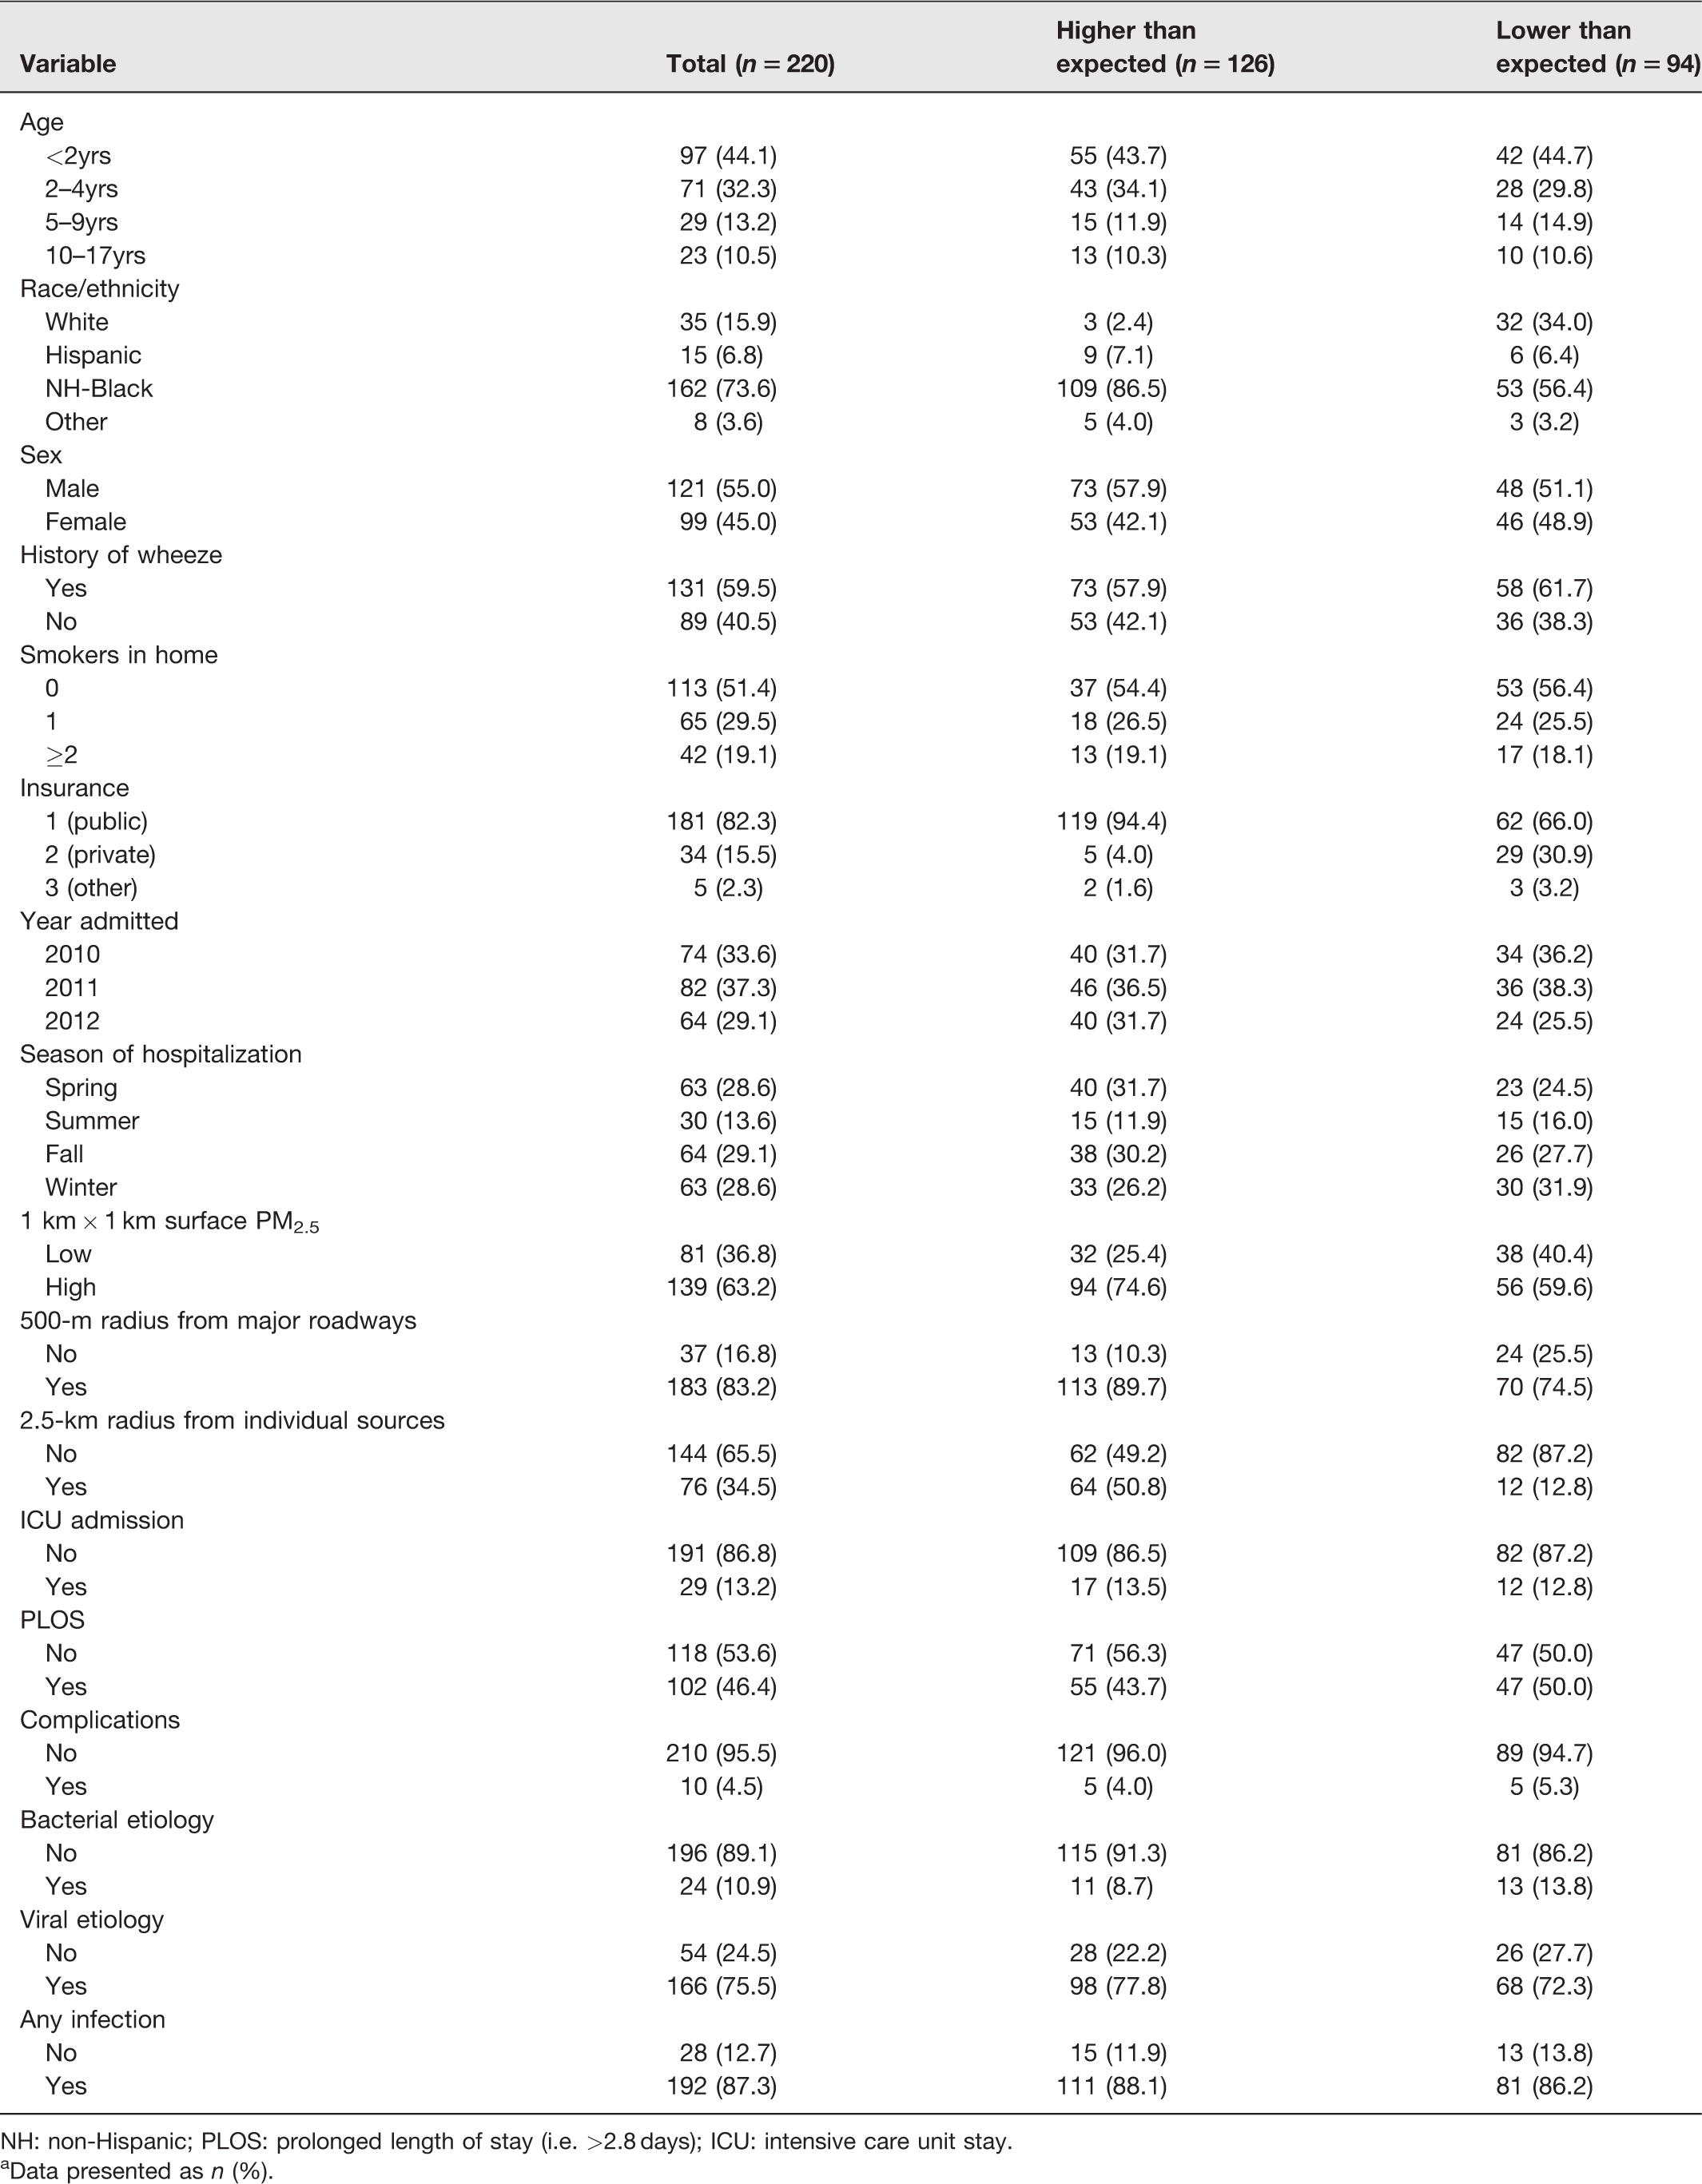
NH: non-Hispanic; PLOS: prolonged length of stay (i.e. >2.8 days); ICU: intensive care unit stay.
aData presented as n (%).
Bivariate analyses and multivariate analyses were conducted with a reduced sample size (n = 207) due to excluded cases belonging to categories where cell size was <10 (Supplementary Methods). In the bivariate analysis (Table 2), compared with children with CAP in low-risk CAP areas, children with CAP in high-risk areas were more likely to be NH-Black (OR 21.7; 95% CI 6.33–74.25) and Hispanic (OR 15.5; 95% CI 3.2–74.7). In addition, compared with children with CAP in low-risk areas, children with CAP in high-risk areas were less likely to have private insurance (OR 0.09; 95% CI 0.04–0.26) and were more likely to be exposed to high PM2.5 (OR 3.4; 95% CI 1.9–6.1).
Bivariate analysis for risk factors associated with residence in a higher than expected vs. lower than expected community acquired pneumonia (CAP) areas (n = 207).a
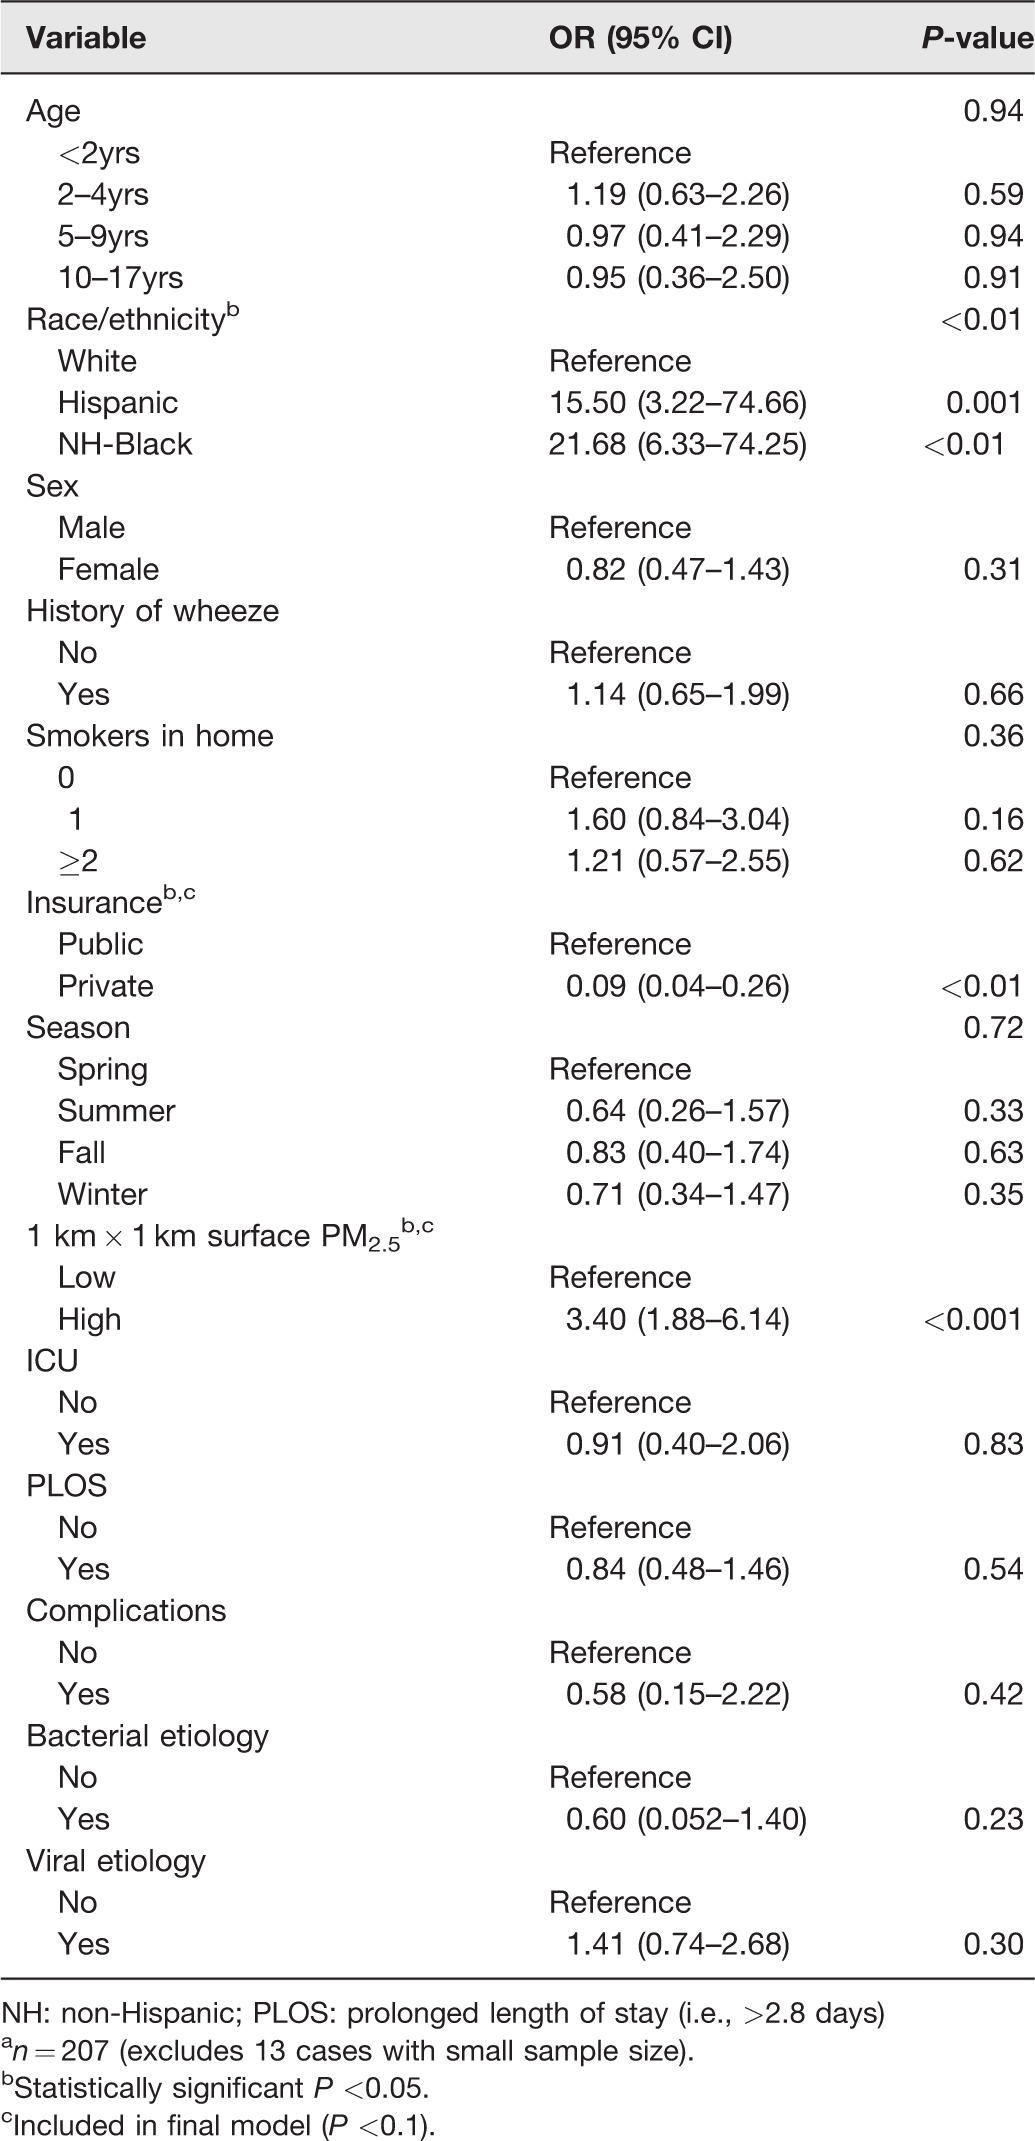
NH: non-Hispanic; PLOS: prolonged length of stay (i.e., >2.8 days)
an = 207 (excludes 13 cases with small sample size).
bStatistically significant P <0.05.
cIncluded in final model (P <0.1).
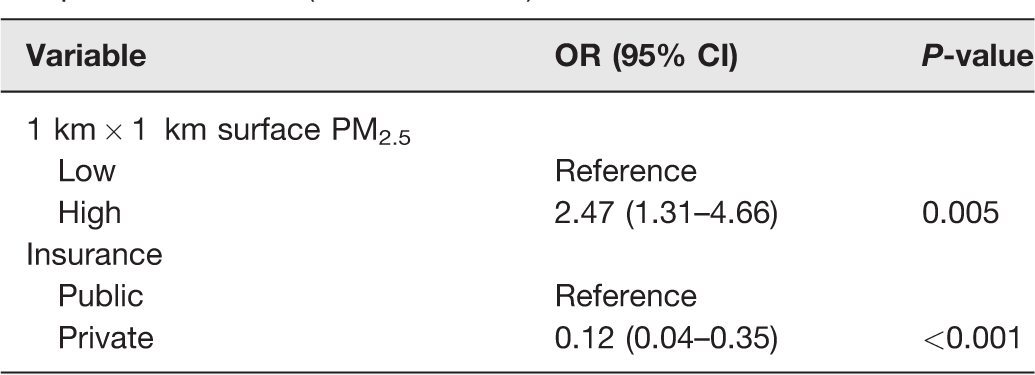
On multivariate analysis, we have shown two models (Tables 3 and 4). The first model includes PM2.5 exposure as the primary explanatory variable (Table 3). This model showed that compared to children with CAP in low-risk CAP areas, children with CAP in high-risk areas were more likely to have high PM2.5 exposure (aOR 2.47; 95% CI 1.28–4.76), and less likely to have private insurance (aOR 0.12, CI 0.04–0.34). The second model includes race and showed that compared with children with CAP in low-risk CAP areas, children with CAP in high-risk areas were more likely to be NH-Black (aOR 9.821; 95% CI 2.62–36.84) or Hispanic (aOR 6.43; 95% CI 1.20–34.60) versus White children, and were less likely to have private insurance (aOR 0.178; 95% CI 0.059–0.537). Children residing in high-risk CAP areas were also more likely to have high PM2.5 exposure (aOR 1.66; 95% CI 0.81–3.38), though not statistically significant.
Multivariable model results for residence in higher than expected versus lower than expected CAP areas with PM2.5 as the primary independent variable (reduced model).
Multivariable model results for residence in higher than expected versus lower than expected CAP areas (full model).
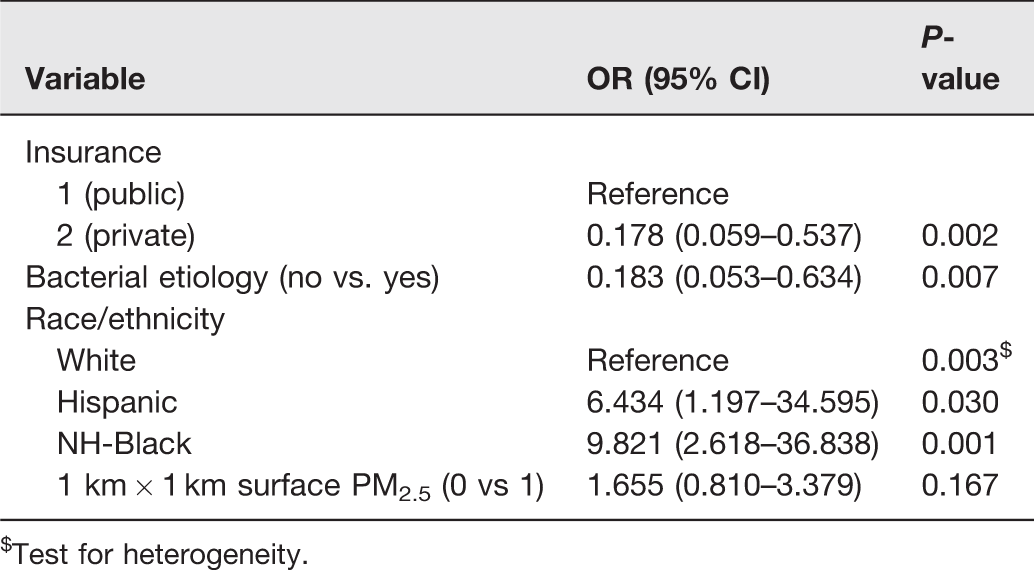
$Test for heterogeneity.
Discussion
In our prospective study of CAP in a metropolitan, racially diverse city with varying PM2.5 exposure, we found that PM2.5 levels are associated with geospatial patterns of CAP incidence and residence in CAP hotspot areas for children with CAP; however, race is a more significant factor associated with living in high-risk CAP areas. Insurance type is also associated with residence in high-risk areas for CAP in the MMA. Geospatial patterns of CAP incidence were concentrated among children living in north, south, and downtown in the City of Memphis and Shelby County. These findings are supported by previous studies which highlight geospatial patterns of CAP admissions,6,8,13,24,25,28,34,42–45 environmental exposure, specifically PM2.5, as a risk factor for CAP,2–5,7,13,43,46–49 and racial and socioeconomic differences in CAP distribution44,50–52 and in exposure to air pollution.53,54
Most pneumonia studies performed in high-income countries have not focused on socioeconomic disparities in the distribution of CAP.35,55–58 In the United States, there have been improvements in wide health disparities in mortality from pneumonia between Black and White children. 59 In this study, we do not directly measure socioeconomic status as the small sample size increases the risk of de-identification. Instead, we use insurance and race/ethnicity as proxies. In MMA, the race/ethnicity demographic shows non-Hispanic Blacks are the majority 60 and also represent the largest racial/ethnic group living in poverty. 60 Our findings show race/ethnicity, and public insurance are associated with residence in high-risk CAP areas. This finding may imply a persisting socioeconomic disparity for CAP and is supported by previous studies.11,44,50,51,61–65 Potential explanations for this socioeconomic disparity include low maternal education, 51 and the disparity may be potentiated by parent/patient factors such as poor access to primary care, and medication adherence issues.62–64 This disparity is likely associated with suboptimal living conditions such as having poor indoor/outdoor air quality, as shown by high PM2.5 exposure in high-risk CAP areas. The use of GIS to identify CAP risk areas helps demonstrate geographic high-risk CAP areas which need further study and may benefit from targeted holistic interventions including cleaner air.44,62
The MMA has higher than average concentrations of chronic childhood respiratory conditions such as asthma which have been noted in the same geographical areas found in this study. 61 This is thought to be related to the presence of industrial facilities and PM2.5 mobile emissions sources in these areas. 61 Previously published studies assessing environmental exposures and respiratory-related admissions in children have also noted CAP hotspot areas to have more sources of environmental pollution such as PM2.5 stationary emission sites and Superfund sites.8,44,61,66,67 Such studies highlight the need to include geospatial risk factors of CAP in children. To the best of our knowledge, this is the first study to show the association between residence in high-risk CAP areas and exposure to high PM2.5 using satellite-derived PM2.5 estimates in a prospectively collected cohort of children hospitalized with radiographic and clinical CAP. This finding highlights the areas in the MMA, and other similar communities, as locales where interventions for cleaner air and other strategies to decrease air pollution can be focused and may help reduce CAP rates. Our findings suggest that residential location is associated with CAP incidence among children in the MMA.
PM2.5 originates from the combustion process of diesel and gasoline-powered vehicles, and burning of biomass and coal to generate power among other sources. 46 Satellite-derived PM2.5 has emerged as a more sensitive measure for assessing PM2.5 effects on health outcomes compared with ground monitoring networks, proximity measures (see Supplementary), and use of air quality models.14–18,68 For this study, PM2.5 levels were obtained via high spatiotemporal resolution 1 km by 1 km grid of satellite-derived PM2.5 concentrations. The population-derived mean for high PM2.5 in the MMA (10.75 μg/m3) was less than the annual EPA allowable threshold (<12μg/m3). Despite this, we detected a significant and clinically relevant association of geographic clustering of CAP cases to PM2.5. We also assessed the association using measures of PM obtained by other measures (Supplementary Table 1(b)). While a few studies have assessed respiratory outcomes in children using high resolution PM estimates,9,10,17 this study is unique because, using satellite-derived PM2.5, we are able to show association of possible PM2.5 effects at exposure levels lower than the current EPA PM2.5 limit. This contributes to the body of evidence supporting a need for continuous review and adjustment to health standards given harmful effects from PM2.5 exposure. 41
Viral infection is more likely to spread through close proximity with an infected person such as seen in daycares, homes with high number of occupants, and in children <2 years of age. The etiology of infection seen in most CAP cases residing in high-risk areas, specifically viral etiology of infection, may speak to the pattern of exposure in high-risk areas compared to low-risk areas where there may be less daycare attendance, and lower number of occupants in the home. While we did not assess daycare attendance and crowding as risk factors in this study, these are known risk factors 20,52,69,70 and are common in areas of low socioeconomic status (SES) such as the high-risk areas in this study.
There are several limitations to our study. First, conducting a retrospective analysis on a sample that did not include prospective measurement of environmental exposures lends itself to uncertainty in the quality of data for PM. And while 1 km by 1 km PM2.5 is thought to be highly sensitive, it is still an estimate of individual level exposure. Second, it is clear to us residents in high-risk CAP areas may be affected by many things other than pollution. There are other variables that cannot be directly measured and instead we have used proxies for such variables; for instance, we use race/ethnicity and insurance as proxies for SES. There may be other ecologic factors that may also play a role given the concentration of high-risk CAP areas in documented pollution sites (Figure 2). We recognize, given the existing literature, that hotspots tend to be present in inner city locations versus suburban areas and this is what our data and results reflect. Third, despite accounting for market share in our incidence calculations, it is unclear if market share is uniform across the entire MMA. Fourth, although local cluster detection using Turnbull’s method allows for variations in population density when adjusting for spatial clusters of CAP incidence, it requires a user-defined population size for the area. Despite this constraint, this method is computer-intensive and fully accounts for spatial autocorrelation during cluster evaluation to identify the most significant cluster locations of CAP incidence. Fifth, our sample size was small and thus may have limited power to detect differences; however, this study is useful to inform a larger prospective study of similar populations. And lastly, because this is a retrospective study using home addresses to estimate PM2.5 exposure, we could not account for other areas (i.e. school, other homes, parks, etc.) in which the children in our population could have been exposed to indoor and outdoor pollution, which could also have been risks for the development of CAP.
In conclusion, we demonstrated that in the MMA, race/ethnicity, and insurance, both proxies of SES are significantly associated with residence in a high-risk area for CAP. In addition, spatial detection of high-risk areas for CAP in children showed these children reside in areas with higher PM2.5 concentrations in the MMA. Interestingly, mean PM2.5 levels of 10.75 μg/m3, but less than the annual EPA allowable threshold of <12μg/m3 were associated with high-risk areas for CAP in children suggesting that children may be particularly vulnerable to lower PM2.5 levels. The observations from this paper inform future work where the study of disease patterns with environmental influences may incorporate spatial analysis to provide a more comprehensive evaluation. Future studies could consider using personal PM monitors for children in high-risk areas to evaluate their individual exposure levels to help quantify their risk as it relates to CAP and other respiratory diseases. Lastly, the results of this study may be used to inform further research aimed at at-risk communities and vulnerable populations in an effort to reduce CAP burden.
Supplemental Material
sj-pdf-1-ebm-10.1177_15353702211014456 - Supplemental material for Particulate matter exposure predicts residence in high-risk areas for community acquired pneumonia among hospitalized children
Supplemental material, sj-pdf-1-ebm-10.1177_15353702211014456 for Particulate matter exposure predicts residence in high-risk areas for community acquired pneumonia among hospitalized children by Tonny J Oyana, Jagila Minso, Tamekia L Jones, Jonathan A McCullers, Sandra R Arnold and Stephania A Cormier in Experimental Biology and Medicine
Footnotes
AUTHORS’ CONTRIBUTIONS
JM, TJO, and SAC conceptualized the study, designed the experiments and wrote the manuscript. JM and TJO performed data collection and executed data analyses. AB, SJ, JAM, and SRA enrolled the study subjects for the EPIC study and provided the clinical and geographical data for the study. TLJ performed statistical analysis of the data and drafted statistical methods. All authors reviewed and approved the final manuscript as submitted and agree to be accountable for all aspects of the work.
Declaration OF CONFLICTTING INTERESTS
The author(s) declared no potential conflicts of interest with respect to the research, authorship, and/or publication of this article.
FUNDING
The Etiology of Pneumonia in the Community (EPIC) study was supported by the Influenza Division of the National Center for Immunization and Respiratory Diseases at the Centers for Disease Control through cooperative agreements with each study site. This publication received support from the Le Bonheur Children’s Foundation Grant to JMW. It was also supported by the National Institutes of Health (NIEHS P42ES013648 and R01ES015050 and NIAID R01AI090059) to SAC. The content is solely the responsibility of the authors and does not necessarily represent the official views of the National Institutes of Health.
DISCLAIMER
The findings and conclusions in this report are those of the authors and do not necessarily represent the views of the Centers for Disease Control and Prevention.
SupplementAL MATERIAL
Supplemental material for this article is available online.
References
Supplementary Material
Please find the following supplemental material available below.
For Open Access articles published under a Creative Commons License, all supplemental material carries the same license as the article it is associated with.
For non-Open Access articles published, all supplemental material carries a non-exclusive license, and permission requests for re-use of supplemental material or any part of supplemental material shall be sent directly to the copyright owner as specified in the copyright notice associated with the article.