
Abstract
Biological pathways play a crucial role in the properties of diseases and are important in drug discovery. Identifying the logical relationships among distinctive phenotypic clusters could reveal possible connections to the underlying pathways. However, this process is challenging since clinical phenotypes are often available through unstructured electronic health records. Moreover, in the absence of a standardized questionnaire, there could be bias among physicians toward selecting certain medical terms. In this article, we develop an efficient pipeline to address these challenges and help practitioners to reveal the pathways associated with the disease. We use topological data analysis and redescriptions and propose a pipeline of four phases: (1) pre-processing the clinical notes to extract the salient concepts, (2) constructing a feature space of the patients to characterize the extracted concepts, (3) leveraging the topological properties to distill the available knowledge and visualize the extracted features, and finally, (4) investigating the bias in the clinical notes of the selected features and identify possible pathways. Our experiments on a publicly available dataset of COVID-19 clinical notes testify that our pipeline can indeed extract meaningful pathways.
Keywords
Impact Statement
The study of biological pathways is an active area of research and helps scientists develop drugs. We propose an efficient pipeline to infer the existence of alternative biological pathways from clinical phenotypes. Our source of data is unstructured clinical notes. First, we extract the phenotypes. Then use redescriptions to construct a topological space corresponding to the distinctive phenotypic clusters. Next, we utilize topological properties of the space to infer biological pathways. Samples highlighted by our extracted pathways are good candidates for analyzing their gene expression levels or other genetics or proteomics data that may mark these as distinctive pathways. This opens the window for further research on those samples, which helps better understand the mechanism of those biological pathways.
Introduction
The study of biological pathways helps scientists learn more about diseases and develop new drugs, hence tools that could assist scientists in identifying biological pathways associated with diseases are of great importance. The recent COVID-19 pandemic as well prompted the urgent need for efficient methods that could help researchers better understand the condition of the disease in a timely manner. In this article, we propose an efficient pipeline to infer the existence of multiple alternative biological pathways from clinical phenotypes. The shorter version of the article was presented by Karisani et al. 1 As used here, “Pathway” refers to physiologically connected processes, ranging from a cascade such as the clotting cascade, to looser systems such as the renin–aldesterone–angiotensin system (RAAS) that angiotensin-converting enzyme 2 (ACE2) is a part of. Our approach is to identify distinctive phenotypic clusters satisfying logical relationships (implication) and to seek possible connections to the underlying pathways. For this aim, we utilize topological properties – homology cycles – among the phenotypic clusters. Given the possibility of multiple paths to severity that typically mark complex diseases, a goal would be to identify logical relationships among phenotypic clusters that may point to distinct pathways. Cycles in computational homology may identify candidates for multiple pathways. We use unstructured clinical notes as the source of information to automatically extract phenotypes to be used in our topological model. Phenotypes are the symptoms and signs that reflect the presence of disease – in the following, we refer to them as symptoms.
Advancement in technology has helped scientists to garner enormous amounts of biomedical data. This has provided the community with unprecedented opportunities to study and better understand the spread of diseases. However, this burst of information has posed significant challenges to the traditional data analysis and visualization techniques. Traditional infographics, such as Venn diagrams, which are still widely used to compare and contrast set of symptoms, fail to aid practitioners in analyzing large set of symptoms. Thus, tools that can effectively employ the techniques in other scientific communities to facilitate this process are of immense value.
Machine learning models and statistical methods are used to exploit biomedical data. Particularly, patient similarity and symptom clusters are the two concepts that have been widely explored in recent literature. Patient similarity aims to identify patients according to similarities of their health records, including phenotypes and genomic profiles. In this area, several models have been proposed for disease predictions and clustering patients based on selected similar biomarkers, 2 to perform outcome prediction tasks, 3 and in general to improve precision medicine.4,5 On the contrary, symptom clusters relate to sets of symptoms – usually more than two symptoms within each set – that occur together and might share the same etiology; moreover, relationships among symptoms within a cluster are stronger than the ones across the clusters. 6 For a thorough review of methods of identification of symptom clusters, see the study by Barsevick. 7 However, here we add to the body of literature by considering clusters of symptoms whose samples are not necessarily independent from each other but give rise to similar subsets of patients within a cohort – known as redescriptions. We construct a topological space based on the closeness of those clusters and investigate its topological properties to identify underlying pathways.
In our experiments, we use clinical notes as the source of data. Combining electronic health records from multiple sources provides a valuable pool of data for researchers to address crucial questions.8,9 However, a well-designed epidemiological study would follow a standard questionnaire containing a response to all the symptoms and signs of interest. Hence, unstructured clinical notes may be biased by which physician filled out the forms; consequently, that could introduce a systematic bias in the study. 10 We apply statistical analysis on the symptoms associated with the extracted topological properties to investigate a possible bias.
We propose a pipeline to automatically extract candidate pathways associated with a disease from clinical notes. Our pipeline, which is based on the notion of redescriptions and the topological properties among them, consists of four phases: (1) pre-processing the notes and identifying the candidate symptoms, (2) mapping the symptoms to the space of the patients, (3) extracting the topological properties and their visualization, and finally, (4) perform statistical analysis to detect the possible bias in the extracted features. We have evaluated our pipeline in a publicly available dataset of COVID-19 clinical notes. The results show that our model can extract meaningful pathways. We demonstrate that there are potentially distinctive pathways between coughers and non-coughers among patients with abnormal sputum.
Background
In this section, we briefly introduce the notion of persistent homology, which is the main component of our proposed pipeline. Persistent homology is a tool from topological data analysis (TDA), which uses techniques from Algebraic Topology to analyze topological spaces, particularly point cloud data. TDA has been widely applied to solve biological problems. 11 Here, we avoid the mathematical detail, which is beyond the scope of this article. For a thorough description, see the study by Dey and Wang. 12
Let
Given a set of data points
An example of a simplicial complex is Čech complex. Figure 1 shows a simple illustrative example. The goal is to recover the topological invariants of the space in Figure 1(a), in which the zeroth betti number is 1, since there is only one connected component; and the first betti number is 2, since there are two independent holes; the higher dimensional betti numbers are zero. The dataset
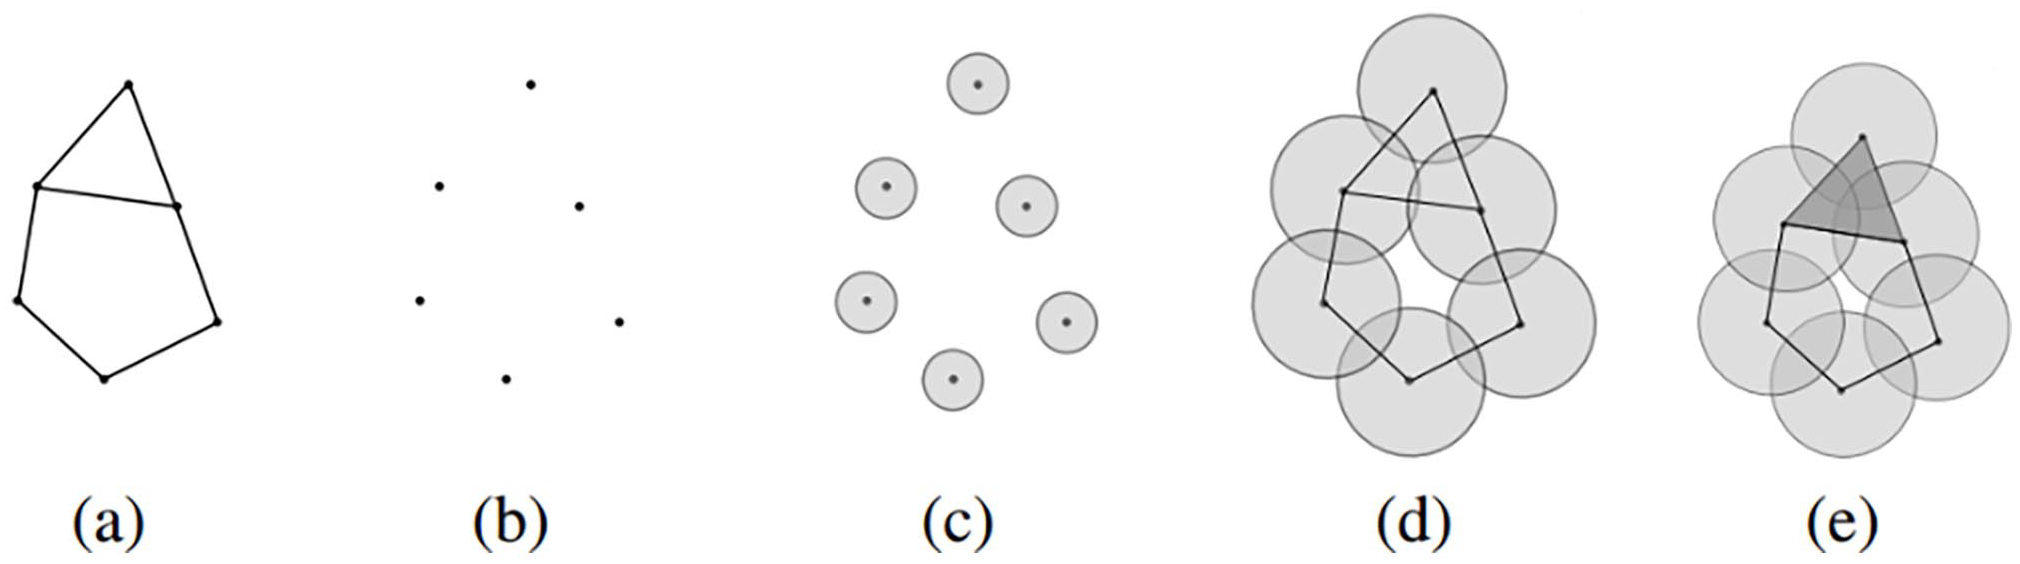
Recovering topological properties using simplicial complexes.
To construct the Čech complex over
A diagram known as barcode is commonly used to keep track of the lifetime of topological properties. In the barcode, each topological property is represented as a horizontal line segment. The line segments span the period that the corresponding topological properties exist, along the parameter axis (i.e. radius). In the above example, assuming the edges in Figure 1(a) have equal lengths, Figure 2 illustrates the barcode of 0-dimensional topological properties. Therefore, each line segment in the barcode is identified to a connected component. In the beginning of the filtration there are six data points corresponding to six connected components, hence there are six bars at radius zero. A 0-dimensional topological property disappears when its corresponding connected component gets merged with another connected component. In Figure 2, five bars last until the radius reaches
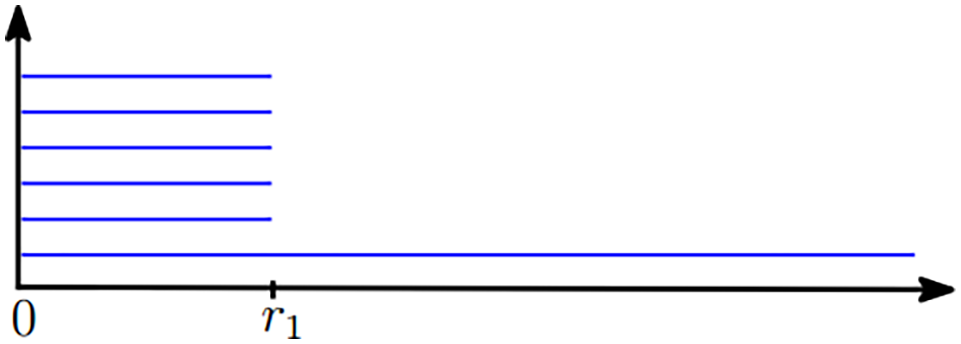
Barcode of 0-dimensional topological properties of the sampled points in Figure 1(b). (A color version of this figure is available in the online journal.)
Materials and methods
In this section, we first introduce our general pipeline and then discuss our experimental setup.
Proposed pipeline
We are seeking to identify evidence of multiple distinct biological pathways leading to disease; for this aim, we propose a pipeline of four phases. In the first phase, we process the unstructured clinical notes to extract the set of symptoms and their corresponding patients. In the next phase, we define the feature space, the sampling strategy, and the metric to measure the similarity between the data points that are based on the notion of redescription. Next, we extract the topological properties using persistent homology and then visualize them to identify important topological properties. Finally, we measure the bias among the symptoms of the selected topological properties to infer possible pathways.
Concept extraction
We carry out the first phase in three steps: (1) We parse the clinical notes and map the biological terms to the concepts in a medical ontology. This step uniforms physicians’ records and utilizes techniques in natural language processing (NLP), which are widely applied to analyze biomedical documents. (2) Since the clinical notes have informal language model, their parsing can be noisy. Thus, we ask a user (system user, e.g. practitioner) to cure the candidate relations and resolve the inconsistencies. Inconsistencies of the mappings could vary depending on the method used in the first step. Despite the significant advances in neural text processing over the last decade, the existing methods are not adequate to effectively parse the medical records.14,15 An example of that is misspelling – the use of unknown words – which is a challenge in NLP. Manually curating the automated results is crucial to generate high-quality mappings. 16 Thus, to reduce the noise and ensure that the extracted terms are indeed valid medical concepts, we use manual supervision in step 2 (as mentioned above) to validate the automated associations between the extracted terms and the concepts in the medical ontology. (3) We use electronic health records to construct a binary association matrix between the patients and the extracted concepts.
Feature space construction
In our model, features correspond to the patients, and the data points correspond to the combination of concepts – we call them patterns. Given a feature vector – a data point – a feature is set to 1 if the corresponding patient shows all the symptoms associated with the data point. Thus, a data point is understood as a cluster of patients, who share the same set of symptoms, i.e. pattern.
Patterns are generated from the concepts that are extracted in the previous phase. We only select the patterns whose clusters are non-empty. However, the space of all
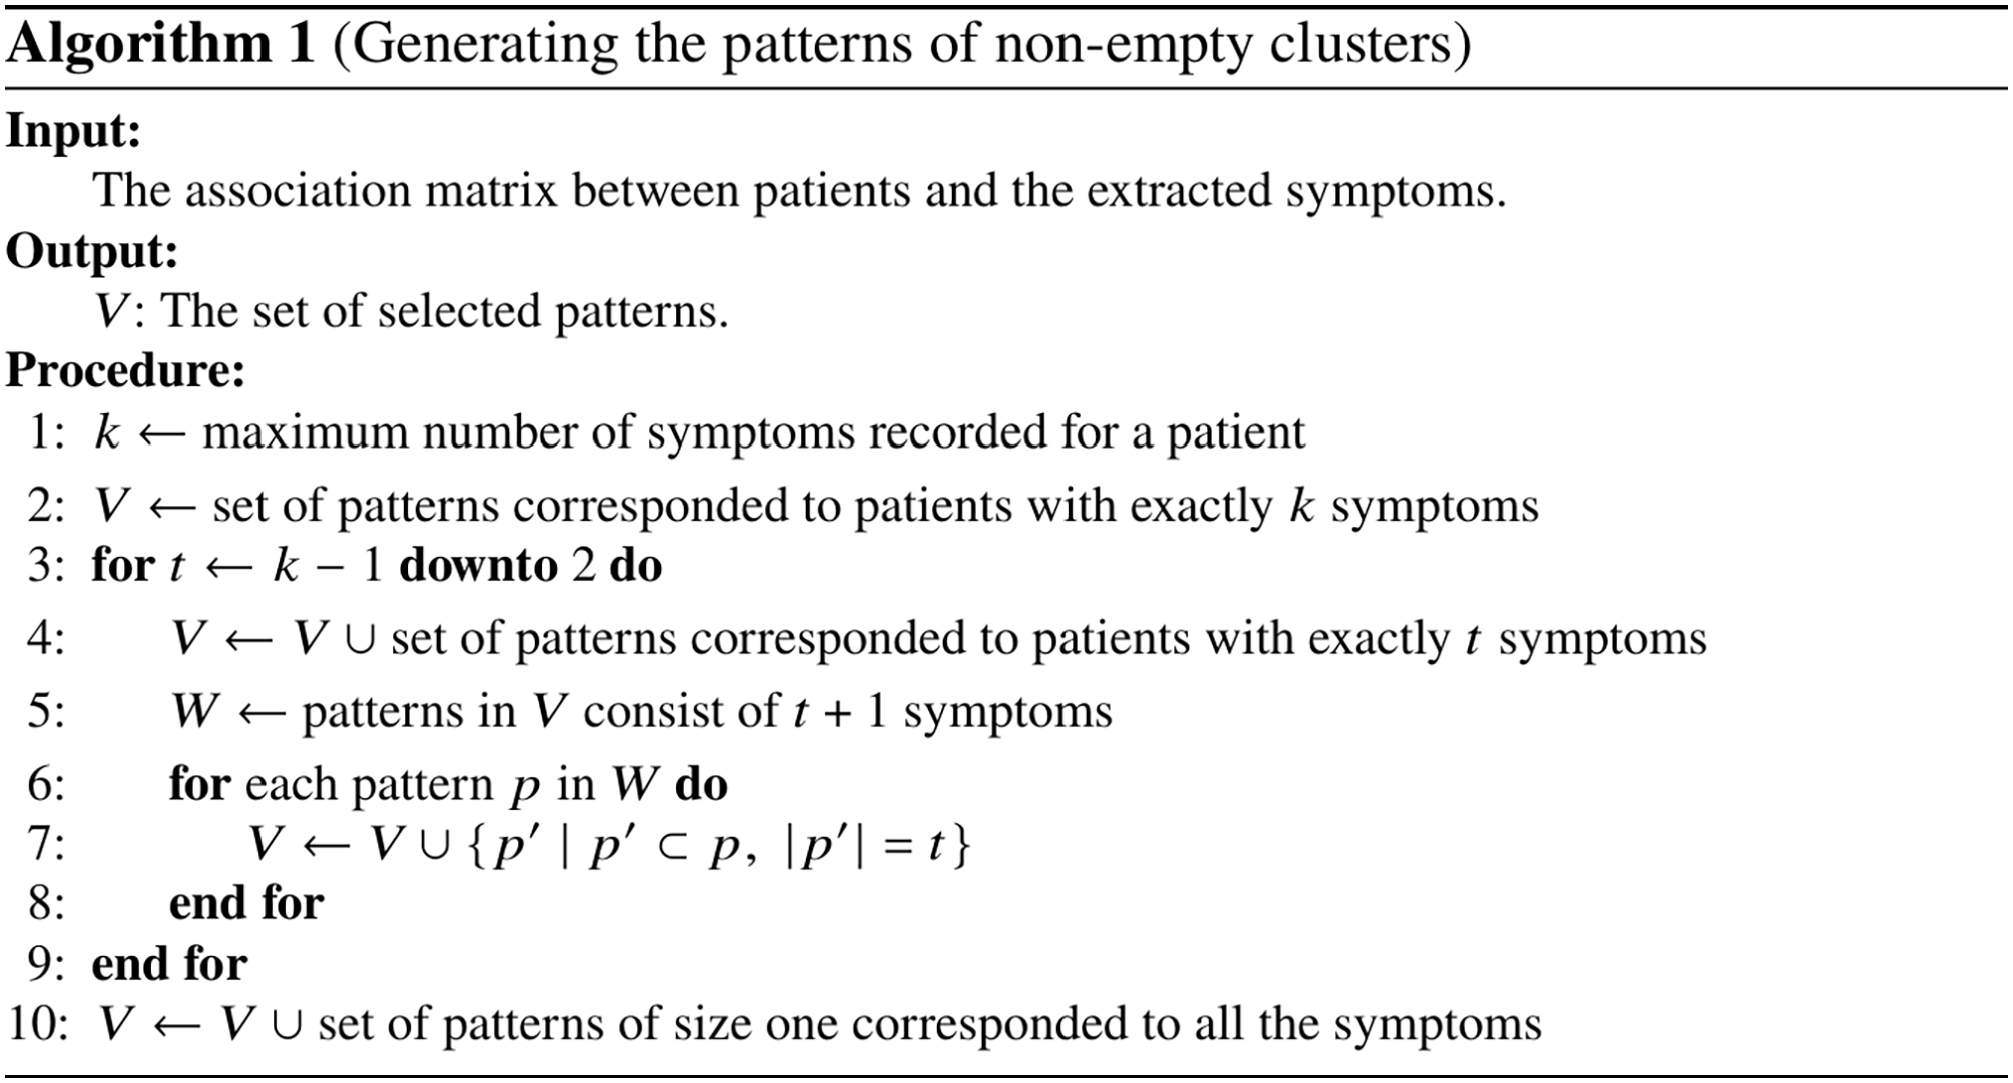
Algorithm 1 to construct patterns–i.e., data points–using the patients-symptoms association matrix.
Line 1 determines the variable
The complexity of Algorithm 1 is exponential in terms of the total number of extracted symptoms. However, in real life, rarely the size of the search space will be exponential, since often not all possible
To make an inference about the underlying pathways, it is important to analyze the patterns whose clusters are statistically significant. The challenge involving higher order correlations is that some moments may appear to be non-zero, even when there are subsets of participating variates that are statistically independent of each other. One solution to this problem is to compute joint cumulants (also called Ursell functions). Percus proved that cumulants involving products of independent subsets of variables are zero. 17 This provides a way to exclude patterns whose moments involve those subsets of independent variates.
Let
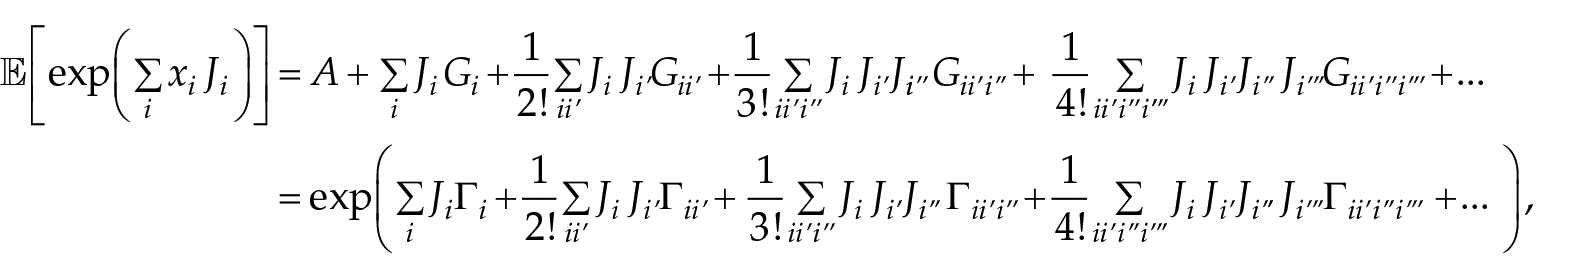
where
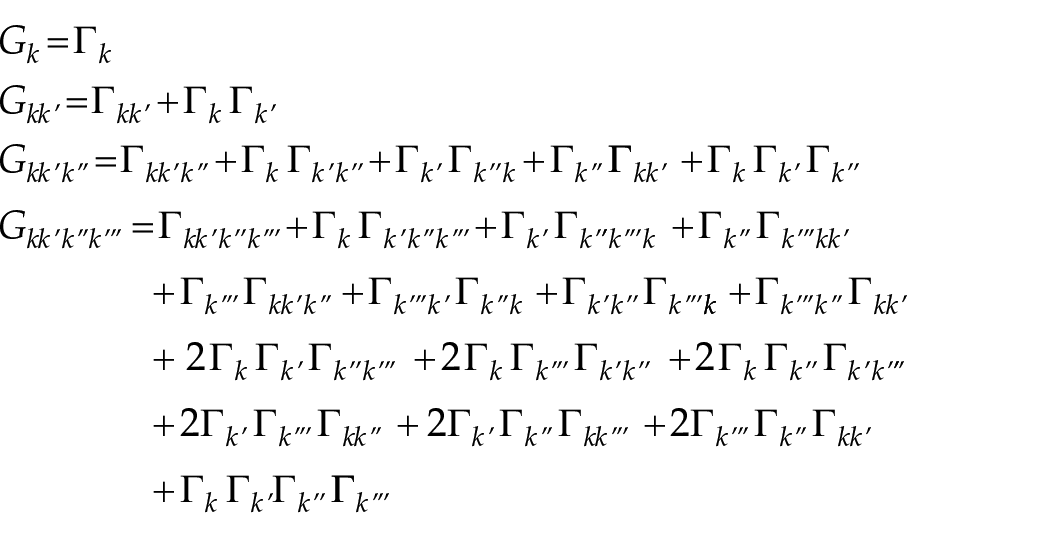
We apply the above factorization to the clusters to obtain estimates of the cumulants. We constructed a null hypothesis representation by repeatedly computing the cumulants on randomly shuffled variates following Fisher-Yates (pp. 26–27) 18 to determine if the measured cumulants differed from variations expected for random uncorrelated samples.
After selecting the significant patterns, we associate to each selected pattern a vertex (i.e. data point). To define the distance function between all the patterns, we first introduce the notion of redescription.
Redescriptions are used to identify the phenomena that occur in separate ways.19,20 Two different sets of symptoms, which correspond to the same group of patients are an example of redescriptions. They can highlight the underlying pathways and are used to derive rules in pathways.
21
Redescriptions are mathematically formalized using Boolean algebra. Suppose
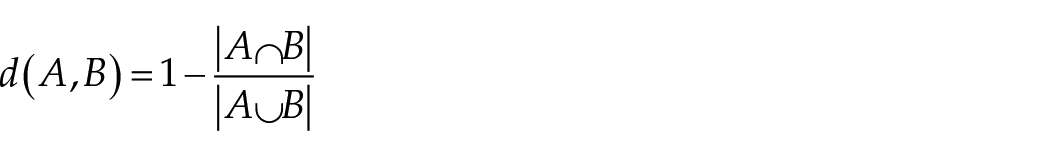
when
Thus, we consider Jaccard distance to measure the distances between the sampled data points.
Topological analysis and visualization
In this phase, we explore the underlying structure of the space of data points representing the patterns using TDA. We employ Vietoris-Rips (VR) complexes to construct the filtration. The VR complex is an abstract simplicial complex with 0-simplexes as the data points, and
First, the initial simplicial complex is set to be the collection of 0-simplexes corresponding to the sampled data points – that is, the clusters of patients selected in the previous phase – and the VR complexes are constructed considering Jaccard distance as the filtration parameter. Next, the barcodes corresponding to the topological properties of dimension one and higher are generated and visualized (Note that topological properties of dimension zero are the connected components. They show significant relationships between phenotypes, however, they do not reveal logical relationships – implications – among patterns). Finally, the important bars are identified, and their representative cycles are retrieved to identify the logical patterns and infer the hypotheses.
Bias in the clinical notes
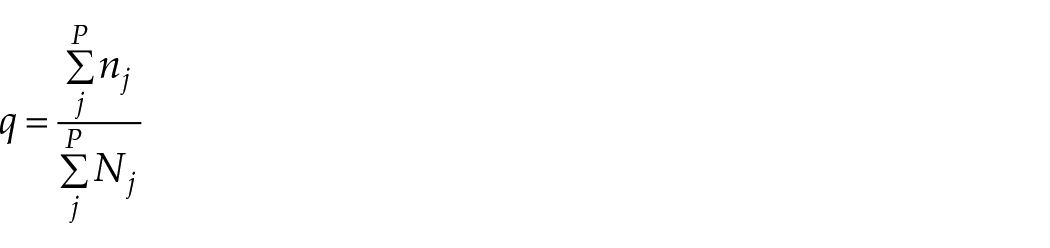
Samples collected from unstructured clinical notes are prone to bias. In the absence of a standardized questionnaire, individual physicians could notice and record distinct sets of symptoms. To identify that there was a bias in whether a term might have been selected or not by certain physicians over others, we apply a standard
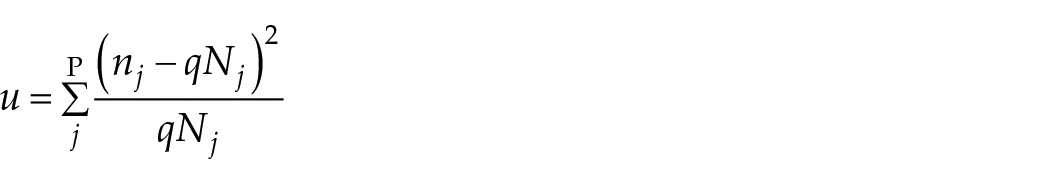
where, for a population j,
Finally, we obtain a degree of certainty to infer hypotheses regarding the existence of alternative biological pathways.
Experimental setup
We begin this section by describing the dataset, then we discuss the experiments.
Dataset
We used the dataset introduced in the study by Xu et al. 22 The dataset is continually updated with the available records of confirmed COVID-19 patients. We used the version published on 8 June 2020. Among the available records in the data set, we retained all the records that their “symptom” field was non-empty, this amounted to 1513 patients. This field, which is a textual feature, is a clinical note describing the patient’s medical state. Of the 1513 subjects included in the study, 640 were women (42.3%) and 873 were men (57.7%).
Experimental details
In the first phase, to parse the clinical notes and extract the biomedical terms, we used Amazon Comprehend Medical (ACM), an online proprietary NLP programming interface to analyze the unstructured clinical notes. For technical details regarding ACM see the study by Jin et al. 23 We also used the International Classification of Diseases (ICD-10-CM) to select the concepts. Extracted terms are mapped to the concepts by ACM, which brings more uniformity to the translated physician comments. ICD is a medical ontology, published by the World Health Organization to classify diseases, symptoms, and other medical conditions in a comprehensive, hierarchical manner.
ACM associates a list of ICD-10-CM codes to each extracted medical condition, ordered by their confidence scores. Hence, for each extracted term, we retained a code with the highest confidence score. If a medical condition was associated to more than one ICD-10-CM code with high confidence scores, to prevent loss of information we considered all those codes as a group and annotated them by their common prefix code. An example of that includes R53. = {R53.1: Weakness, R53.81: Malaise, R53.83: Other fatigue}. Table 1 provides the list of ICD-10-CM codes that are grouped together. We also incorporated manual supervision when ACM was not able to detect a term due to misspellings, such as “Mialgia” and “Milagia” for “Myalgia.”
Grouped ICD-10-CM concepts.
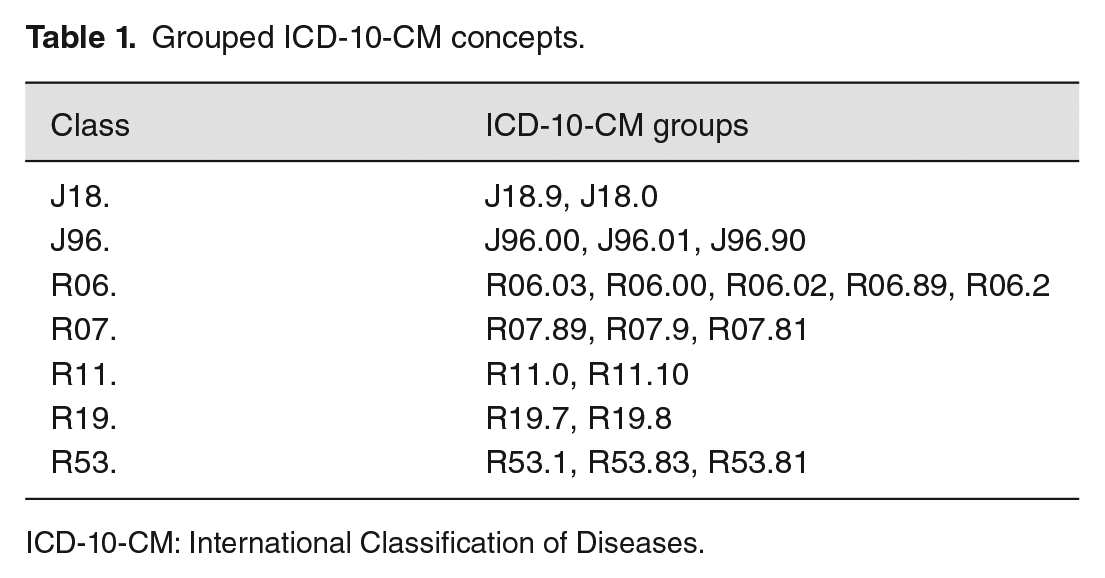
ICD-10-CM: International Classification of Diseases.
The first phase of the pipeline resulted in 86 ICD-10-CM codes. However, most clusters associated with the codes were sparse (two or three samples). We filtered sparse classes to enhance the validity of the analysis by obtaining stronger associations among redescriptions. Thus, we retained 31 ICD-10-CM codes. Table 2 presents the selected classes and their number of patients. Based on the data, fever, cough, and fatigue are the most common symptoms among the COVID-19 patients.
Thirty-one ICD-10-CM concepts with the number of patients in each class and their respective percentage of total.
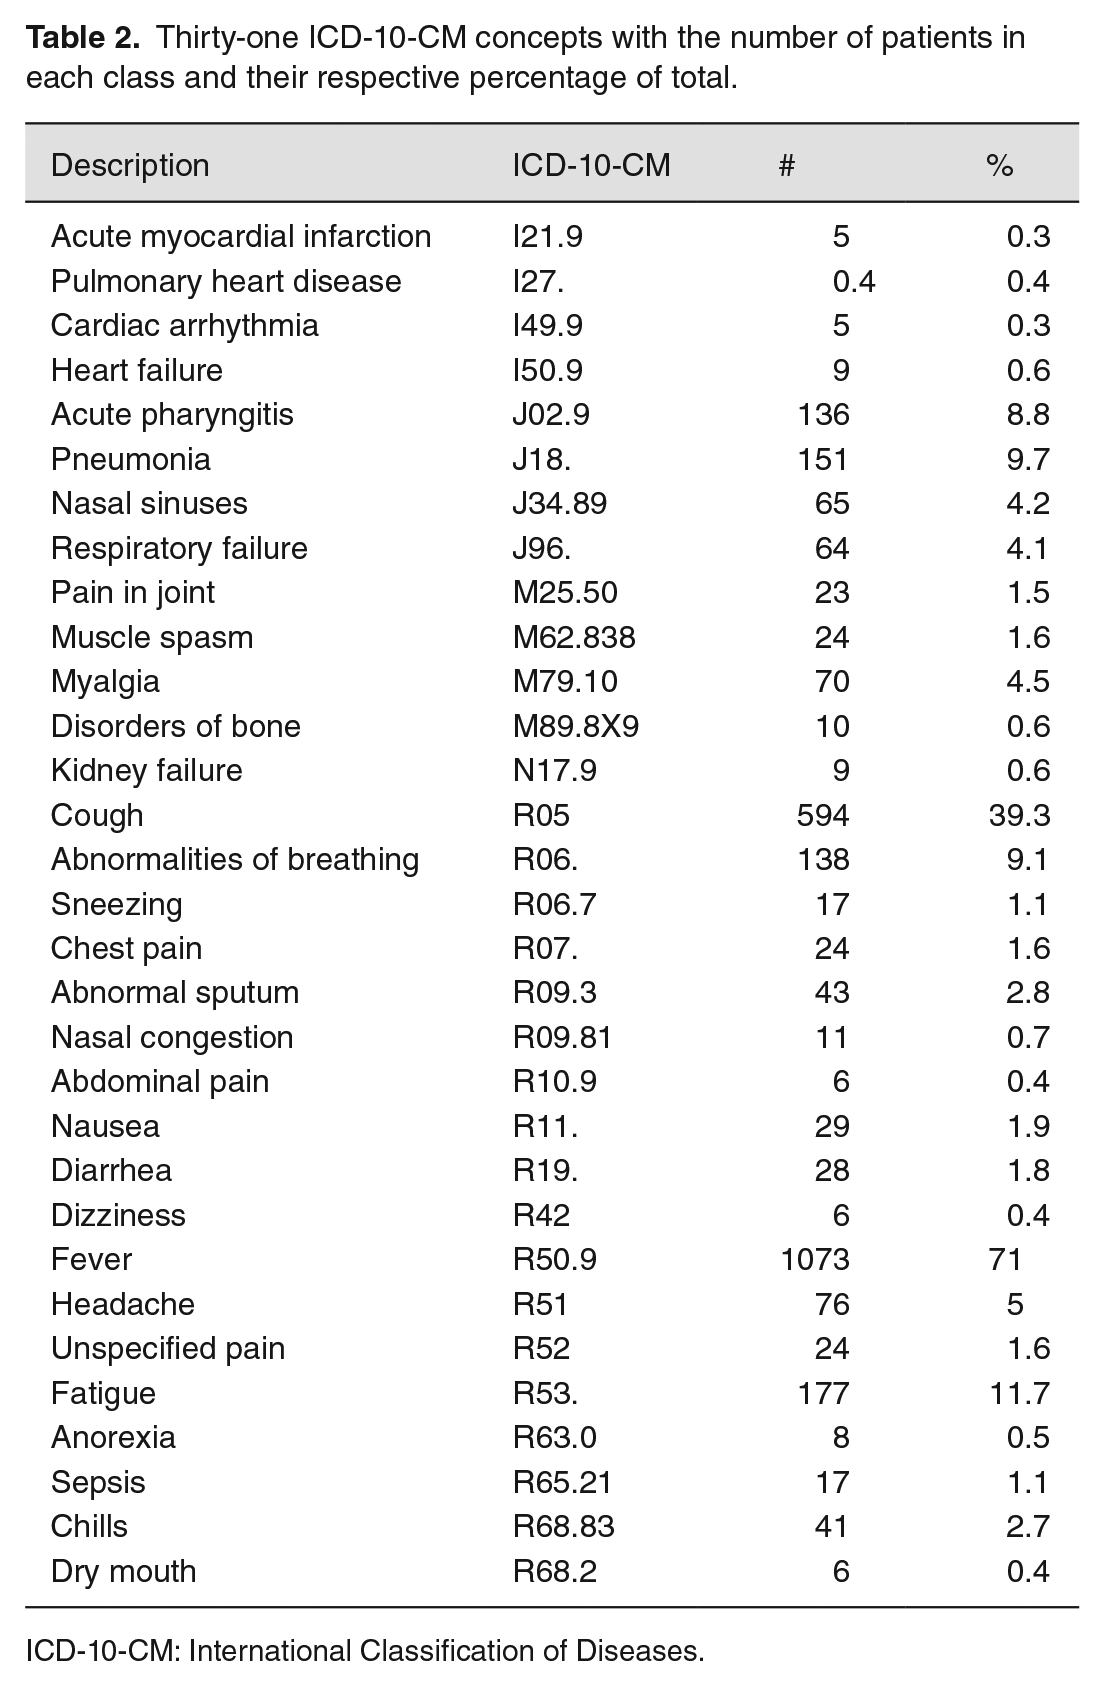
ICD-10-CM: International Classification of Diseases.
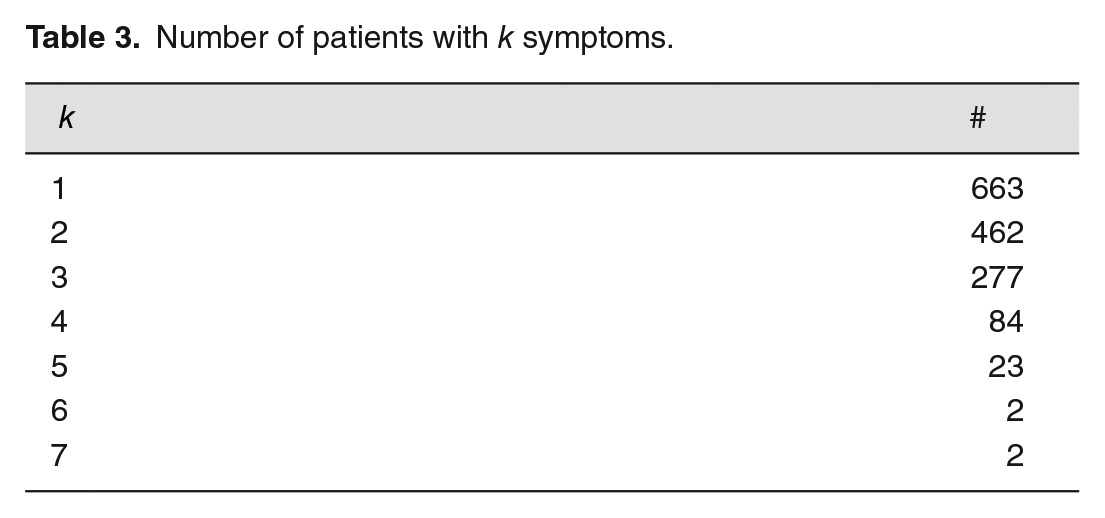
In the second phase, we used Algorithm 1 to generate the combinations of codes from the selected classes. Since the algorithm takes advantage of patterns obtained from each patient’s set of symptoms, we provided the number of patients who experienced
Number of patients with k symptoms.
In the third phase, we used Dionysus package for the construction of simplicial complexes and visualization. We also incorporated the Cyclonysus implementation to retrieve the representative cycles of the one-dimensional topological properties. To construct the VR filtration, we set the threshold of the filtration parameter to 0.5. Because Jaccard distance is interpreted as the fraction of subjects that are not shared between the two clusters, hence a distance exceeding 0.5 represents a situation where there is less than 50% chance for any subject to be in both clusters, which does not imply strong clinical relationship among the patterns.
Before we present the main results of the proposed pipeline as a motivating example, we report our experiments on analyzing the extracted data using one of the well-known algorithms.
Biclustering
Biclustering algorithms 24 have been widely applied to analyze the association matrix between the samples and the phenotype features and, in particular, are used to identify subgroups of patients who exhibit similar features.24,25
We are interested in identifying evidence that highlights multiple distinctive biological pathways that lead to the disease. For redescription analysis, and TDA, we are seeking distinct and independent descriptions – patterns – that capture the same subjects, marking connections between phenotypes and underlying biological processes tying these phenotypes together. By Percus’ theorem, cumulants represent factored correlations, which cancel if the cumulant is comprised of independent subsets of features, so they provide a distinct and unique set of phenotype combinations that may be validated by significance tests. Since biclustering generally seeks relationships between subject subsets that share groups of features identified by some variant of low two-way analysis of variance (ANOVA)-like within-groups variations, we considered whether the information provided with these techniques would be informative.
We applied several biclustering algorithms, implemented in the biclust package (version 2.0.3) using the R language (version 4.7.8), on the association matrix between the patients and the ICD-10-CM codes that we obtained from the first phase of the pipeline. The PLAID model offered the largest number of clusters. Figure 4 shows several clusters dominated by just one or two phenotypes, and one large cluster with a number of phenotypes. The heatmap is also shown in Figure 5. The largest cluster may indicate systematic reporting bias excluding some comorbid features among COVID patients. In this situation, approaches such as biclustering identify multivariate associations, but we require more information in order to (1) extract logical implications from the data as provided by redescriptions and (2) derive their topological connectivity elucidating the multiple etiological pathways typifying complex diseases.
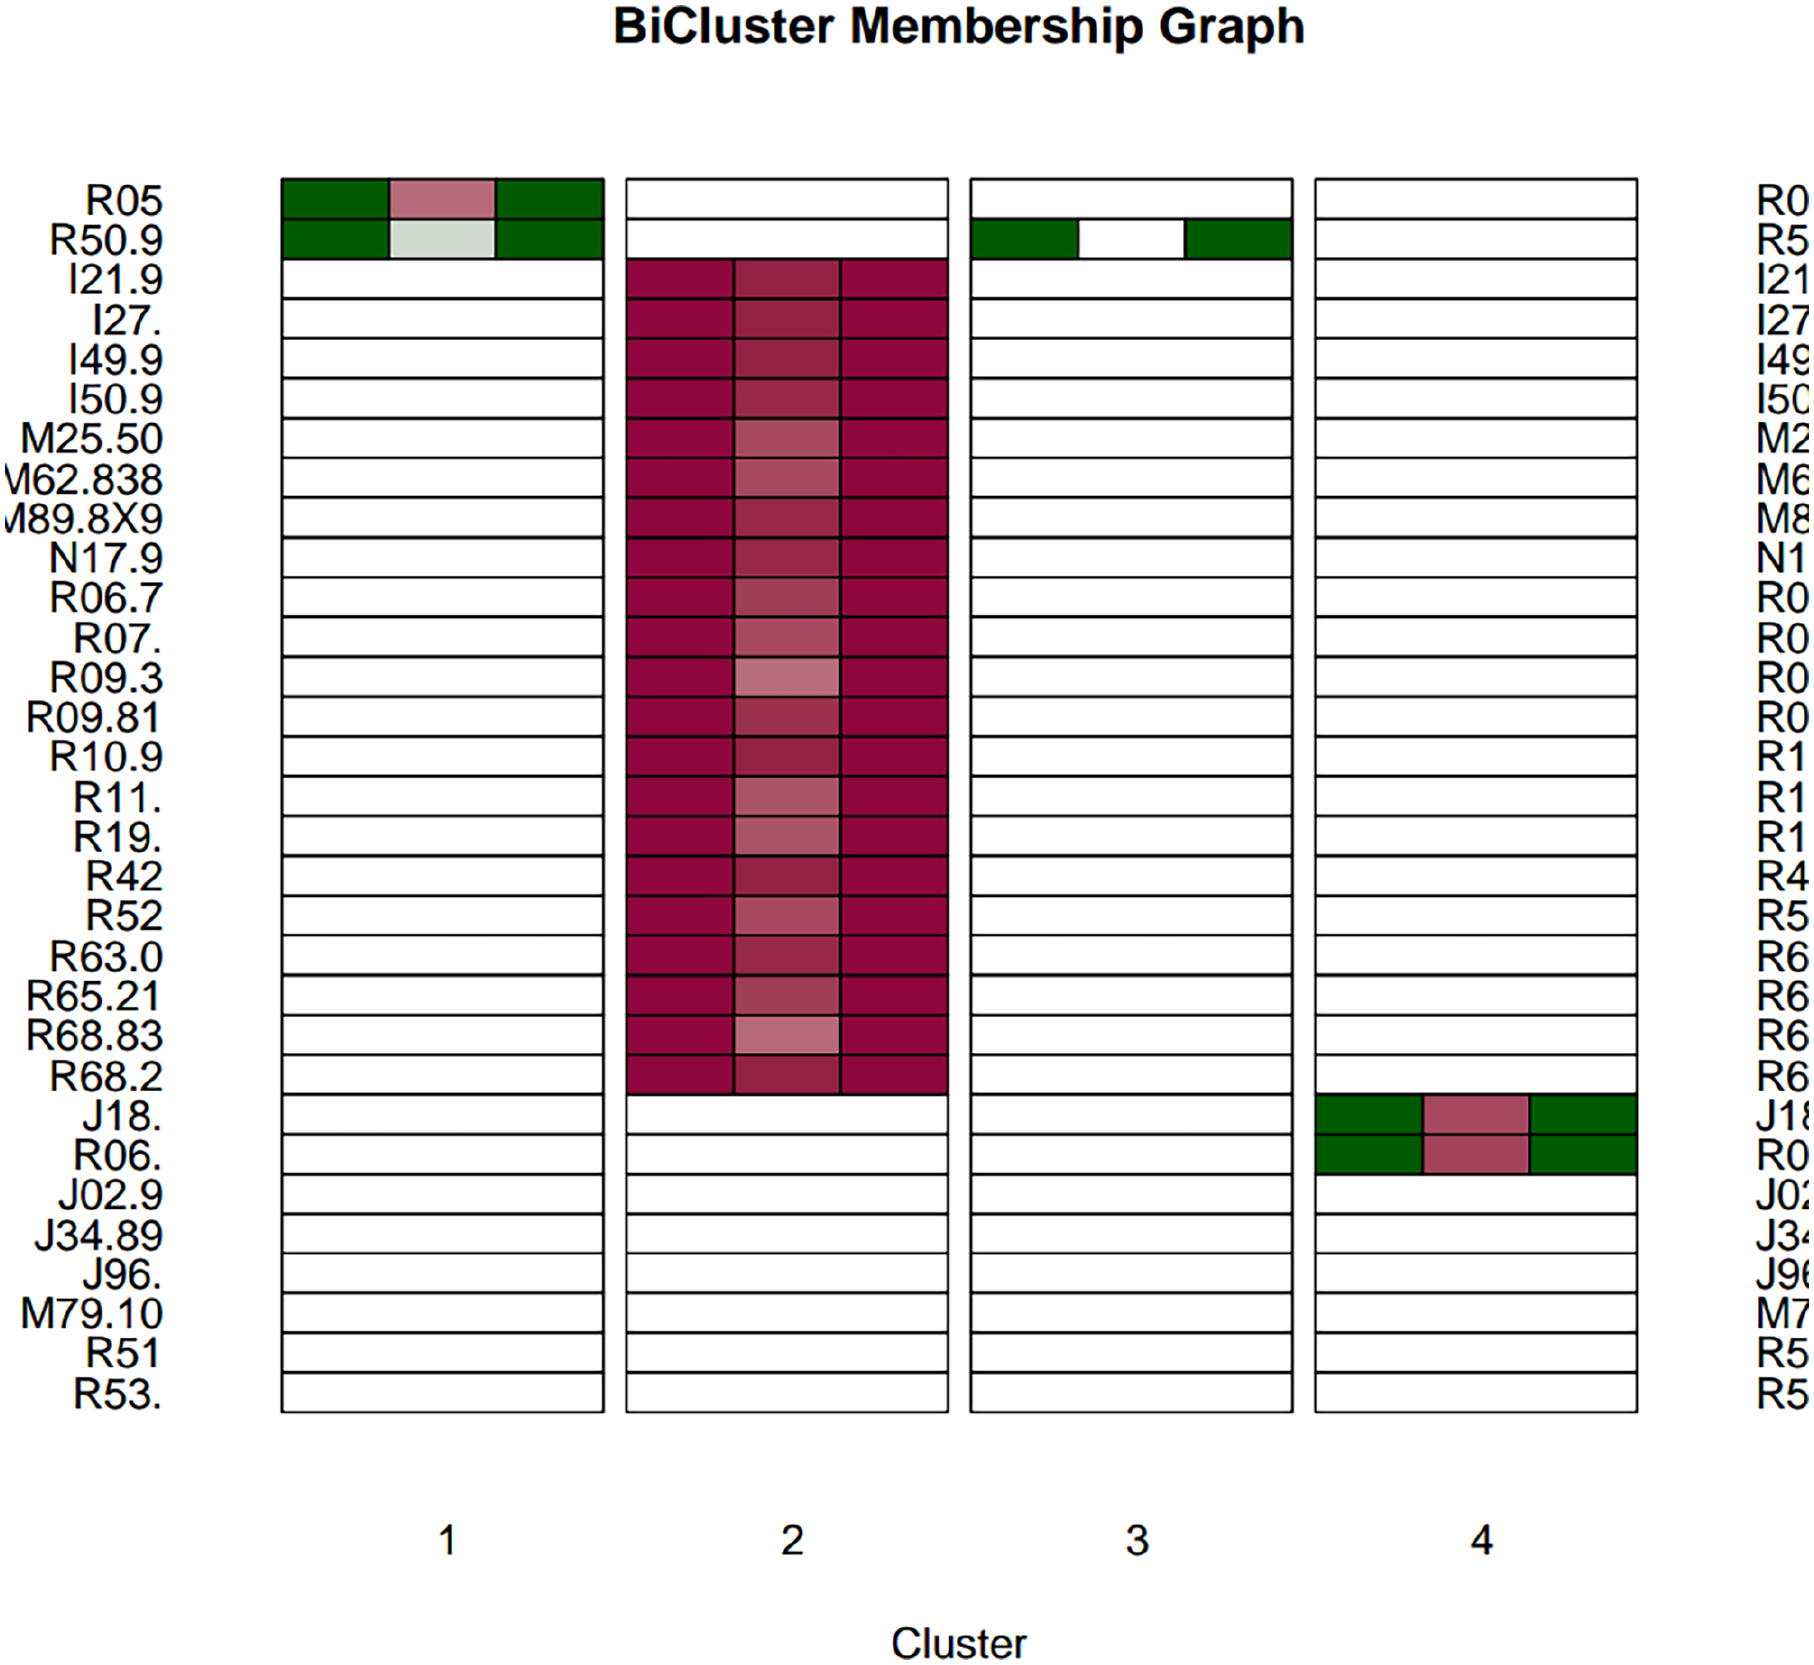
Bicluster membership graph. (A color version of this figure is available in the online journal.)
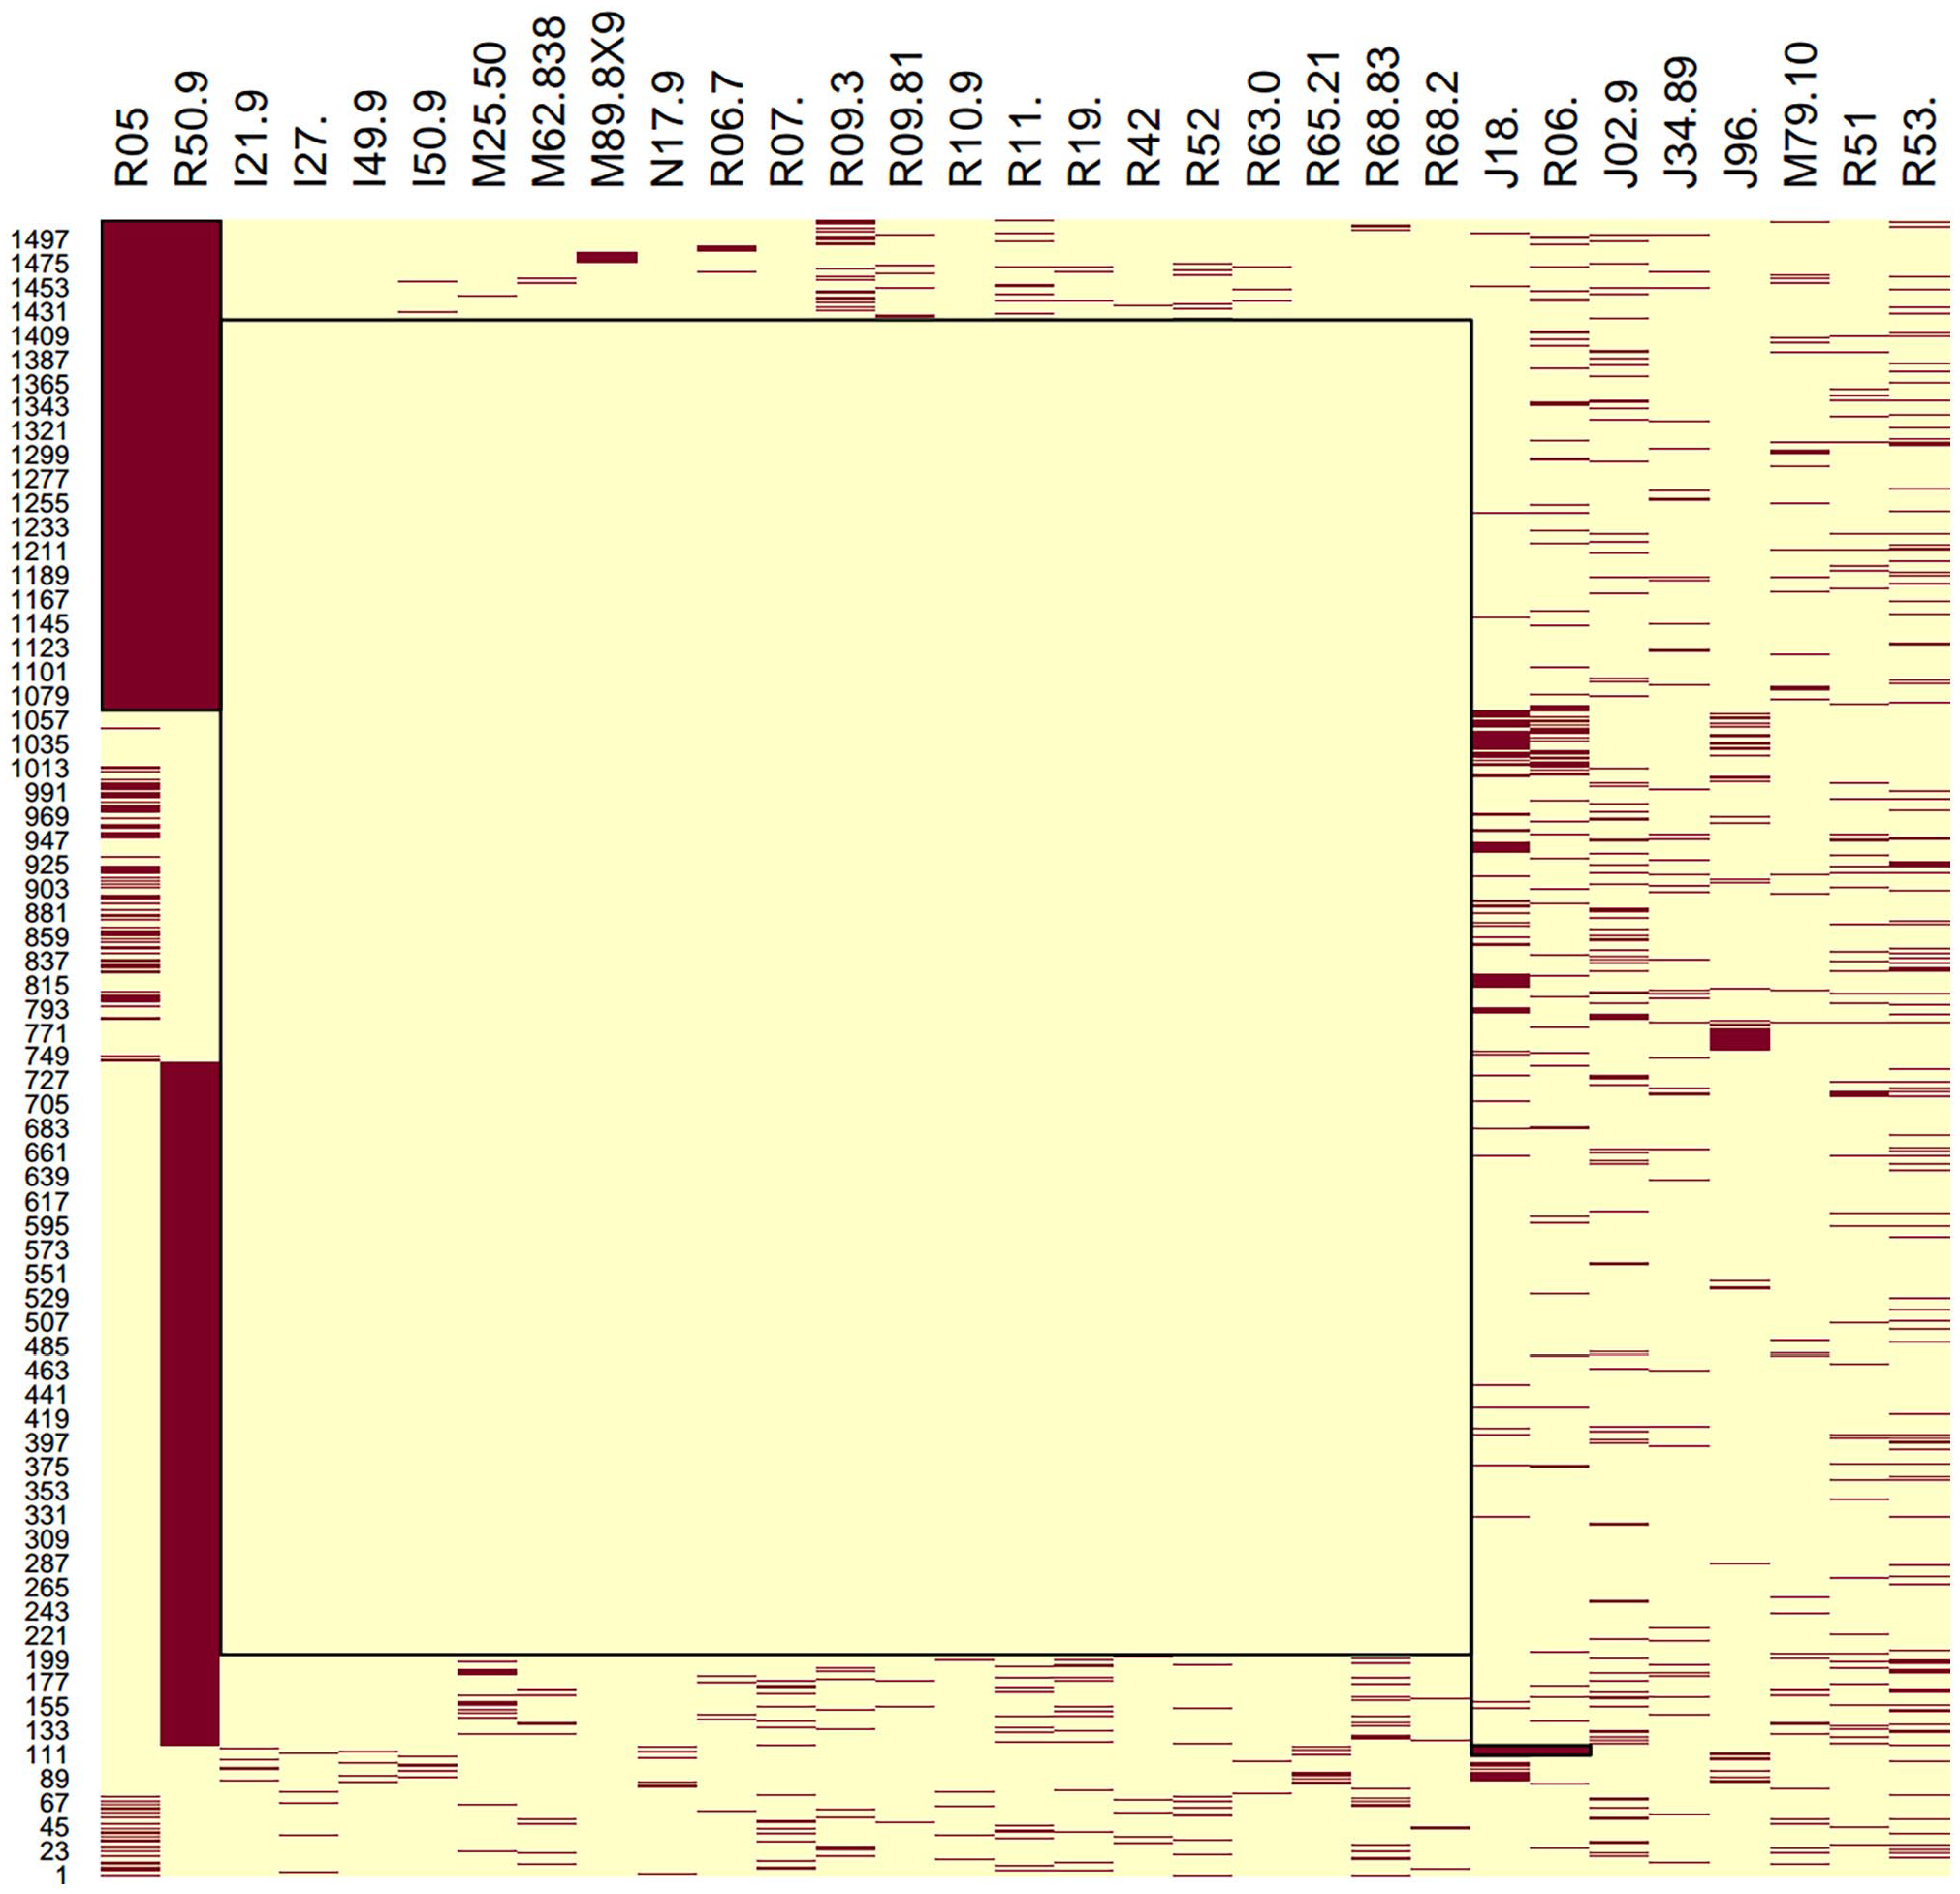
Bicluster heatmap graph. (A color version of this figure is available in the online journal.)
Results
In this section, we report the main result and discuss its significance.
We obtained topological properties of dimension 1; there was no topological property of higher dimensions. Figure 6 shows the barcode of the one-dimensional topological properties whose lifetimes are within the interval (0, 0.5). The horizontal axis corresponds to the parameter of the filtration – Jaccard distance – and the vertical axis corresponds to the number of properties.
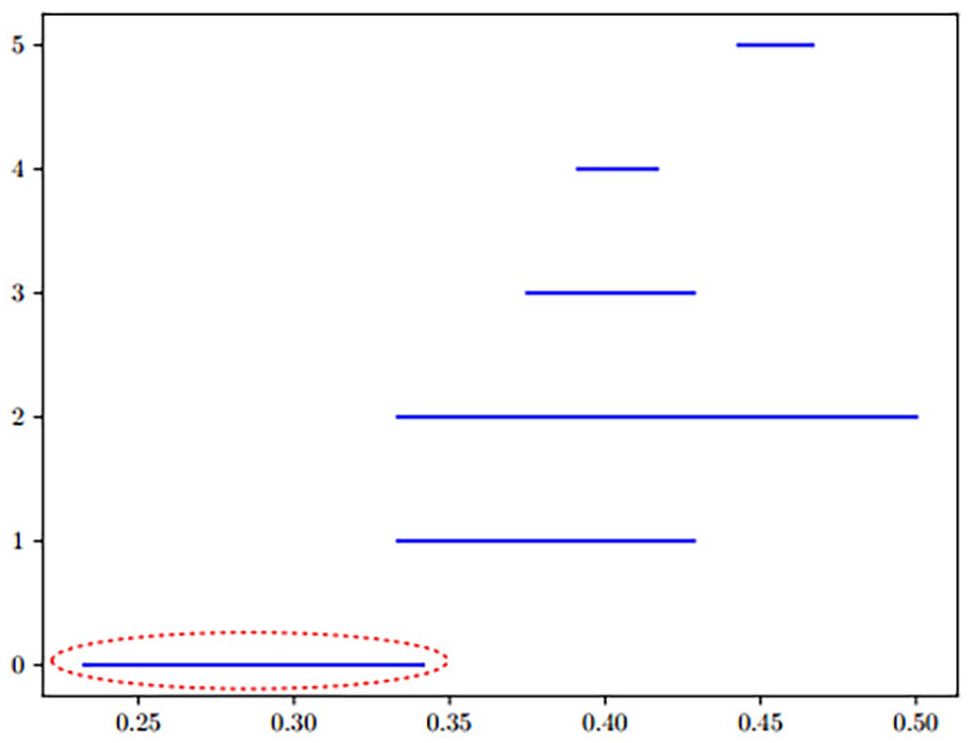
Barcode of one-dimensional topological properties. (A color version of this figure is available in the online journal.)
First, we retrieved a representative cycle for each bar in Figure 7. Next, we selected the cycles based on two factors: (1) Cycles that are dominated by sparse clusters are weak for inferring clinical hypothesis, hence it is important to note the number of subjects. (2) With respect to the size of the clusters, cycles with low Jaccard distances have higher preference. At any two data points, the lower the distance, the more similar are their sets of patients. Therefore, low Jaccard distances lead to better estimations of redescriptions. Considering these two factors, of the retrieved cycles, only one stood out; it corresponds to the first bar annotated by the circled line – spans between 0.23 and 0.34. The other bars not only belong to the higher Jaccard distances, but also correspond to small clusters. Hence, what follows is an account of the one-dimensional topological property, which is striking.
Representative cycle of the annotated bar.
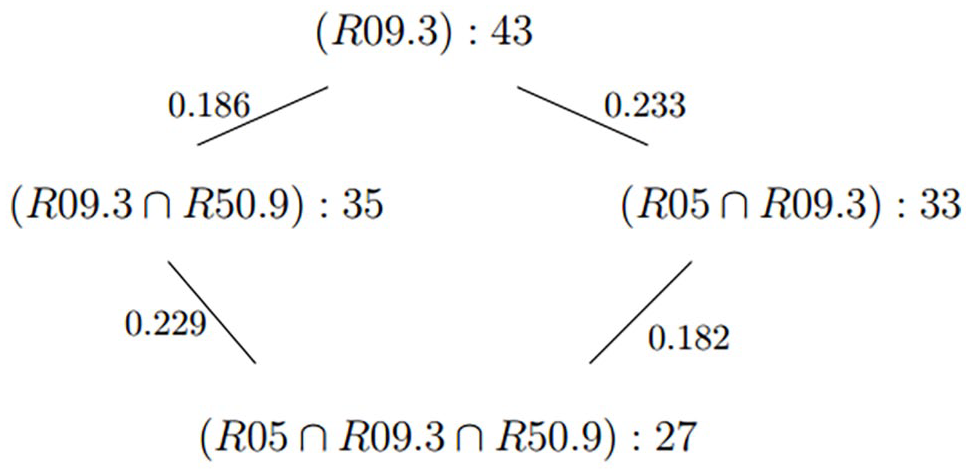
This cycle suggests that among the subjects in R09.3 – abnormal sputum – there is not a particular interaction between subjects in R05 – Cough – with subjects in R50.9 – fever. This opens the question of whether there is a distinctive signature showing alternative pathways to disease among dry coughers compared to productive coughers.
Discussion
To interpret the relationships between the symptoms in Figure 7, we rely on Jaccard distance. Since the equivalence of sets of subjects matching different patterns produces logical constraints determined by biological processes, multiple pathways connecting phenotypes to disease may yield information about multigenic complex diseases marked by multiple pathways leading to disease. However, phenotype definitions are prone to misclassification for several reasons. Therefore, equivalence may be meaningfully characterized based on the chances that a subject in one or the other of two phenotype clusters is not in both, which is the Jaccard distance, described above.
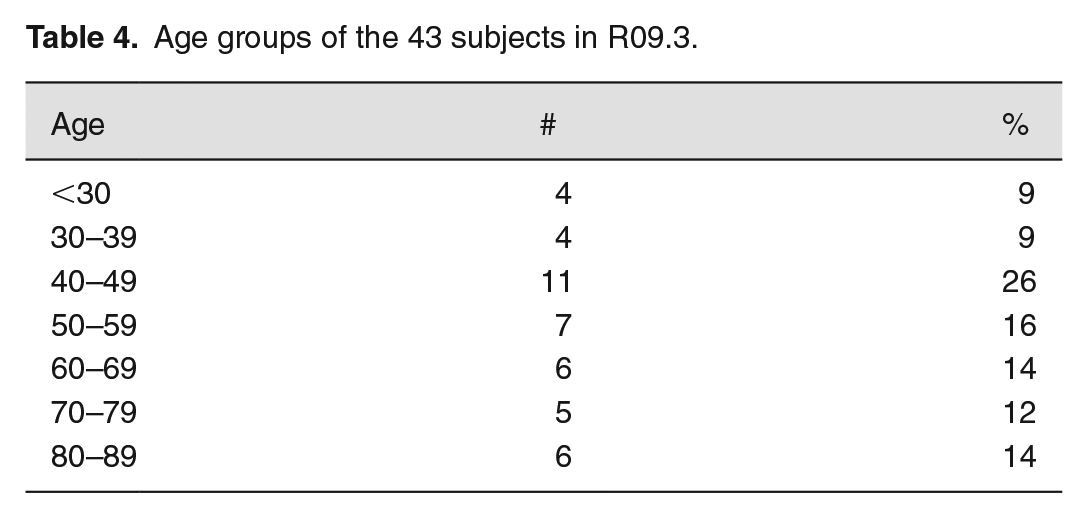
In the case of Figure 7, which corresponds to a subset of patients of size 43 (Table 4), there are two paths leading from R09.3 (abnormal sputum) to
Age groups of the 43 subjects in R09.3.
The patient records were generally gleaned from hospital records, suggesting some level of severity among those we had any records for. Those items whose ICD-10-CM records we retained related to severity would include sepsis, pneumonia, kidney failure, and so on. Some cardiac features may refer to pre-existing comorbidities or were perhaps acutely induced in COVID-19; the records are not clear on the point. So, it may not be clear if associations with these features indicate susceptibility due to comorbidities, or whether they are caused by COVID-19 among more severe patients. In any case, any significant associations may be identified, even if the chronic/acute status has not been recorded.
One of the major limitations of the approach involves missing clinical outcomes and non-standardized physician records. Since there was no systematic design for study enrollment or questionnaire construction, correlations between recorded symptoms and outcomes could be induced by individual physician preferences at the facilities from which the records were gleaned. For example, it would not be clear whether cough productivity (sputum) would be due to a distinct set of severe cases, or whether a specific physician dealing with severe patients noted productivity. This would yield an apparently distinct group of severe patients with larger Jaccard distances from other groups.
COVID-19 refers to the disease that emerged from infection of severe acute respiratory syndrome coronavirus 2 (SARS-COV-2) virus. As such, disease presentation includes cytokine storms, vascular leaking, and other features that may be associated with physiological response to the virus. While cytokine storms are shared among some respiratory infections, COVID-19 shows some very distinctive features in response among severe patients. The nature of that response among patients with certain comorbidities is also a hallmark of COVID-19. Patients that are selected as relevant to specific clusters (redescriptions) are good candidates for identifying differences in gene expression levels or other genetics or proteomics that may mark these as distinctive pathways, offering a window to the process – if such associated data were available. As it stands, scope has been limited by what data have been available. We have no sequence (subject or virus), -omics, or other data associated with these records; so given available scope, we have not articulated this what-if.
Distinctive feature of COVID-19 is the rarity of productive coughs. Given that these symptom cycles reflect correlations among several features including phlegm, we sought to understand or identify bias in how this symptom was recorded. The first feature was that the choice of word was idiosyncratic. Some reports preferred “phlegm” others “sputum” or “expectoration” leading to the question of whether the words were specific to individual physicians more prone to reporting an observation of a productive cough. However, the records included in the database were scraped and translated from records in the languages of the source regions. The selection of terminology was an artifact of the translation software in the pre-processing step, and not necessarily reflective of individual physicians. Furthermore, in any one country, the reports spanned multiple provinces, indicating that the reports did not issue from any specific clinic, in general.
Another level of test was to check whether there were some regions more likely to pay attention to productivity in coughs due to variations in traditional medical practices and education. We applied the standard chi-square test,
Footnotes
Authors’ Contributions
All authors contributed to the design of the proposed pipeline and approved the article. NK preprocessed the data and conducted the experiment. DEP contributed to the statistical analyses and the discussion. NK and DEP contributed to the writing of the article.
Declaration of Conflicting Interests
The author(s) declared no potential conflicts of interest with respect to the research, authorship, and/or publication of this article.
Funding
The author(s) disclosed receipt of the following financial support for the research, authorship, and/or publication of this article: Research by S. Basu and N. Karisani was partially supported by NSF grant DMS-1620271.