
Abstract
Worldwide, cirrhosis is a common cause of death, manifesting itself as fibrosis of the liver tissue. When the liver is damaged, the liver produces fibrotic, proliferative myofibroblasts, which are formed by the differentiation of activated hepatic stellate cells. There are no effective antifibrotic treatment options. To deeply explore the activation process of hepatic stellate cells (HSCs) and to discover better therapeutic target genes, single-cell RNA sequencing data on 13 non-cirrhotic liver tissue samples and 10 cirrhotic liver tissue samples were analyzed. We identified activated HSCs from the mesenchymal cell population with high expression of ACTA2. By pseudo-time analysis, we found that the key genes for the differentiation of HSCs into myofibroblasts were C3, CCDC80, COL1A1, COL3A1, DCN, FBLN1, IGFBP3, MXRA5, SERPINE1, and MYH11. Then, we found that the main regulators of HSCs from inactive to activated state were NTF3, NTRK3, NTRK2, JAG1, NOTCH3, ESAM, and CD46 by cell–cell communication analysis. In addition, we found that the top2 hub genes of activated HSCs were CRIP1 and ACTA2. The experimental results show that the top2 hub genes were significantly overexpressed in cirrhotic samples. Our work dissected key intercellular regulators and core driver genes during hepatic stellate cell activation during cirrhosis through single-cell transcriptome data analysis, providing a research strategy to discover rational therapeutic targets for cirrhosis and some important information for gene targeting therapy.
Impact Statement
When the liver is damaged, HSCs are activated and transdifferentiated into proliferative, fibrotic myofibroblasts. There are no effective antifibrotic treatment options available. We have explored the activation process of HSCs and their core driver genes from the single-cell level with the latest analytical tools. We found that receptor-ligand genes such as NTF3, NTRK3, JAG1, NOTCH3, CD46, NTF3, and NTRK2 play an important regulatory role in the activation process of HSCs. The top2 hub genes of activated HSCs are CRIP1 and ACTA2. In addition, it was shown that C3, CCDC80, COL1A1, COL3A1, DCN, FBLN1, IGFBP3, MXRA5, SERPINE1, and MYH11 genes are key genes for the transformation of activated HSCs into myofibroblasts. This study increased the understanding of the activation process of HSCs and uncovered key regulators of the transformation of activated HSCs into myofibroblasts, providing important information for precision and targeted therapies.
Introduction
Recent studies have shown that cirrhosis, which kills about 1 million people each year worldwide, is characterized by extensive fibrosis and a lack of effective treatments1,2. An early manifestation of cirrhosis development is liver fibrosis, which is primarily caused by a chronic liver injury that produces inflammatory processes and complex fibrosis. 3
Liver fibrosis arises from interactions between mesenchymal cells, endothelial cells, and immune cells that reside in areas of scarring called fibrotic niches. 2 During development, stellate cells originate in the septal mesenchyme. Mesothelial and submesenchymal cells migrate inward from the embryonic liver surface, eventually differentiating into HSCs and other perivascular mesenchymal cells.4,5 During liver injury, HSCs are activated from a quiescent state in chronic liver injury and differentiate into proliferating, motile myofibroblasts that secrete extracellular matrix. 6 Chronic liver injury can continue to activate HSCs, resulting in the continued release of extracellular matrix proteins from HSCs, disrupting liver tissue structure and damaging the metabolic function of the liver.7,8
The application of single-cell transcriptomic approaches to characterize HSCs continues to expand, providing a detailed insight into their heterogeneity. 9 Single-cell RNA sequencing has thus identified subpopulations of HSCs distributed in healthy livers, including portal and central vein-associated HSCs. 9 During liver injury, HSCs are activated into proliferating, fibrotic MFBs that have a range of fibrotic features that together lead to liver injury and fibrosis. Activated HSCs require high amounts of energy to support their proliferation, secretion of extracellular matrix (ECM), cytokines and proteases, and migration to areas of cellular damage. In order to obtain sufficient energy, activated HSCs utilize many metabolic pathways which are similar to those of cancer cells. 10 It is worth noting that the more severe the degree of liver fibrosis, the worse the prognosis of patients. 1 Therefore, effective antifibrotic therapy for patients with chronic liver disease is urgent.
The existing treatment strategy for liver fibrosis focuses on eliminating the associated factors of injury, inhibiting the activation of HSCs, resisting the inflammatory response, and promoting ECM degradation.11,12 However, for patients with liver fibrosis and early cirrhosis, there is no systematic treatment plan clinically, and only conventional drugs can be used. These conventional treatments can have toxic effects on the body’s tissues and organs, and there are few options for delivering effective concentrations of therapeutic drugs to the liver. 13 It has been suggested that targeted drugs may have better efficacy in the treatment of liver fibrosis.
Single-cell transcriptome sequencing technology (scRNA-seq) has brought transcriptional analysis to the cellular level, allowing us to probe the pathogenesis of disease with greater depth and precision. 2 It has already been reported that mesenchymal stromal cells restrict the transformation of CD14 + monocytes to HLA-DRhi macrophages and that mesenchymal stromal cells can inhibit macrophage transdifferentiation into CD9 + cirrhosis macrophages by secreting IL-6. 1 Here, we used scRNA-seq to study the activation process and core driver genes regulating human HSCs, providing some important information for gene targeting therapy.
Materials and methods
Selection of data sets
To study the activation process of human HSCs and their core driver genes, we selected the gene expression matrix of 13 non-cirrhotic liver tissue samples and 10 cirrhotic liver tissue samples from the GSE168933 dataset. The human liver tissues were dissected in line with the extraction specification of 10× Genomics Single-cell 3’ gene expression V2, and the Illumina NextSeq500 sequencing platform was selected for sequencing. 1
Data integration
We used Seurat (R package V 4.1.1) to integrate single-cell gene expression matrices from 23 liver tissue samples. 14 In this integration process, in order to remove the influence of low-quality cells on cell clustering, we filtered cells, selecting those with a nFeature_RNA value in each cell not less than 200 and a proportion of mitochondrial gene expression in each cell less than 50%.15,16 We found that the GSE168933 cell expression matrix containing 38079 cells had been filtered with the umi filter, doublet removal, and mitochondrial gene removal (< 20%). Given that harmony (v1.0) is recognized as an effective tool for removing batch effects, we used it to remove batch effects between samples in order to obtain more accurate cell clustering.17,18
Cell clustering and annotation
First, the SCTransform function in Seurat (v4.1.1) was called to normalize the data. 19 Second, the normalized cell expression matrix was analyzed by the RunPCA function in Seurat for dimensionality reduction. 20 Third, removing the batch effect between samples was performed by the RunHarmony function in harmony (v1.0). Fourth, cell clustering was analyzed by the FindNeighbors function and FindClusters function for the top 30 harmony components. In this process, k.para was set to 20, and the knn algorithm was used to classify the cells. Finally, the cell clusters were annotated by using the already recognized classical cell markers.1,2,21
Differential gene expression and enrichment
After cell clustering and annotation of all samples, mesenchymal cells were extracted from the samples for re-clustering and subpopulation annotation. The FindMarkers function in Seurat was called to obtain the differential genes for each cell population with default parameters. To ensure the accuracy of subpopulation annotation, we used clusterProfiler (R package v 4.4.4) to perform gene ontology (GO) enrichment analysis of upward and downward-regulated genes for each mesenchymal cell subpopulation separately, and the top 10 items with adjusted P values not higher than 0.05 were shown. 22
Pseudo-time analysis
Pseudo-time study was analyzed to simulate the differentiation trajectory of cells based on the gene expression of cells in different cell subpopulations. We called monocle3 (R package v1.0) to achieve pseudo-time analysis to infer the differentiation trajectories of each subpopulation of mesenchymal cells. 23 Then, we identified the root cells by setting the label_principal_points parameter in the plot_cells function in order to predict the differentiation time of all cells.
Cell–cell communication
CellPhoneDB was equipped with a detailed receptor database, which integrates the previous public database and also performs manual correction to obtain a more accurate receptor annotation. In addition, annotations were also provided for cases where the receptor has multiple subunits. 24 Here, we used cellphonedb (python version v2.1.7) for cell–cell communication of mesenchymal cell subpopulations to uncover cytokines that have significant interactions between cell subpopulations. Then, the number of interactions between cell populations was plotted using the CellChat R package (v1.5.0). 25
scWGCAN analysis of mesenchymal cell subpopulations
WGCNA was originally constructed to investigate bulk RNA-seq datasets, and its ability to analyze scRNA-seq datasets was constrained due to the sparsity of the scRNA-seq data. The high dimensional weighted gene co-expression network analysis (hdWGCNA) overcame this limitation. 26 We derived cellular scRNA-seq data from Seurat object in subpopulations of mesenchymal cells with 3000 highly variable genes and constructed pseudo-cells with the construct_metacells function in hdWGCNA (v0.1.1.9010) with a k value of 50. After pseudo-cell construction, the conventional WGCNA analysis was started.
Mining the activated hepatic stellate cell hub gene
The exportNetworkToCytoscape function was called in WGCNA (R package v1.71) to export a network edge and node list file that could be imported into Cytoscape (v3.8.2). According to the network interworking analysis, the Maximal Clique Centrality topology algorithm (MCC) in the CytoHubba plugin was called to mine the hub genes. 27
Study objects
For this study, three liver cirrhosis specimens were included in an experimental group, and three healthy liver specimens were included in a control group. Specimens were gathered during the period from the beginning of October 2022 to the end of November 2022. Liver specimen conditions included: Liver specimens (1) must be fresh, and (2) must offer rapid pathological examination results for both the experimental group and the control group; (3) Liver specimens in the experimental group should exhibit no significant liver-related disease other than cirrhosis; (4) Healthy liver specimens should exhibit not higher than 5% of the area of steatosis; (5) Healthy liver specimens should not exhibit fibroplasia in the portal area. The clinical data were complete and passed an ethical review.
Real-time quantitative reverse transcription PCR
The top2 hub genes were selected for reverse transcription-quantitative PCR (RT-qPCR) validation. We used TRIzol reagent (Servicebio, Wuhan, China) to extract total RNA from liver tissue. The RNA concentration was measured by Nanodrop and then reverse transcribed with a cDNA Reverse Transcription Kit (Takara, Japan). Gene expression level was determined by SYBRGreen (Takara, Japan) on the ABI 7500 fast real-time PCR system. The amplification reaction was as follows: 95°C-10 min, followed by 95°C-15 s and 60°C-1 min with 40 cycles. GAPDH served as the reference gene, and three replicates were set up for each group. We used the 2−ΔΔCT method to measure the relative expression levels of genes. All primer sequences are displayed in Table 1 and were designed by Sangon Biotech (Shanghai, China). The melting curves can be seen in Supplementary Figures 1 and 2.
The Primer Sequences Used in the RT-qPCR.
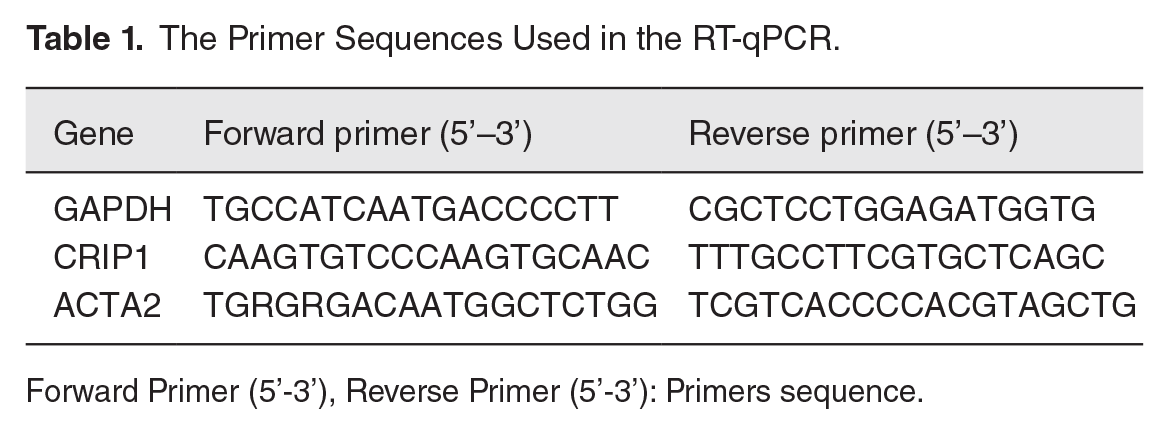
Forward Primer (5’-3’), Reverse Primer (5’-3’): Primers sequence.
Statistical analysis
R (v4.1.3) was applied to process data. The softwares used for the different analyses are described in detail. For correlation analysis, we used Spearman’s or Pearson’s test (*P-value was less than 0.05, **P-value was less than 0.01, ***P-value was less than 0.001).
Results
Cell clustering and annotation
After cell filtration, the final 37,992 cells were used for downstream analysis. The results showed that cells from different samples were not evenly distributed in the cell population when batch effect removal was not performed (Figure 1(A)). After batch effect removal, the cells from each sample were evenly distributed in the cell population (Figure 1(B)). Finally, cells were eventually distributed into 28 cell populations through cell clustering (Figure 1(C)).
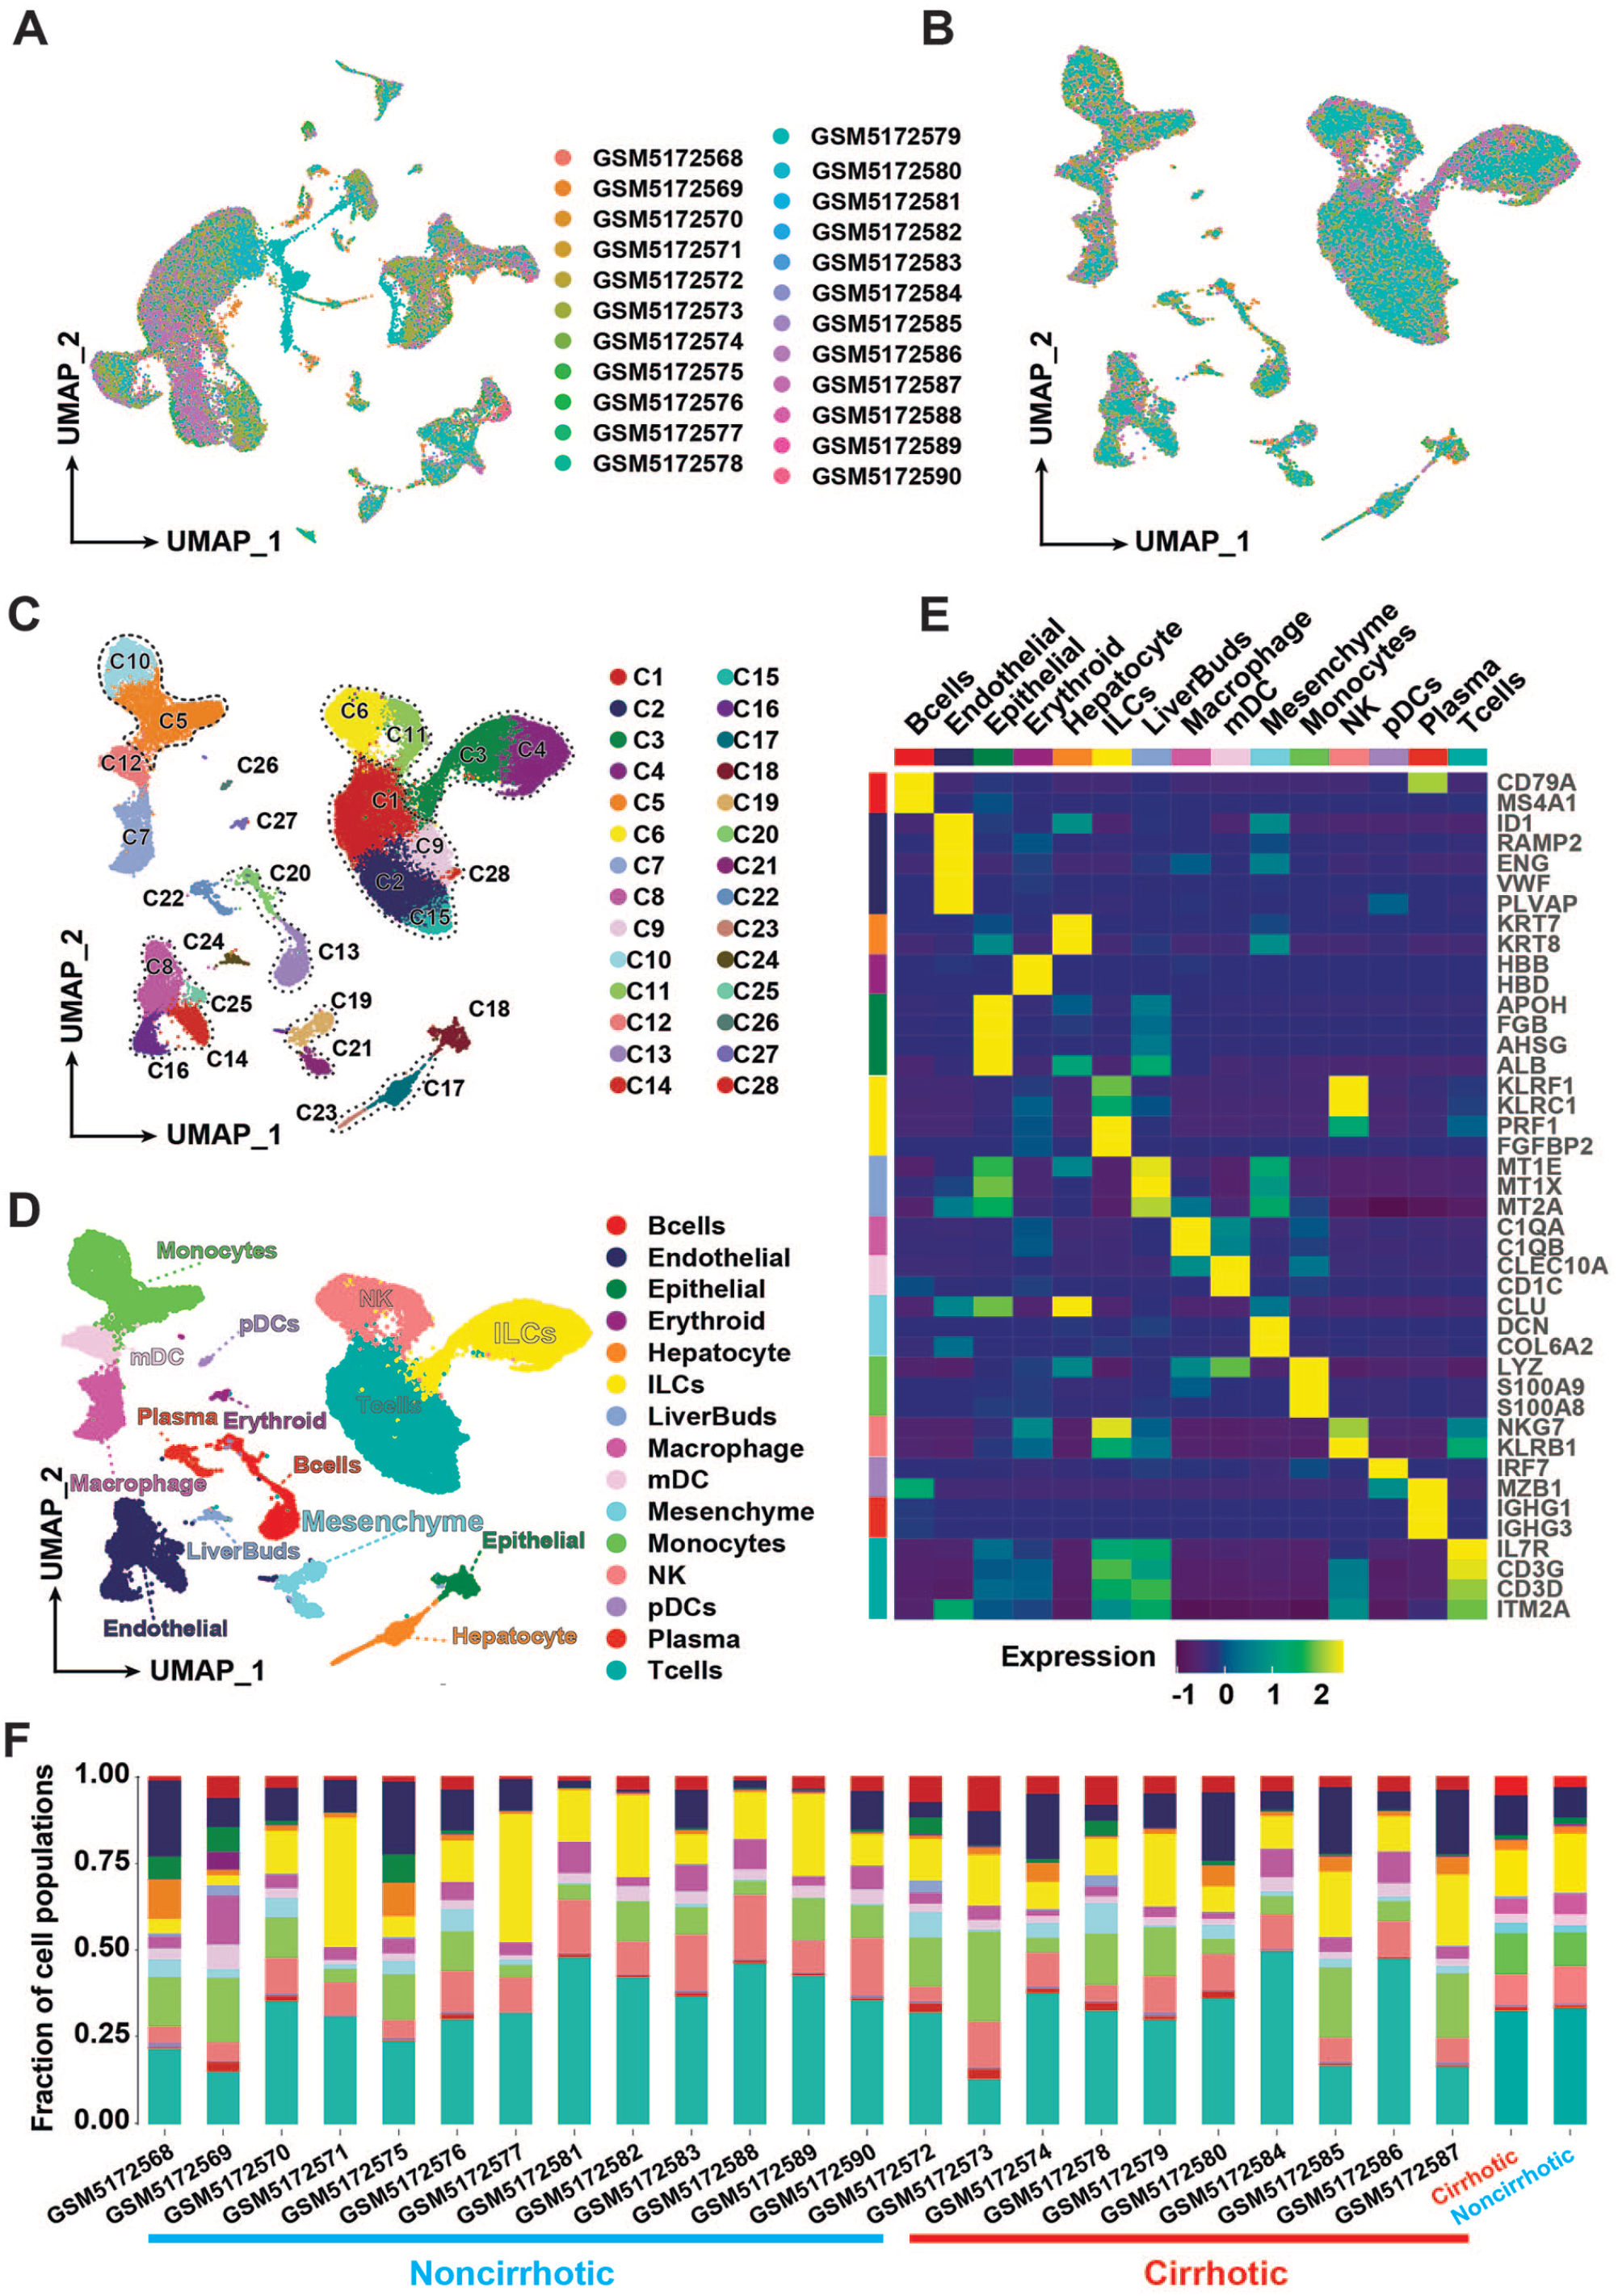
Clustering of 37,992 cells from non-cirrhotic (n = 13) and cirrhotic (n = 10) human liver tissue samples. (A) Cell distribution profiles of 23 samples. (B) Cell distribution profiles after removing batch effects by harmony (R package). (C) Cell clusters, colors represent cell clusters. (D) Cell annotation, colors represent cell types. (E) The expression level of cell marker is presented in the heatmap. Colors at the top and left of the diagram represent cell types. Colors in the legend represent the expression level of the marker. (F) The percentage of cells in the cell type for each sample, and the percentage of cells in the cell type for the two groups after integration. Colors in the bar chart represent the different cell types. Colors below the horizontal axis represent the different groups of samples. (A color version of this figure is available in the online journal.)
Using classical marker genes for cell annotation,1,2,21 we obtained a total of 15 cell types (Figure 1(D)). Two cell populations (C13 and C20) both expressed B cells marker genes, such as CD79A and MS4A1. Four populations (C8, C14, C16, and C25) expressed endothelial marker genes, such as ID1, RAMP2, and ENG. Two cell populations (C17 and C23) expressed Hepatocyte marker genes, such as ALB and KRT8. 2 populations (C3 and C4) expressed ILCs marker genes, such as KLRF1, KLRC1, PRF1, and FGFBP2. Two cell populations (C19 and C21) both expressed mesenchyme marker genes such as CLU, DCN, and COL6A2. 1 Two cell populations (C6 and C11) both expressed NK cell marker genes such as NKG7, KLRB1, and KLRF1. Two cell populations (C5 and C10) both expressed Monocyte marker genes such as LYZ, S100A9, and S100A8. Five cell populations (C1, C2, C9, C15, and C28) expressed IL7R, CD3G, CD3D, and ITM2A. C7 expressed macrophage marker genes, such as C1QA, C1QB, and WFDC2. C12 expressed myeloid dendritic cell (mDC) marker genes, such as CLEC10A and CD1C. C18 expressed epithelial cell marker genes, such as VWF, PLVAP, RAMP2, KRT7, and KRT8. C22 expressed Plasma marker genes, such as IGHG1 and IGHG3. C24 expressed liver buds hepatic cell marker genes, such as MT1E, MT1X, and MT2A. 28 C25 expressed epithelial marker genes, such as LILRA4, LRRC26, PTCRA, and CLEC4C. C26 expressed plasmacytoid dendritic cell (pDC) marker genes IRF7 and MZB1. C27 expressed Erythroid marker genes such as HBB and HBD. Marker genes used in cell annotation were shown by heat map (Figure 1(E)). In addition, we counted the percentage distribution of cells in cell types for each sample. The results showed that the proportion of mesenchymal cells in the samples of the cirrhotic group was higher than that of the non-cirrhotic group (Figure 1(F)).
Mesenchymal cell subpopulation and expression characteristics
To investigate the activation process of HSCs during cirrhosis, we extracted mesenchymal cells and re-clustered the cells to obtain a total of 4 mesenchymal cell subpopulations (Figure 2(A)).
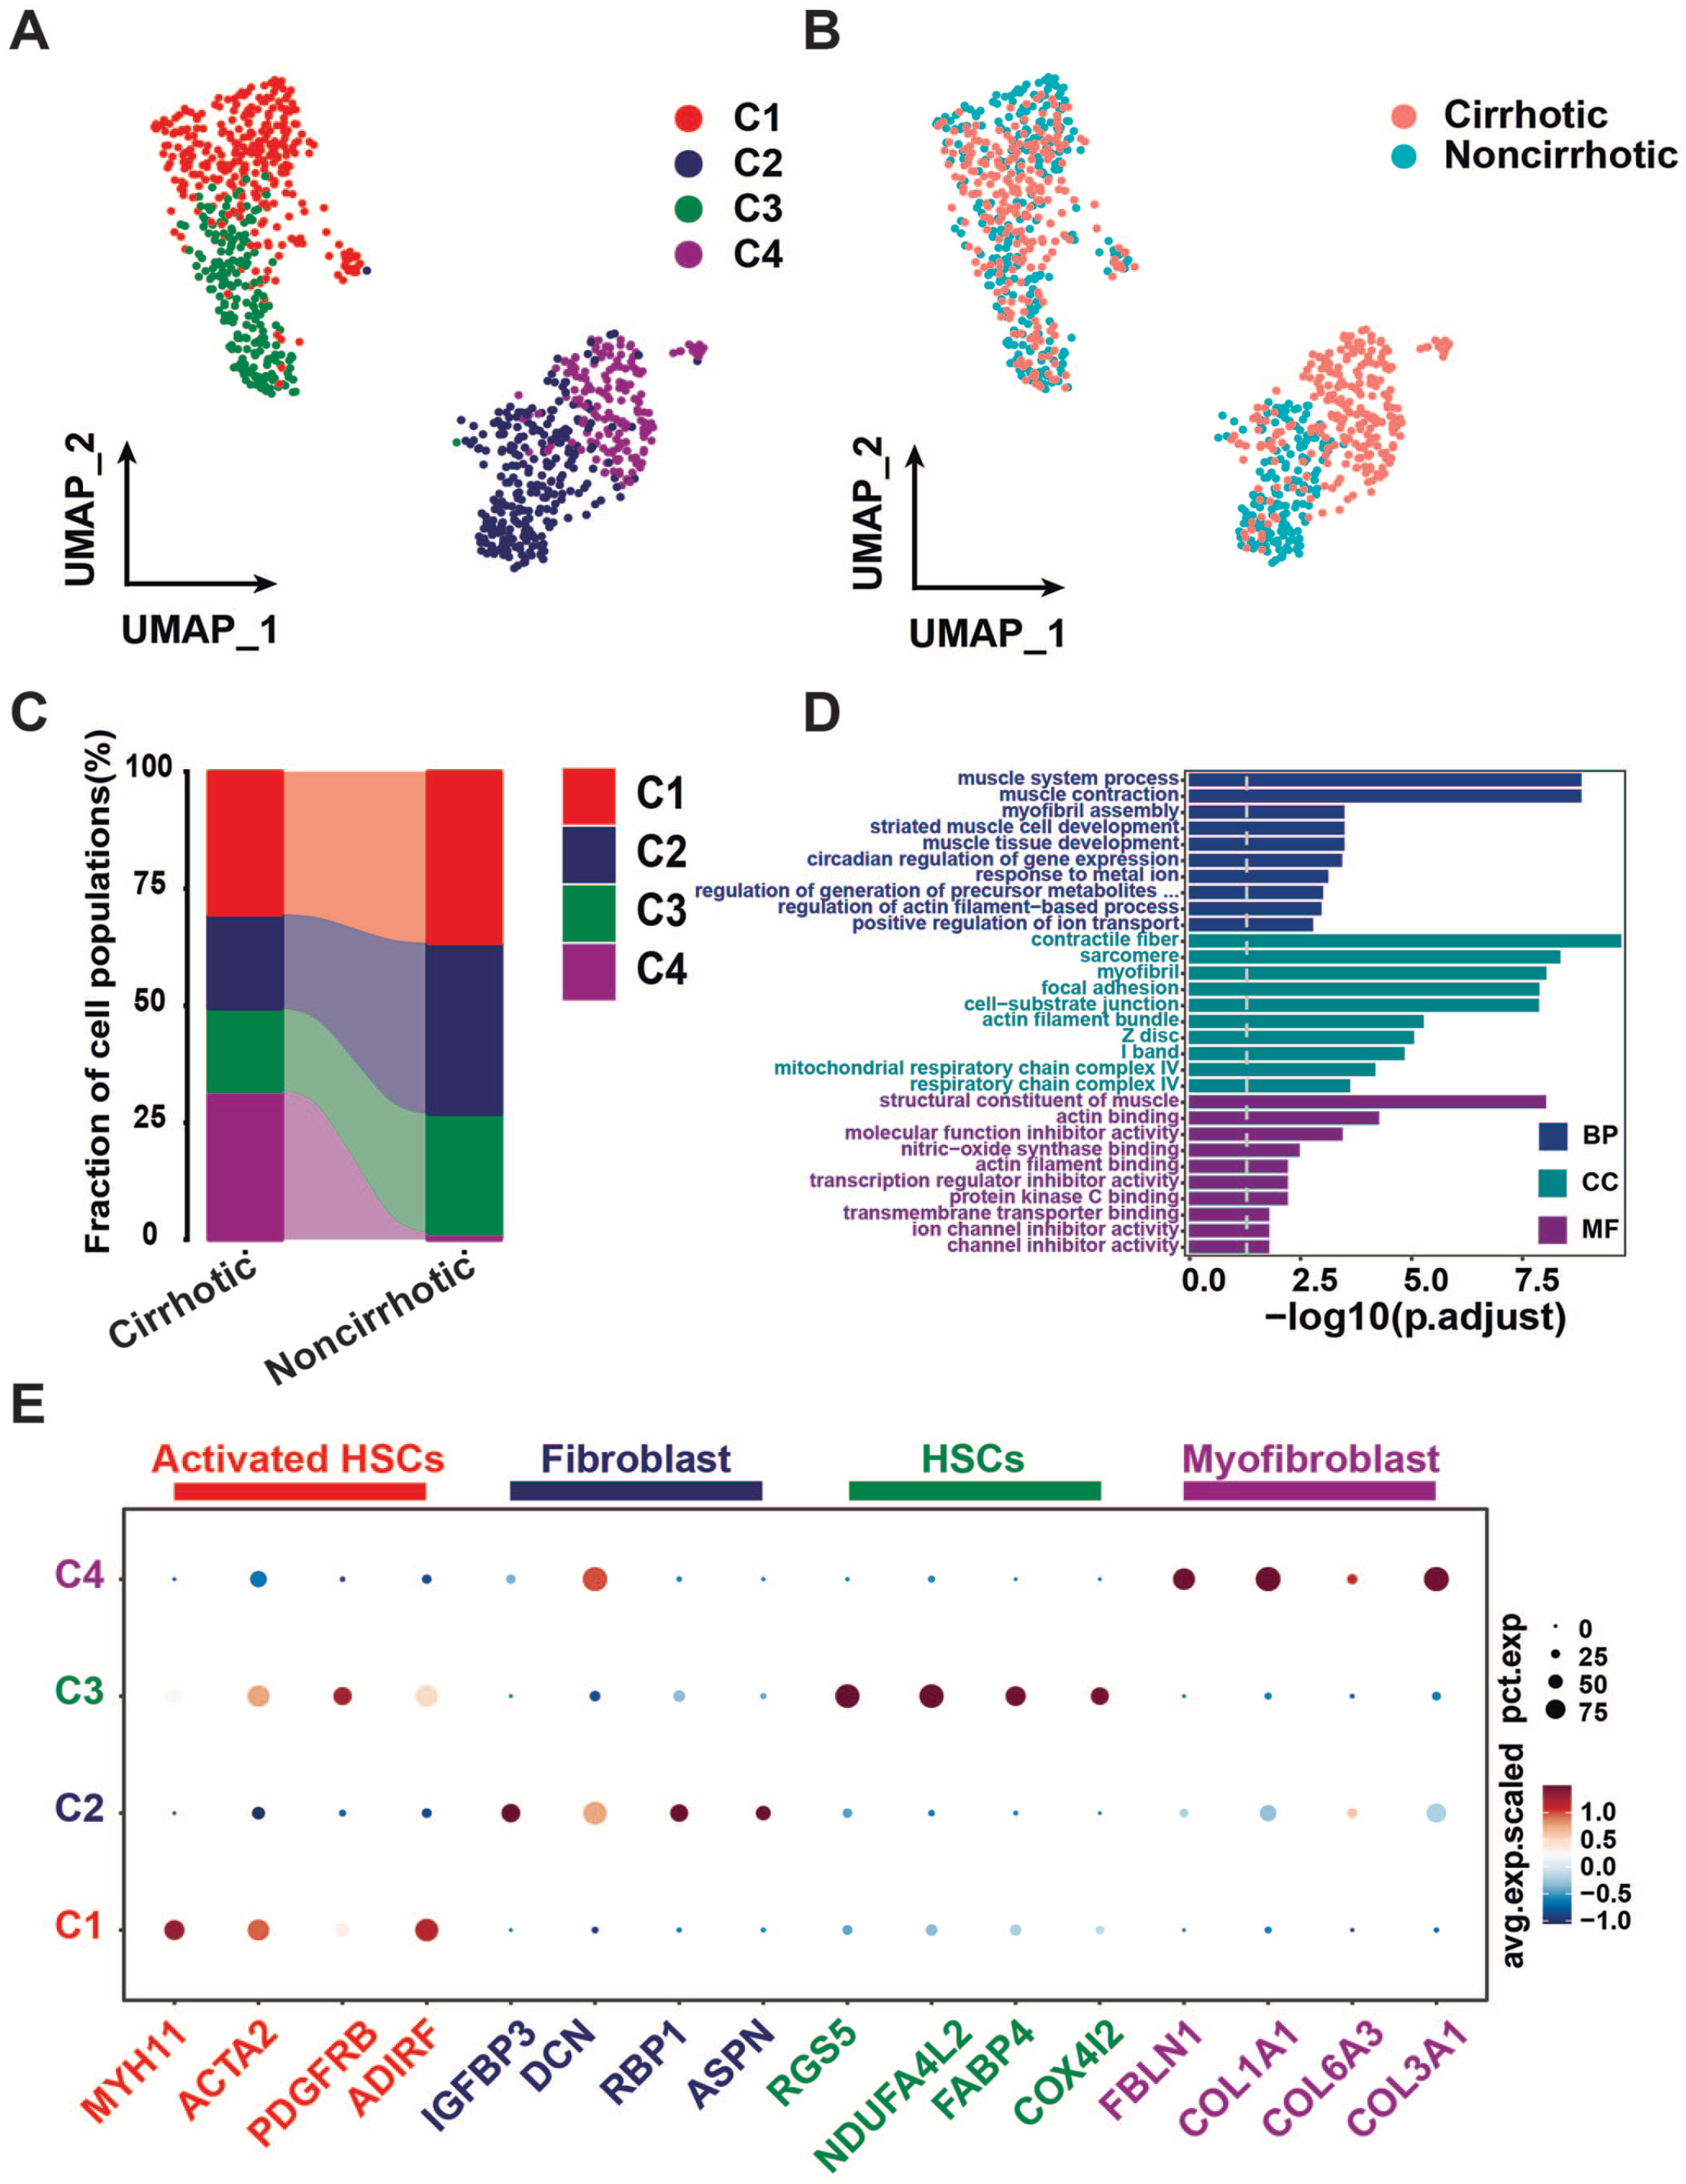
The subpopulations and expression profile of mesenchymal cells. (A) Mesenchymal cells are re-clustered into four cell populations. Each color represents a cell subpopulation. (B) UMAP plot, showing cell groups. (C) the proportion of cells in cell clusters for the two groups of mesenchymal cells. (D) GO enrichment of upregulated differential genes in activated HSCs. BP is short for biological process, CC is short for cellular component, MF is short for molecular function. (E) Expression of marker genes in different mesenchymal cell subpopulations as illustrated by dot plot. Colors above the graphs represent the different cell types. The size of the circles in the legend represents the proportion of cells expressing the gene in the corresponding cell population. Colors in the legend represent the expression of the gene. (A color version of this figure is available in the online journal.)
Combining classical markers of mesenchymal cells, 28 we annotated the mesenchymal cell subpopulations. We found that the activated HSCs marker genes, such as MYH11, ADIRF, ACTA2, and PDGFRB, were highly expressed in mesenchymal cell subpopulations 1 (C1). The fibroblast marker genes, such as IGFBP3, ASPN, RBP1, and DCN, were highly expressed in mesenchymal cell subpopulations 2 (C2). The HSCs marker genes, such as RGS5, COX4I2, FABP4, and NDUFA4L2, were highly expressed in mesenchymal cell subpopulations 3 (C3). The myofibroblast marker genes, such as FBLN1, COL3A1, COL6A3, and COL1A1, were highly expressed in mesenchymal cell subpopulations 4 (C4) (Figure 2(E)). Then, we counted the percentage of cells in mesenchymal cell subpopulations for the two groups. The results showed that myofibroblasts were almost exclusively present in cirrhotic samples (Figure 2(B)), and that a higher proportion of activated HSCs were present in cirrhotic samples compared to that in HSCs (Figure 2(C)).
In addition, based on the differential genes in each subpopulation, the genes upregulated in each of our cell populations were analyzed for GO enrichment. The results suggested that the significant term of BP in C1 was mainly muscle system process, muscle contraction, and myofibril assembly, consistent with the activated hepatic stellate cell properties (Figure 2(D)).
Differentiation trajectory of activated HSCs
In order to investigate the key genes involved in the transformation of activated HSCs into myofibroblasts, we performed a pseudo-time study of mesenchymal cell subpopulations (Figure 3(A)). The results indicated that activated HSCs have the potential to differentiate into myofibroblasts (Figure 3(B)). Furthermore, we also found that C3, CCDC80, COL1A1, COL3A1, DCN, FBLN1, IGFBP3, MXRA5, SERPINE1, and MYH11 play key roles in the transformation of HSCs into myofibroblasts (Figure 3(C))
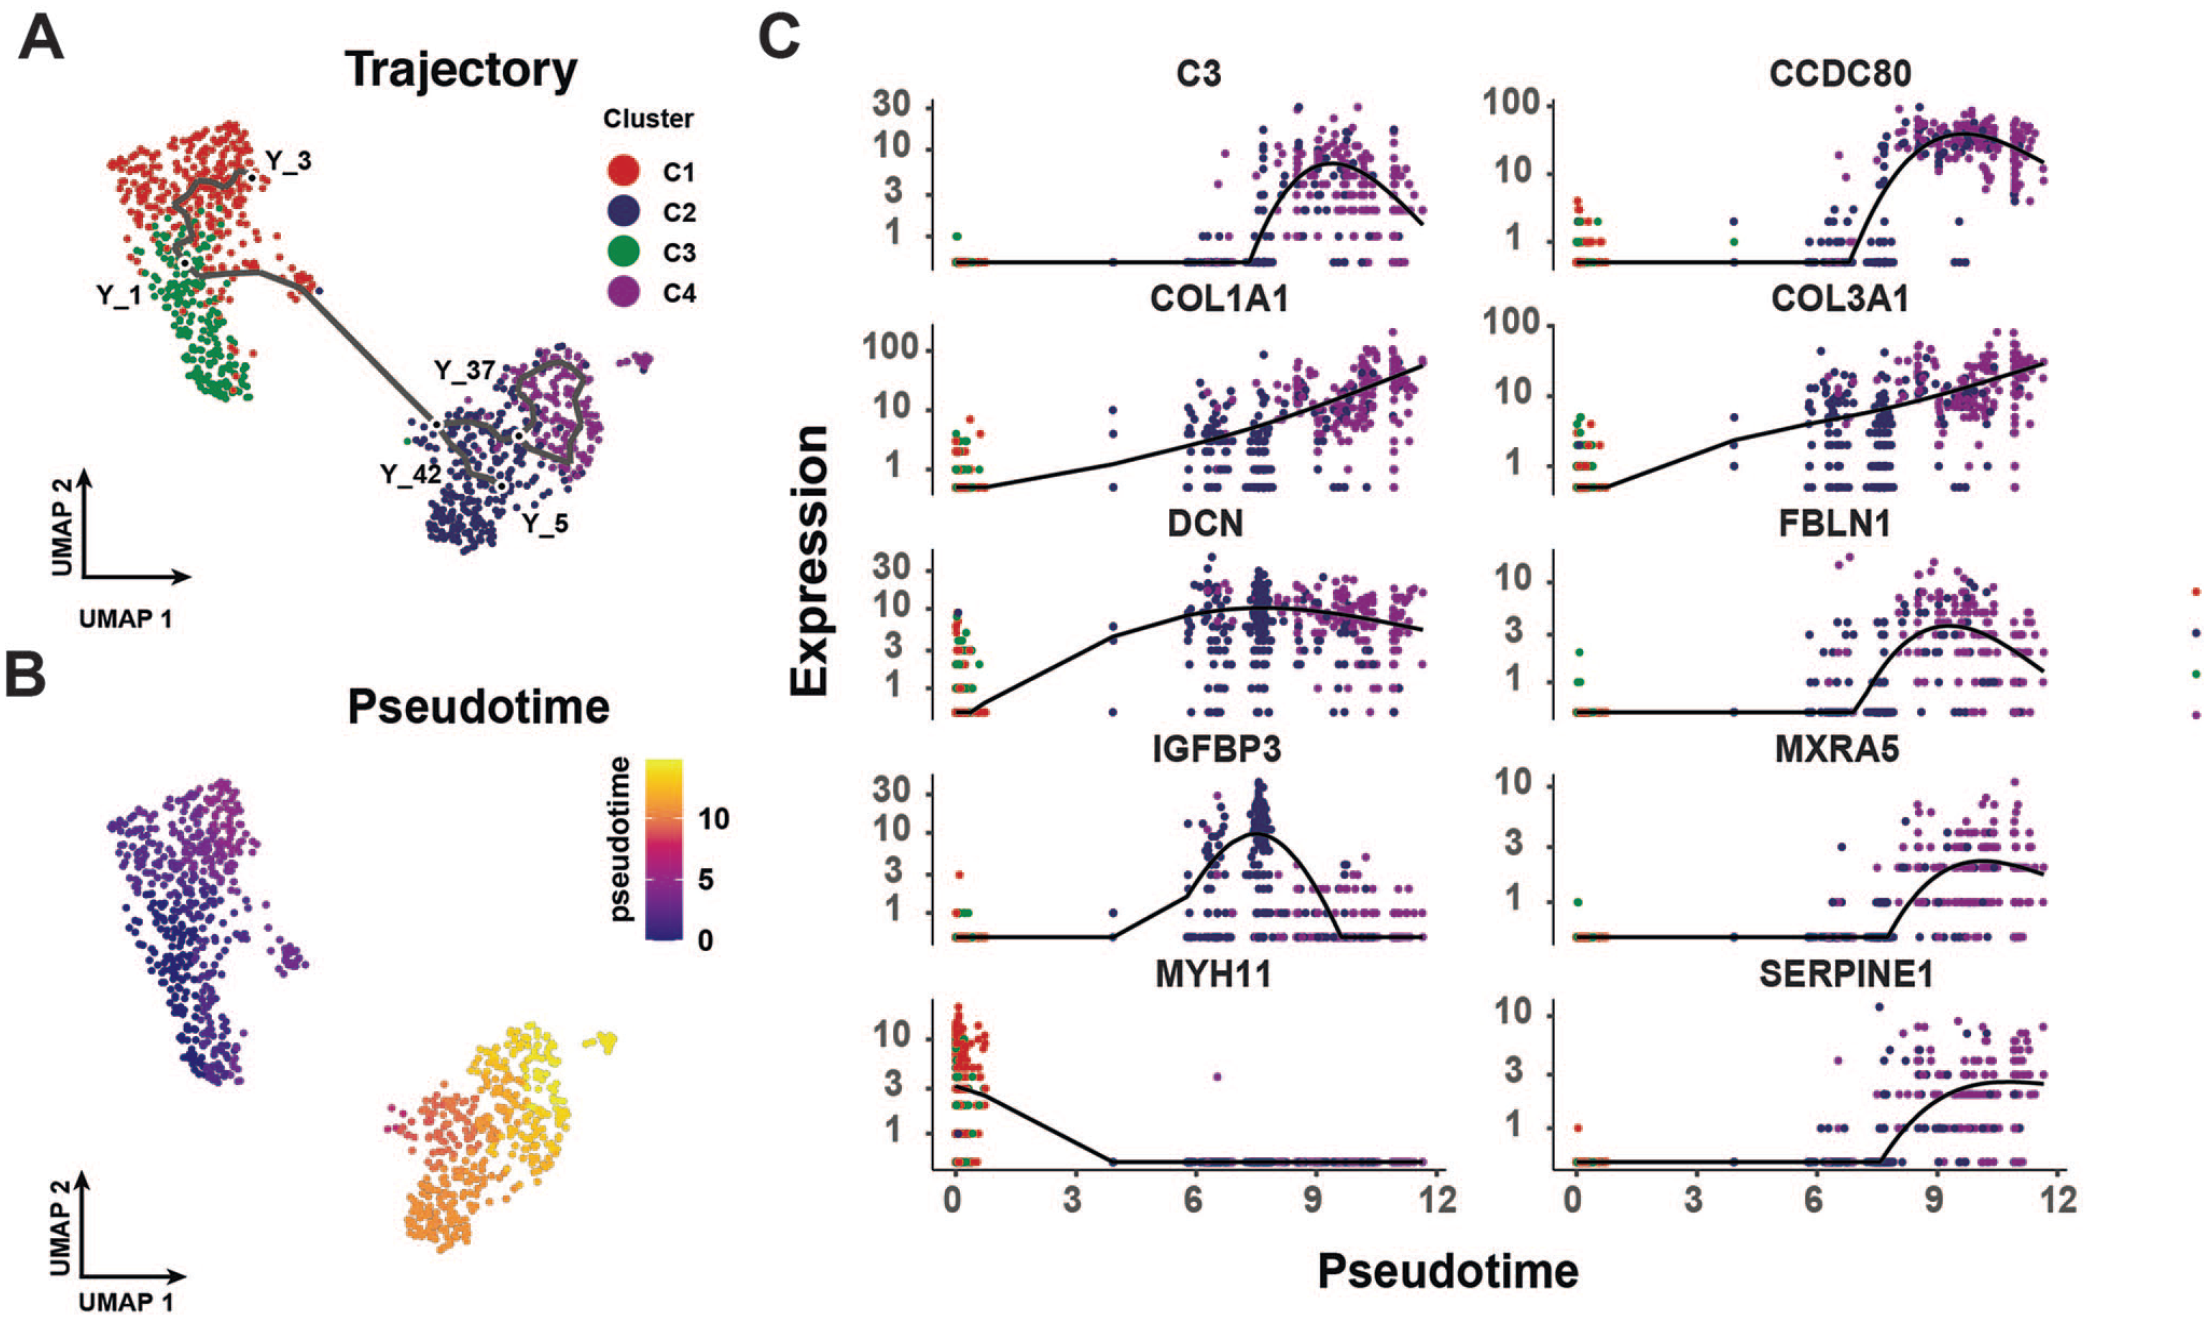
Differentiation trajectory of activated hepatic stellate cells. (A) Cellular differentiation trajectories of mesenchymal cell subpopulations. Colors represent different cell types. (B) pseudo-time changes in cell differentiation, blue represents the time of differentiation onset, and bright yellow represents the time of differentiation endpoint. (C) Expression of key genes during differentiation. Colors represent different cell types. (A color version of this figure is available in the online journal.)
Cellular communication between subpopulations of mesenchymal cells
To reveal the interactions between mesenchymal cell subpopulations, a receptor-ligand-based cell interaction was analyzed via cellphonedb. We demonstrated the strength of interactions between subpopulations of mesenchymal cells (Figure 4(A)). The number of interactions between C1 and C2, C3, and C4 cell populations was 21, 9, and 26, respectively (Figure 4(B)). The results showed that the interactions between C1 (activated HSCs) and C4 (myofibroblasts) were stronger than the other two subpopulations. The receptor ligands between C1 and C2 are mainly COL4A2, COL4A1, COL14A1, CD44, FGFR2, etc. (Figure 4(C)). The receptor ligands between C1 and C3 were mainly NTF3, NTRK3, NTRK2, JAG1, NOTCH3, ESAM, CD46, etc. (Figure 4(C)). The receptor ligands between C1 and C4 were mainly AXL, GAS6, TNFSF12, TNFRSF12A, FGFR1, FGF7, PDGFA, etc. (Figure 4(D)). Experimental studies indicated that as HSCs transformed into myofibroblasts, γ-carboxylated Gas6 was strongly expressed in the hepatic stellate cell line and activated the Axl/PI3-kinase/Akt pathway to induce the anti-apoptotic effect of HSCs. 29 The results suggested that the genes we mined were consistent with the validated receptor-ligand genes. In addition, we described the distribution of cells expressing receptor-ligand genes in the activated HSCs (Figure 4(E)).
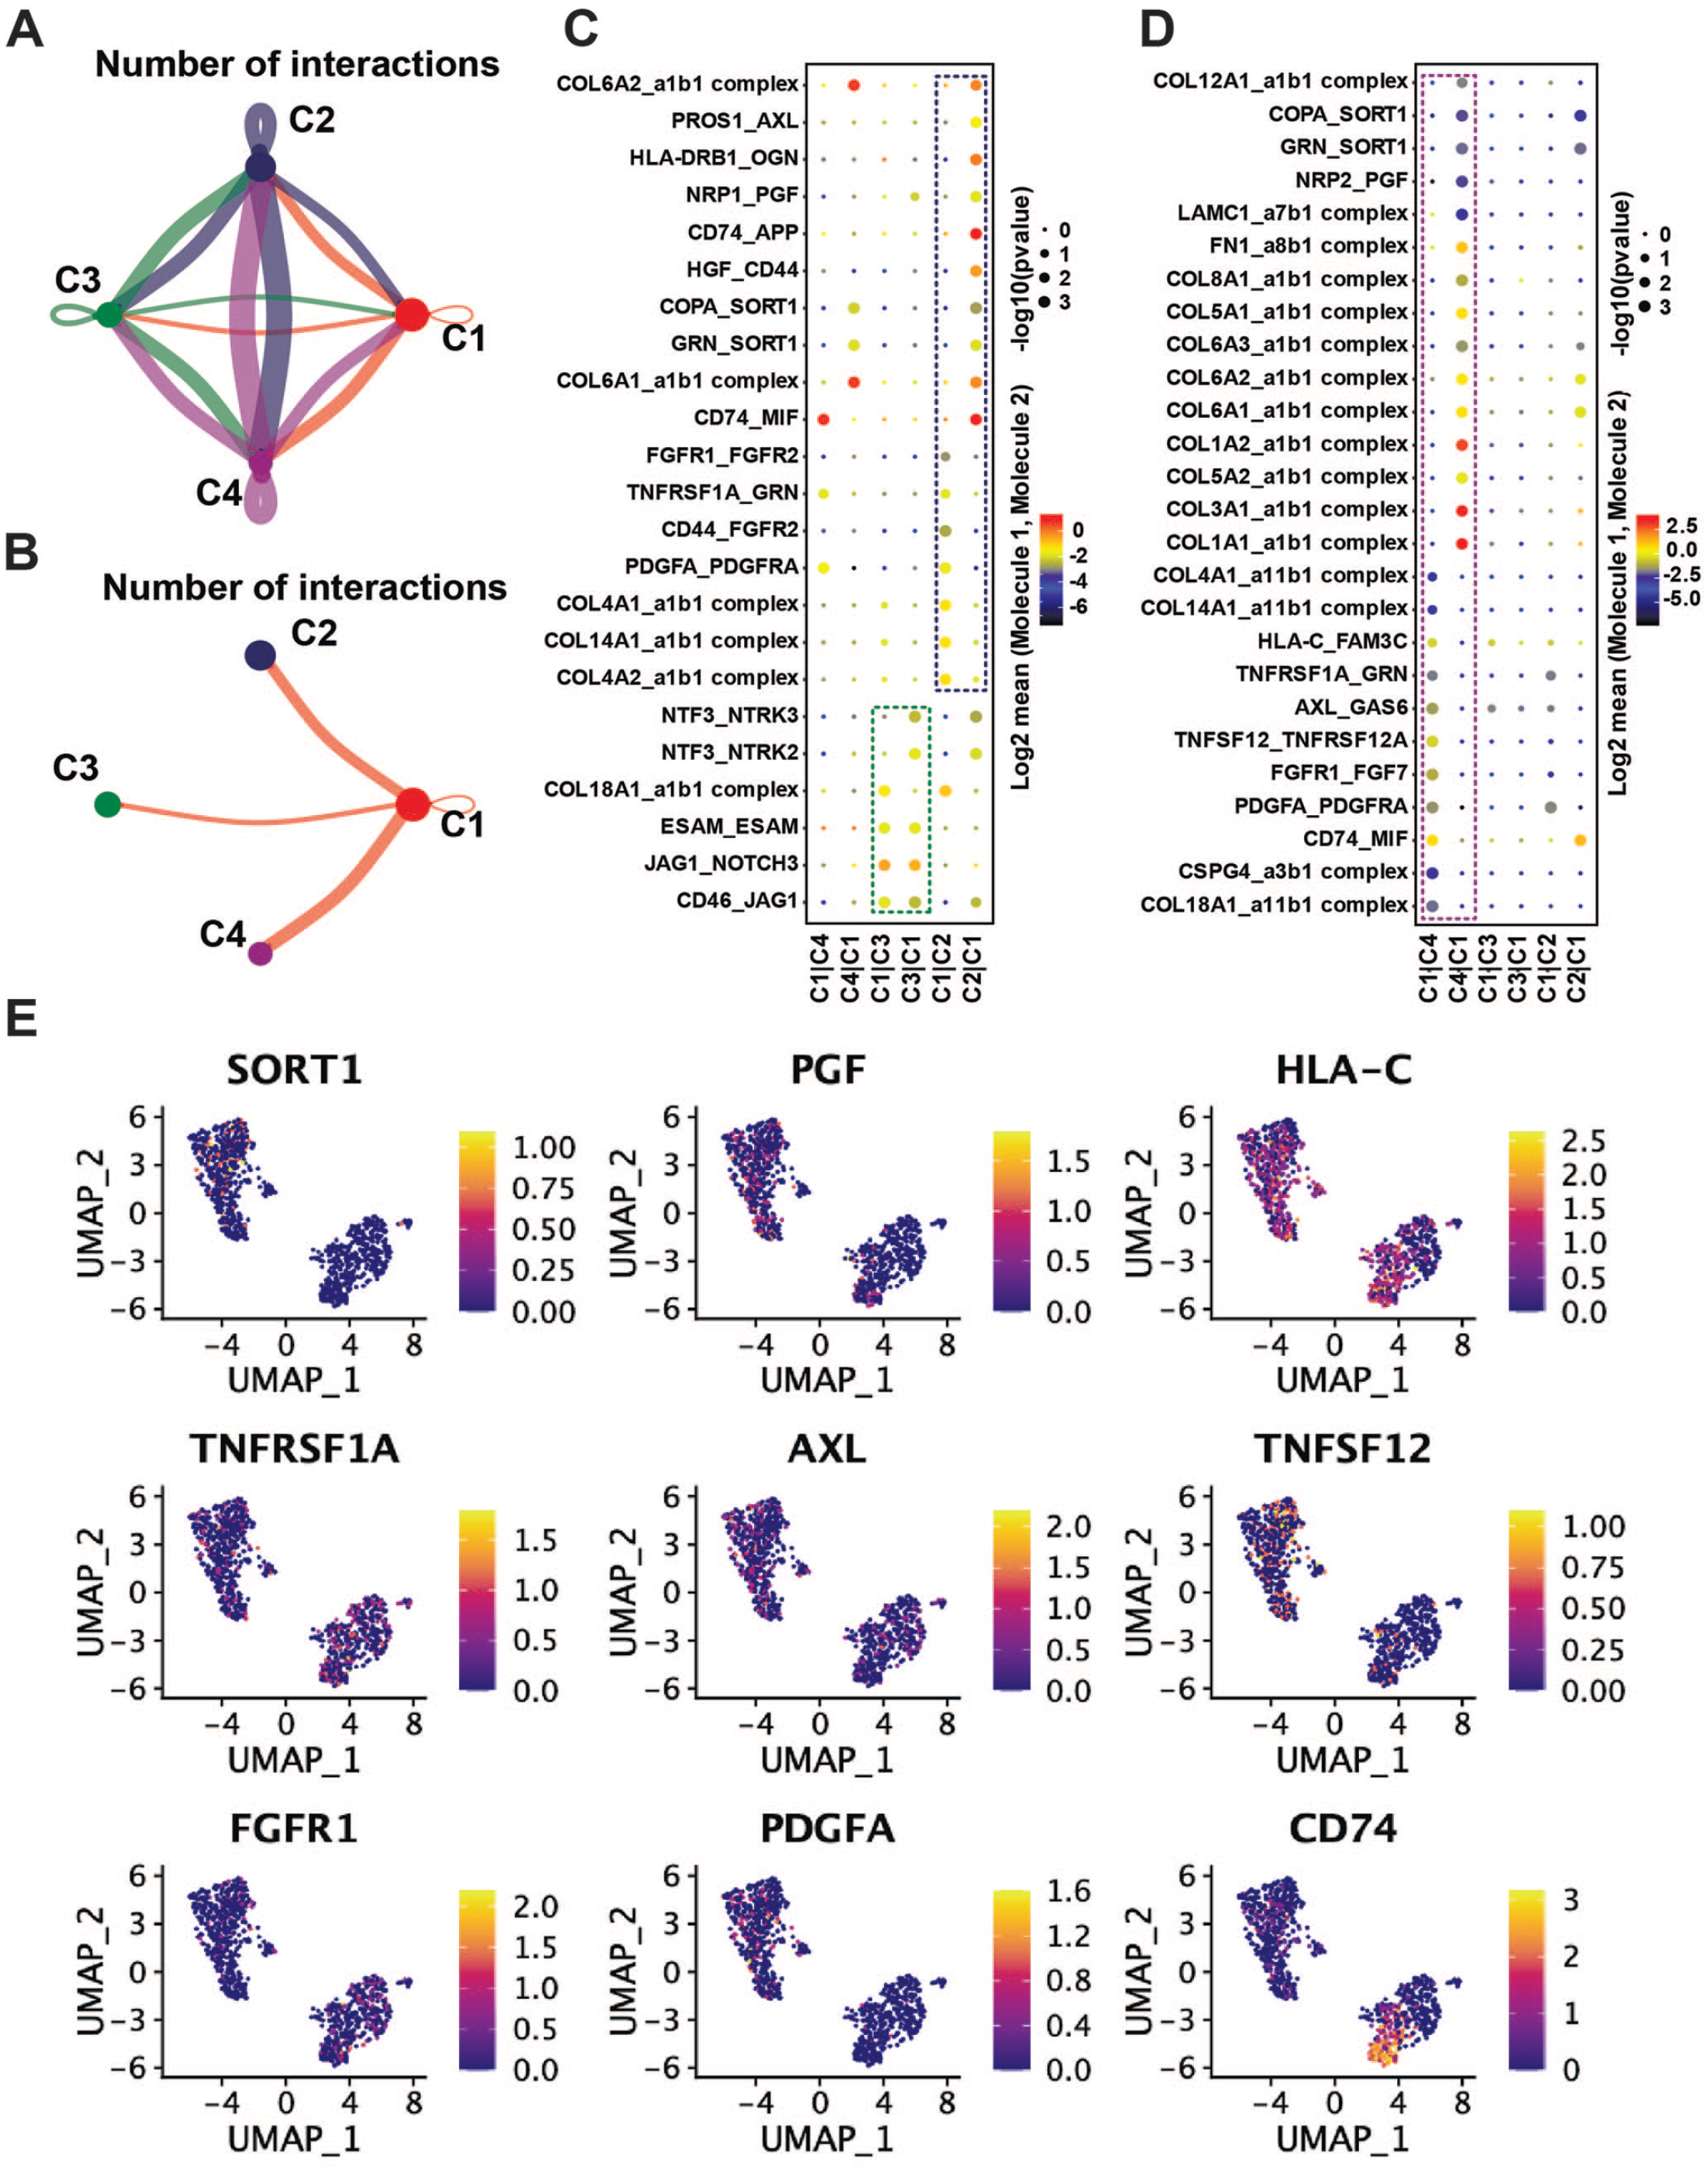
Cellular communication between subpopulations of mesenchymal cells. (A) The interactions between mesenchymal cell subpopulations, with thicker lines representing more interactions. Colors represent different cell types. (B) The interactions between activated HSCs and the other three subpopulations, respectively. Thicker lines representing more interactions. Colors represent different cell types. (C) Significant reciprocal receptor-ligand genes between C1 and C2, C3, respectively. Green represents the C2 cell population, dark blue represents the C3 cell population. (D) Significant receptor-ligand genes between C1 and C4. The purple color represents the C4 cell population. (E) Distribution of cells significantly expressing the C1 receptor-ligand gene. Colors represent the expression level of the gene in each cell; the higher the expression value, the brighter the color. (A color version of this figure is available in the online journal.)
scWGCNA in mesenchymal cell populations
To mine the critical driver genes of activated HSCs, hdWGCNA was used to mine the gene sets related to the characteristics of cell populations. 26
The co-expression similarity matrix was transformed into an adjacency matrix by setting the soft threshold parameter β = 12 (Figure 5(A)). Then, we used the topological overlap metric to create a topology matrix (Figure 5(D)). In order to divide similarly expressed genes in a gene module, the main parameters were as follows: minModuleSize of 50 and deepSplit of 2. Finally, some modules with correlations higher than 0.8 were merged (Figure 5(C)), resulting in a total of 8 major gene modules (Figure 5(B)). The results indicated that there was a highest correlation between the brown gene module and activated HSCs, and that there was a highest correlation between the turquoise gene module and myofibroblasts (Figure 5(E)).
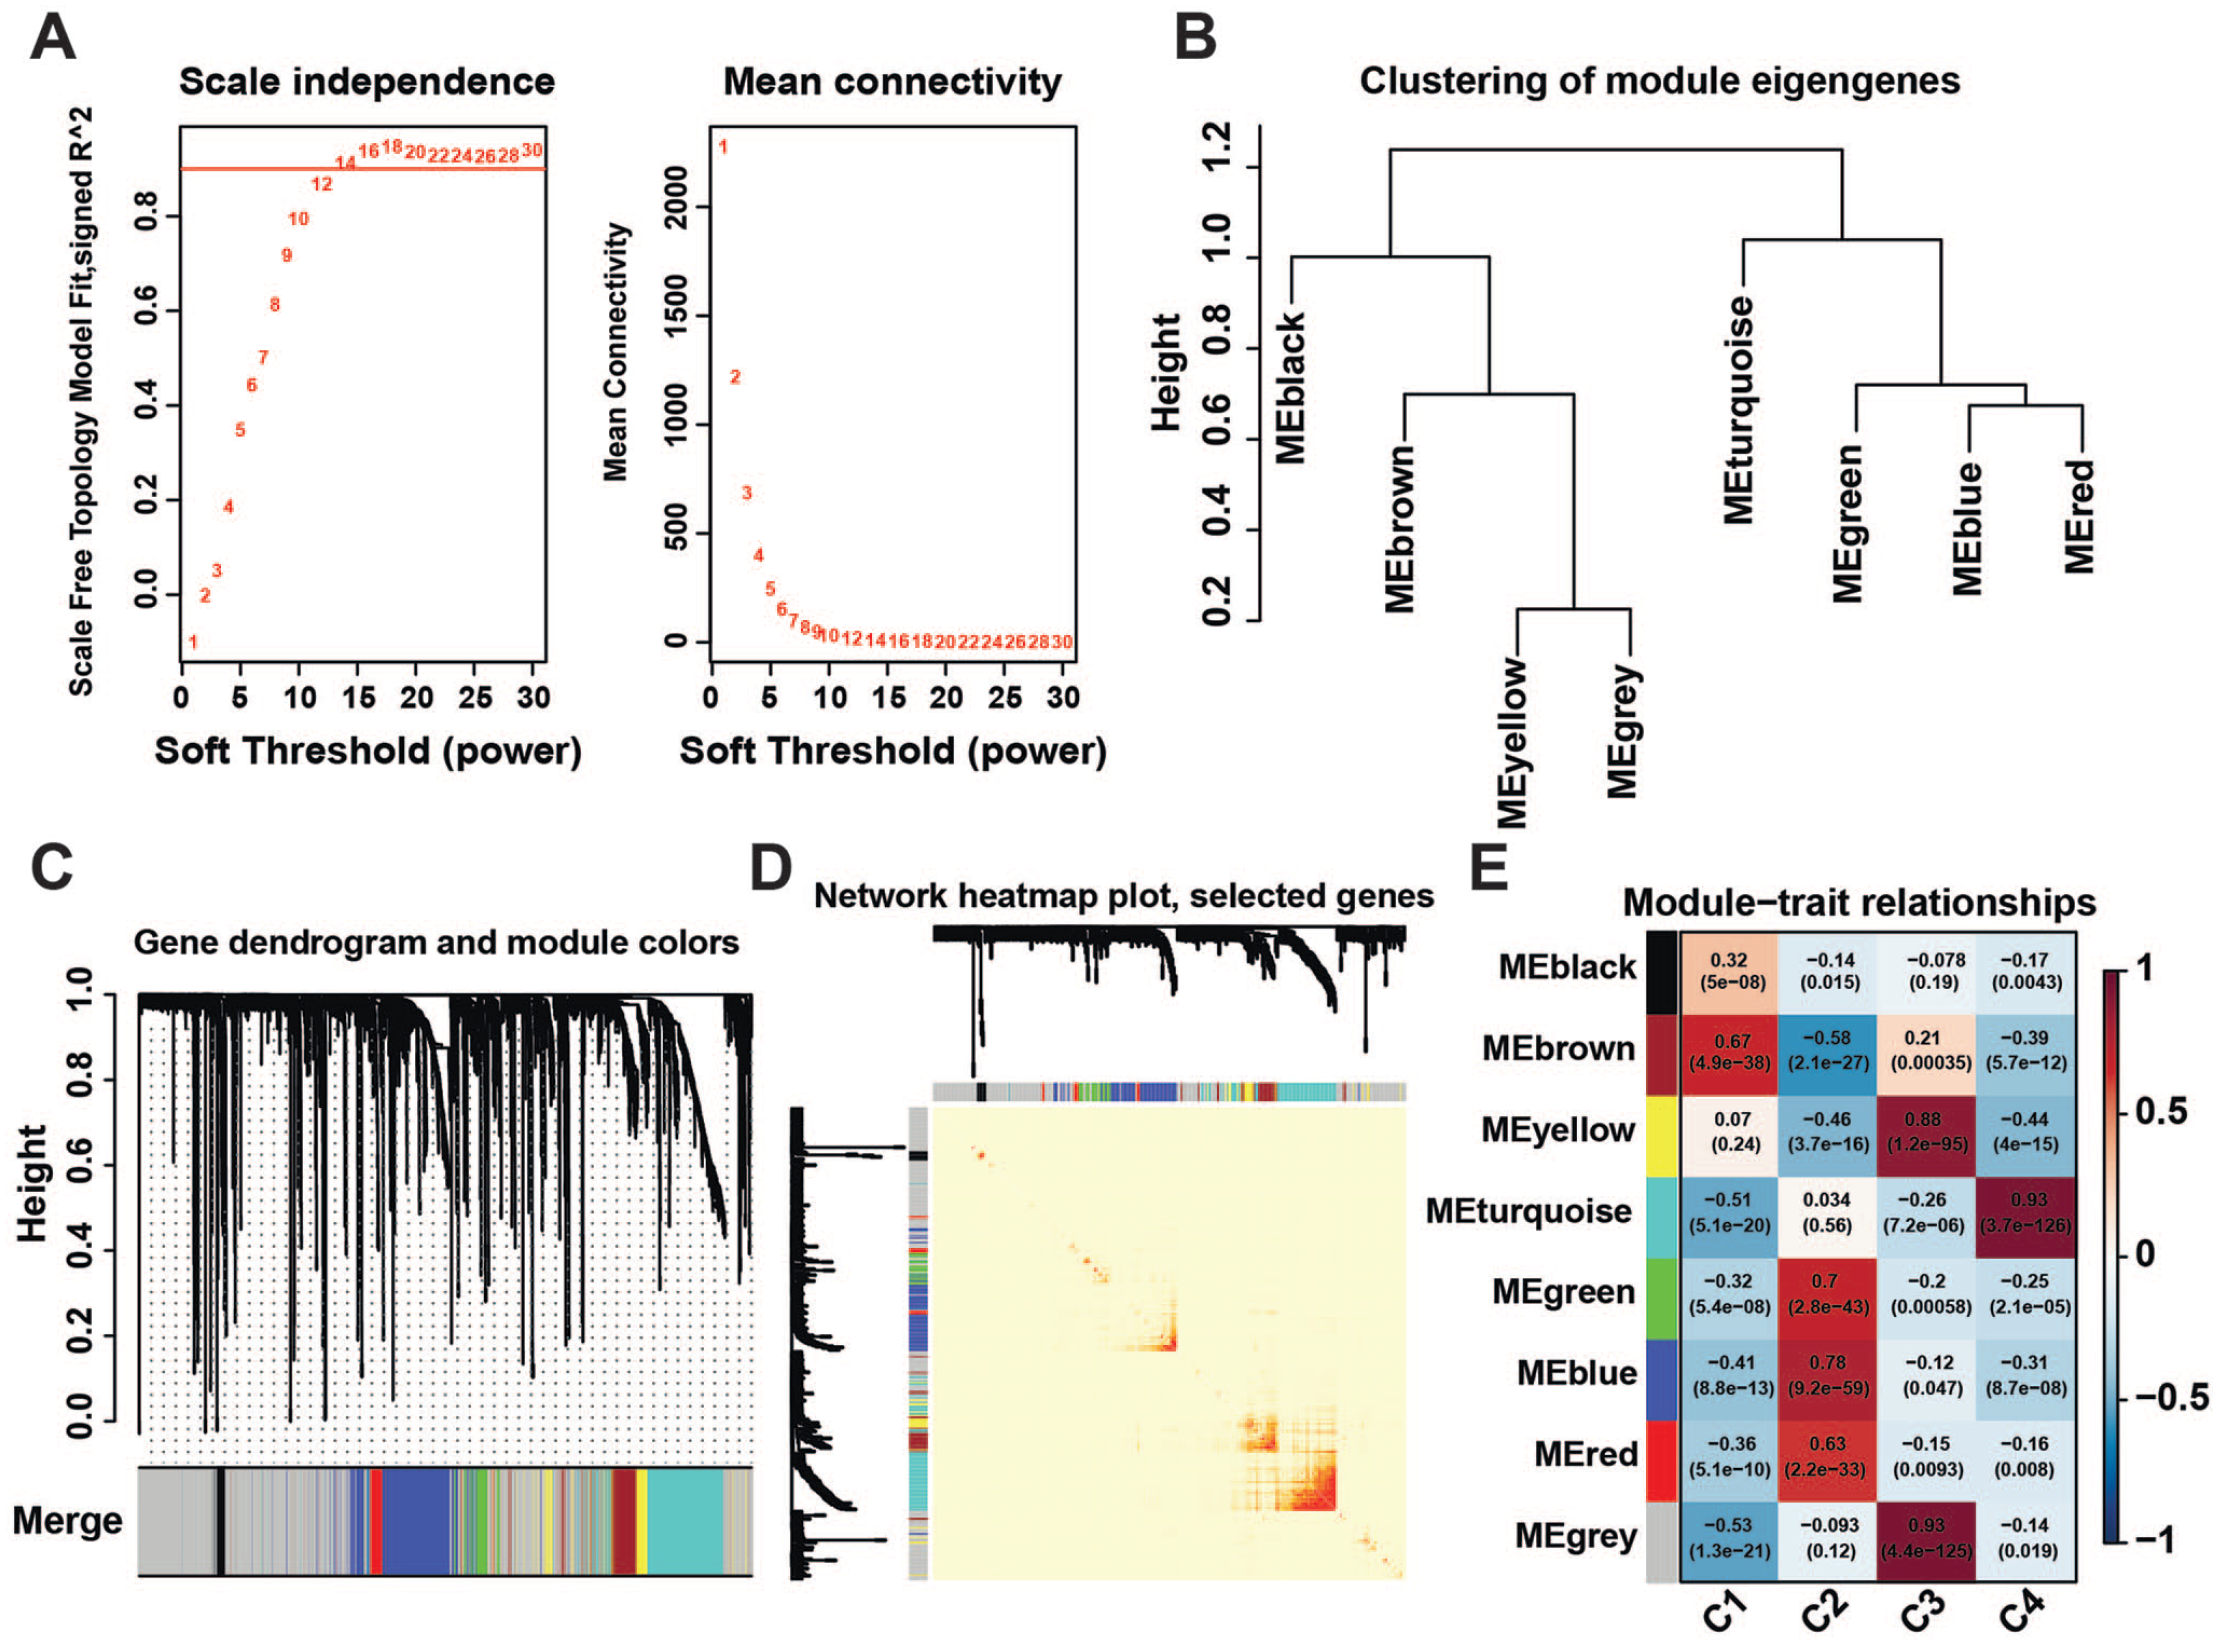
hdWGCNA in mesenchymal cell populations. (A) Selecting the appropriate soft threshold β. (B) Hierarchical clustering diagram between gene modules. (C) Merging similar gene modules. (D) Demonstration of gene networks through heatmap. (E) Associated Phenotype Analysis, red means positive correlation, and blue means negative correlation. (A color version of this figure is available in the online journal.)
Identification of the hub gene in activated HSCs and myofibroblasts
According to the analysis of WGCNA, we imported gene nodes in brown gene module into the cytoScope software using the exportNetworkToCytoscape function and used the MCC algorithm in the CytoHubba plugin to impute the core driver genes. Subsequently, we screened the top20 (Figure 6(A)), top5 (Figure 6(B)) and top2 hub genes for the brown gene set (Figure 6(C)). The results suggested that the hub genes in the brown gene set were CRIP1, ACTA2, SPARCL1, ADIRF, DSTN, and so on. Subsequently, we displayed the expression levels of the top2 hub genes of the brown gene module in single-cell profiles. The results suggested that these hub genes were highly expressed in the activated HSCs (Figure 6(D)).
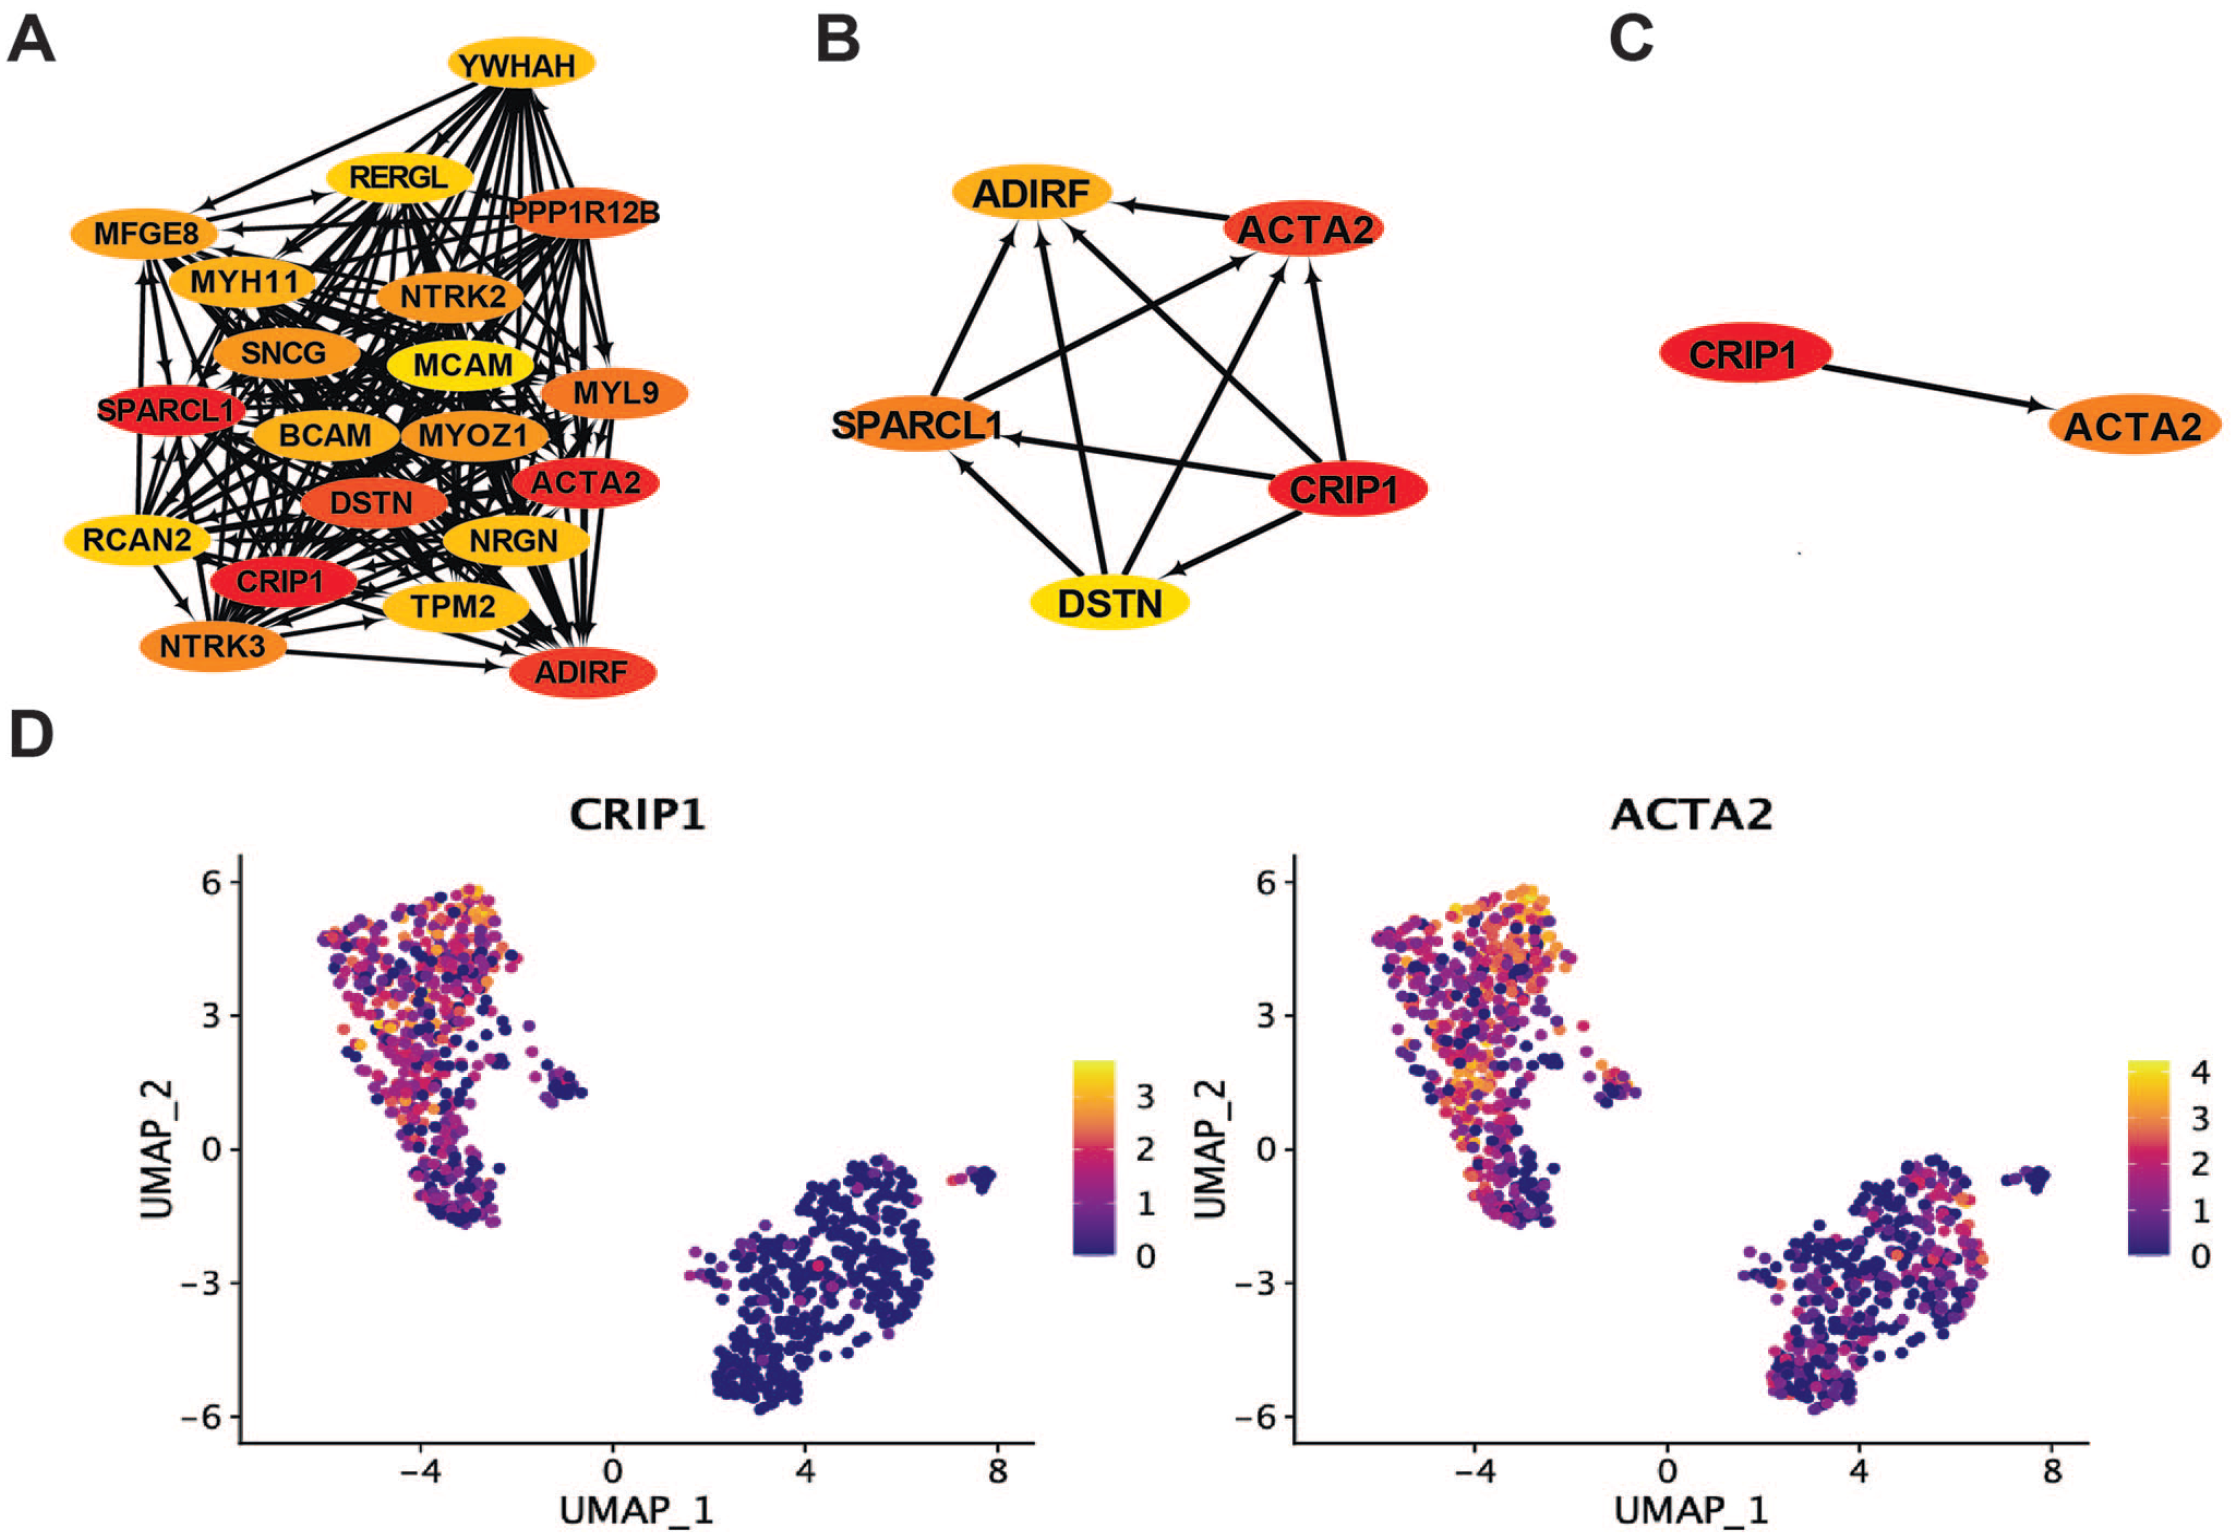
Identification of the hub gene in activated HSCs and myofibroblasts. (A)–(C) In the brown gene module, the top20, top5, and top2 hub genes. Darker colors represent high MCC scores, meaning more nodes are connected to the hub node. Arrows only represent the correlation between genes and do not represent the direction of regulation. (D) The expression levels of the top2 hub genes in the brown gene module. Colors represent the expression level of the gene in each cell; the higher the expression value, the brighter the color. (A color version of this figure is available in the online journal.)
The validation of hub genes expression
RT-qPCR using liver tissues both from healthy controls and from liver cirrhosis patients was performed to further verify the expression level of the top2 hub genes. The results indicated that the expressions of CRIP1 and ACTA2 in the cirrhotic tissue we tested were significantly upregulated (Figure 7(A) and (B)).
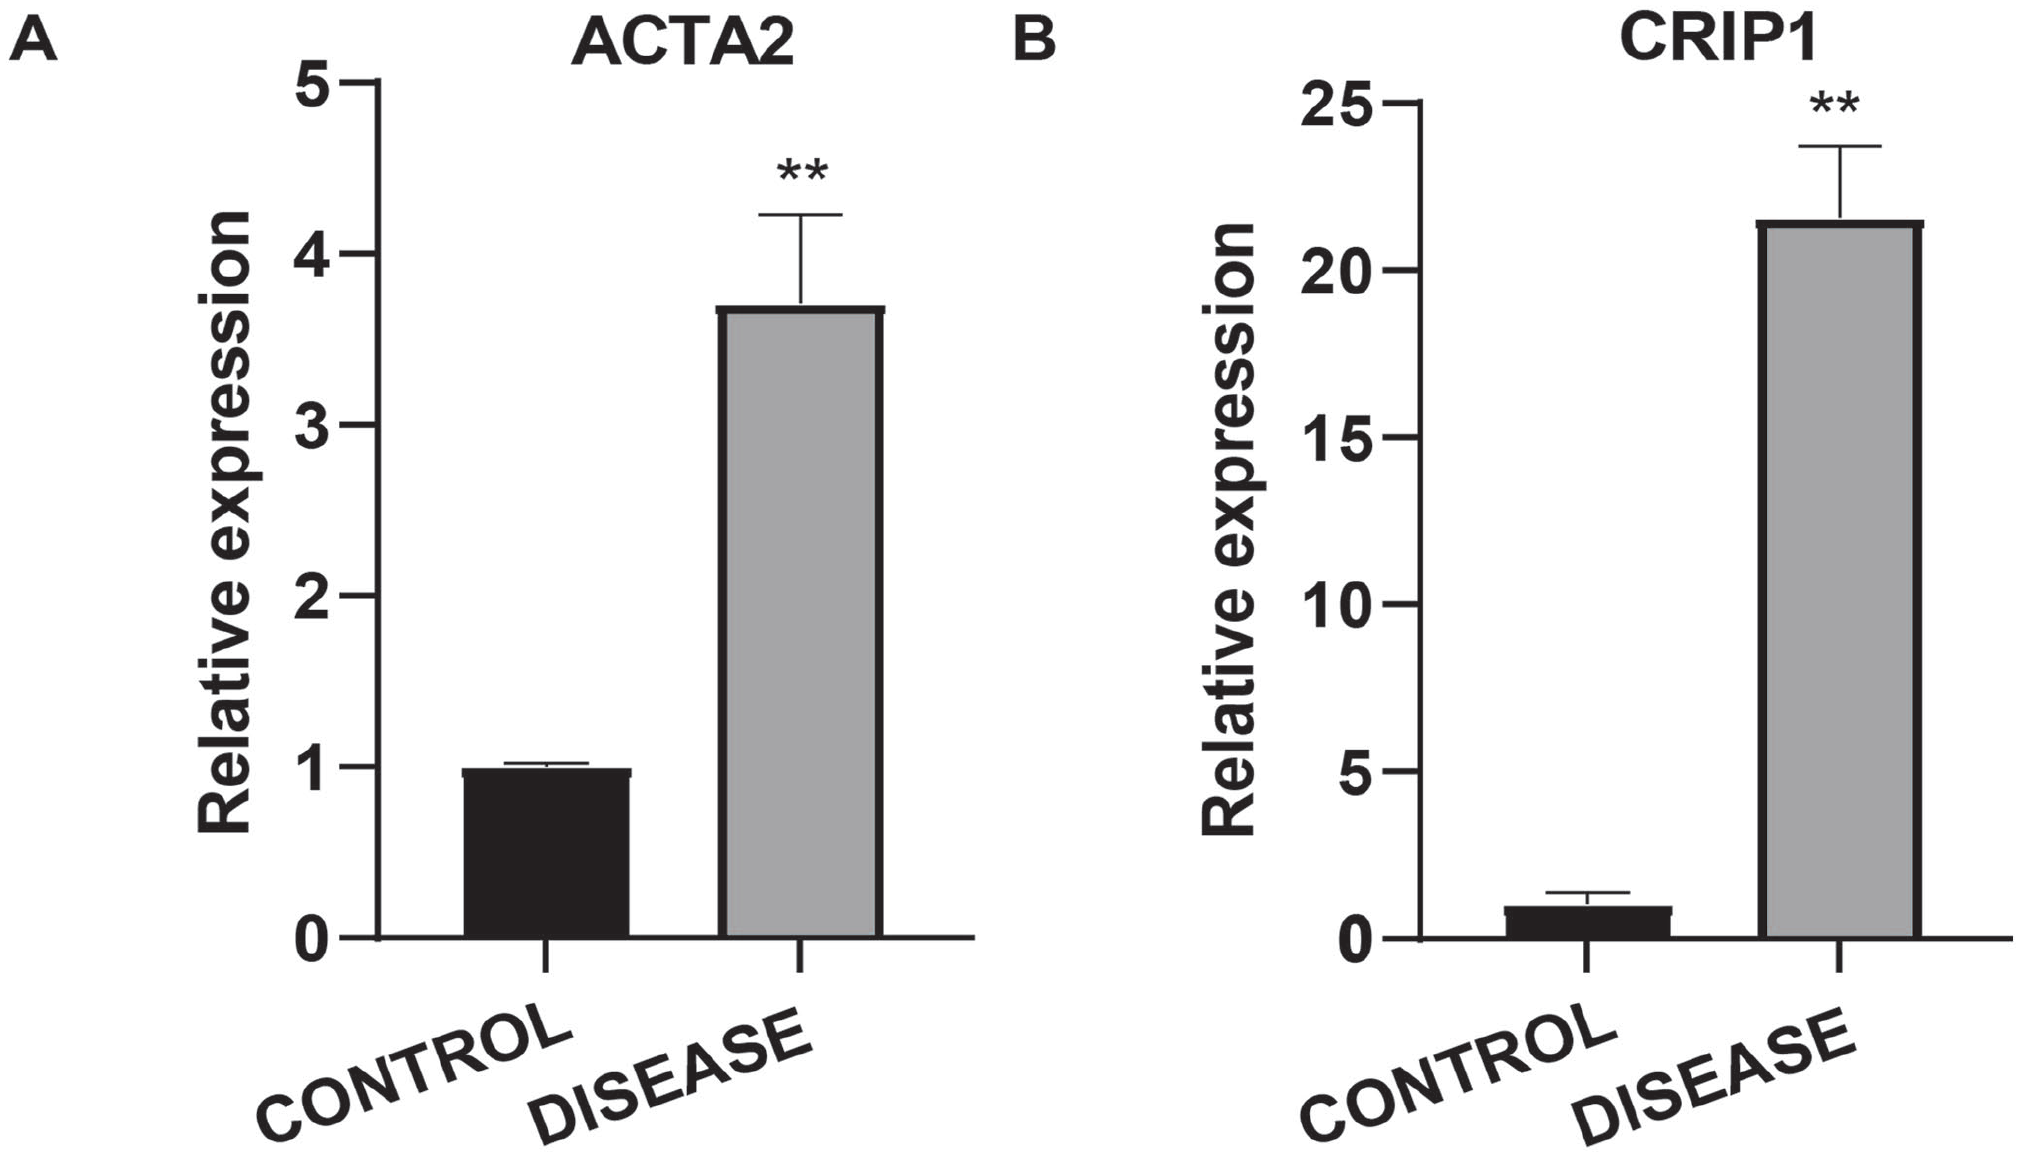
The validation of the expression levels of hub genes. (A) The relative expression level of ACTA2 in liver tissue from liver cirrhosis patient and healthy control. (B) The relative expression level of CRIP1 in liver tissue from liver cirrhosis patient and healthy control.
Discussion
Here, we apply scRNA-seq to profile the ecological niche of fibrosis in human cirrhosis and identify a subpopulation of HSCs in mesenchymal cells that can be converted into myofibroblasts. Myofibroblasts in the liver have a number of characteristics leading to injury and fibrosis. 30 We analyzed the strength of interactions between mesenchymal cell subpopulations and identified receptor-ligand genes with significant interactions that could be potential drug targets in the future.
In addition, we have probed the gene co-expression network of activated HSCs by hdWGCNA and predicted the critical driver genes of activated hepatic stellate cells. Perhaps the key set of genes predicted by hdWGCNA via single-cell RNA could be integrated into the set of genes obtained by lasso regression via bulk RNA to further improve the accuracy of the diagnostic model.31–33 At the advent of precision medicine, the unbiased multi-lineage method allows the mining of additional drug targets, as well as provides important information for the development of new targeted anti-fibrosis drugs.
To further validate the expression level of the critical genes, RT-qPCR was performed in the liver of both a cirrhosis patient and a healthy control. As indicated, we found that the relative expression levels of CRIP1 and ACTA2 were upregulated in the liver cirrhosis tissue. It can interact with Fas, the transmembrane protein which belongs to the tumor cirrhosis factor superfamily to initiate the apoptotic process. 34 Similarly, Wang et al. found that CRIP1 was highly upregulated in hepatocellular carcinoma, and the patient’s prognosis was poor. In clinical manifestation, BBOX1 levels were lower in hepatocellular carcinoma (HCC) patients with higher levels of CRIP1 protein and nuclear beta-catenin protein, which suggested that CRIP1 was associated with HCC. 35 However, the mechanism of upregulated CRIP1 in liver cirrhosis tissue needs further study. Liver tissue injury can trigger many changes, including hepatic stellate cell activation that causes the proliferation and deposition of ECM, leading to liver fibrosis. When HSCs are activated to differentiate into contractile and proliferative myofibroblasts, several mesenchymal markers, including ACTA2, were expressed.36,37 The expression level of ACTA2 is mainly restricted to pericytes, smooth muscle cells, and myofibroblasts. What is more, the ACTA2 has been indicated to be associated with hepatitis C virus-induced hepatic fibrosis. 38 Here, we also reported an upregulated expression level of ACTA2, which is consistent with a previous study. However, due to the relatively small number of clinical samples available in this study, and the complex mechanism of liver cirrhosis, further studies and large sample studies, incorporating clinical information, are required to validate the functions of these genes in liver cirrhosis or HCC progress.
Overall, our study demonstrates the advantages of scRNA-seq in decoding the activation of human HSCs into myofibroblasts and their core driver genes. It also provides an analytical strategy for mining relevant therapeutic target genes and some important information for targeted therapies for various fibrotic diseases.
Supplemental Material
sj-pdf-1-ebm-10.1177_15353702231191109 – Supplemental material for Unraveling the activation process and core driver genes of HSCs during cirrhosis by single-cell transcriptome
Supplemental material, sj-pdf-1-ebm-10.1177_15353702231191109 for Unraveling the activation process and core driver genes of HSCs during cirrhosis by single-cell transcriptome by Xia Li, Qiang Wang, Liang Ai and Ke Cheng in Experimental Biology and Medicine
Footnotes
Authors’ Contributions
XL and KC: study design. XL, QW, and LA: study conduct. XL and LA: data collection. XL and LA: data processing, statistical data analysis. All authors revised and approved the article content.
Declaration Of Conflicting Interests
The author(s) declared no potential conflicts of interest with respect to the research, authorship, and/or publication of this article.
Ethical Approval
All human tissue samples were collected in strict accordance with the regulations of the Third Xiangya Hospital of Central South University. This study was approved by the IRB of The Third Xiangya Hospital of Central South University (No. 22232).
Funding
The author(s) disclosed receipt of the following financial support for the research, authorship, and/or publication of this article: All costs of our research were funded by the National Natural Science Foundation Project of China (82000603).
Supplementary Material
Supplemental material for this article is available online.
References
Supplementary Material
Please find the following supplemental material available below.
For Open Access articles published under a Creative Commons License, all supplemental material carries the same license as the article it is associated with.
For non-Open Access articles published, all supplemental material carries a non-exclusive license, and permission requests for re-use of supplemental material or any part of supplemental material shall be sent directly to the copyright owner as specified in the copyright notice associated with the article.