
Abstract
The replicative success of vaccinia virus (VACV) depends on its ability to subvert host functions. Poxviruses multiplication and maturation are closely associated with the endoplasmic reticulum (ER) and its membranes. This organelle responds to disturbances caused by the accumulation of misfolded proteins, leading to processing of these proteins or even programmed cell death through the unfolded protein response (UPR). Several studies show that different viruses can activate UPR pathway components and negatively modulate others. Here, we investigate the effects of infections by zoonotic VACV strains from Brazil, Guarani P1 virus (GP1V) and Passatempo virus (PSTV), in the activation of UPR pathway sensors. We observed translocation of ATF6 to the nucleus as well as transcriptional increase after GP1V, PSTV, and reference strain Western Reserve (WR) infection. XBP1 processing appears to be negatively modulated after VACV infection; however, inhibition of the inositol-requiring enzyme 1 (IRE1) kinase domain led to a reduction in plaque sizes for these viruses. The absence of PKR-like endoplasmic reticulum kinase (PERK) has an impact on the plaque phenotype of GP1V, PSTV viruses, as well as for the prototypical strain WR. These results indicate that the VACV manipulates the three arms of the UPR path differently to ensure replicative success.
Keywords
Impact Statement
The COVID-19 pandemic has deeply affected the entire human world population, shaking our very ways of life. The reason for the recent upsurge of virus pandemics and epidemics are many, and in the wake of COVID-19, we have experienced the reappearance of an old foe: pathogenic orthopoxviruses. The recent monkeypox outbreak (Mpox) has shown that 40 years after the smallpox demise, the immune resistance to orthopoxvirus’ infections has waned, making us vulnerable to this new threat. Zoonotic vaccinia viruses are known to circulate for many decades in places like Brazil and India, and because they are adapted to mammalian hosts, understanding their biology and pathogenic functions can offer important clues on how to deal with more pathogenic orthopoxvirus’ species, such as Mpox.
Introduction
The correct conformation of integral or secreted three-dimensional proteins that harbor a signal peptide occurs in the lumen of the endoplasmic reticulum (ER), which has a fundamental oxidative environment for the formation of disulfide bridges, important in the maintenance of the protein structure. Consequently, ER can respond to disturbances caused by the accumulation of malformed proteins, leading to the proper processing of these proteins, protein degradation, or even programmed cell death. Several factors can lead to the induction of unfolded protein response (UPR), among them: abiotic stress, genetic mutations, pharmacological agents, and viral and bacterial pathogens. When prolonged UPR pathway activity occurs, indicating that homeostasis cannot be restored, components of this pathway induce cell death.1,2 The UPR pathway has three arms: Activating Transcription Factor 6 (ATF6), the Inositol-Dependent Protein Kinase (Inositol-requiring Transmembrane Kinase and Endonuclease, or IRE-1α), and PKR-like ER-Resident Protein Kinase (PKR-like Endoplasmic Reticulum Kinase or PERK). 3 These molecules are deactivated through the binding of the ER chaperone, BiP/GRP78 (Binding Protein/heat shock 78kDa glucose-regulated protein) in the lumen-facing domain of the ER. 4 Vaccinia virus (VACV) is a member of the Poxviridae virus family, and its replicative success is partially dependent on its ability to block, evade, or subvert essential elements of the host’s responses to infection. VACV have a double strand of DNA and encode about 200 proteins. The multiplication of poxviruses is closely related to the ER since the viral factories produced during poxvirus replication are surrounded by ER membranes.5–7 With the upsurge of zoonotic VACV strains, VACV were divided into two phylogenetic divergent groups: group 1 (less virulent in murine infection models) and group 2 (more virulent in murine infection models). Other features such as plaque phenotype and nucleotide deletions of proteins common to these viruses are considered for the phylogenetic separation. 6 The relationship between the replication of poxvirus, the close association with ER membranes, and the use of ER components for their own benefit may suggest that the UPR pathway is activated during the replication of these viruses. XBP1 can be activated by stimulation of toll-like receptor (TLR)-2 and TLR-4 in an inositol-requiring enzyme 1 (IRE1)–dependent manner, and it has been demonstrated that VACV can interfere with TLR signaling. In addition, XBP1 plays an important role in the production of cytokines by macrophages; thus, modulation of XBP1 may be a viral strategy to face the innate immune responses of the host, in addition to the activation of the UPR pathway itself. The activation of PERK by eIF2α phosphorylation reduces the translation of cellular mRNAs, and on the contrary, increases the translation of several genes such as CHOP, GADD34, and ATF3, which in turn can be modulated during the replication of poxvirus by interfering with amino acids transport, glutathione metabolism, and control of oxidative stress. Proteins that mimic eIF2α are produced by poxviruses and act as a pseudosubstrate for PERK, preventing the blocking of viral protein synthesis. After activation, ATF6 is transposed to the Golgi where it is cleaved by proteases and subsequently translocated to the cell nucleus, promoting chaperone expression plus the expression of modifying enzymes and genes that encode important transcription factors in stress-induced proteostasis and apoptosis. 7
In this work, we have analyzed two zoonotic VACV strains isolated from rural areas in Brazil and that have different virulence patterns, Vaccinia virus Guarani P1 (GP1V) which belongs to group 2 and Passatempo virus (PSTV) which is a member of group 1. Here, we demonstrate how GP1V and PSTV viruses manipulate the components of the UPR pathway, as well as the importance of these components for viral productivity after infection in mouse embryonic fibroblasts.
Materials and method
Cells, viruses, and infection conditions
Cells BSC40 (ATCC CRL-2761), BALB/3T3 clone A31 (ATCC CCL-163), PERK-WT (ATCC CRL-2977), PERK-KO-DR (ATCC CRL-2976), immortalized ATF6 knockout mouse embryonic fibroblasts (MEFs), and ATF6-WT cell control, were grown under standard conditions in Dulbecco’s modified Eagle’s medium (DMEM) supplemented with 2 mM
Viral infectivity assays
ATF6 knockout, ATF6-WT, PERK-KO or MEF-WT cells, and the respective wild-type control cell were grown to a density of 5 × 10⁵ cells (one-step growth analysis) or 3 × 10⁵ cells (multistep growth analysis) per well on a six-well culture dish and then infected with GP1V, PSTV or WR. Infections were carried out at a multiplicity of infection (MOI) of 10 for 3, 6, 12, 24, and 48 h (one-step growth or for 24, 48, 72, and 96 at an MOI 0.01 multistep growth). The infected monolayers were then harvested and viruses were titrated in BSC-40 cells. All experiments were performed in duplicate.
Plaque phenotype
The cytopathic effect of VACVs was macroscopically observed through the formation of viral plaque. Therefore, the plaque phenotype assay was used to comparatively verify the morphology of plaques displayed by GP1V, PSTV, or WR viruses. BSC-40 cells, MEF-WT, or PERK-KO were cultured in six-well plates and incubated in an oven at 37°C in an atmosphere of 5% CO2. Subsequently, the cells were inoculated with GP1V, PSTV, and WR isolates with 50 PFUs and incubated in medium with carboxymethylcellulose (CMC) for 48 h. After 48 h of incubation, infected cells were fixed with 4% formalin solution and stained with 1% crystal violet. Plaque phenotype assays produced in ATF6-WT and ATF6-KO cells were performed by immunostaining. ATF6-KO and ATF6-WT cells were cultured in 12 wells and incubated in an oven at 37°C in a CO2 atmosphere. Subsequently, the cells were inoculated with GP1V, PSTV, or WR isolates with 50 PFUs in medium with CMC for 48 h. After 48 h of incubation, CMC was removed from each well and the monolayer was fixed with a 1:1 methanol/acetone solution. The fixation solution was removed, and the wells were washed three times with phosphate-buffered saline (PBS) 1×. Then, the monolayers were incubated with primary antibody (obtained from rabbits immunized with the WR virus and kindly donated by Dr Bernard Moss) diluted 1:5000 in PBS containing 3% fetal bovine serum (FBS) for 1 h, stirring at room temperature environment. After incubation, the monolayer was washed three times with PBS and incubated with Protein Peroxidase conjugate (Thermo Fisher Scientific, Waltham, MA, USA) diluted 1:5000 in PBS containing 3% FBS for 1 h under stirring at room temperature. After incubation, the monolayer was washed with running water and developed with the o-dianisidine substrate (Sigma-Aldrich Biotechnology, St. Louis, MO, USA) diluted in PBS with 0.03% H2O2.
Characterization of reporter gene expression
The day before transfection, A31 cells were seeded in 24-well plates (1 × 10⁵ cells/well) in 10% FBS DMEM. Cells were co-transfected with 200 ηg of p5xATF6-GL3 (gently provided by Dr Ron Prywes, Department of Molecular Genetics, Kumamoto University, Japan) 12 and 50 ηg of pRL-TK (Promega, Madison, WI, USA), using Lipofectamine 2000 (Invitrogen, Waltham, MA, USA) according to the protocol provided by the manufacturer. Transfected cells were infected with GP1V, PSTV, and WR virus at MOI 10 or treated with 2.5 μM tunicamycin (Sigma). After indicated hours postinfection (h.p.i.), the growth medium was removed, and the cells were rinsed with PBS 1× and were lysed by shaking for 15 min on ice with 100 μL of Passive Lysis Reagent (Promega). Twenty microliters of each cell lysate were assayed for firefly and renilla luciferase activities using a LumiCount Microplate Reader Luminometer (Packard BioSciences, Meriden, CT, USA) and Dual-Luciferase Reporter Assay System (Promega) according to the protocol provided by the manufacturer. The results were expressed as the ratio of the activities of firefly luciferase/renilla luciferase (RLA, Relative Luciferase Activity). The experiments were performed in duplicate.
Characterization of nuclear translocation of reporter gene
The day before transfection, A31 cells were seeded in 24-well plates. Cells were transfected with 600 ηg of pShortCMV-ATF6-GFP, gently provided by Kazutoshi Mori (Kyoto University, Japan) 13 as previously described. Cells were infected GP1V, PSTV, and WR virus with or treated with tunicamycin for 24 h, and reporter gene expression and localization was assessed by fluorescent microscopy using EVOS FL cell imaging system (Life Technologies). To quantify nuclear translocation of reporter gene, we isolated the nucleus from transfected and infected cells in ice-cold nuclear isolation buffer (320 mM sucrose, 5 mM MgCl2, 10 mM HEPES, and Triton X-100 pH 7.4). We further verified nuclear integrity by trypan stain and then count GFP positive nuclei by flow cytometry; 500,000 events were read for each of the groups evaluated in BD FACScan cytometer.
Multiplication curves and plaque phenotype in the presence of inhibitors of the UPR response
For multiplication curves in the presence of pathway component inhibitors UPR, we used the 4µ8C inhibitor at a concentration of 25 µM (inhibitor of the RNase domain of IRE1), Kira6 at a concentration of 5 μM (IRE1 kinase domain inhibitor), and HA15 at a concentration of 10 μM (BiP/GRP78 chaperone inhibitor) to assess viral yield and plaque phenotype of GP1V, PSTV, and WR viruses. Infections were carried out at an MOI of 10 for 3, 6, 12, 24, and 48 h (one-step growth or for 24, 48, 72, and 96 at an MOI 0.01 multistep growth); in the plaque phenotypes, infections were made with 50 PFUs. The inhibitors were maintained in the monolayer throughout the experiment: 30 min before virus adsorption, during adsorption, and then adsorption until fixation with a 4% formalin solution and stained with a 1% crystal violet solution. Dimethyl sulfoxide (DMSO) was used as an untreated control, as it is the diluent of the inhibitors used. The experiments were performed in duplicate.
RNA extraction and complementary DNA synthesis
Total RNA was extracted from cells using TRI Reagent (Sigma) according to the manufacturer’s instructions and treated with DNase I (MACHEREY-NAGEL) before reverse transcription to remove residual genomic DNA contamination. Extracted RNA was dissolved in diethylpyrocarbonate (DEPC)-treated water, and the RNA concentration and purity were estimated on NanoVue Plus Spectrophotometer (GE Healthcare Life Sciences, Fairfield, CT, USA). Aliquots of RNA samples were subjected to electrophoresis in a 1% denaturing agarose gel containing ethidium bromide staining to verify their integrity. The complementary DNA (cDNA) was synthesized from 1 μg RNA in a final reaction volume of 20 μL, using Moloney murine leukemia virus (MMLV) reverse transcriptase and random primers (Promega) according to the manufacturer’s protocol.
Quantitative real-time polymerase chain reaction
cDNA was used to determine the levels of XBP1 processed and total mRNA by quantitative polymerase chain reaction (PCR), SYBR Green Master Mix (Applied Biosystems, Waltham, MA, USA), and reactions were performed in the StepOnePlus instrument (Applied Biosystems). The primers used for the quantitative polymerase chain reaction (qPCR) were as follows: Xbp1 total F – AAGAACACGCTTGGGAATGG, Xbp1 total R – ACTCCCCTTGGCCTCCAC, XBP1 spliced – F GAGTCCGCAGCAGGTG, and XBP1 spliced – R GTGTCAGAGTCCATGGGA. Relative gene expression analyses were performed using the 2−ΔΔCt method and normalized to the expression of RPL32, B-actin, two housekeeping gene products widely used for such purpose. 14 The experiments were performed in duplicate.
Statistical analysis
The data were compared by analysis of variance (ANOVA) using the Tukey post-test and parametric Student’s t-test. P values under 0.05 were considered significantly different. Statistical analyses were performed using Prism 8 software (GraphPad Software).
Results
Kinetics of virus production in ATF6-KO and ATF6-WT cells
As part of the strategies to verify the interrelationship between the UPR pathways and the replication of VACVs analyzed in this work, we compared the production kinetics of GP1V, PSTV, and WR viruses in ATF6-WT cells compared to ATF6-KO cells as a way to evaluate the influence of the transcription factor on the replicative efficiency of different viruses. Plate phenotypes, single-cycle curves, and multiple cycles were made. For the plaque phenotype (Figure 1(a) and (b)), the cells were infected with 50 PFU of GP1V, PSTV, and WR viruses for 48 h. It was observed that in ATF6-WT cells compared to ATF6-KO, an increase in the number of viral plaques of WR virus, and a less marked increase in the viral plaques of GP1V and PSTV viruses. Single-cycle and multiple-cycle curves (Figure 1(d) and (e)) were performed in ATF6-KO and ATF6-WT cells at different time intervals with different MOI, and the viral titer was determined by plate assays on BSC-40 cells. Single-cycle and multiple-cycle curves show no statistically significant differences in ATF6-WT cells compared to ATF6-KO cells. As shown, in ATF6-KO cells, the number of viral plaques of GP1V, WR, and PSTV viruses is in lower number when compared to the number of viral plaques in ATF6-WT cells. The number of viral plaques of the WR virus is greatly reduced in ATF-KO cells.
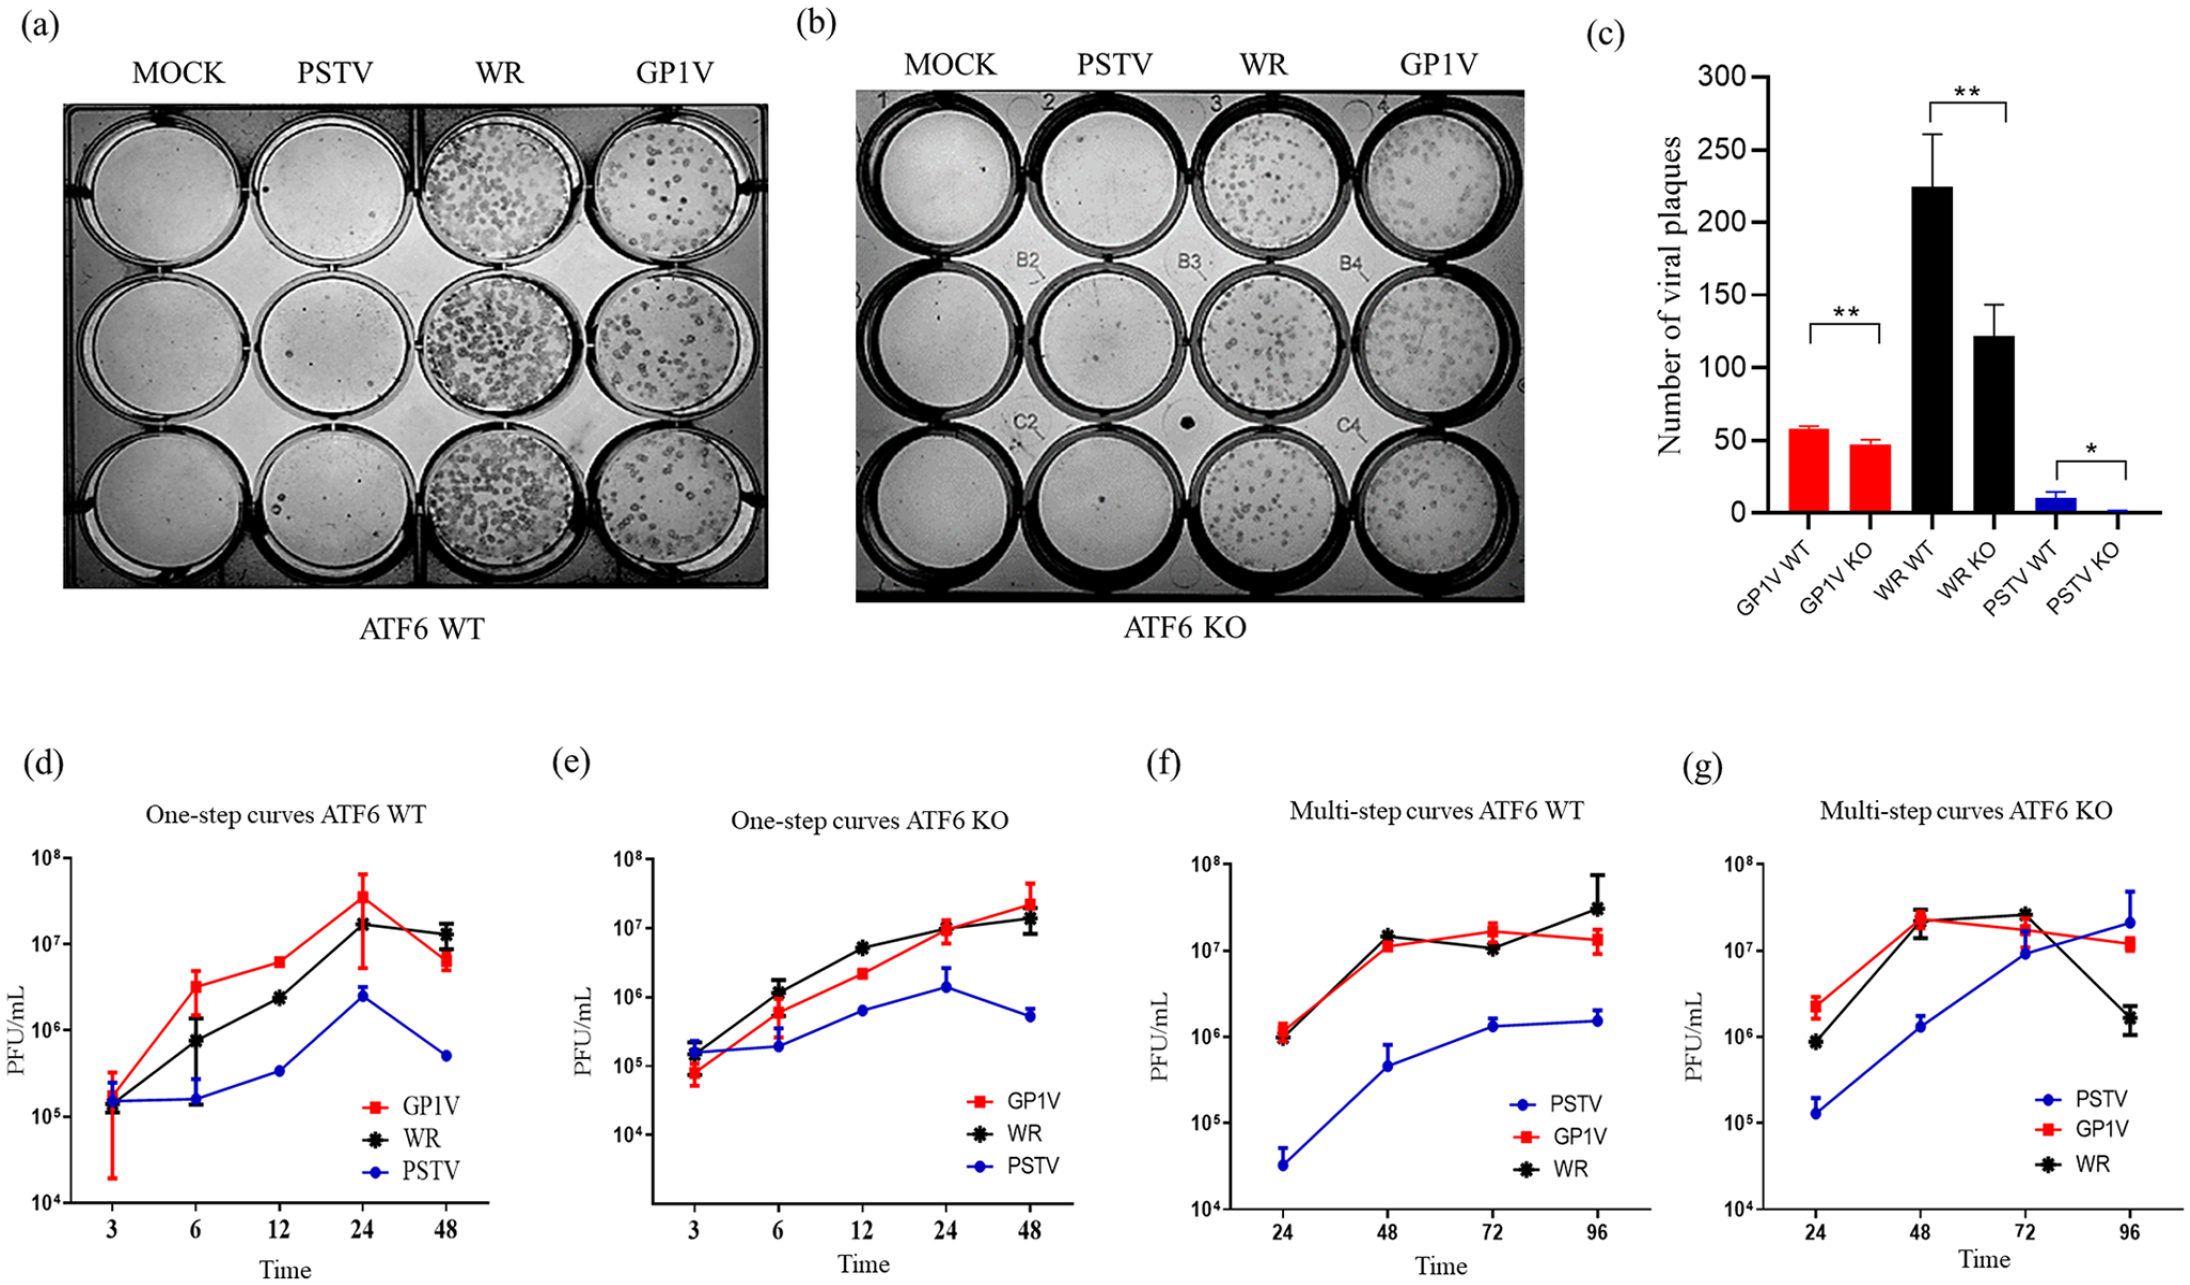
Plaque phenotype assays and multiplication curves of GP1V, PSTV, and WR viruses in MEFs ATF6-WT and ATF6-KO cells. GP1V, PSTV, and WR virus plaque phenotype assays were performed on ATF6-WT (a) and ATF6-KO (b) cells, the monolayers were infected with 50 PFU of these viruses and incubated for 48 h. The difference in the number of viral plaques in ATF6-WT and ATF6-KO cells (c). After this time, the cells were fixed in 4% formalin solution and labeled with hyperimmune serum. Multiplication curves were obtained after infection by GP1V, PSTV, and WR viruses in ATF6-WT and ATF6-KO cells. The monolayers were infected with MOI of 10 and collected at 3, 6, 12, 24, and 48 h to obtain one-step curves (d and e). For the multistep curves (f and g), the monolayers were infected with MOI of 0.01 and collected at 24, 48, 72, and 96 h. Statistical analyses were performed using the ordinary one-way ANOVA Tukey’s multiple comparisons test: *P < 0.05; **P < 0.01; ***P < 0.001; ****P < 0.0001. The bars represent data range from two experiments.
Transcriptional activity and quantification of nuclear translocation of ATF6-GFP in A31 cells infected with GP1V, PSTV, and WR viruses
We analyzed the transcriptional activity of ATF6 in A31 cells infected by the viruses (Figure 2(a)). Cells were transfected with plasmid p5xATF6-GL3; this plasmid has five sites for the ATF6 transcription factor controlling the luciferase gene. Cells were also co-transfected with the pRL-TK plasmid used as normalizer to determine luciferase activity. After transfection, cell monolayers were infected with the different VACV strains with MOI of 10 and incubated for 24 h. Untreated control (MOCK) and ER stress control, tunicamycin (glycosylation inhibitor, UPR pathway activator) were used. We noticed that cells infected with the virulent strains, GP1V and WR, induced increased ATF6 directed expression of luciferase, much more than the tunicamycin positive control, whereas, the PSTV virus induction of ATF6-driven transcription was merely comparable to the positive control. This experiment was performed in duplicate. The translocation of ATF6 to infected or non-infected cell nuclei was also assessed by flow cytometry (Figure 2(b)). A31 cells were transfected with plasmid pCMVshort-ATF6-GFP and infected with GP1V, PSTV, and WR viruses with MOI of 10 and incubated for 24 h, after which time their nuclei were isolated for quantitation. The results indicated that the translocation of ATF6 to the nuclei in cells infected with GP1V, PSTV, and WR viruses as well as increased transcriptional activity of ATF6 in cells infected with different variants when compared to the positive tunicamycin control.
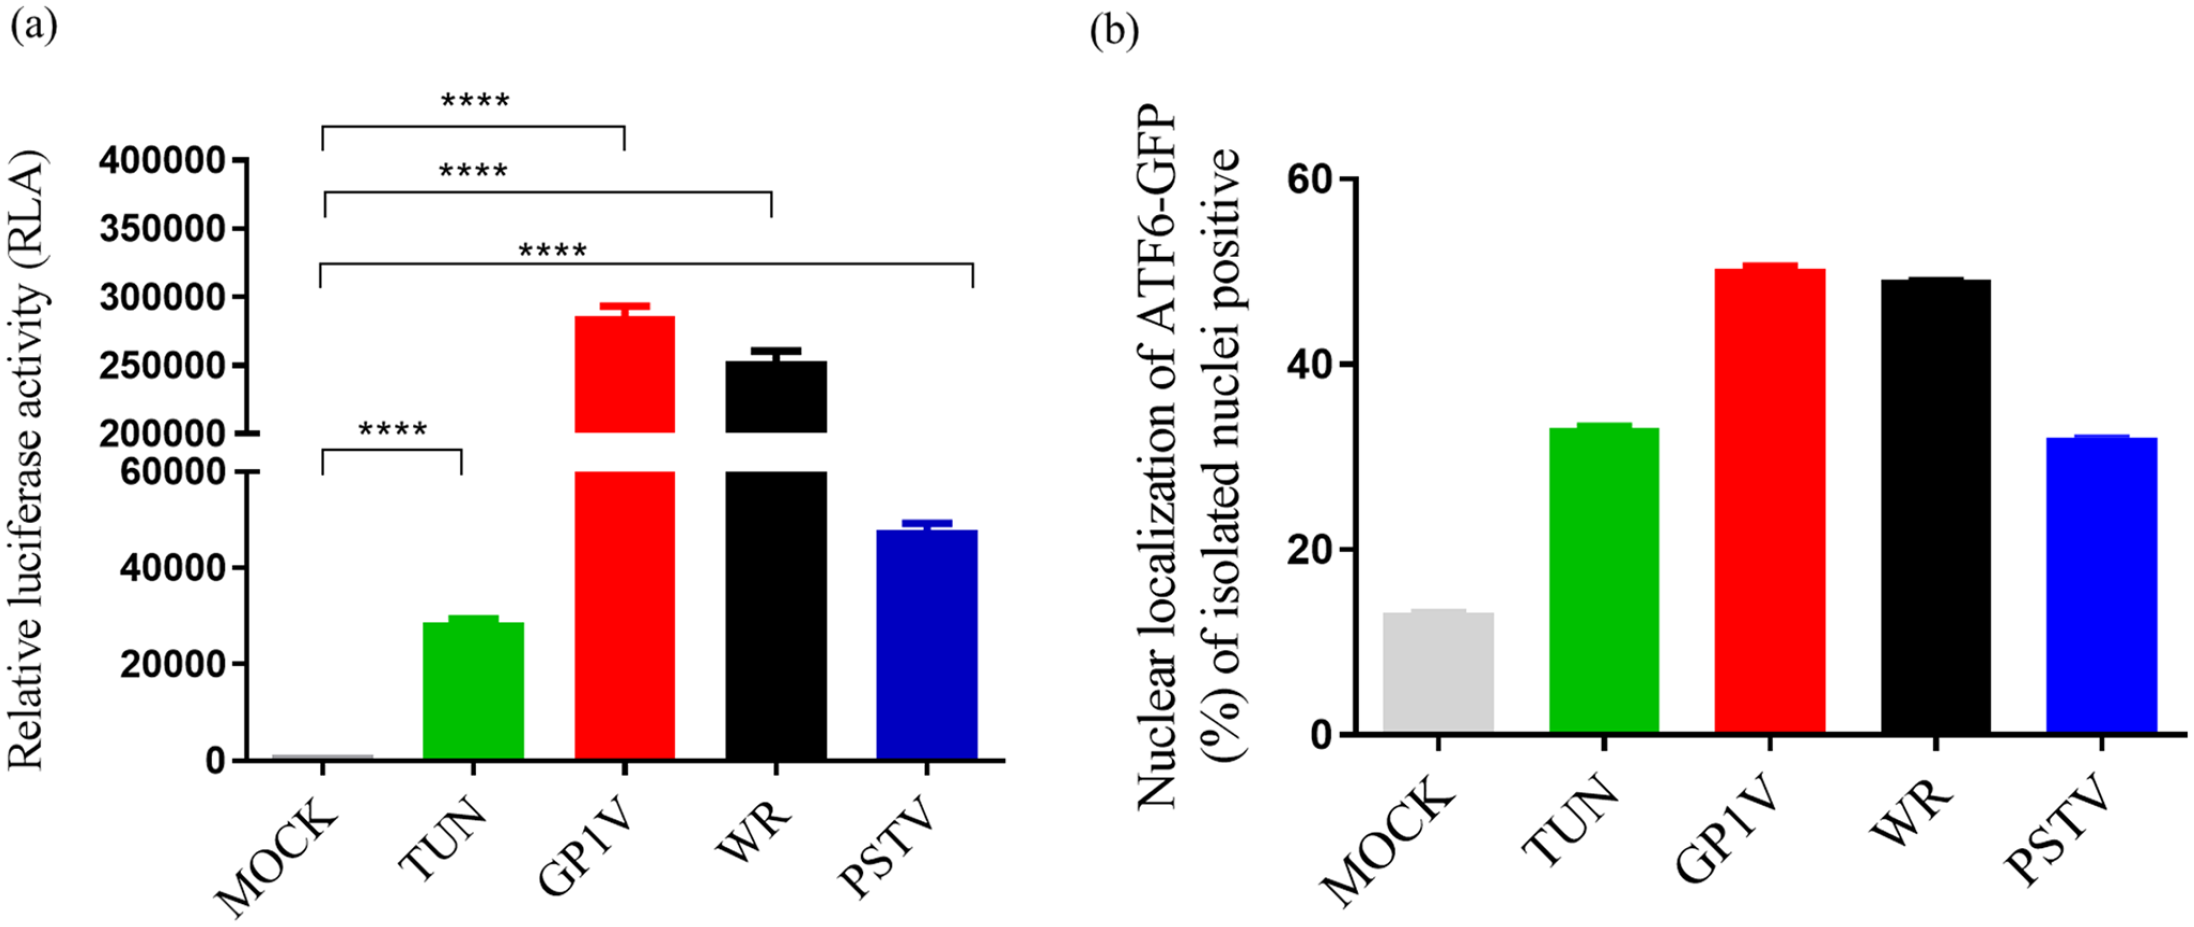
Transcriptional activity and quantification of nuclear translocation of ATF6-GFP in A31 cells infected with GP1V, PSTV, and WR viruses. (a) Analysis of transcriptional activity following infection by GP1V, PSTV, and WR viruses. A31 cells were transfected and infected with MOI of 10 GP1V, PSTV, and WR viruses for 24 h. Cell extract was obtained with the Passive Lysis Buffer from the Dual-Luciferase Kit (Promega) and luciferase activity readings were taken as per the manufacturer’s instructions. Relative luciferase activity was calculated by the ratio between firefly luciferase readings (p5xATF6-GL3) and Renilla luciferase (pLR-TK). (b) Quantification of ATF6 positive or non-positive nuclei was performed on A31 cells transfected with plasmid pCMVshort-ATF6-GFP, infected by GP1V, PSTV, and WR viruses for 24 h. ATF6-GFP positive nuclei were counted by flow cytometry (BD FACSCalibur™). Statistical analyses were performed using the ordinary one-way ANOVA Tukey’s multiple comparisons test: *P < 0.05; **P < 0.01; ***P < 0.001; ****P < 0.0001. The bars represent data range from two experiments.
Determination of XBP1 total expression and processed levels after infection by GP1V, PSTV, and WR viruses
To compare gene mRNA levels induced by UPR pathway activation, A31 cells were infected with GP1V, PSTV, and WR viruses with MOI of 10 for 24 h. Total RNA from infected and uninfected cells were analyzed by real-time qPCR to determine the expression levels of Xbp1 and its processing (Figure 3(a) and (b)). Once again, we used cells treated with tunicamycin as positive stress control. Processed XBP1 levels (1) did not increase in cells infected with GP1V, PSTV, and WR viruses compared to positive control, demonstrating that VACV infection does not induce XBP1 mRNA splicing. Total XBP1 (2) expression levels in cells infected with the three viruses do not show significant differences in relation to cell controls and positive control.
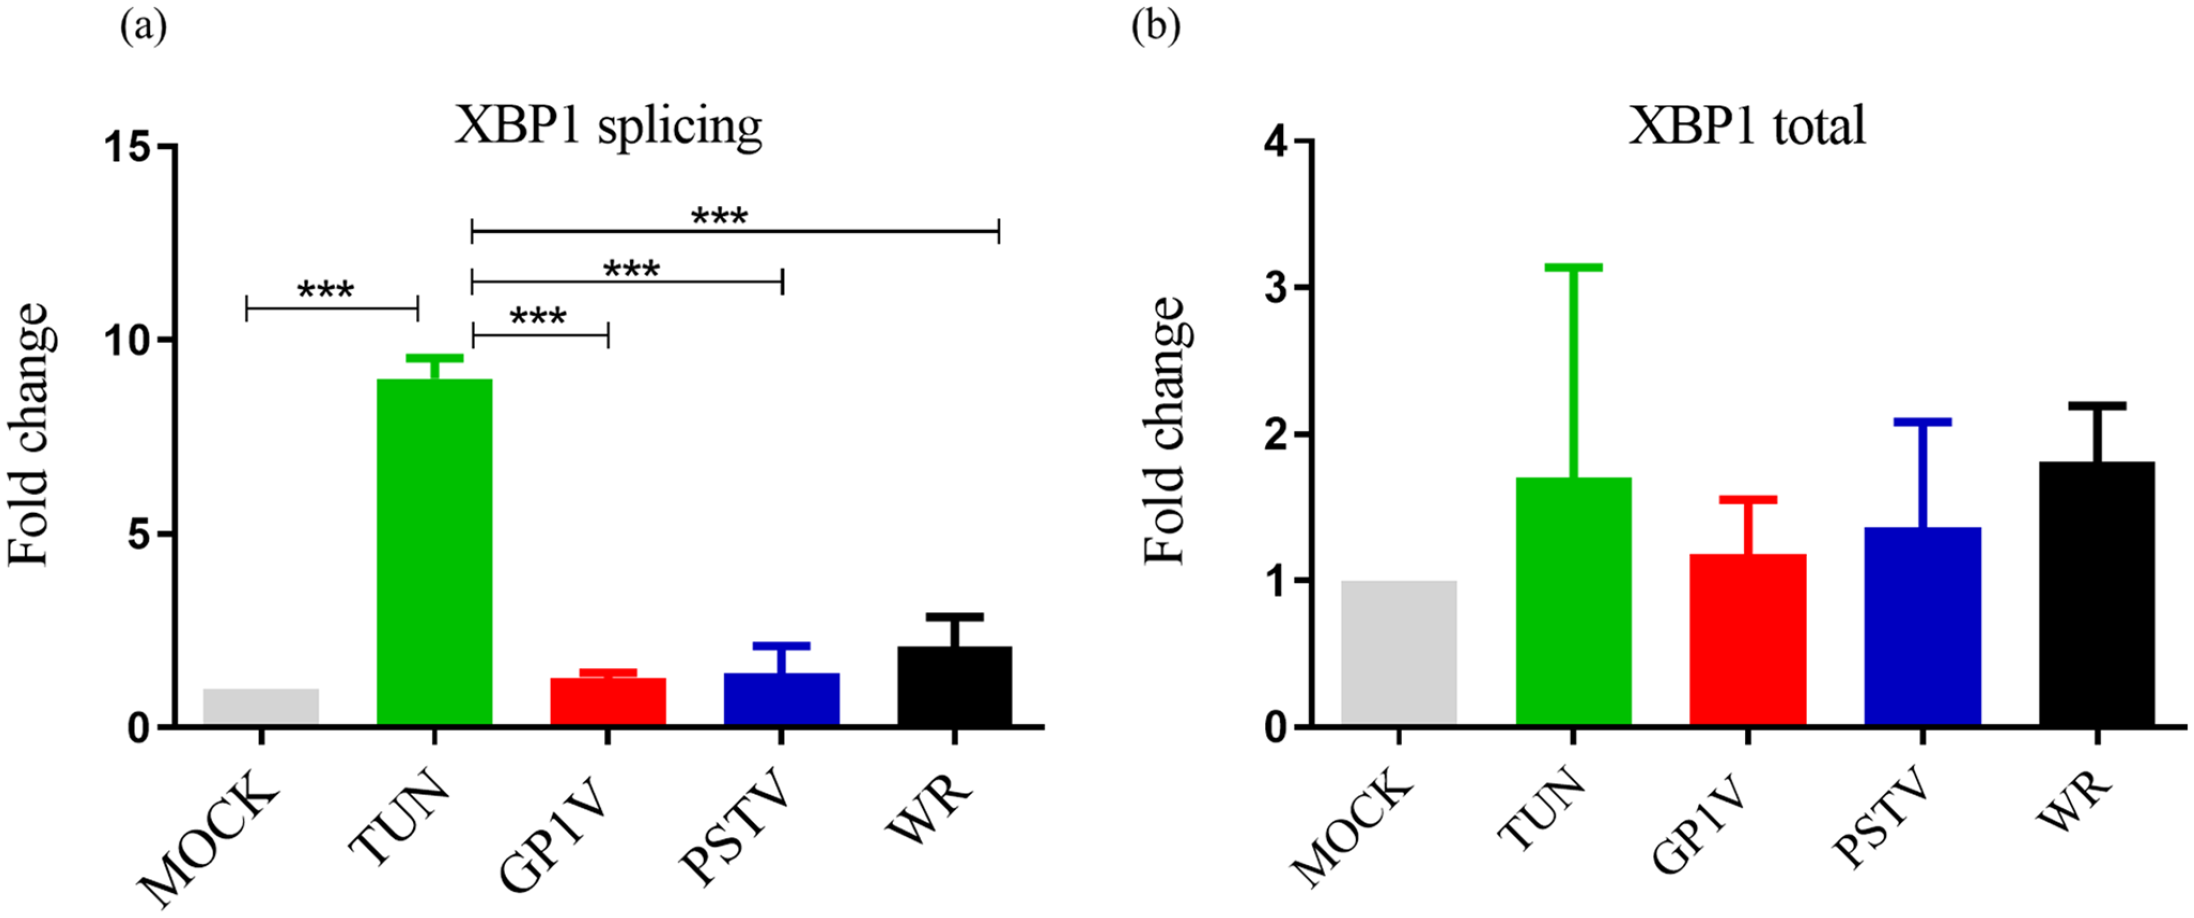
Graphical representation of UPR gene expression in virus-infected MEFs A31 GP1V, PSTV, and WR assessed by quantitative PCR assays (qPCR). QRT-PCR assay performed on a total extract of uninfected (mock) or GP1V, PSTV and WR virus A31 cells for 24 h. The assays were performed in biological duplicate, with MOI of 10 and stress control, tunicamycin. With primers specific for Xbp1 splicing (a) and total Xbp1 (b). Relative gene expression analyses were performed using the 2−ΔΔCt method and normalized to the expression of RPL32, B-actin. Statistical analyses were performed using the ordinary one-way ANOVA Tukey’s multiple comparisons test: *P < 0.05; **P < 0.01; ***P < 0.001; ****P < 0.0001. The bars represent data range from two experiments.
Plaque phenotype in the presence of IRE1 kinase and RNase domain inhibitors
Since XBP1 processing was not observed after virus infection, we investigated whether treatment with kinase and RNase domain inhibitors of IRE1, responsible for XBP1 processing, had an impact on virus productivity. BSC40 cells were treated with inhibitors for the RNase domain (4µ8C) (Figure 4(a) and (b)) and kinase domain (Kira6) (Figure 4(c) and (d)) and infected with 50 PFU of GP1V, PSTV, and WR viruses for 48 h. DMSO was used as the untreated control. The obtained result shows the reduction of GP1V, PSTV, and WR virus viral plaque in cells treated with kinase domain inhibitor (Kira6); however, infected cells treated with RNase domain (4µ8C) did not show any reduction of viral plaque when compared to untreated control.
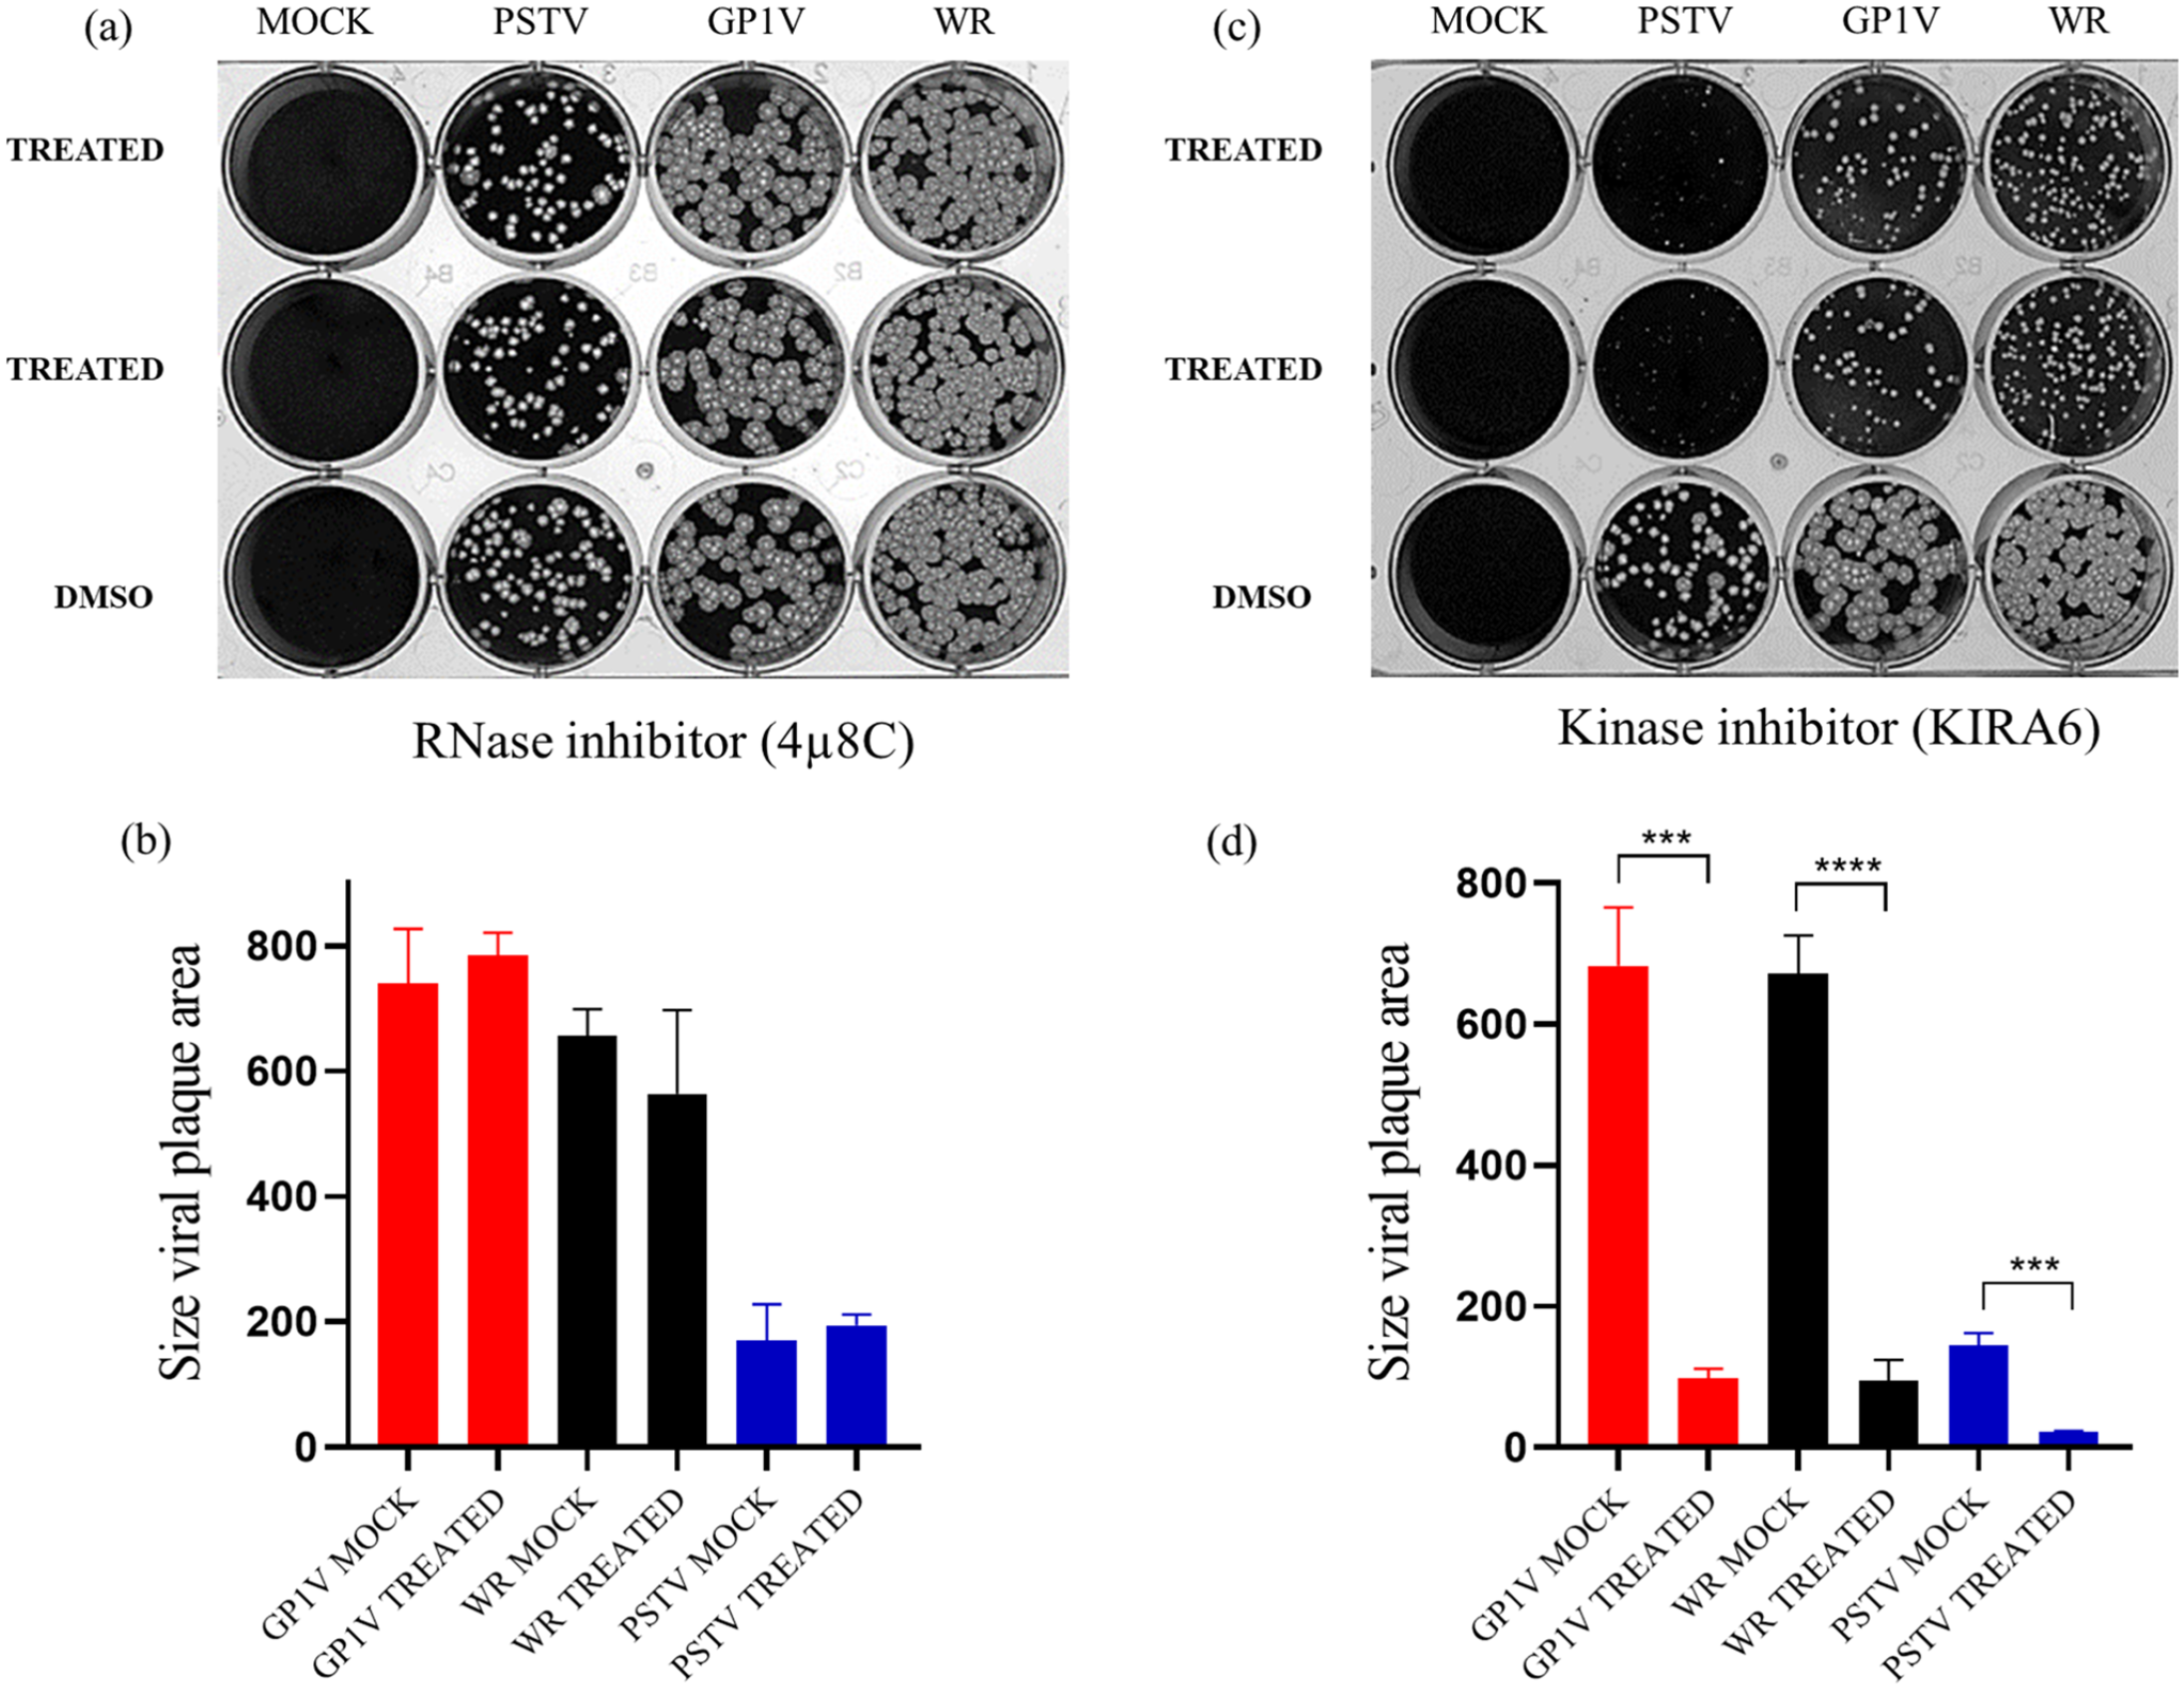
Plaque phenotype in the presence of kinase and RNase domain inhibitors. Plaque phenotype tests in the presence of RNase domain inhibitor (4µ8C) at 25 μm (a) and kinase (KIRA6) at 5 μm (c). BSC40 cells were treated with inhibitors and infected with 50 PFU of GP1V, PSTV, and WR viruses for 48 h. After this period, the cells were fixed in 4% formalin solution and stained with 1% violet crystal. The difference in the size of the virus plaque area (b and d) was measured using the ImageJ program (NIH). Statistical analyses were performed using the ordinary one-way ANOVA Tukey’s multiple comparisons test: *P < 0.05; **P < 0.01; ***P < 0.001; ****P < 0.0001.
Infectivity assays and productivity aspects in MEF-WT and PERK-KO cells
To evaluate viral productivity in the absence of the PERK axis of the UPR pathway, infectivity assays were performed on cells deficient for PERK compared to MEF-WT cells. Thus, MEF-WT and PERK-KO cells were infected with GP1V, PSTV, and WR with MOI of 10 and WR with MOI of 10 in the one-step curves and MOI 0.01 in the multistep curves. Cell extracts were collected at intervals of 3, 6, 12, 24, and 48 h (one-step curves) and 24, 48, 72, and 96 h (multistep curves) (Figure 5(c) to (e)). Viral titers were determined in BSC40 cells. To observe the viral plaque phenotype in MEF-WT cells compared to PERK-KO cells, we infected the cell monolayers with 50 PFU of GP1V, PSTV, and WR viruses for 48 h (Figure 5(a) and (b)). After this interval, the cells were fixed and stained. As a result, we observed GP1V, PSTV, and WR virus viral plaque reduction in MEF-WT cells when compared to PERK-KO; however, it was not possible to see any differences in virus productivity in one-step curves performed in MEF-WT cells compared to PERK-KO cells. However, in the multiple-step curves, it is possible to observe a reduction in the titers of GP1V and WR in MEF-WT cells at time 24 and 48 h compared to PERK-KO; for PSTV, this reduction was observed in the time of 96 h.
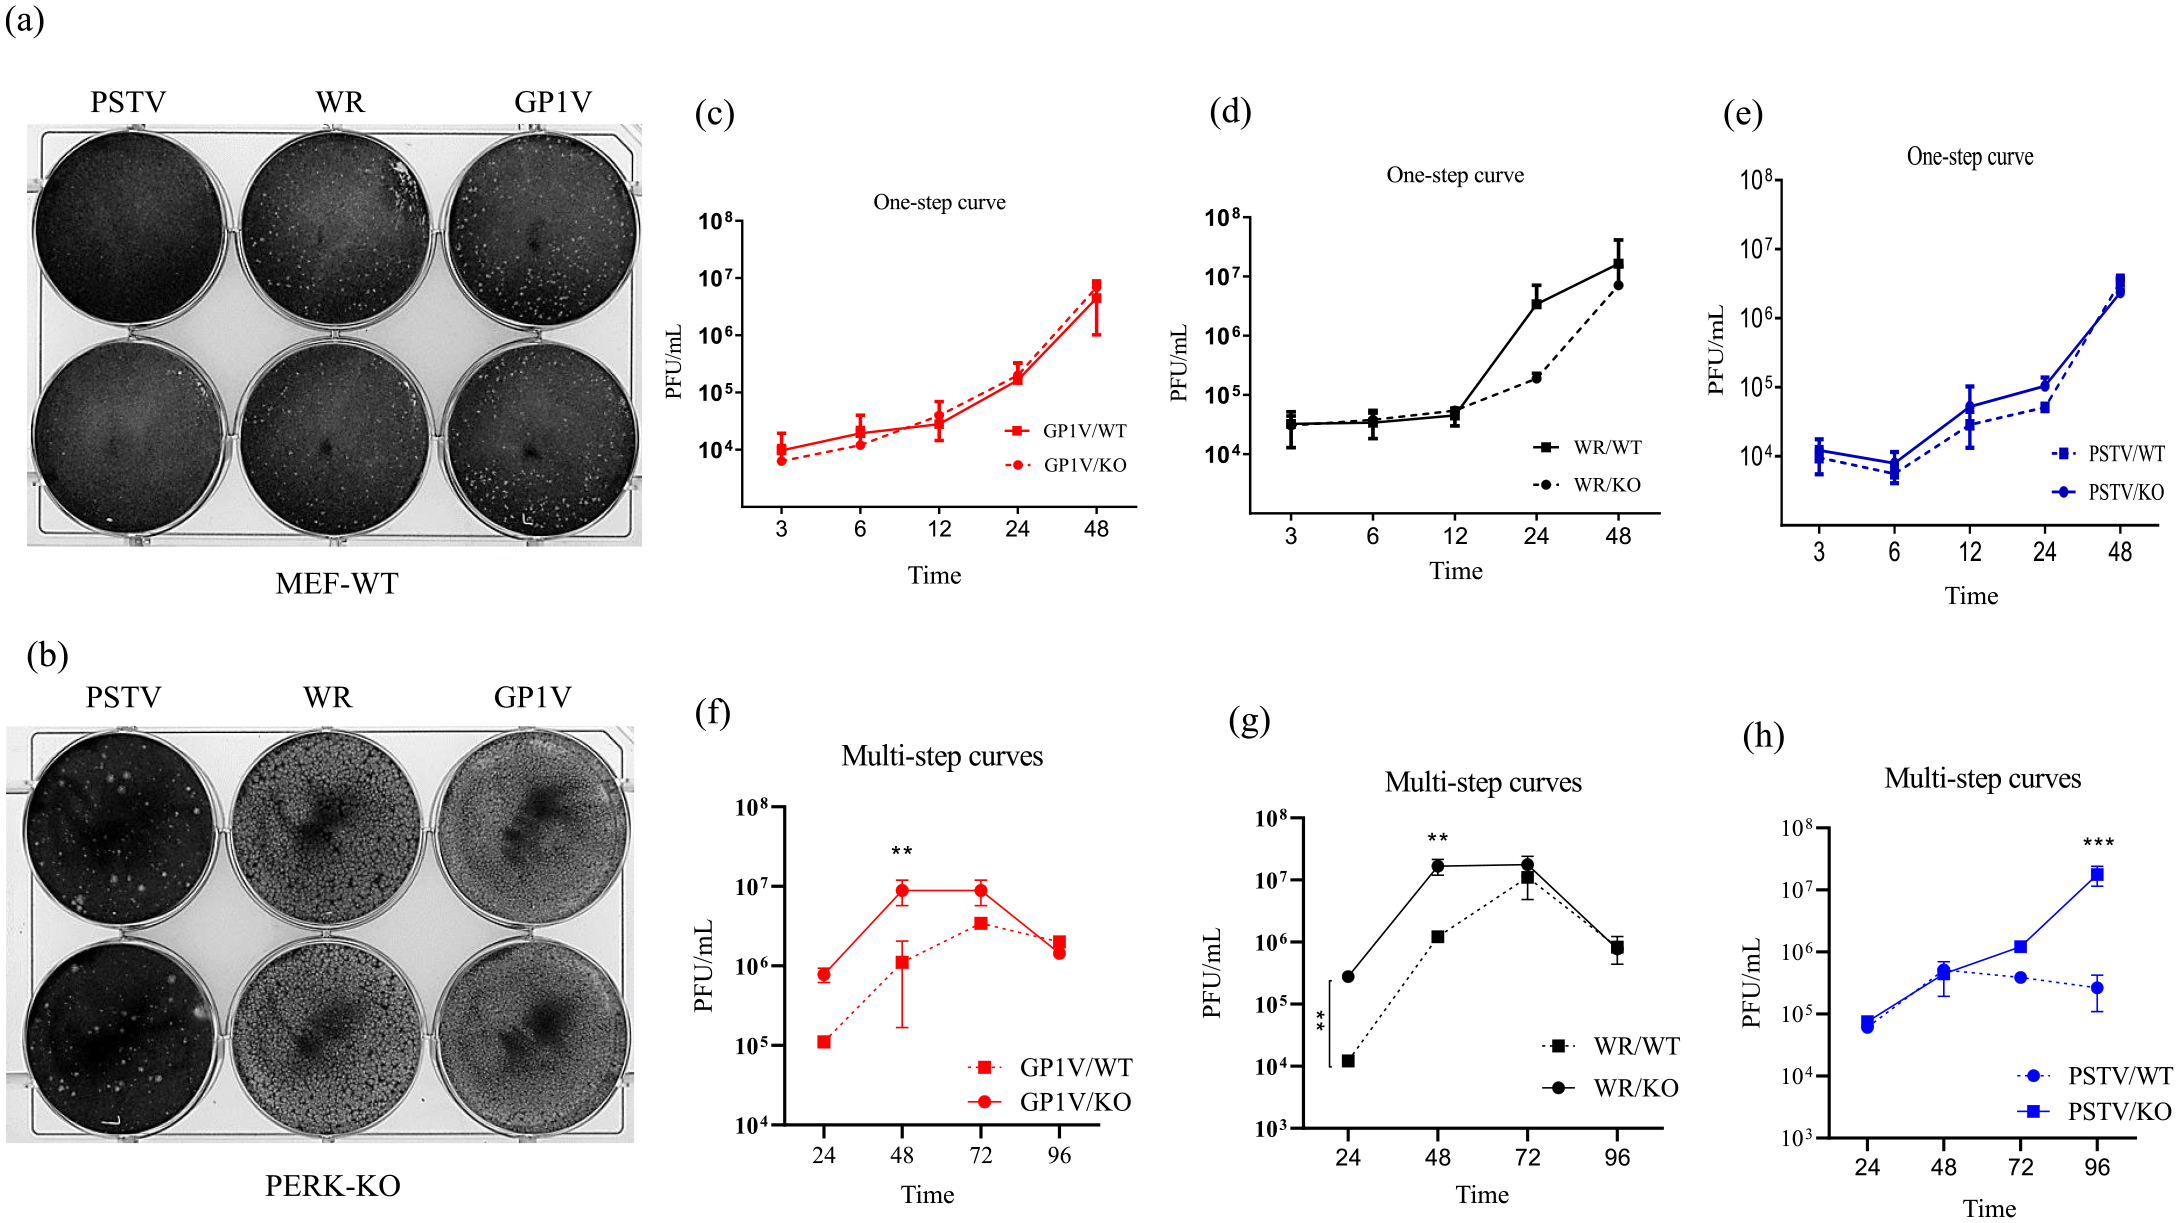
Infectivity and plaque phenotype assays in MEF-WT and PERK-KO cells: (a, b) MEF-WT and PERK-KO cells were infected with GP1V, PSTV, and WR viruses at MOI of 10 to obtain one-step curves, and MOI 0.01 in the multistep curves. Cell extracts were collected at intervals of 3, 6, 12, 24, and 48 h (one-step curves) and 24, 48, 72, and 96 h (multistep curves) (c to h). Plaque phenotype assays were performed on MEF-WT and PERK-KO cells infected with 50 PFU of GP1V, PSTV, and WR viruses incubated for 48 h. After this period, the cells were fixed in 4% formalin solution and stained with 1% violet crystal. Statistical analyses were performed using the ordinary one-way ANOVA Tukey’s multiple comparisons test: *P < 0.05; **P < 0.01; ***P < 0.001; ****P < 0.000. The bars represent data range from two experiments.
Virus growth and plaque assays in the presence of the BiP inhibitor (HA15)
To assess whether inhibition of chaperone BiP/GRP78 would impact VACV strains productivity, one-step growth curves were obtained from infected cells with and without the presence of BiP inhibitor HA15 (Figure 6(b) to (d)). BSC40 cells were treated or not with HA15 inhibitor and infected with GP1V, PSTV, and WR virus with MOI of 10 in the one-step curves and MOI 0.01 in the multistep curves. Cell extracts were collected at intervals of 3, 6, 12, 24, and 48 h (one-step curves) and 24, 48, 72, and 96 h (multistep curves). Plaque phenotype assays were performed to evaluate the profile of the viral plaque in the presence of the inhibitor HA15 (Figure 6(a)). We observed a reduction in GP1V, PSTV, and WR virus viral plaque in the presence of HA15 inhibitor; however, this profile was not observed in the one-step curve in the presence of HA15 inhibitor, showing no statistical differences. In the curves of multiple cycles in the PERK-KO cells, it is possible to observe a statistically significant reduction in the viral titers of GP1V and WR at times 48 and 72 h, and for PSTV, at times of 24, 72, and 96 h.
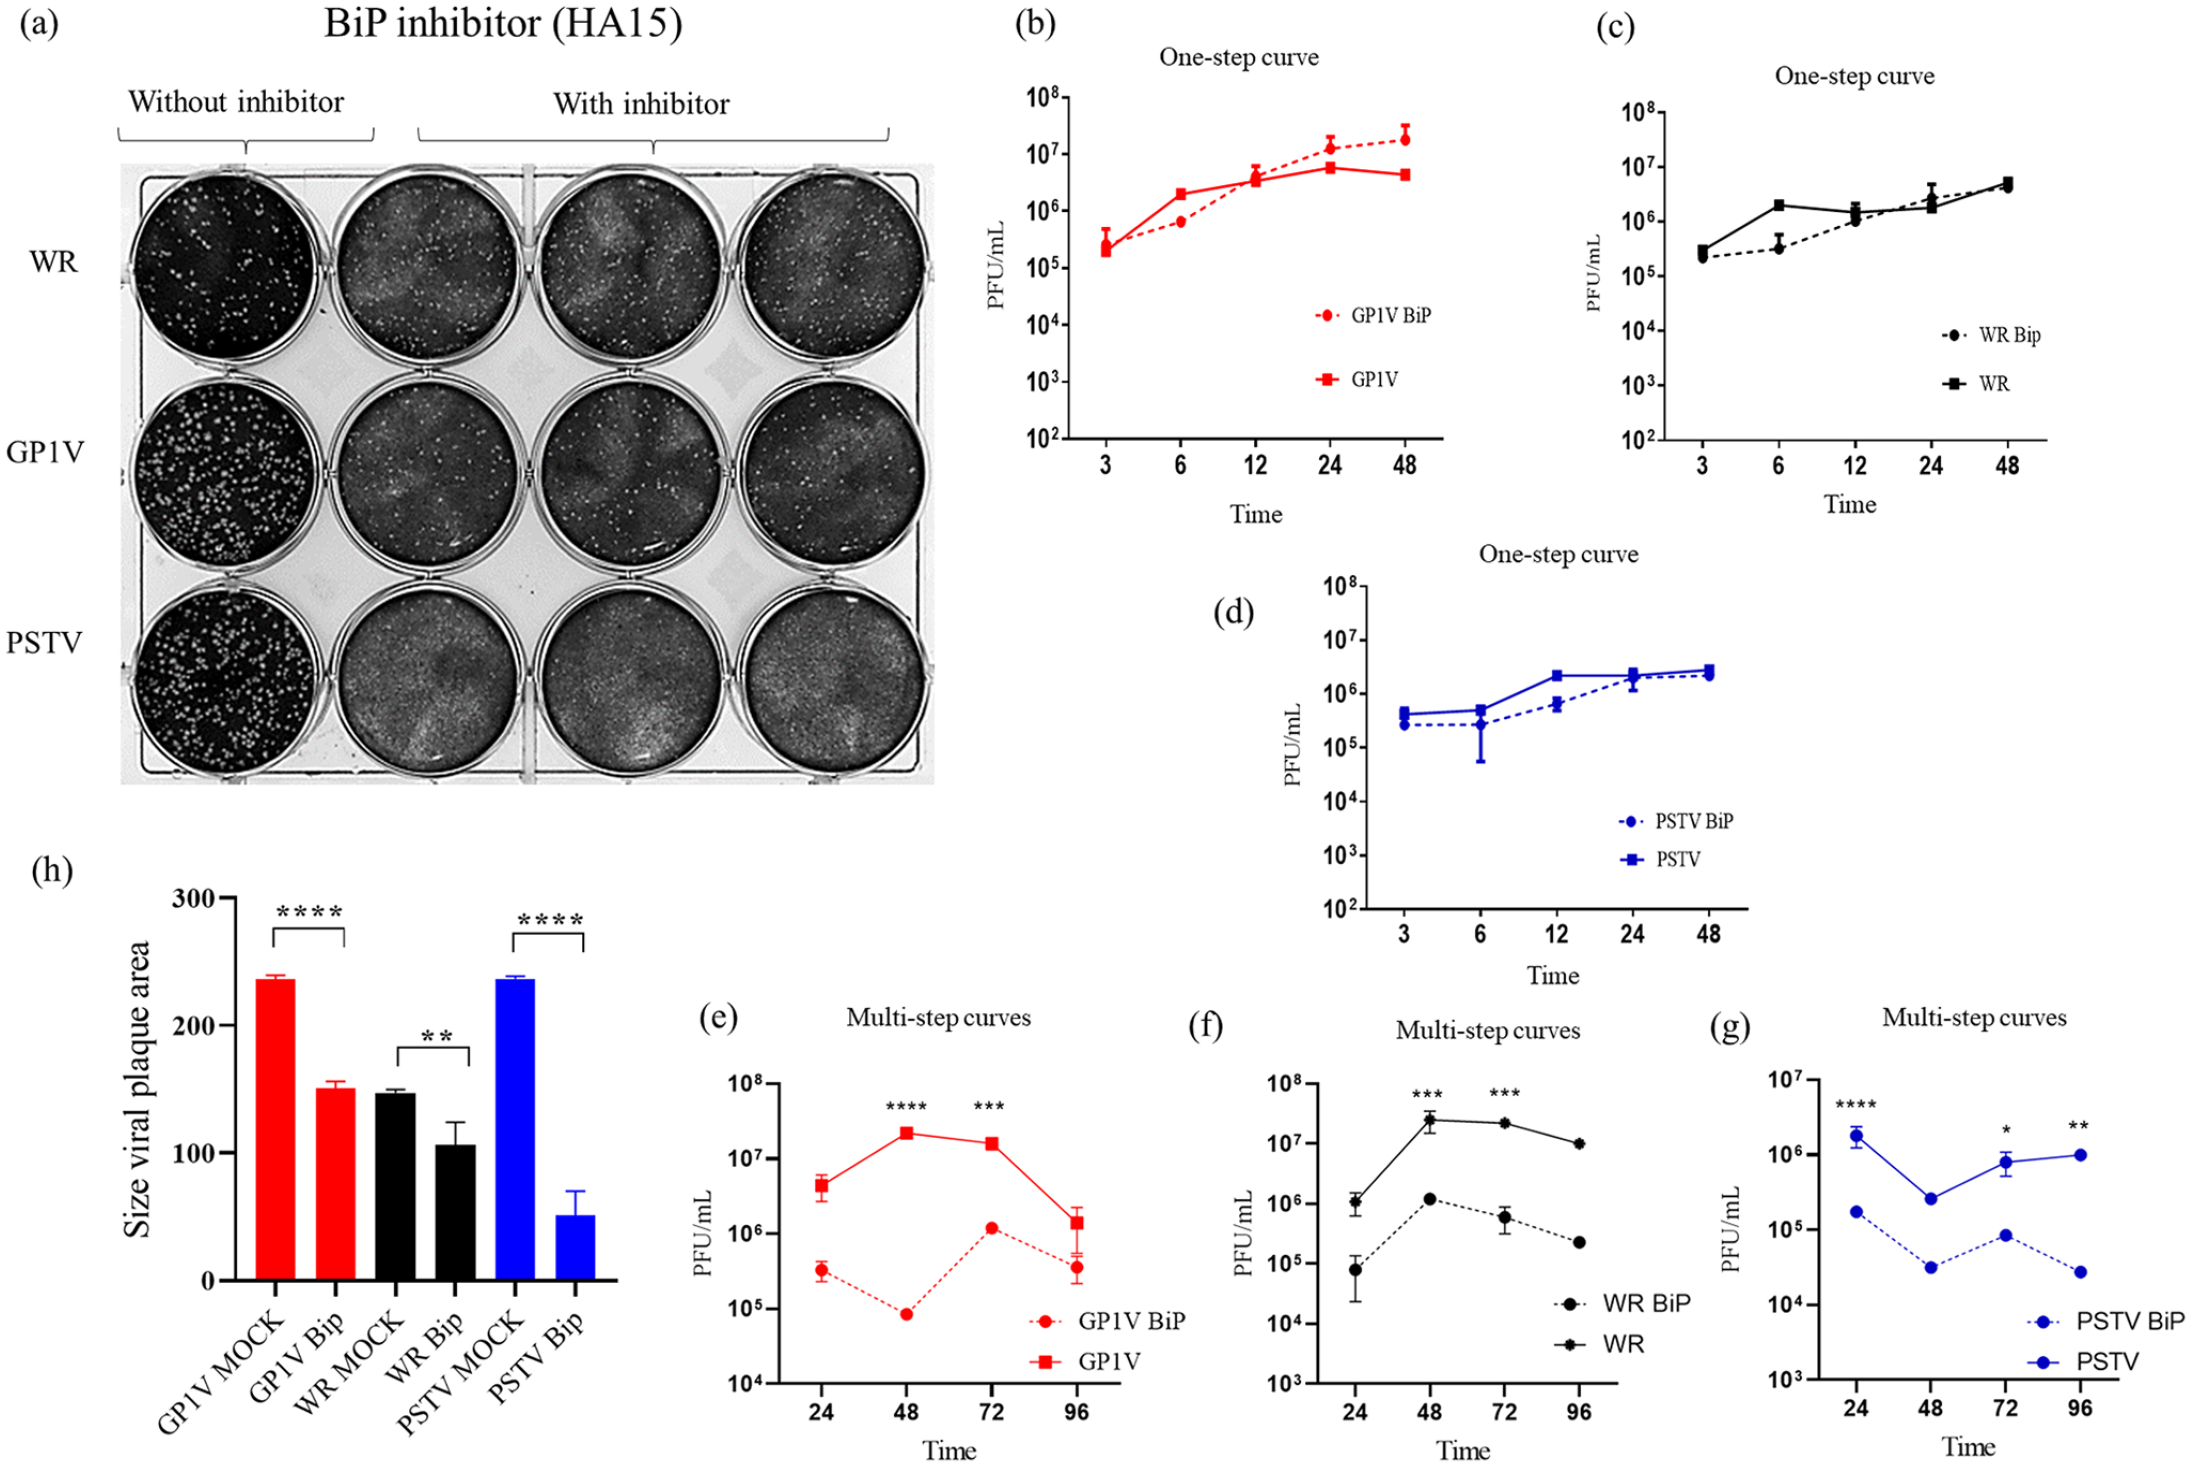
One-step curve and plaque assays in the presence of BiP inhibitor (HA15): (a) GP1V, PSTV, and WR virus plaque phenotype assays were performed on BSC40 cells, whether or not treated with the HA15 inhibitor. The cells were infected with 50 PFU of the viruses and incubated for 48 h, after which the cells were fixed in 4% formalin solution and stained with 1% violet crystal. One-step curves and multistep curves (b to g) were performed on BSC40 cells treated or not with the HA15 inhibitor and subsequently infected with GP1V, PSTV, and WR with MOI of 10, and MOI 0.01 in the multistep curves. Cell extracts were collected at intervals of 3, 6, 12, 24, and 48 h (one-step curves) and 24, 48, 72, and 96 h (multistep curves). These experiments were performed in duplicate. The difference in the size of the virus plaque area (h) was measured using the ImageJ program (NIH). Statistical analyses were performed using the ordinary one-way ANOVA Tukey’s multiple comparisons test: *P < 0.05; **P < 0.01; ***P < 0.001; ****P < 0.0001. The bars represent data range from two experiments.
Discussion
The multiplication of poxviruses takes place in close association to the ER. Viral factories produced during poxvirus replication are surrounded by ER membranes, and this conformation is necessary for efficient viral DNA replication and viral assembly.6–15 Poxvirus replicative success is dependent on its ability to block, evade, or subvert essential elements of the immune response and cellular.16–18 The zoonotic VACV strains evaluated in this work, belonging to different phylogenetic groups, manipulate the sensors of the UPR pathway in a more or less intense way; however, from a qualitative point of view, the involvement of the UPR pathways during a VACV productive infection is not strain-dependent. Different host interaction profiles have already been observed before when evaluating clinical and immunological data in mice infected with the GP1V, PSTV, and WR viruses. 19
The ATF6 transcription factor is often activated during viral infections, and this mechanism may favor viral replication. Several studies have shown that ATF6 activation is beneficial for viral yield, leading to the expression of XBP1 mRNA, an important action that may lead to the activation of chaperones or to act by preventing PERK activation and thus global protein attenuation; however, ATF6 is able to increase the expression of total XBP1, but not its processed form. If the kinase domain of IRE1 is not active, the processing of XBP1 does not occur and therefore has no induction of the target genes.20–22 By looking at one-step growth and multistep growth curves, it was not possible to observe significant differences in the productivity of GP1V, PSTV, and WR viruses in ATF6-WT cells compared to ATF6-KO cells. However, in the VACV plaque phenotype assays, it is possible to observe smaller viral plaque in ATF6-KO cells compared to viral plaque formed in the ATF6-WT cell monolayers. A possible explanation for the more noticeable differences observed in the plaque phenotypes compared to the one-step multiplication curve lies in the importance and abundance of different infective forms of the VACV virus. In the multiplication curves, it is not possible to distinguish different forms of VACV particles, and because intracellular mature virus (IMV) forms are the most abundant, no differences in virus productivity are seen. However, cell-associated enveloped virus (CEV) and extracellular enveloped virus (EEV) forms are the main responsible for cell-to-cell virus spread and, consequently, for plaque formation. Nonetheless, these are less abundant forms generated upon VACV multiplication and do not impact overall virus productivity as evaluated in one-step curves.21–23 Analysis of the transcriptional activity of ATF6, compared to the positive control tunicamycin, showed activation of ATF6 by all VACV. GP1V infection triggered higher transcriptional activity than the positive control, whereas PSTV infection presented an ATF6 transcriptional activity that was similar to the positive control (tunicamycin stimulated cells). Infections by the prototypical WR virus presented a profile similar to GP1V. Quantification of ATF6-GFP positive nuclei as an indication of ATF6 activation and translocation showed results that were compatible to the ones seen upon ATF6 transcriptional activity experiments. Our results are corroborated by another study of our research group in which we evaluated the activation of ER stress pathways during infection by two different laboratory VACV strains: WR virus (a replicative strain) and MVA (a non-replicative strain). 24 The nuclear translocation of ATF6 was detected after infection by MVA and WR viruses; however, because they are viral samples with different profiles, the activation of ATF6 also occurs differently in relation to the maximum levels of activation and kinetics. That may suggest that the activation of ATF6 in the early and intermediate stages may be related to genes encoded by the WR virus that are absent in the genome of the MVA virus. Nonetheless, these are laboratory strains that do not circulate in nature. Therefore, to determine how circulating strains, such as PSTV and GP1V have evolved in relation to the UPR is important to understand how these pathways have shaped poxvirus evolution in the wild, with important correlations to be made in the case of emergent diseases such as monkeypox outbreak (Mpox). Activation of ATF6 was observed in Hepatitis C virus (HCV) infection and such activation promoted virus survival in hepatocytes. Acute African Swine Fever Virus (ASFV) infections leads to activation of this branch, which seems important to help the virus correctly fold its proteins.20,25,26 Likewise, it was suggested that the 8ab protein of the SARS-CoV virus activates ATF6 to facilitate the folding of viral proteins, and the inhibition of ATF6 reduced the titer of the SARS-CoV 2 virus by up to 1000 times.27,28 Some studies even suggest the use of pharmacological chaperones as a therapeutic strategy for COVID-19, in order to block the activation of the arms of the UPR pathway.29,30
Inositol-dependent kinase protein is the most studied UPR pathway axis, and several viruses can modulate it in different ways. IRE1 has a kinase domain and also an endonuclease domain which is able to splice out 26 nucleotides from the XBP1 RNA transcript. XBP1 mRNA processing has been observed during West Nile virus and cytomegalovirus infections, and it was reported that this activation would be advantageous for viral infection by stimulating chaperones that can give viral proteins the correct conformation.21,25,31 On the contrary, many viruses such as HCV, herpes simplex virus type 1 (HSV-1), human rhinovirus (HRV), and ASFV down modulate XBP1 processing to block protein degradation by endoplasmic reticulum–associated degradation (ERAD) and ER-degradation enhancing-a-mannosidase-like protein 1.20,22,32,33 Our results suggest that levels of processed XBP1 in VACV infected cells are not different from non-infected control cells. This the opposite of cells treated with the tunicamycin stress inducer, and treated cells showed a marked increase in XBP1 processing when compared to untreated cells or cells infected with GP1V, PSTV, and WR viruses. The expression levels total XBP1 in cells infected with different variants, on the contrary, were similar to the expression of XBP1 in tunicamycin-treated positive controls. These results suggest that these viruses are able to down modulate XBP1 processing. Negative regulation of XBP1 processing was also observed after infection by MVA and WR samples. Infection by both viruses is even able to neutralize the splicing of tunicamycin-induced XBP1. 24 XBP1 processing plays a role in immunity mechanisms, being important for macrophage cytokine production.7,34 Also, VACVs interfere with the signaling of TLRs which in turn can activate XBP1. XBP1 processing is related to immunological processes such as cytokine production by macrophages; data from our research group showed that VACVs negatively modulate the activation of these cells. 19 To determine the effect of IRE1 RNase and kinase activity, we used 4µ8C and KIRA6 inhibitors on A31 cells infected with GP1V, PSTV, and WR viruses. Both IRE1 domains are handled differently during HSV-1 virus infection, for instance. This herpes virus is able to inactivate the RNase domain and activate kinase to increase viral replication and avoid deleterious consequences of XBP1 activation. 32 In our study, treatment with the drug 4µ8C showed no difference in the size area of GP1V, PSTV, and WR virus plate when compared to untreated control. Surprisingly it was observed that treatment with the kinase domain inhibitor drug KIRA6 reduced the size of the area of the viral plaque when compared to untreated cells. Such results have suggested the importance of the kinase domain for the VACV-Br replication and the irrelevance of the IRE1 protein RNase domain for virus growth. When activated PERK oligomerizes and is activated via transautophosphorylation, it can recognize and activate eIF2α. EIF2α phosphorylation, consequently, leads to overall protein synthesis attenuation, which may be disadvantageous for virus replication. In the case of transmissible gastroenteritis virus (TGEV), for example, PERK activation negatively regulates replication by inhibiting IκBα over NF-κB. As for West Nile Virus Kunjin Strain virus, the infection inhibits PERK signaling through activation of ATF6/IRE1, thus preventing global attenuation of proteins production.35,36 The one-step curves performed on MEF-WT and PERK-KO cells did not show significant differences in viral production in MEF-WT cells when infection by the three VACV strains PERK-KO cells. However, in the curves of multiple cycles, it was possible to observe reduction in viral titers of GP1V and WR in the time of 24 and 48 h and PSTV in the time of 96 h. The plaque phenotype demonstrated, differently from the one-step curve, that in PERK-KO cells, the yield of GP1V, PSTV, and WR extracellular particles is higher than in MEF-WT cells, suggesting the importance of PERK in down-modulating the production of CEV and EEV forms, important in cell-to-cell viral propagation. VACVs encode two genes coding for antiviral response regulators that confer viral resistance to interferon, K3L, and E3L. The K3L gene product is a homolog of EIF2α, a substrate for double-stranded RNA-dependent protein kinase, PKR, and can act as a competitive inhibitor of EIF2α. The E3L gene product acts sequestering double-stranded RNA and preventing PKR activation. It has been suggested that VACV also inhibits PERK activation via these proteins. 37
Chaperone BiP plays an important role in monitoring the UPR path by turning off or on the IRE1, ATF6, and PERK sensors. Also, BiP can prevent cell death by interfering with CHOP expression. 38 We verified the influence of BiP on the productivity of GP1V, PSTV, and WR viruses by infectivity assays in the presence of BiP inhibitor (HA15). One-step curves in the presence of the HA15 inhibitor showed that the multiplication of these viruses appears unaffected by the lack of BiP. However, in the multiple-step curves, we observed a reduction of viral titers of GP1V and WR in times 48 and 72 h and in times 24, 72, and 96 h for the virus PSTV. Given this result, we decided to observe the phenotype of VACV viral plaque in the presence of HA15. Interestingly, the plaque phenotype showed a reduction in size viral plaque for all three viruses when cells were treated with HA15 inhibitors, suggesting the importance of BiP for infection, particularly in the production of extracellular infective forms of the viruses.
In summary, we have shown that the ATF6 sensor appears to be important for VACV replication. The kinase domain of the XBP1 sensor plays an important role in the productivity of GP1V, PSTV, and WR, in contrast to the RNase domain, showed no relevance for infectivity or infectious yield. The absence of PERK benefits infection with increased production of the CEV and EEV forms of the VACV. Our results show that modulation of the UPR is a conserved aspect of feral VACV strains causing zoonotic diseases in humans and animals.
Footnotes
Acknowledgements
The authors thank Professor Edel F. B. Stancioli, Jordana G. Coelho-dos-Reis, and Aristóbolo Mendes da Silva for their expertise and help. The authors also thank Dr Erna Kroon for providing the zoonotic VACVs virus’s samples. The authors also thank members of the Laboratory of Basic and Applied Virology for their continuing assistance. The authors specially thank Angela Vieira Serufo, for helping with the experiments design and technical assistance.
Authors’ contributions
KLL performed the experiments and analyzed the data and prepared the original draft. TLL and COdQ performed the experiment and helped with the manuscript writing. FGdF designed the experiment and helped with the preparation of the final manuscript. All authors have read and approved the final version of the manuscript.
Declaration of conflicting interests
The author(s) declared no potential conflicts of interest with respect to the research, authorship, and/or publication of this article.
Funding
The author(s) disclosed receipt of the following financial support for the research, authorship, and/or publication of this article: The Laboratory of Basic and Applied Virology received funds from by CAPES, FAPEMIG, and CNPq. FGdF is a CNPq fellowship recipient. KLL, TLL, and COdQ were CAPES and/or CNPq stipend recipients at the Post-Graduation Program in Microbiology/Universidade Federal de Minas Gerais (UFMG). Further support was provided by a CNPq grant # 405249/2022-5.