
Abstract
In clinical trials, rhubarb extract (Rb) was demonstrated to efficiently alleviate constipation. We would like to find out the underlying mechanism of rhubarb relieving constipation. However, there are few studies on the effects of rhubarb on colonic mucus secretion and constipation. The aim of this study was to investigate the effects of rhubarb on colonic mucus secretion and its underlying mechanism. The mice were randomly divided into four groups. Group I was the control group and Group II was the rhubarb control group, with Rb (24 g/kg body weight [b.w.]) administered through intragastric administration for three days. Group III mice were given diphenoxylate (20 mg/kg b.w.) for five days via gavage to induce constipation. Group IV received diphenoxylate lasting five days before undergoing Rb administration for three days. The condition of the colon was evaluated using an endoscope. Particularly, the diameter of blood vessels in the colonic mucosa expanded considerably in constipation mice along with diminishing mucus output, which was in line with the observation via scanning electron microscope (SEM) and transmission electron microscope (TEM). We also performed metagenomic analysis to reveal the microbiome related to mucin gene expression level referring to mucin secretion. In conclusion, Rb relieves constipation by rebuilding mucus homeostasis and regulating the microbiome.
Impact Statement
The synthesis and secretion of mucin is facilitated by rhubarb extract, which additionally profoundly impacts gut permeability and integrity. Furthermore, the gut microbiome in terms of mucin and biofilm production has also altered dramatically, revealing an intense connection between mucin and the gut microbiome association.
Introduction
Constipation can be caused by a number of reasons and is growing increasingly prevalent, with an incidence rate of 10–15% in China and 14% worldwide.1,2 Constipation has received increased attention due to its negative influence on the physical and mental health, as well as their quality of life. 3 Rhubarb extract (Rb) is a traditional Chinese herb that has long been applied in clinics due to its effectiveness. In terms of mechanism, several research has concentrated on intestinal motility and water absorption. It is crucial to note, however, that a few powerful data have been provided to clearly highlight the link between mucin secretion, constipation, and laxation.
Notably, we have established that the level of mucin has markedly decreased in the constipation model and Rb can act as a promoter of mucus secretion to alleviate constipation.4–6 The mucus in the mammalian body provides a protective and selective barrier and a lubricating coating over a humid mucosal surface.7,8 The mucus serves as a buffer between vulnerable epithelial surfaces and the outside environment. The mammalian colonic mucus has two different layers: bacteria-free inner and bacteria-colonized outer. Mucin synthesis from goblet cells continually regenerates the mucus layer, which serves as the first line of defense against viruses and bacteria on the intestinal epithelium. 9 To maintain gut mucus barrier properties, mucus appears to contain gel-forming mucus. Mucus appears to comprise gel-forming mucins (e.g. MUC2, MUC5B, and MUC5AC) and other goblet cell products (e.g. trefoil factor 3, resistin-like molecules, and IgG) to preserve gut mucus barrier qualities. 10 The integrity of the mucus layer is crucial for health. The mucus layer prevents pathogens from reaching and sticking to the epithelial surfaces of the intestine, making it an important component of innate immunity. It remains constantly renewed and serves as a habitation for pathogens and commensal residents, preventing them from penetrating biofilm to the epithelia.11,12 According to several research, germs may penetrate the intestinal mucus layer. Notably, biofilm formation causes prolonged mucosal inflammation if the bacteria are pathogenic.13–15 The enhanced abundance of Bacteroides fragilis group and Enterobacteriaceae, as well as their propensity ability to form biofilms, have been linked to a variety of disorders. 16 A significant quantity of literature has corroborated that mucin benefits the gut microbiota by providing residence and energy.17,18 Endoscopy was performed on mice colon in vivo within the current investigation, and it revealed that mucus significantly enhanced in the Rb-treated mice. Scanning electron microscope (SEM) and transmission electron microscope (TEM) were employed sequentially to investigate mucin phenotype alterations.
Based on our previous research, the colonic epithelium is capable of maintaining ionic secretion condition. Given that constipation may result from aberrant ionic secretion, we utilized short-circuit current technique to evaluate the properties of ion secretion across the mucosa. Tight junctions, also known as intercellular adhesion complexes, are found on the lateral membrane surface in epithelial cells and are predominantly composed of junctional adhesion molecules (JAMs), claudins, and occludins. They play a functional role in the colonic epithelial barrier by regulating paracellular solute and water flux. Zonula occludens-1 (ZO-1) is a transmembrane protein that is found in the intracellular domains and serves as a structural scaffold to the tight junctions while also connecting transmembrane components to the cytoskeleton. 19 Accordingly, a rising body of research has demonstrated that perturbation of tight junction protein is linked with gastrointestinal (GI) disease during the last two decades. Rb treatment’s impact on tight junctions, however, is yet unclear.
Beyond that, the goal of the thesis should be to identify the process through which mucus changes occur. An expanding collection of research indicates that ERN2 (also known as IRE1β), a particular chaperone, appears to be mainly involved in mucin folding.20,21 IRE1 has two paralogs in mammals: IRE1α 22 and IRE1β. 23 It is commonly understood that IRE1β is uniquely detected in the digestive system. 24 Furthermore, IRE1β was reported to be mainly localized in the endoplasmic reticulum (ER) membrane in goblet cells in wild-type mice but not in IRE1−/− mice, indicating that IRE1β might be involved in mucin synthesis. 21 Due to one theory, IRE1β may enhance the turnover of MUC2 mRNA. 21 Furthermore, other studies have corroborated that ERN2-induced Xbp1 splicing is needed for normal goblet cell function.21,25 As was predicted, mucus protection in the ERN2−/− animals became markedly less due to the mice being more sensitive to colitis caused by dextran sulfate sodium (DSS) and Citrobacter infection. 26 Hence, we predicted that Rb would raise IRE1β expression, thereby enhancing mucin secretion. However, the underlying mechanism by which IRE1β acts remains unidentified. This study attempted to investigate the connection between mucin secretion and constipation therapy.
Materials and methods
Animal Care Committee of Capital Medical University has authorized the use of animals in research (Beijing, China). C57BL/6N male mice weighing 22 to 25 g were obtained from Capital Medical University’s Animal Experimental Center. The animals were kept in animal facilities with adequate humidity and temperature, and they were fed and watered using autoclaved food and water. The protocol (AEEI-2019-004) was approved by the Animal Care Committee of Capital Medical University. All trials were conducted with isoflurane anesthesia to minimize suffering.
Rheum palmatum L. (Rheum potaninii A. Los.) roots were purchased from Beijing Tongrentang Drugstore, and Rb was prepared in accordance with the previously described procedure. 27 The substance diphenoxylate was supplied by Hefeng Medicine Industry (Guangxi, China), and each pill contained 91% diphenoxylate and 9% atropine sulfate monohydrate (Guangxi, China). To obtain final concentrations of 10 M, acetylcholine chloride (SIGMA, 1352111), acetylcholine chloride (Tocris, 2810), and carbachol (Tocris, 2810) were diluted with 0.9% normal saline. Bumetanide (SIGMA, BCBC3094) and forskolin (SIGMA, SLBF5617V) were diluted to final concentrations of 10 M in dimethyl sulfoxide (DMSO). Glibenclamide (SIGMA, 050M1584) and Ketotifen fumarate salt (SIGMA, MKCD9012) were 100 M diluted in DMSO. The final concentration of DMSO was less than 0.1% (v/v). Krebs-Henseit solution (K-HS) was prepared with NaCl (117 mmol/L), KCl (4.7 mmol/L), MgCl2 (1.2 mmol/L), KH2PO4 (1.2 mmol/L), NaHCO3 (24.8 mmol/L), CaCl2·2H2O (2.5 mmol/L), and glucose (11.1 mmol/L), and all the reagents above were all from Sigma (SHBD2446V, St. Louis, MO, USA).
Electrode preparation: A 30 mL of 3 mol/L saturated KCl was heated after 1.5 g agarose was added, dissolving it into a 5% Agar KCl solution. To avoid solidification, the solution was put on a magnetic stirring heater that was adjusted at 60°C. The solution was sucked into the short-current special electrode after 5 min and placed there as a buffer in a 3 mol/L KCl solution.
Animal model: The mice were randomly divided into four groups: the control group got 20 mg/kg normal saline for eight days; the NS + Rb group got 20 mg/kg normal saline for five days as well as 24 g/kg body weight (b.w.) Rb for three days; the Diph + NS group got 20 mg/kg diphenoxylate for five days and 20 mL/kg normal saline for three days; and the Diph + Rb group received 20 mg/kg diphenoxylate for five days as well as 24 g/kg b.w. Rb for three days. To assess the efficacy of the constipation model, we housed mice in metabolic cages and collected feces and urine. In addition, the physiological parameters of feces, including their shape, color, consistency, and water content, were investigated as well. 5
In order to directly evaluate colon status, a colonoscopy was performed on experimental mice utilizing a high-resolution mouse video endoscopic system (Miniscope, Biotimestech, China). After performing the standard intestinal preparation, a full-length colonoscopy was performed on the mice after being sedated with isoflurane. Distilled water was aspirated back throughout the procedure through the scope’s biopsy canal. The images and videos that were collected from different groups were scored using a double-blind method using the mucin information in the colon (0, none; 1, slight; 2, moderate; and 3, severe).
Slices of tissue encased in paraffin were deparaffinized using xylene and ethanol. The slides were stained with hematoxylin for 2–3 min, rinsed in running tap water for 2 min, then immersed in the Bluing Reagent for 30 s before being washed with distilled water. After 10 min of Mucicarmine solution staining and 1 min of Tartrazine solution staining, the specimens were washed in pure alcohol once. Three times with pure alcohol to dehydrate, twice with xylene or a xylene alternative to clarify, and once with synthetic resin to fix. Utilizing an automated digital slice scanning equipment (3DHISTECH Ltd., Budapest, Hungary) and CaseViewer, 3DHISTECH’s cutting-edge slide viewing software, the pictures were scanned for quantification.
The colonic samples were fixed overnight at 4°C in 2.5% glutaraldehyde and then washed slowly and carefully with phosphate-buffered saline (PBS). The samples were softly rinsed with PBS the following day, immersed in 1% osmium tetroxide for one hour, then dehydrated in 50%, 70%, 90%, and 100% ethanol for 10 min each at room temperature, followed by overnight drying. An SEM (S-4800; Hitachi, Tokyo, Japan) was then used to photograph the samples.
Colon samples were fixed for two hours at room temperature using solutions of PBS with pH 7.3 that included 2.5% glutaraldehyde and a 2% PFA combination, after which the samples were washed with PBS and fixed for two hours using 1% osmium tetroxide as the secondary fixative. Slices of the fulfilled region that were 1 μm semi-thin were stained with toluidine blue-Azur II to provide the best photos. Slices with a thickness of 6–7 nm were stained with uranil acetate and lead citrate. In order to analyze and take pictures of the material, a 100 kV HT 7700 electron microscope was used.
The fresh fecal samples were instantly collected after the mice had been sacrificed and stored at −80°C for later analysis. In order to create next-generation sequencing libraries, the manufacturer’s procedure was followed. The 200 g genomic DNA (gDNA) that was extracted by Covaris was chopped into fragments with an average size of 300–350 bp. The fragments were end-repaired 5′ phosphorylated, and 3′ adenylated to add adaptors to both ends utilizing End Prep Enzyme Mix. Adaptor-ligated DNA was chosen using DNA Cleanup beads based on the size. Then, using P5 and P7 primers holding sequences that can anneal with flowcell to conduct bridge PCR and P7 primer carrying a six-base index allowing for multiplexing, each sample was then amplified by PCR for eight cycles. In order to clean and validate the PCR products, an Agilent 2100 Bioanalyzer was employed. The appropriate libraries were sequenced pair end PE150 using the Illumina HiseqXten/Novaseq3/MGI2000 System. Raw shotgun sequencing sequences were processed using Cutadapt (v1.9.1) to exclude bad reads such as low-quality reads, N-rich reads, and adapter-polluted reads. Similarly, Burrows–Wheeler aligner (BWA) was utilized to eliminate host contaminant readings (v0.7.12). Samples were created from scratch to meet the requirements for different assemblies. MEGAHIT (v1.13) was used to construct full genome de novo assemblies with different k-mer lengths (59, 79, 99, 119, 141). Prodigal (v3.02) was then used to choose the best Scaffold assembling result with the greatest N50 for gene prediction analysis. Genes gathered from all samples were clustered using MMseq2 with a default identity and penetration of 0.95. SOAPAligner (version 2.2.1) was appiled to produce read coverage information for unigenes from paired-end clean reads so as to analyze the relative abundance of unigenes in each sample. Gene abundance was calculated using the number of aligned reads and then adjusted for gene length. The KEGG database was once more scanned for the protein sequences of the unigenes using Diamond (version v0.8.15.77). The best-scoring-matched result was applied for annotation. Hierarchical structure of the KEGG Brite database was utilized to complete further annotation. Each protein match in the KO database was assigned to three more levels of biological organization based on the KB hierarchies.
After 15 min in Endogenous Peroxidase Blocker, the samples were incubated at 4°C overnight with IRE1β antibody (IRE1β: 1:100, HUANIO, ER63779). The subsequent day, slides were treated with DAB reagent for one minute before being rinsed under tap water until color development. The slides were first washed for five minutes in tris-buffered saline with 0.1% Tween 20 (TBST), then incubated with the corresponding horseradish peroxidase (HRP)-conjugated secondary antibody diluted with TBS, rinsed three times in TBST, and treated with DAB reagent. The slides were then dried, mounted, and counterstained for one minute with hematoxylin. For quantification via digital image analysis, the images were scanned utilizing automatic digital slice scanning equipment (3DHISTECH Ltd., Budapest, Hungary and CaseViewer, 3DHISTECH’s advanced slide viewing software).
Slices of colon tissue fixed in paraffin were deparaffinized using xylene and ethanol. Following heat-induced antigen retrieval with 10 mM sodium citrate buffer (10 mM sodium citrate, 0.05% Tween 20, pH 6.0), the samples were treated for 30 min at room temperature with blocking solutions comprising 5% normal donkey serum and 0.1% Triton X-100 in PBS to quench auto-fluorescence. After that, the samples were then incubated overnight at 4°C with the appropriate primary antibodies (Occludin: 1:100, Invitrogen UJ29507; Claudin-5: 1:100, Invitrogen, VB298617; ZO-1: 1:100, Invitrogen, VC299842). The sections were incubated with the mixed secondary antibodies for 120 min, followed by three 10-min washes with PBS before being counterstained with DAPI (4′,6-diamidino-2-phenylindole) lasting 5 min.
Preparation of distal colon mucosal specimen: After isopentane anesthesia, colonic segments of about 4 cm were obtained and subsequently inserted into K-HS solution from mice sacrificed by cervical dislocation. Upon tissue removal, the mucosal membrane was bathed with an ice-cold K-HS solution containing 95% oxygen and 5% carbon dioxide. The mucosa was placed face down in the silicone container holding the K-HS solution. Under a dissecting microscope, detach the submucosal muscle and muscle layer from the whole layer with tiny forceps to obtain a thin layer of the mucosa layer alone. A constant temperature and perfusion system was used to assess short-circuit current and membrane resistance in vitro.
Colonic mucosa specimens were inserted in the perfusion device’s Ussing chamber and affixed in the left and right chamber apertures. The mucosal side was on the right. Both sides of the mucosa were administered with 5 mL of K-HS solution, gassed with 95% oxygen and 5% carbon dioxide (Vo2/Vco2), the solution pH was kept at 7.4, and the tissue samples were incubated at 37°C for 30 min to stabilize electric parameters. To measure the transmembrane potential difference, voltage-sensitive electrodes (Physiologic Instruments, San Diego, CA, USA) were inserted into the Ussing chamber, and the opposite side was connected to a voltage clamp preamplifier (VCC MC6; Physiologic Instruments, San Diego, CA, USA). The voltage clamp instrument was then linked to the preamplifier, and also the output was connected to the chart recorder to record the measurement data. The instrument had to reset to zero before measurement to eliminate the potential difference between the two voltage electrodes and the resistance of the solution. The transepithelial current was considered to be a short circuit current since the epithelial potential seemed to be zero. Every 25 s, an automatic voltage pulse (Vt) of 0.1 mV is emitted to measure membrane current change (It) and measure membrane resistance (Rt) using Ohm’s law:
Statistical analysis
The data were analyzed and the graphics were produced using the GraphPad Prism 8.0 program. All data were represented as mean ± SEM, with n being the number of animals in each group. Significance was defined as P < 0.05.
Study approval
The study was approved by Animal Care and Use Committee of Capital Medical University (AEEI-2016-079).
Results
Appearance of mucus on the surface of epithelial cells changed
Colonoscopy enables in-depth observation of the gut lumen environment. We examined the presence of the mucosa, the vascular pattern, and the features of stools. The control group, as depicted in Figure 1(A), had segments of mucus fragmented in the gut lumen, a layer of mucus film adhered to the intestinal wall to serve as a lubricant, as well as a huge, irregularly sized mound of mucus around wet feces. Contrarily, there was vanished mucus in the gut lumen and the intestinal wall seemed dry and dull after the administration of diphenoxylate. In comparison with the control group, blood vessels are thickening and bloodshot with bleeding spots on the colon luminal side, which can be returned to the normal condition with Rb treatment. To overcome subjectivity issues and more precisely and objectively measure the mucin secretion’s content, we also used a double-blind method. The results of the study show that mucin levels rose in the presence of sufficient Rb therapy (see Figure 1(D)). Colonoscopy findings provided concrete evidence that rhubarb facilitates mucus secretion.
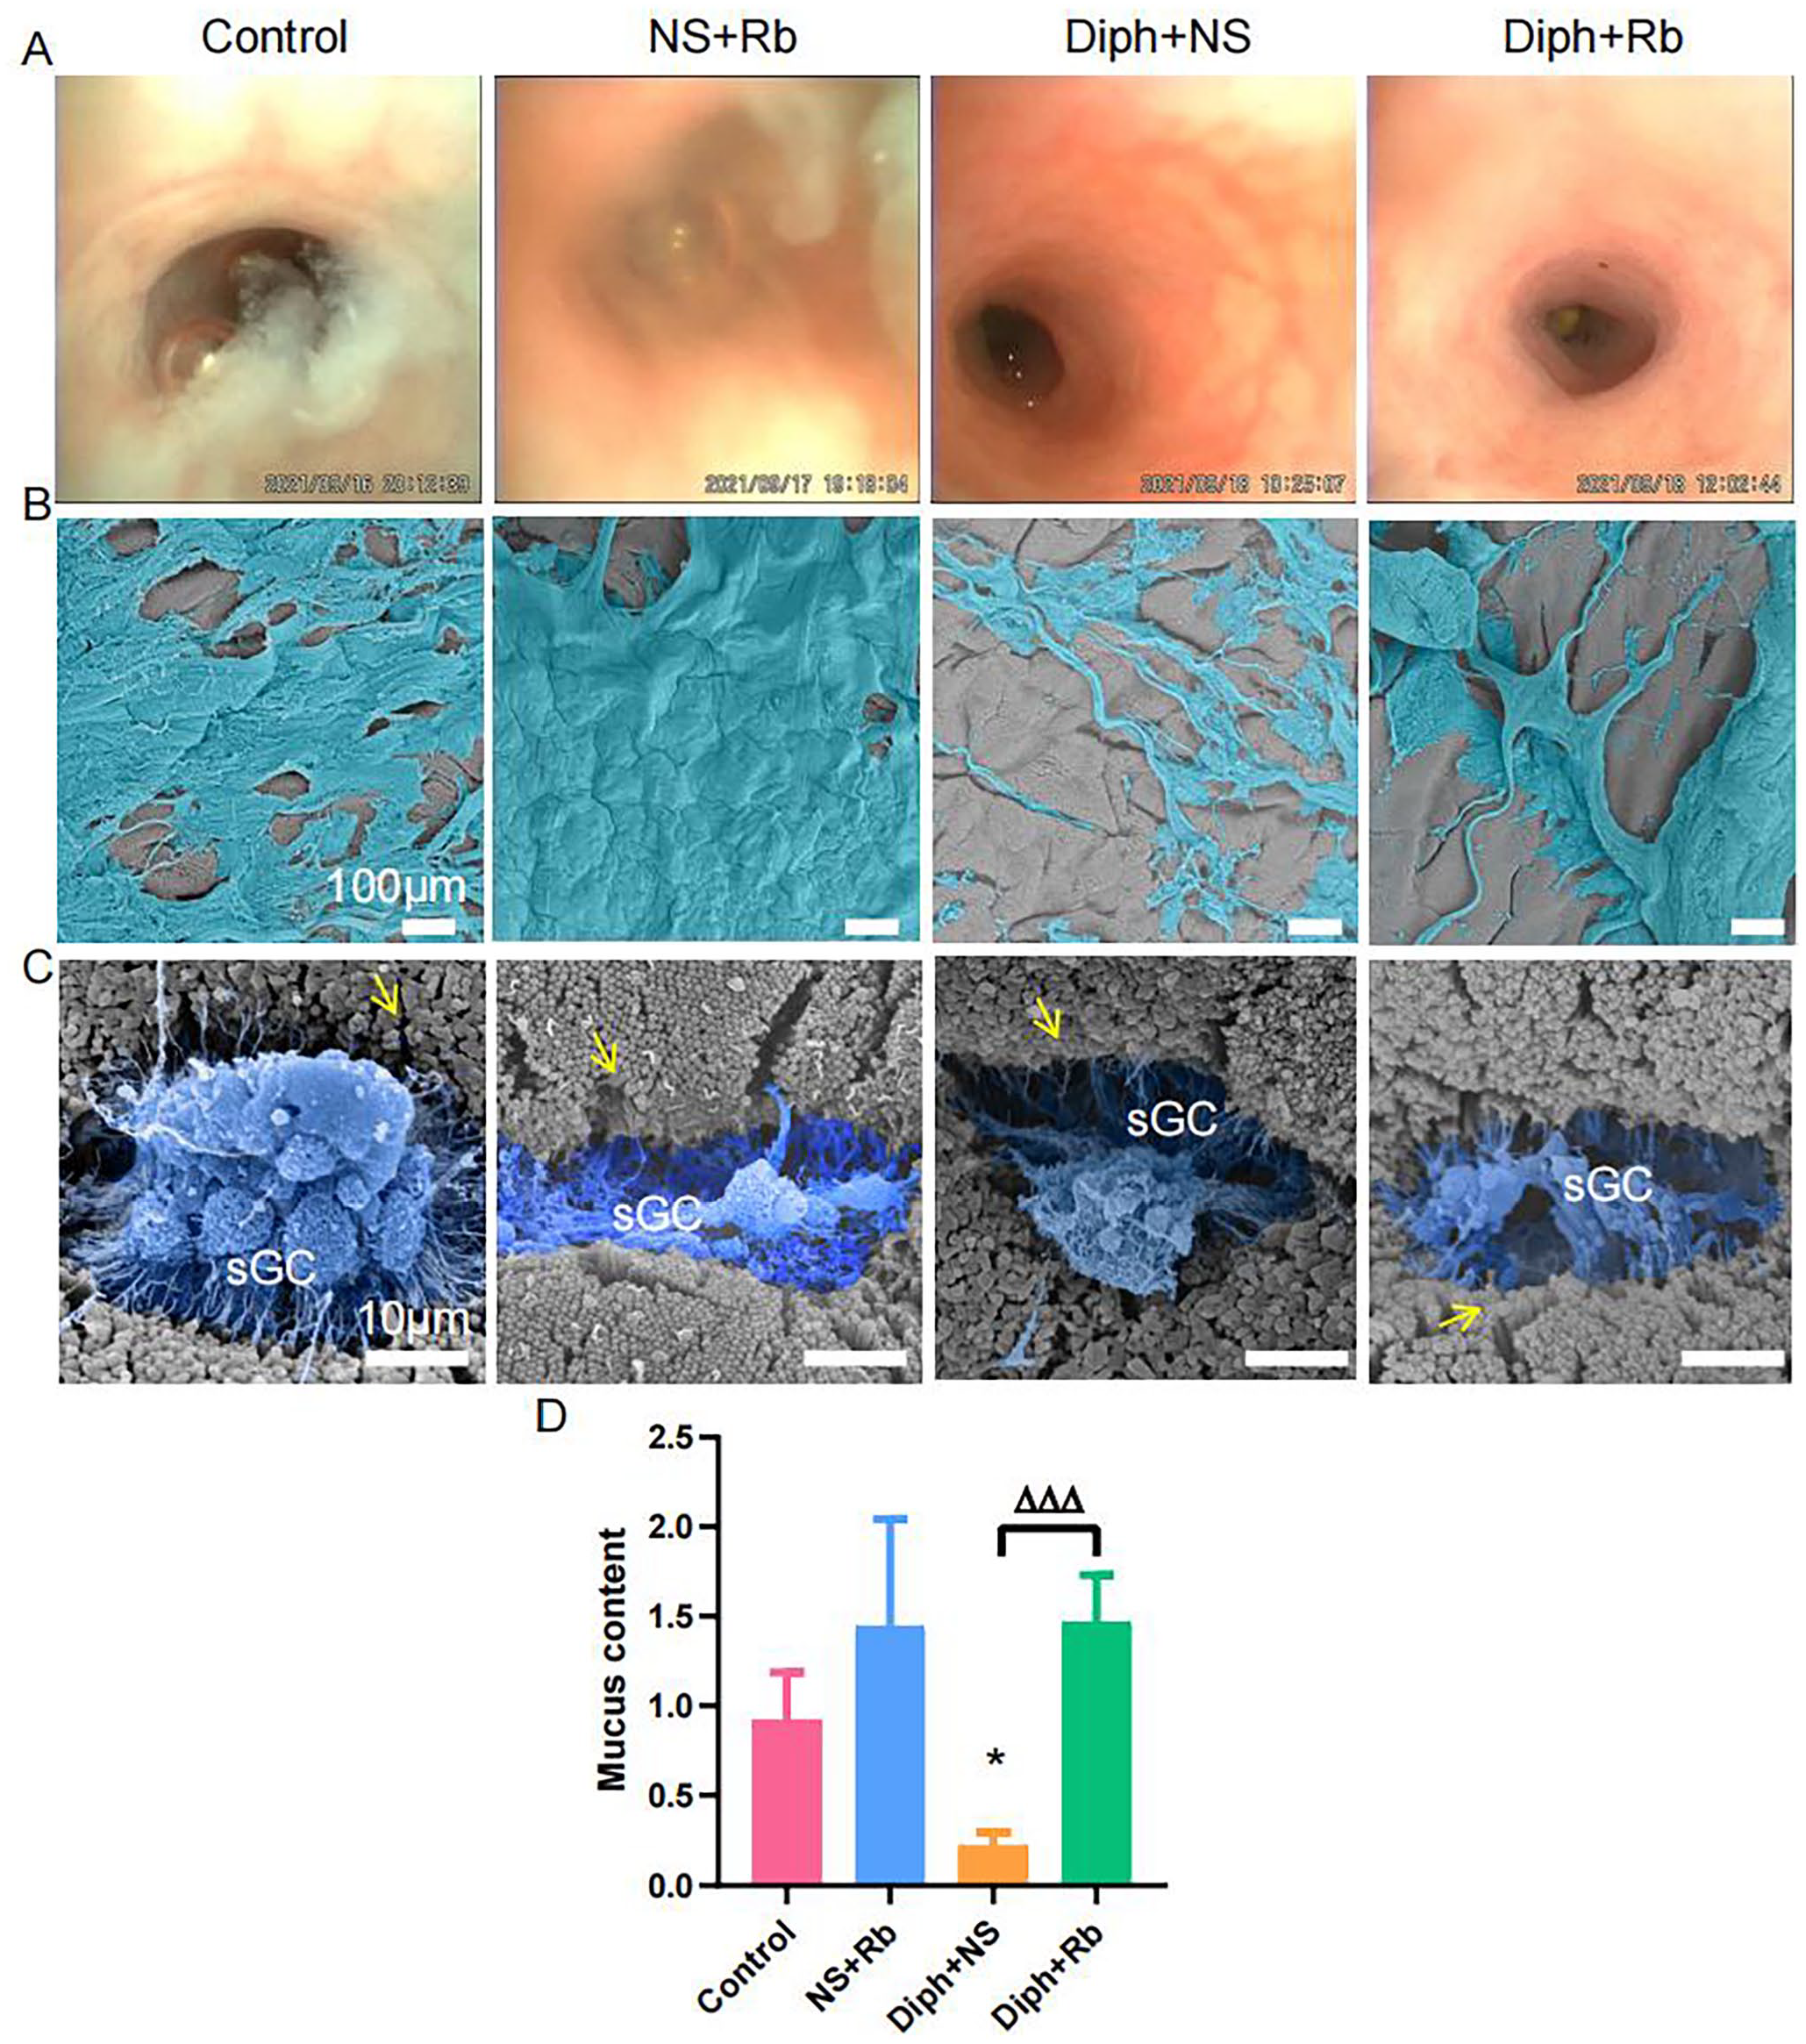
Images showing mucus content from colonoscopy and mucus sticking to intestinal mucosa from SEM. (A) Colonoscopy showing mucus in colonic lumen, or mucus attached to the mucosa in four groups such as control, NS + Rb, Diph + NS, Diph + Rb group. (B) Scanning electron micrographs of the mucus adhering to the mucus layer from four individual experiments as same above shown. (C) Scanning electron micrographs on the surface goblet cells from four different groups. Threads from secreting goblet cells are indicated by pseudo color blue. The yellow arrow pointed to the microvilli. (D) Comparison of mucus quantity obtained from colonoscopy. n = 8–9 per group; *P < 0.05, **P < 0.01 ***P < 0.001. ns, no significance; *versus control group; Δ versus Diph + NS group.
Then, considering SEM is preferable for exploring the surface of subjects, we employed it to evaluate the phenotype of mucus. To prevent microbial invasion, mucus that covers the surface of epithelial cells divides the gut lumen. Scanning the lumen surface at low magnification will reveal the mucus’ dispersion. The volume and area of mucus were easily discernible, as shown in Figure 1(B). The mucosa layer was almost completely covered by mucus in the NS + Rb group compared to the control group. Mucus was indeed diminished in the Diph + NS group to the point that the mucosa layer was virtually entirely exposed. The Diph + Rb group has displayed an increase in mucus production as illustrated in Figure 1(B). Comparing the NS + Rb group to the control group, mucus covered the epithelial cell almost entirely. The Diph + Rb group has developed more mucus. As depicted in Figure 1(C), goblet cells were producing mucus. As can be noticed the mucus morphology differ among the four groups. These findings were consistent with the findings of the colonoscopy.
Diverse phenotypic alternation of goblet cells under different condition
Many of the lining tissues in the body produce mucus, a natural occurring, slick, and stringy fluid substance. In order to preserve vital organs from drying out, certain physiological systems must function as a layer of protection and moisture. For the purpose of examining the underlying process by which rhubarb relieves constipation by moistening the stool and defecating, goblet cells were used as the research subject. Using TEM and mucicarmine staining, the phenotype of goblet cells was assessed to learn more about how they react to various treatments. The results showed that there were substantial differences in the phenotypes of the four groups. As shown in Figure 2(A), the NS + Rb group appeared to have more goblet cells than the control group, but the diameter of the cells was lesser, and the goblets were located at the bottom of mucus layer rather than the apical. The goblet cells in the Diph + NS group became large, inflated, and filled with a large volume of mucus particles. Unexpectedly, the Diph + NS group’s anomalies were recovered by Rb therapy, whereas the control group’s level was mostly preserved. We also applied TEM to assess the mucin density in goblet cells in more detail (Figure 2(B)). As can be shown in Figure 2(D), relative to the control group, the mucin content rose considerably in the other groups. The density peaked in the Diph + NS group, and the high density was lowered by Rb administration concurrently. Furthermore, we utilized mucicarmine staining to quantify the mucin content following different treatments (Figure 2(C)). As seen in Figure 2(E), the integrated optical density (IOD) of mucin increased in the NS + Rb and constipation groups before rapidly declining in the Diph + Rb group and returning to normal levels, Overall, data strongly implied rhubarb had a significant impact on mucin formation and that mucin secretion delayed the onset of constipation. Unforeseen the variations in mucus found during colonoscopy may be partially explained by these variations in goblet cells.
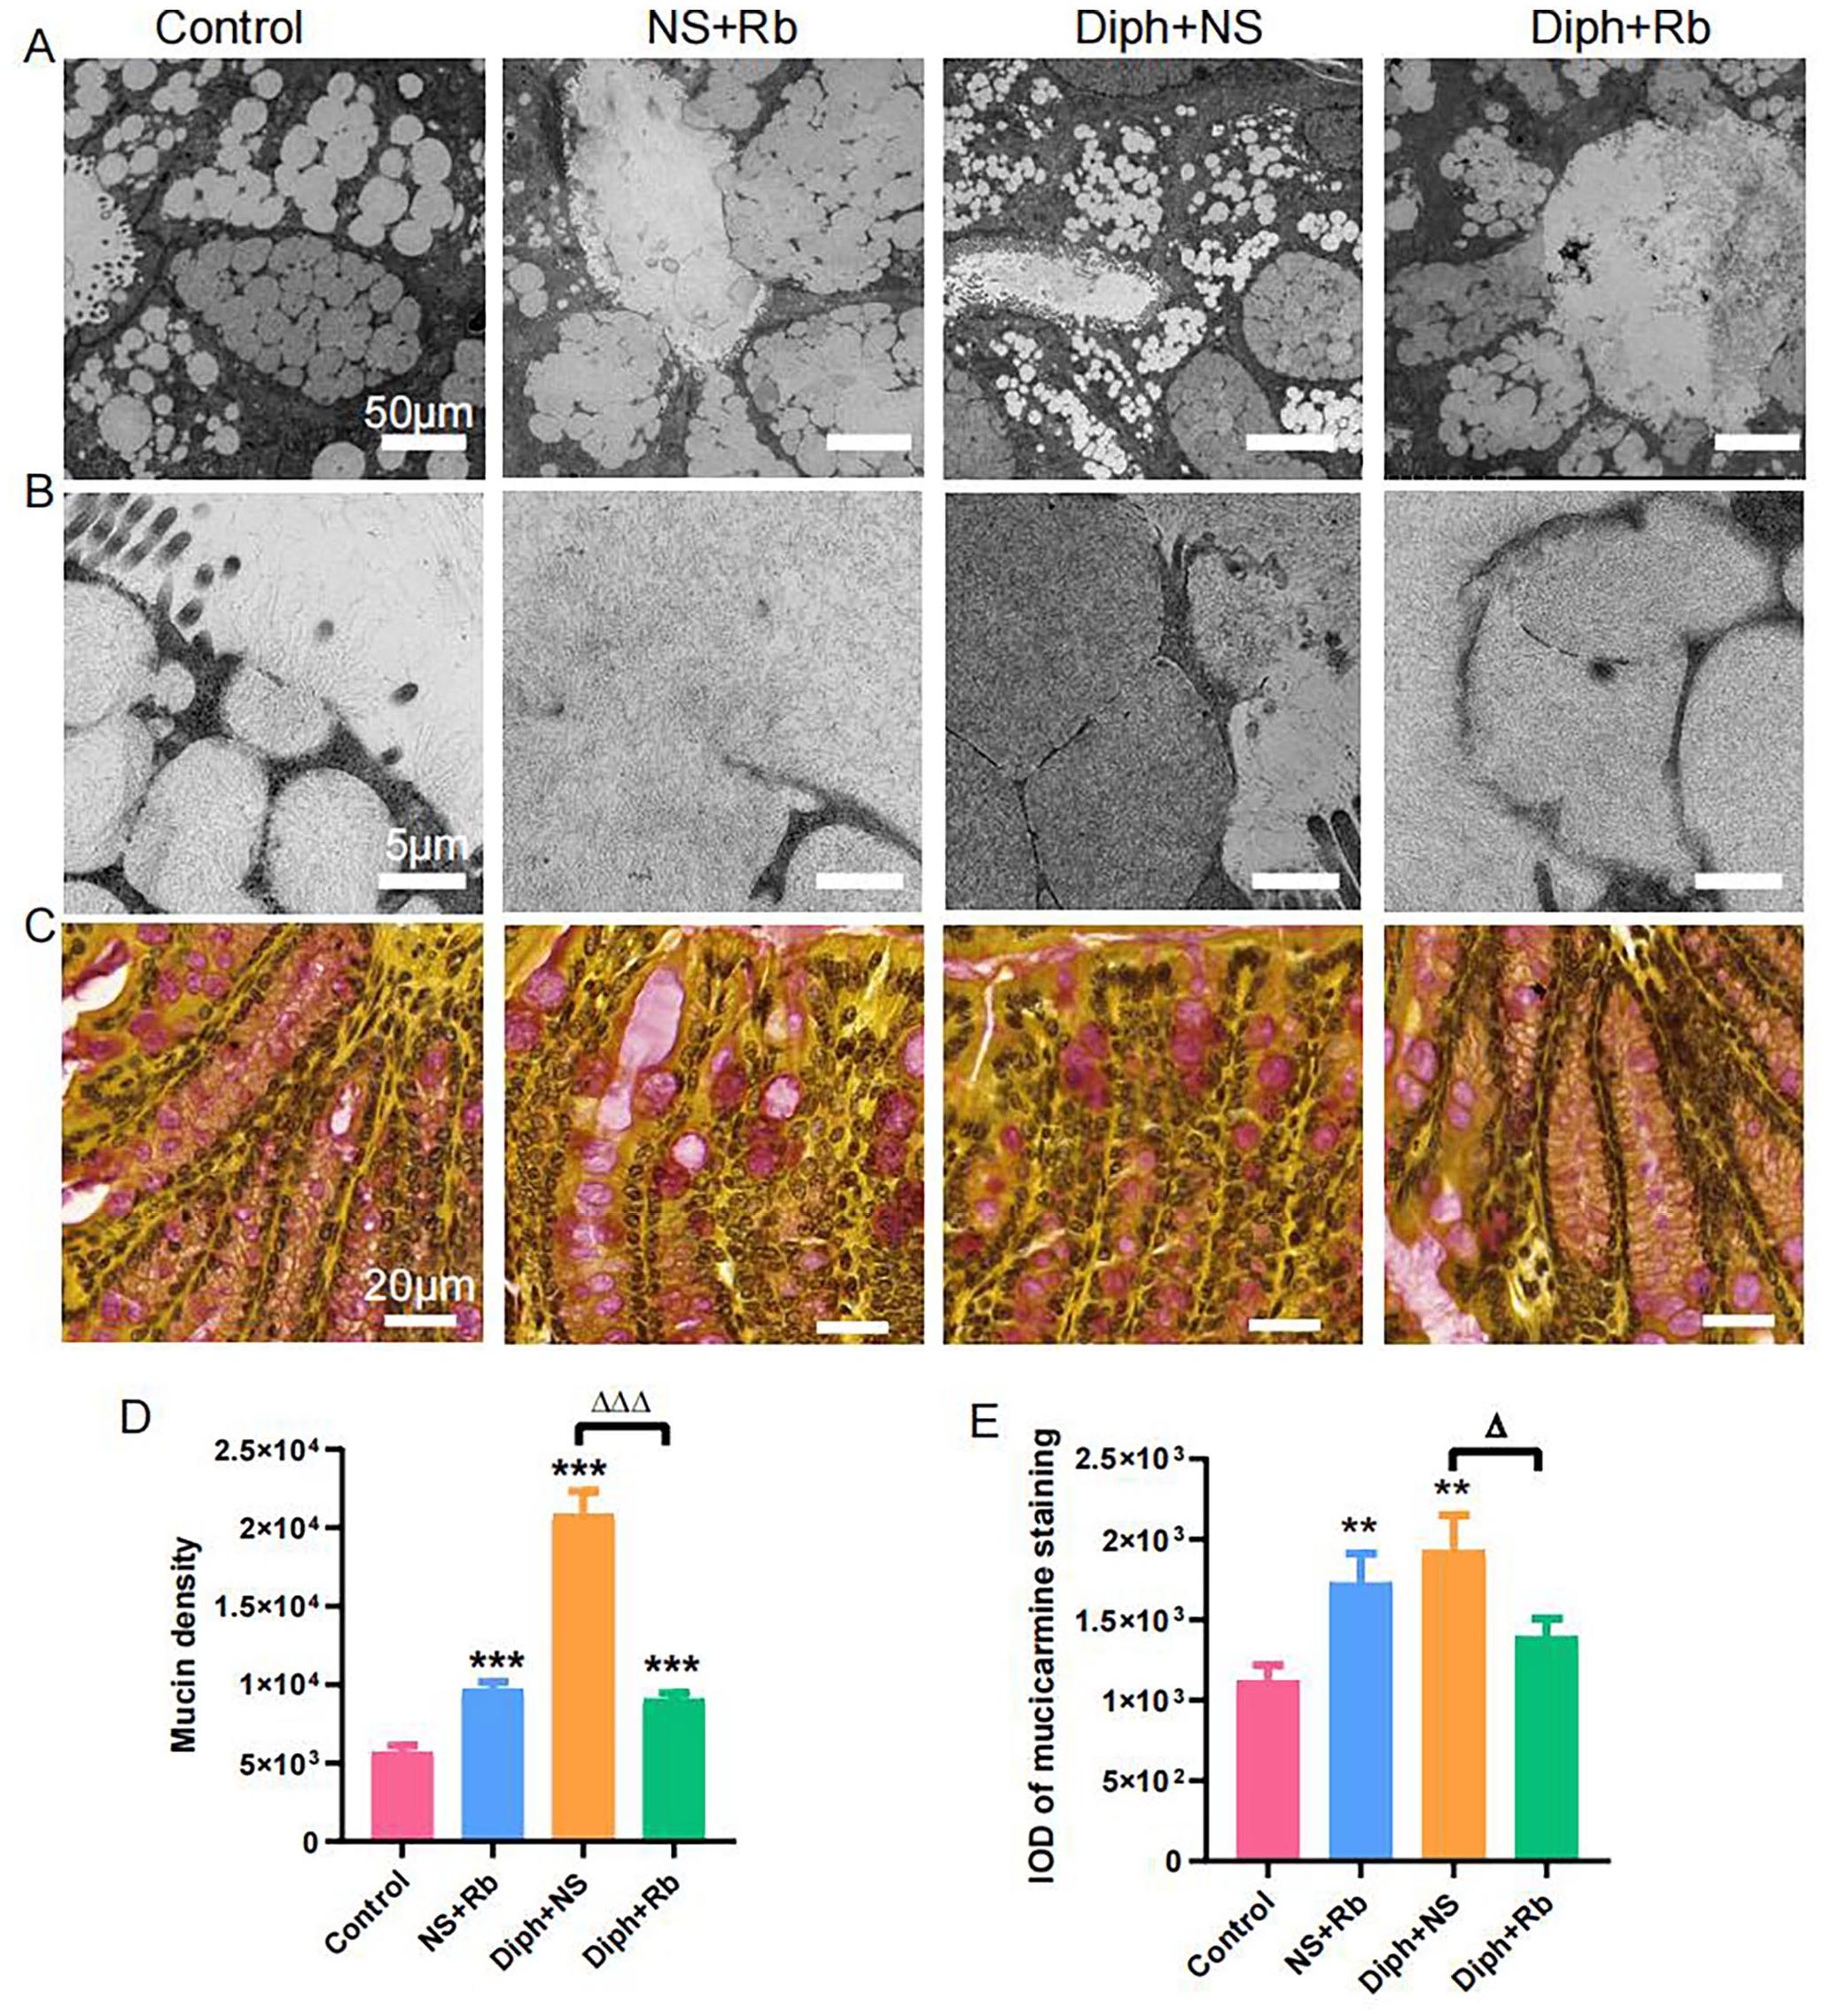
Mucin granule localization in colonic goblet cells. (A) Photomicrograph scanned by TEM depicting lower granule area in the goblet cell from the constipation model and increased granule area in goblet cell from the four groups. (B) TEM images of the density of glycosylated protein in mucin granules of goblet cells from four groups. (C) Mucicarmine special stain revealing the positive mucin in the goblet cells and abundant extracellular mucin from four different groups. (D) Morphometric quantification of mucin volume density. (E) A bar illustration of the integrated optical density (IOD) of Mucicarmine-staining positive mucin. Image-Pro Plus 6.0 software was used to analyze digital pictures, allowing for the determination of mucin levels as IOD. Data delegate mean ± SEM mucin volume density from mucicarmine positive goblet cell in each group. One-way analysis of variance (ANOVA) was used for the analysis. n represents number of mice in each group. n = 6 per group; *P < 0.05, **P < 0.01 ***P < 0.001. ns, no significance; *versus control group; Δ versus Diph + NS group.
Alterations of mucin-associated flora after different treatments
We utilized metagenomics sequencing to identify mucin-related genes on the presumption that the various methodologies examined above clearly showed changes in mucin. As recommended by Diamond (version v0.8.15.77), we identified mucin-related genes by analyzing the KEGG database’s unigene protein sequences. We examined further genes into muc5B, muc5AC, muc2, muc13, muc1, and muc7. The dramatic reduction in the Diph + NS group and Diph + Rb group is evident in Figure 3(A). As illustrated in Supplementary Figure 1, the expression level of muc5B and muc5AC genes shared a variety of crucial characteristics, implying that the level of genes in the NS + Rb group was the highest, while the Diph + NS group appeared to have the lowest value, and the Diph + Rb group increased relative to the Diph + NS group. Furthermore, the Diph + NS group reached a noticeable trough, while the other three groups decreased and the control group’s muc2 level increased. Notably, muc2 in the Diph-treated group was definitely lower than in the control group. Recent clinical observational studies revealed that the mucous glands of the gut mucosa and the goblet cells in the epithelium secrete mucus, which can maintain physiological function, prevent lesions, and keep the mucosa moist. It is generally believed that the distribution of mucus is spatially characterized. The current findings demonstrated that the expression levels of muc2 is almost four times greater than muc5B, and the expression of muc1, muc7, and muc13 was weaker in the colon mucosa. The findings corroborated previous research. 5
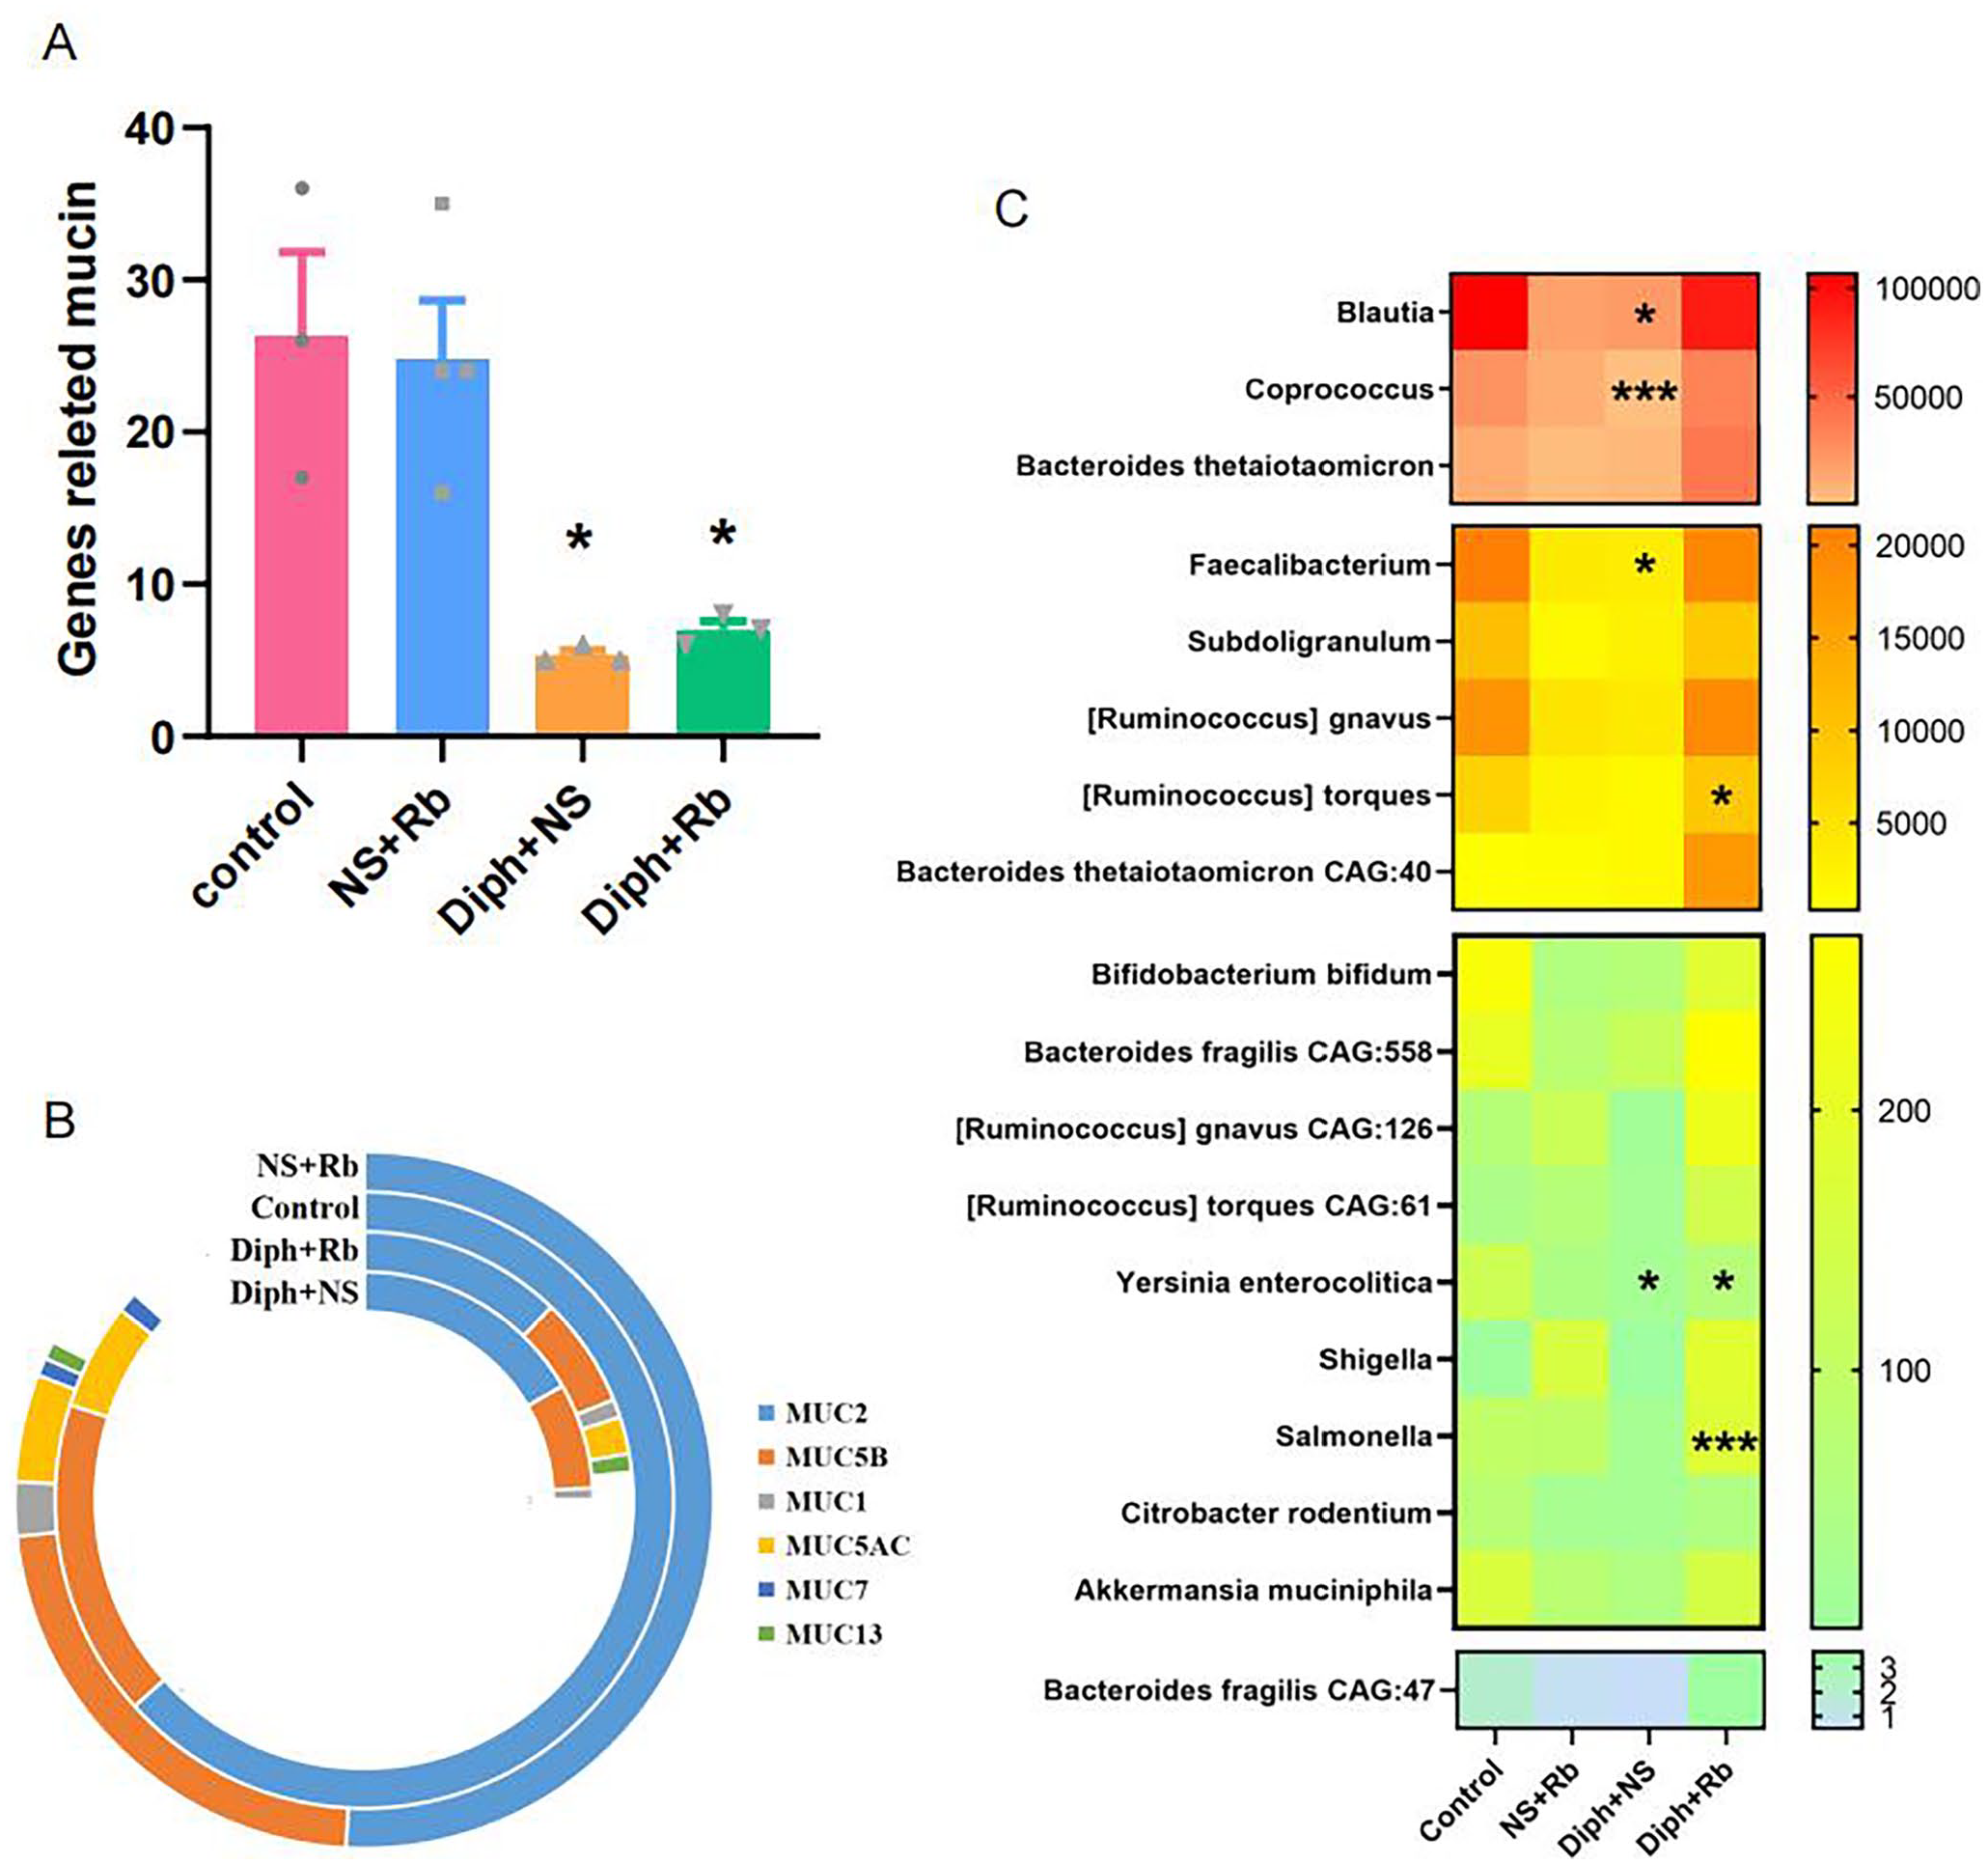
A multimodal technique for analyzing the expression of the impression mucin gene in four categories of fecal samples. (A) Quantification of the number of genes related to mucin expression in four groups. (B) Signature data observed in the most frequently annotated phenotypic terms of the genes pertaining to different types of mucin in four groups. (C) A heatmap depicting the bacterial related to mucin distribution of various populations. The heatmap plot illustrates the relative proportion of each bacterial species within every sample in variables clustered on the vertical axis and horizon-axis clustering. Color intensity represents the relative values for bacterial species, with the legend provided on the right side of the three-level gradation. n = 3 or 4 per group; *P
A substantial and expanding amount of research has demonstrated that intestinal mucus is made up of the major gel-forming glycoprotein muc2 from the mucin family. 8 Distract tendency genes such as muc13 were further depicted in Figure 3(B) and Supplementary Figure 1(F). Both muc2 and muc5A/B genes were shown to be strongly expressed in the Rb-treated group as shown in Supplementary Figure 1(B) to (D). Aside from that, the muc13 gene was specifically expressed in the Diph + NS group. The control group did not have muc1 expression. On the contrary, muc7 was elevated in both the control and NS + Rb groups as seen in Supplementary Figure 1(F). Nonetheless, the expression level of genes existed in distinct groups were rather low. Furthermore, we observed a unique microbial community in the mucus layer, which has been corroborated by other research. 28 The occurrence was confirmed in both the control and Diph + NS groups as illustrated in Figure 3(C). Based on this, we speculated that the microbiome was involved in the mucin modification process. We therefore utilized metagenomic data analysis strategies to evaluate whether the microbiome had altered. Numerous studies have shown an interest in the interaction between gut bacteria and mucin. In short, mucin is a double-edged sword for the gut microbiota. On one hand, mucin has the capacity to limit certain germs from penetrating the intestinal mucosa. For example, colonic ischemia induce the goblet cells to secrete mucus and promptly wash away the germs that may have infiltrated the crypts.29,30 Furthermore, the mucus layer has been shown to inhibit the growth of a few intestinal pathogens such as Yersinia enterocolitica, Citrobacter rodentium, Shigella flexneri, and Salmonella.26,31–33 As illustrated in Figure 3(C), the concentration of S. flexneri, Y. enterocolitica, Salmonella, and C. rodentium was highest in the NS + Rb group, but decreased in the Diph + NS group, notably Y. enterocolitica. We reasoned that the denser mucin layer would act as a strong barrier to some of these infections, resulting in increased feces contents.
Mucin, on the other hand, provides suitable habitat as well as a component of energy for some bacteria, allowing them to survive. The enzymatic activity required for the breakdown of mucin oligosaccharides is possessed by a unique population of gut bacteria. Mucin can be significantly metabolized by local bacteria.17,18 Previous studies have demonstrated that several anaerobic bacteria species, including Ruminococcus torques, Akkermansia muciniphila, 34 B. thetaiotaomicron, 35 Bifidobacterium bifidum, 36 B. fragilis, 37 and R. gnavus. 38 Nonetheless, the results of Ruminococcus species, as shown in Figure 3(C), implied that there were no significant differences between the groups with exception of R. torques, which were considerably lower in the Diph + NS group compared to the control group (P < 0.05, n = 3–4), as well as in the respect of Akkermansia, Bacteroides, and B. bifidum species.
Biofilm formation may be involved in the process
Biofilms may be observed in the normal proximal colon of mice using electron microscopy.39,40 According to the SEM observations, as illustrated in Figure 4(A) and (B), the gut bacteria was tangled by mucin detected both in the control group and the Diph + NS group, revealing that the microbiome and mucin interacted closely. Mucus layer, as we all know, strengthens tolerance to extrinsic antigens by limiting contacting among bacterial–epithelial cells and mucosal inflammatory response. Previous studies found that constipation mice with a thinner inner mucus layer were more likely to provoke inflammation, implying that biofilm formation was more highly probable. As a result, metagenomic data analysis strategies were applied to evaluate the genes that are involved in biofilm in four groups. Unexpectedly, the NS + Rb group appeared to be more sensitive, whereas there was noticeably decreased in the constipation group and its treatment with Rb, which would have been contrary to our anticipations (see Figure 4(C)). According to the publications, we assessed the KEGG functions involved in the whole biofilm development cycle, such as initial biofilm attachment and adhesion. As shown in Figure 4(D), diphoxylate treatment has an inhibiting role in biofilm development cycle, as the pathways participating the process has markedly declined in the Diph + NS group and Diph + Rb group versus the control group.
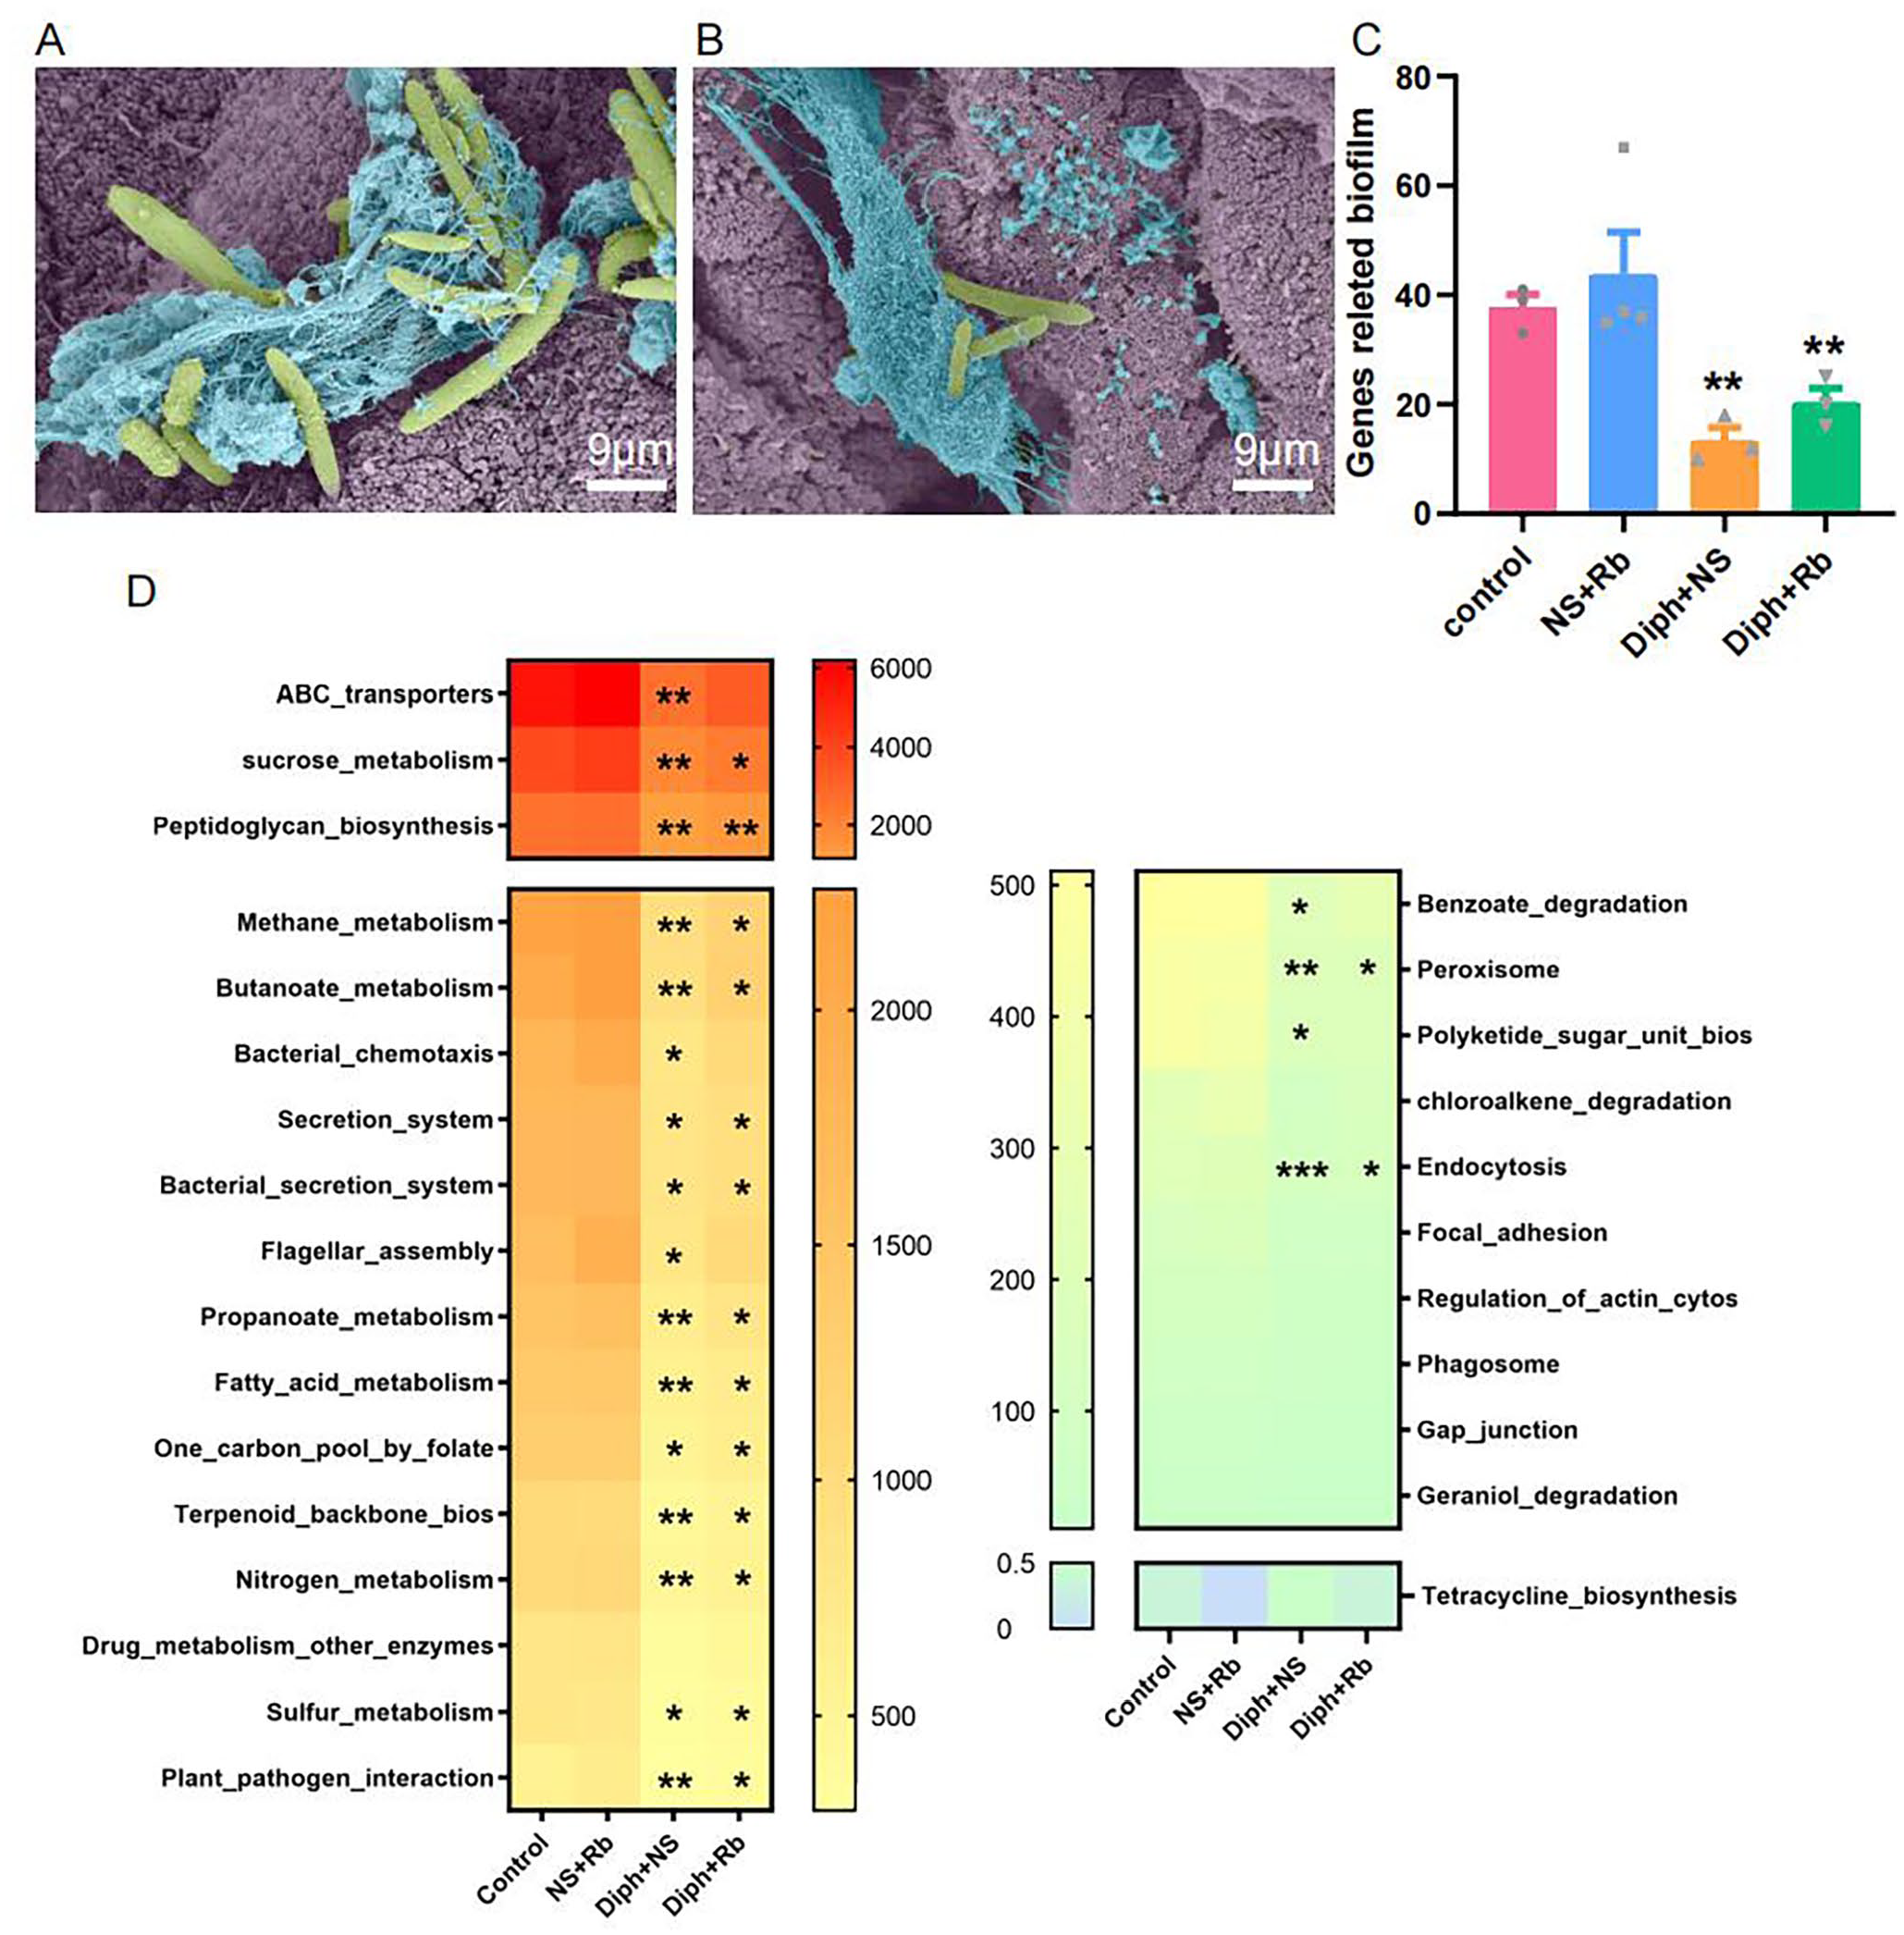
The procedure illustrating the formation of biofilm. (A) SEM images show bacteria trapped in the mucus. Bacteria (pale green) trapped in mucus (pale blue) are indicated in the control group. (B) SEM photos of the attached bacteria (pale green) were enveloped in copious mucus in the Diph + NS group. (C) Mean values from the bars illustrate the different numbers of gene-related biofilm development within the four groups. (D) Heat map showing the relative abundance of abundant genes associated with different processes of biofilm formation with considerable depth enrichment. n = 3 or 4 per group; *P < 0.05; *versus control group.
Assessing mucosa permeability via short circuit current
As demonstrated in Figure 5(A), the baseline short-circuit current (base Isc) increased dramatically to 22.78 ± 9.72 μA/cm2 in pretreatment Rb from 13.89 ± 2.50 μA/cm2 in control mice by 56.58% (P < 0.01, n = 6–8). The other two groups tended to raise the base Isc insignificantly (P < 0.05). The rising baseline might be an indicator of high secretion state, which might partly account for the high mucus secretion in NS + Rb group. To assess the correlation between transepithelial electrical resistance (TEER) and permeability of the colonic epithelial cells, we further selected TEER measurement as a predictive quality indicator for the tight junction as a quantitative morphometric parameter. As revealed in Figure 5(B), the outcome was the inverse of base Isc in terms of membrane resistance. The results indicated that TEER was obviously lower in the NS + Rb group (P < 0.01, n = 4), whereas it was a slightly lower but not significantly lower in other three groups. The TEER in the NS + Rb group was the lowest to 79.97 ± 10.95 Ω/cm2 compared to the 138 ± 12.44 Ω/cm2 in the control group about 42% (P < 0.01, n = 7). Meantime, the TEER was lower in the other two groups compared to the control group without significant.
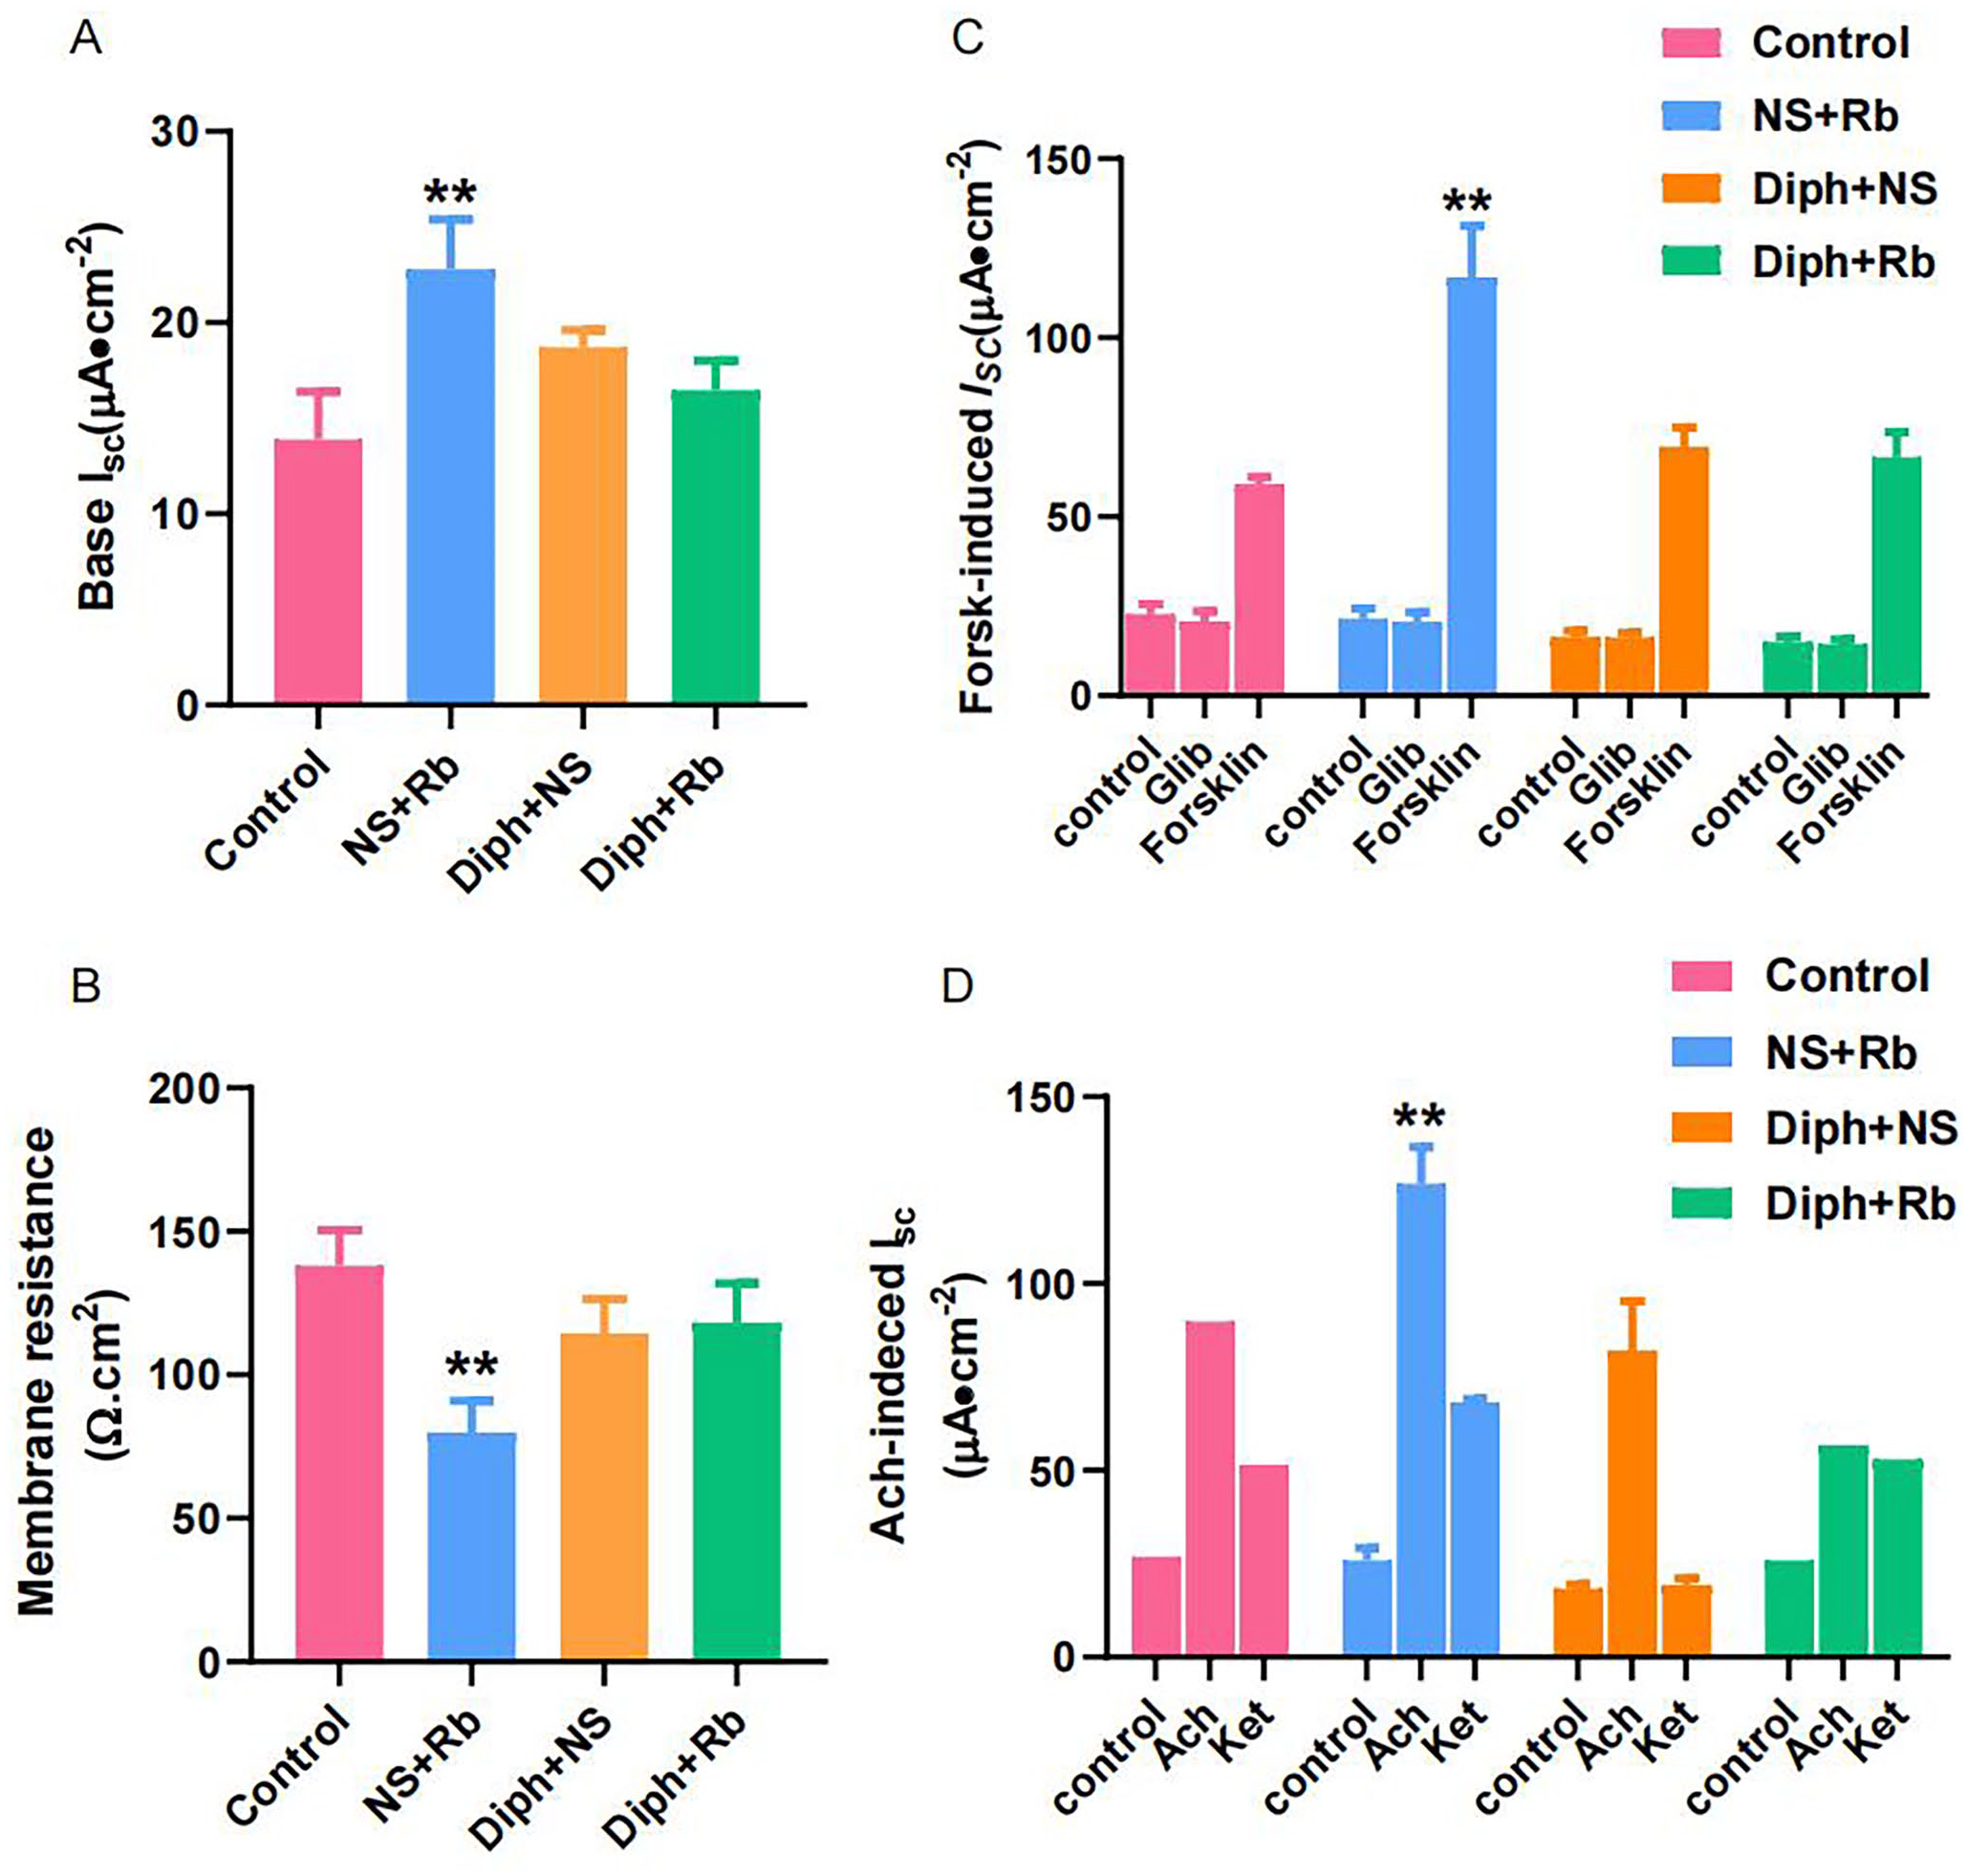
Trait analysis of Isc in distal colon from control and constipation model mice treated with rhubarb. (A) The bar represented base ΔIsc under baseline conditions from the four groups. (B) The change of Isc after treating with forskolin and glibenclamide. In the presence of forskolin (5 μM)-cAMP-increasing Isc but returns to the baseline level treatment with glibenclamide (C) The bar exhibited TEER measurements on mucosa-submucosa samples from control group, NS + Rb group, Diph + NS group, and Diph + Rb, respectively. (D) Cumulative data demonstrated the average change in ΔIsc after addition of Ach with pretreatment of ketotifen. The y-axis values are reported as ΔIsc (maximum Isc − basal Isc). n = 6 or 8 per group; *P < 0.05; *versus control group.
A CFTR (cystic fibrosis transmembrane conductance regulator) blocker, glibenclamide, was also utilized in order to determine whether the Cl–/HCO3–channel was implicated in this process. On pretreatment with glibenclamide at the concentration of 100 µM in the apical side, as shown in Figure 5(C), there was a small decrease but no significant difference in ISC. Forskolin, which has the power to stimulate cellular cAMP production, can clearly improve ΔISC under all the treatments. Noticeably, the NS + Rb group had the highest ISC to 116.781 ± 14.461 (μA/cm2), which was considerably higher than the control group b
Evaluation of the altered expression of tight junction proteins
Tissue remodeling is regarded as the primary influencing element of epithelial structural integrity. A considerable number of published research have addressed the fact that the tight junctions are beneficial to the colonic epithelial integrity. Following that, to determine whether colonic epithelial integrity was impaired under the condition of the constipation, we performed immunofluorescence staining to observe the expressions of proteins referring to tight junctions, including Claudin-5, Occludin, and ZO-1 as shown in Figure (6). To further support the alteration in tight junctions, as Figure 6(E) indicated, the IOD of Claudin-5 was higher following rhubarb administration and but lower in the constipation mice, despite the fact that none of these variations were statistically significant. The quantization of histograph illuminated that IOD of Occludin was markedly enhanced in the NS + Rb group (P < 0.05, n = 6) and significantly decreased in the Diph + NS group (P < 0.05, n = 6) compared with control group (see Figure 6(F)), but returned to the control level in Diph + Rb group. Furthermore, to validate the modification of tight junction, the expression of ZO-1 was evaluated as shown in Figure 6(G). As predicted, the expression level of ZO-1was obviously aggrandized (P < 0.05, n = 6) in the NS + Rb groups compared to the control group. However, the groups of constipation model and treated with rhubarb showed a nonsignificant trend to decline. Meanwhile, the TEM data provide direct proof that tight junctions in distinct processes altered under different conditions. These findings implied that Rb modulates intestinal epithelial integrity and ion transport via multiple mechanisms.
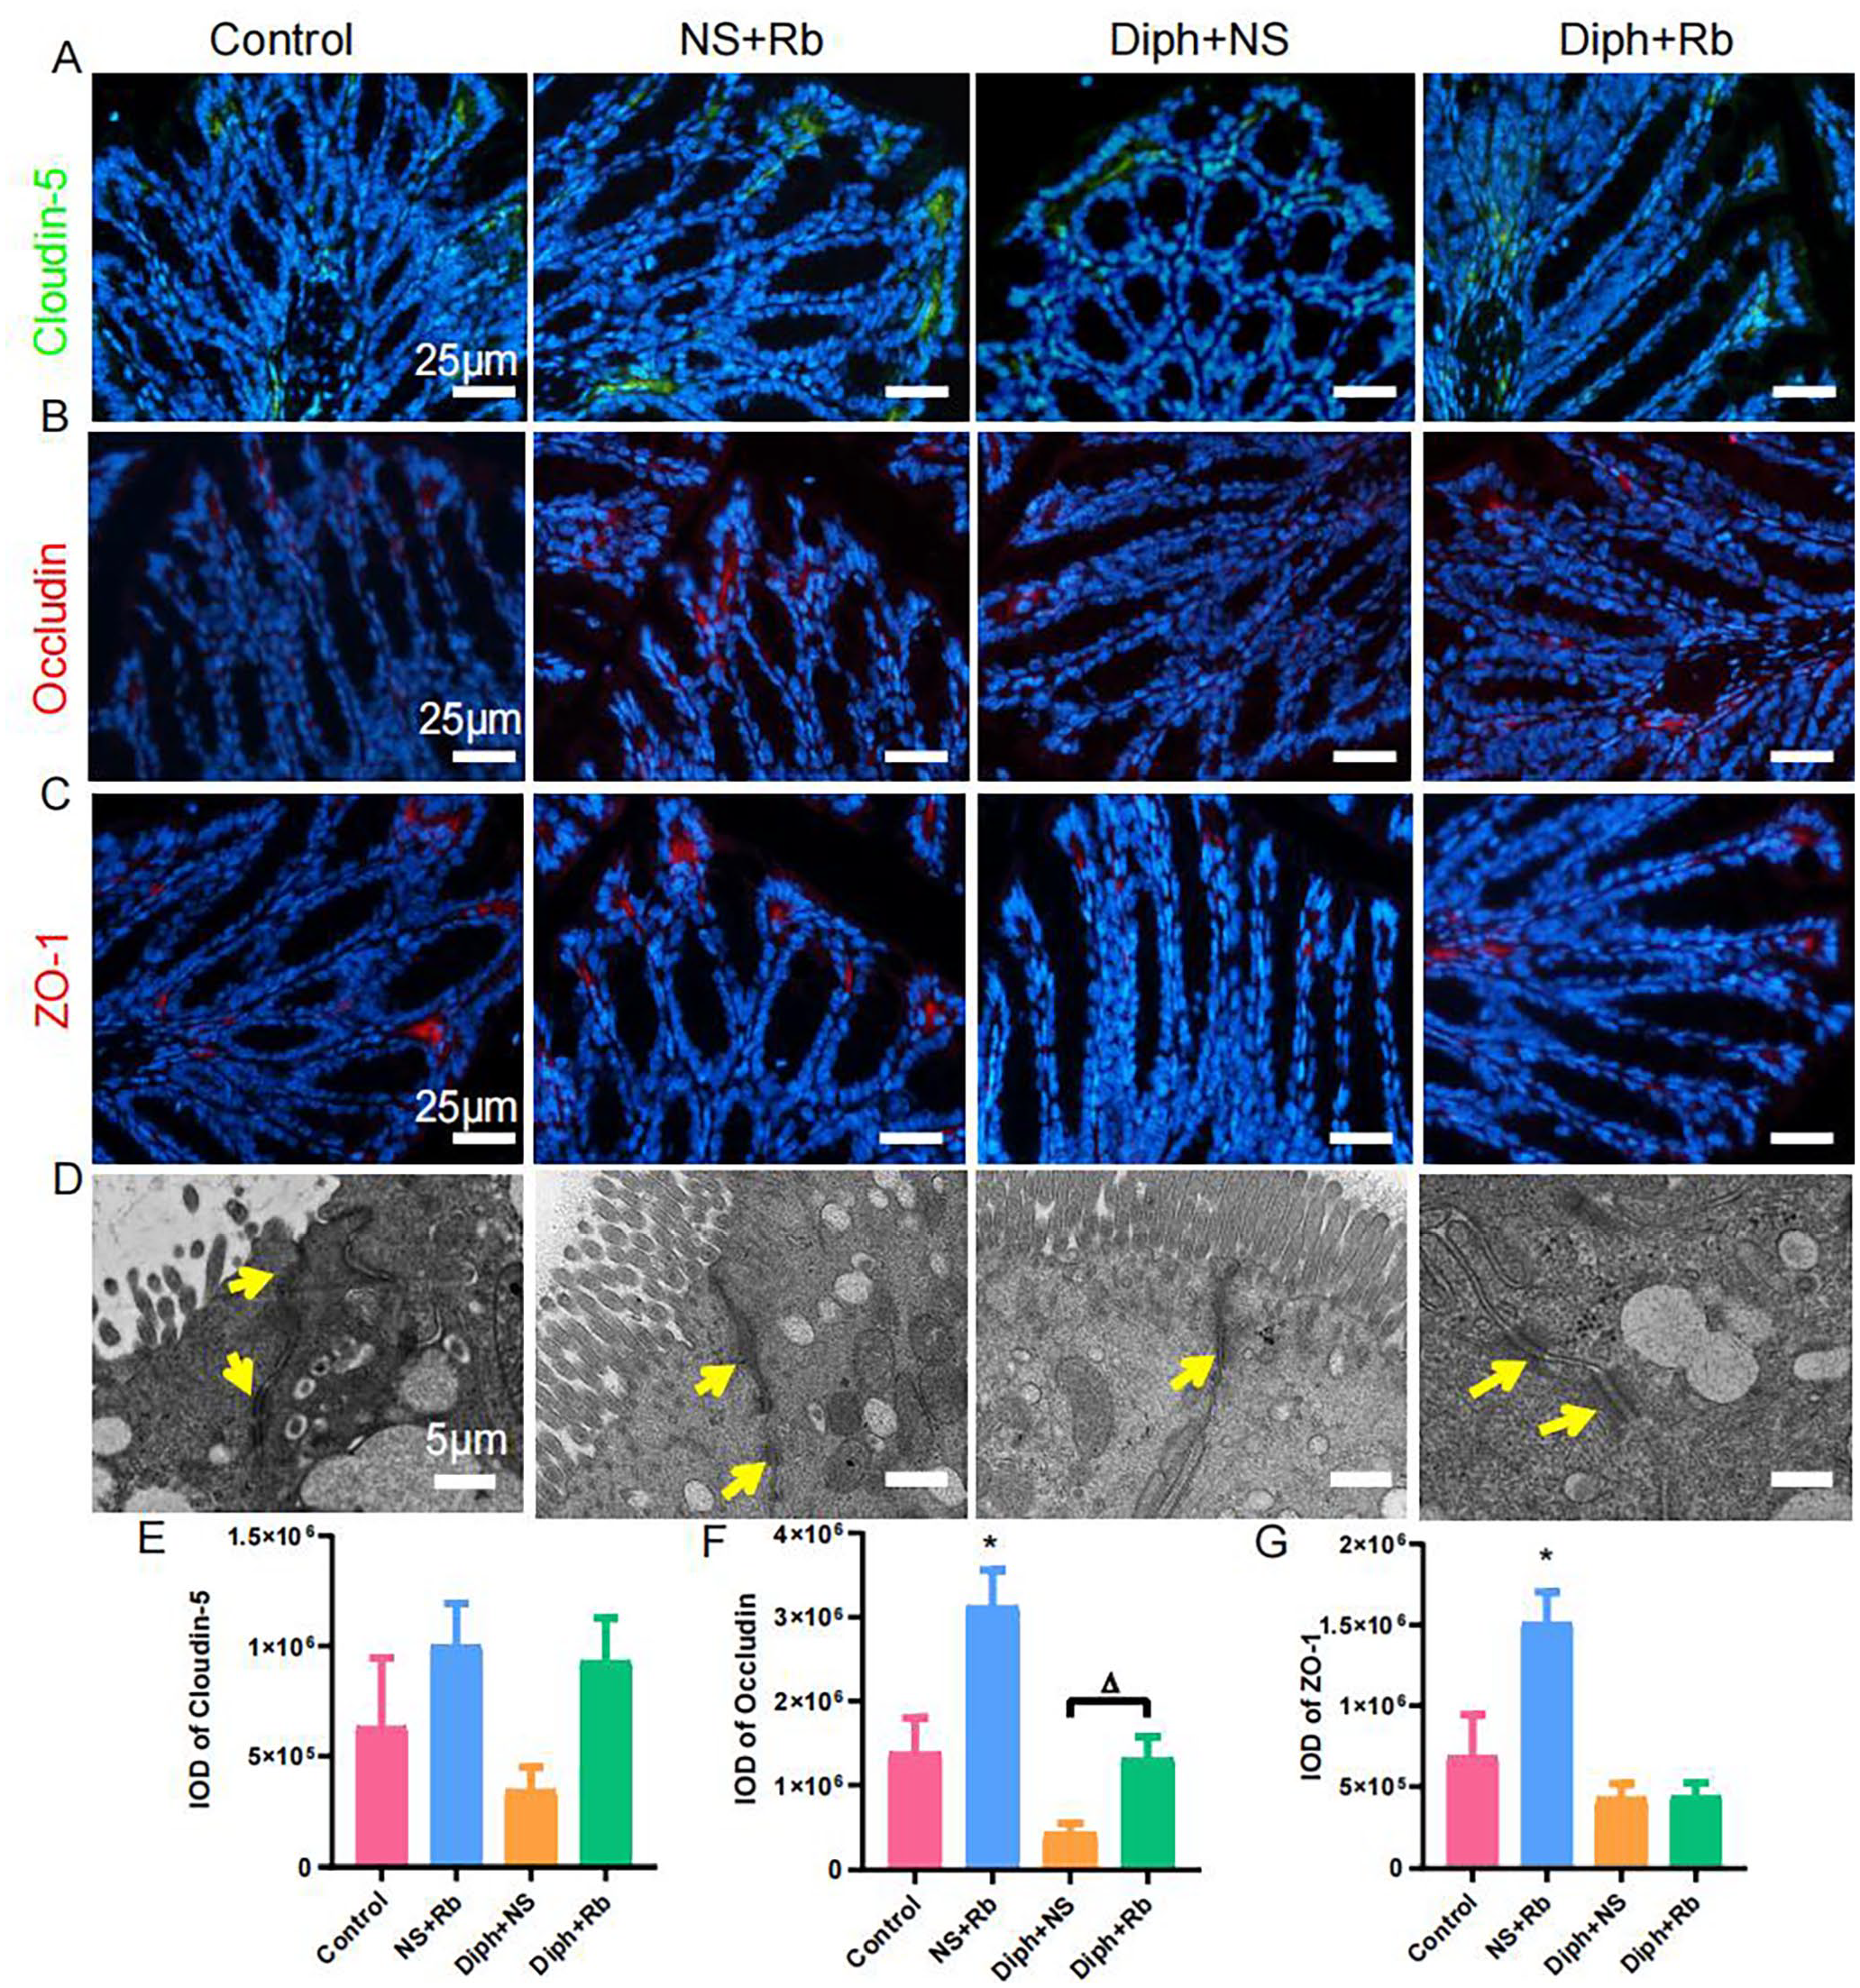
Impact of Rb stimulation on tight junction proteins in colon tissue sections via immunofluorescent staining and TEM. (A) The expression of Claudin-5 (Blue, DAPI; Green, Claudin-5). (B) The expression of Occludin (Blue, DAPI; Red, Occludin). (C) The expression of ZO-1 (Blue, DAPI; Red, ZO-1). (D) Representative TEM pictures of tight junction complex of the colon from four groups. The yellow arrow pointed to tight junction complex. (E) IOD values indicate the quantification of expressions of Claudin-5 (n = 6, each group). (F) IOD values for expression levels of Occludin in the colon samples (n = 6, each group). (G) IOD values indicate the quantification of expressions of ZO-1 (n = 6, per group). *P < 0.05; *versus control group.
IRE1β involved in the mucin secretion
Despite significant investigations, there is presently no agreement on a fundamental process underlying mucus formation. IRE1β has historically been the focus of study into the variables related to mucin secretion, showing that it may function as a crucial mediator throughout the mucus secretion pathway.20,21,43 Therefore, we performed immunohistochemistry analysis using a specific antibody that recognizes the expression of IRE1β (see Figure 7(A) to (D)). As shown in Figure 7(E), we observed considerably greater expression of IRE1β in the NS + Rb and Diph + Rb groups when compared to the control group (P < 0.05, n = 6), but dramatically downregulated when constipation was observed. The alterations in the IRE1β are extremely compatible with the results of the colonoscopic observation and metagenomic analysis, implying that IRE1β is involved in mucus secretion.

Activation of the IRE1β in the colonic mucosa from different groups. (A to D) Immunohistochemical analysis for IRE1β was performed on paraffin-embedded slides from colon mucosa of four groups. The arrows indicate IRE1β-positive cells, which are shown in brown. (E) Quantitative analysis of immunohistochemistry staining for the IOD of IRE1β. n = 6 or 8 per group; *P < 0.05; *versus control group.
Discussion
Mucus produced by goblet cells forms the two mucus layers: the inner mucus layer and the outer mucus layer. The inner mucus layer is “firmly” linked to the epithelium and around 50 µm thick as demonstrated in the distal colon of mice.11,44 On the outside edge of the inner mucus, an unexpectedly distinct boundary was seen as the mucus is transformed from being connected to readily aspirated. 11 The findings of a colonoscopy revealed that Rb promoted mucin secretion. Curiously, SEM results indicated that the constipation was accompanied by decreased mucus production, whereas constipation animals reacted to Rb with enhanced mucus secretion. The goblet cells were then stained with mucicarmine to identify the number of goblet cells and the density of acid mucin. Mucicarmine offers a major advantage over Alcian Blue–periodic acid-Schiff (AB-PAS) in terms of assessing goblet cell density due to its experimental simplicity. The active dye molecule in the mucicarmine process is considered to be carmine, an aluminum–carmic acid combination. Existing evidence indicates that this complex is generated by electrostatic attraction to the anionic groups of acid mucins, 45 but the precise method remains unknown. According to the mucicarmine staining images, we hypothesized that the O-glycan process of mucin may be hindered in constipation animals, resulting in acid mucin not exhibiting a decreasing tendency although total mucin definitely reduced. To demonstrate the hypothesis, we are required to perform the research on cell level to unveil the underlying mechanism in the following procedure.
Furthermore, TEM was utilized to investigate the alterations in goblet cells due to its mucin-producing role. The number of goblet cells increased considerably in the Rb-only group, and majority of them secreted. In the constipation group, however, few goblet cells were secreting. All of the foregoing analyses showed that Rb had an impact on goblet cells’ capacity to secrete mucus.
Since this difference had been uncovered, further data were required to determine exactly how Rbs affected mucin. Using metagenomics sequencing from feces, we were able to reveal the expression of mucin-related genes. The rhubarb group had the most, with muc2 accounting for the majority of the total. Constipation mice, on the contrary, lacked genes associated with mucin synthesis. Previous study has shown that MUC2 is the predominant mucin in the colon, which is consistent with the current findings,11,46 the results may be more direct and forceful in elucidating the thesis if the samples were acquired from mucus adhered epithelium. Nonetheless, the mucus around feces can reveal information about the intestinal lumen.
The mucus had been severely impacted. What about the roles that mucus performs? Based on previous researches, the appreciation of gut mucus has evolved from a static lubricant into a dynamic and vital component of the gut ecosystem. Mucin, the main component of mucus layer, can directly contact with gut flora. Not surprisingly, mucin and gut microorganisms have a close relationship. The function of mucin on the gut bacteria is not limited to the shield, 47 but also is the habitat and energy for some gut bacteria. Gut microbes, on the contrary, have a great effect on mucin. 48 Mucus not only regulates the contact between host tissues and a diverse variety of microbiota, but it also mediates how this ecosystem operates in order to facilitate mutualistic symbioses and guard against microbe-driven disorders. 7 Furthermore, mucins contribute to regulate host–environment interactions at mucosal surfaces via multiple mechanisms ranging from the formation of physiochemical barriers to the regulatory oversight of signal transduction pathways in epithelia such as TLR-MyD88 signaling and the NLRP6 inflammasome.7,8,49–51 When the mucus barrier is damaged, germs can invade the epithelium and cause inflammation. 52 Apart from gel-forming mucins, there is another kind of mucin. Transmembrane mucins synthesize and stick to the cell membrane of the enterocyte, hanging over their apical surface. 53 Although they are not involved in mucus gel formation, they most likely function as luminal milieu sensors and play an important role in host–microbe interactions, as shown in Supplementary Figure 2.54,55 Our previous study demonstrated that the transmembrane mucins became significantly shorter and thicker in the constipation mice, confirming the existence of a strong relationship between mucin and intestinal flora. 5
Several investigations have found that adherent bacterial communities embed themselves in a complex extracellular matrix to gain a competitive advantage, a process called biofilm formation. 56 Bacteria involved in biofilm production prevail in almost all ecosystems, both in terms of numbers and metabolism. Furthermore, biofilm has been be concerned with chronic bacterial infections in the humans,57,58 including inflammatory bowel disease (IBD), GI infections, colon cancer, and familial adenomatous polyposis.59–62 Constipation thinned the thickness of the mucus layer greatly, allowing gut bacteria to penetrate cells. A large amount of researches have recently proven that some complex microbial communities generate mucosal biofilm, which is an intricate and self-produced polymeric matrix where microorganisms may adhere to each other and be attached to the mucosal surface. 63 Furthermore, bacterial adhesion to mucin proteins may result in microcolonies formation, which can then expand into biofilms. As an outcome, we investigated the biofilm-related genes and revealed that constipation mice had the fewest biofilm-related genes, contradicting the SEM findings. Upon the restrictions and irregularity, the findings of SEM may be only a portion of the full image. We are curious about how intestinal secretory mucins, especially their O-glycone, contribute to host defense tactics, with a focus on emerging tolerance defensive mechanisms against the bacterial symbiotic microbiota. Mucin, as we all know, greatly affects gut permeability.
Conclusions
The purpose of this study was to determine the effect of Rb on mucin. According to the findings, Rb has a promoting role in mucin secretion and has a great impact on the gut permeability and integrity. Furthermore, the gut microbiome in terms of mucin and biofilm formation has markedly altered, demonstrating that mucin and the gut microbiome have a close association. Despite considerable limitations owing to a lack of deep inquiry at the cellular and molecular levels, we believe that research in vivo can objectively and properly reflect the real underlying mechanism of rhubarb to alleviate constipation.
Supplemental Material
sj-pdf-1-ebm-10.1177_15353702231211859 – Supplemental material for Rhubarb extract rebuilding the mucus homeostasis and regulating mucin-associated flora to relieve constipation
Supplemental material, sj-pdf-1-ebm-10.1177_15353702231211859 for Rhubarb extract rebuilding the mucus homeostasis and regulating mucin-associated flora to relieve constipation by Han Gao, Chengwei He, Shuzi Xin, Rongxuan Hua, Yixuan Du, Boya Wang, Fengrong Gong, Xinyi Yu, Luming Pan, Chen Liang, Lei Gao, Hongwei Shang and Jing-dong Xu in Experimental Biology and Medicine
Footnotes
Authors’ contributions
HG generated the mice model and wrote the article. HG, CH, RH, YD, and SX performed the experiments. RH, FG, XY, LP, and CL analyzed the data from the experiments. BW drew the graph and expanded the literature. LG conducted the bioinformatics analysis. HS performed the experiments and supplied the experimental instructions. J-dX cooperated, analyzed all the data, and revised the article.
Declaration of conflicting interests
The author(s) declared no potential conflicts of interest with respect to the research, authorship, and/or publication of this article.
Funding
The author(s) disclosed receipt of the following financial support for the research, authorship, and/or publication of this article: This work was supported by the National Natural Science Foundation of China Grant (grant no. 82174056, 81673671 JD Xu).
Supplemental material
Supplemental material for this article is available online.
References
Supplementary Material
Please find the following supplemental material available below.
For Open Access articles published under a Creative Commons License, all supplemental material carries the same license as the article it is associated with.
For non-Open Access articles published, all supplemental material carries a non-exclusive license, and permission requests for re-use of supplemental material or any part of supplemental material shall be sent directly to the copyright owner as specified in the copyright notice associated with the article.