
Abstract
Data imbalance is a challenging problem in classification tasks, and when combined with class overlapping, it further deteriorates classification performance. However, existing studies have rarely addressed both issues simultaneously. In this article, we propose a novel quantum-based oversampling method (QOSM) to effectively tackle data imbalance and class overlapping, thereby improving classification performance. QOSM utilizes the quantum potential theory to calculate the potential energy of each sample and selects the sample with the lowest potential as the center of each cover generated by a constructive covering algorithm. This approach optimizes cover center selection and better captures the distribution of the original samples, particularly in the overlapping regions. In addition, oversampling is performed on the samples of the minority class covers to mitigate the imbalance ratio (IR). We evaluated QOSM using three traditional classifiers (support vector machines [SVM], k-nearest neighbor [KNN], and naive Bayes [NB] classifier) on 10 publicly available KEEL data sets characterized by high IRs and varying degrees of overlap. Experimental results demonstrate that QOSM significantly improves classification accuracy compared to approaches that do not address class imbalance and overlapping. Moreover, QOSM consistently outperforms existing oversampling methods tested. With its compatibility with different classifiers, QOSM exhibits promising potential to improve the classification performance of highly imbalanced and overlapped data.
Impact statement
Accurate classification and analysis of imbalanced and overlapped data, which are prevalent in the fields of biology and medical sciences, are crucial for understanding complex biological systems, including disease diagnosis, drug discovery, and personalized medicine. This research introduces quantum-based oversampling method (QOSM), a novel oversampling method based on quantum potential theory, addressing challenges in highly imbalanced and overlapped data sets. QOSM improves sample distribution representation, especially in overlapped regions, by selecting cover centers using potential energy. Compared to existing methods like SMOTE (synthetic minority oversampling technique), QOSM considers individual sample and cover relationships, effectively reducing mislabeled synthetic samples. Extensive evaluations on 10 data sets with high imbalance ratios and overlap demonstrate that QOSM significantly improves classification accuracy, outperforming other methods across multiple classifiers, such as support vector machines (SVM), k-nearest neighbor (KNN), and naive Bayes (NB) classifier. Therefore, QOSM presents a novel and effective approach to address imbalance and overlap in classification, with great potential for application in various biological and medical data sets.
Introduction
Improving the performance of classification on imbalanced data, where the number of samples of the majority class greatly exceeds that of the minority class, has been a significant challenge in the field of machine learning. Imbalanced classification is prevalent in various fields, such as biological science and medical diagnosis. For instance, it is observed in imbalanced class learning in epigenetics, 1 readmission risk prediction in clinical and medical fields to support diagnostic decision-making, 2 and chemical classification and toxicity analysis. 3 When traditional classifiers are applied to these imbalanced data sets, they often exhibit deficiencies. 4 Consequently, numerous researchers have been motivated to develop different approaches to address the imbalanced data set problem and improve classification accuracy. 5
Research in this area can be categorized into algorithm- and data-level approaches. Algorithm-level approaches involve the development of new algorithms or modifications to existing ones, 6 tailored to the characteristics of imbalanced data, with the aim of achieving higher classification accuracy. On the other hand, data-level approaches primarily focus on reducing the imbalance ratio (IR), 7 which is defined as the ratio of the number of the majority class samples to the number of minority class samples. This reduction is typically accomplished through resampling techniques, 8 which aim to balance the distribution of samples across different classes. In data-level approaches, classification algorithms and data remain independent of each other, allowing existing classifiers to be applied to classification tasks without significant modification. In this article, our focus is on a data-level approach for addressing the challenges posed by imbalance data. We employ existing classifiers for classification purposes while leveraging techniques to handle the imbalance in the data set.
Classification of imbalanced data has seen widespread use of downsampling and oversampling techniques. Downsampling involves randomly eliminating samples from the majority class, which may result in the loss of valuable information contained within these removed samples. Conversely, in oversampling techniques, samples from the minority class are randomly selected and added repeatedly to the training data, potentially leading to overfitting. Recognizing the limitations of downsampling and oversampling, researchers have proposed methods to generate synthetic data instances using samples from the minority class for imbalance handling. Notable among those methods is SMOTE (synthetic minority oversampling technique) 9 and its variants, which are introduced in the next section of this article. Many publications have demonstrated the effectiveness of these synthetic data generation methods in addressing class imbalances. These methods have been shown to frequently outperform traditional downsampling and oversampling techniques. 5 Therefore, our focus in this article is on oversampling techniques that generate synthetic data instances utilizing samples from the minority class.
Many real-world data sets exhibit not only class imbalance but also class overlap. Class overlap occurs when the samples from two classes share similar features but have different class labels, making it difficult to separate them. When a data set is both highly imbalanced and overlapped, the combined effect of these two factors becomes more intricate.10,11 In such cases, defining the decision boundary for classification becomes difficult, and traditional classifiers are prone to misclassifying the minority class samples in the overlapping area as belonging to the majority class. As a consequence, the classification boundary tends to shift toward the minority class area, as depicted in Figure 1.
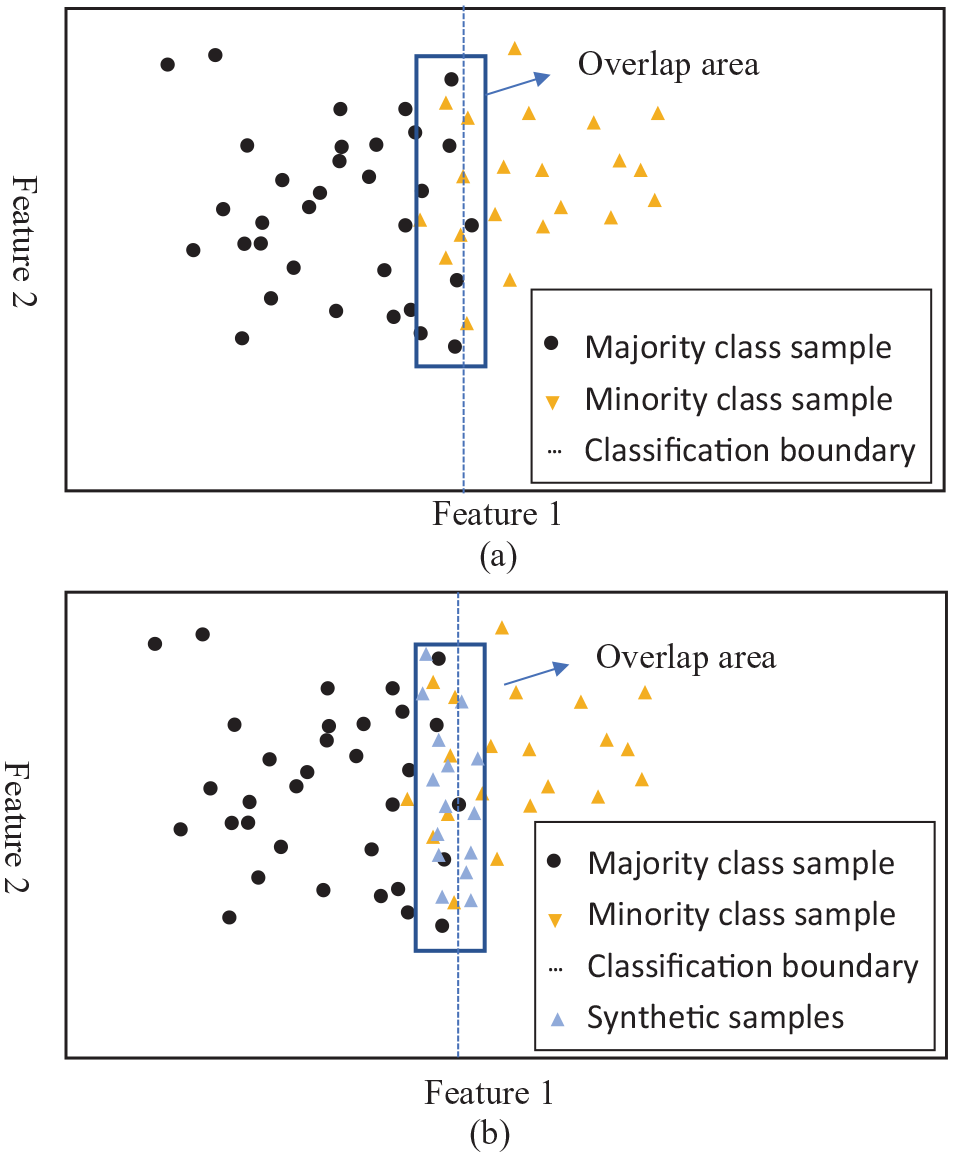
(a) The classification boundary of the original data set. (b) The classification boundary after changing the class overlap distribution.
Most existing approaches have been designed to address either class imbalance or class overlap independently. However, in numerous real-world applications, these problems coexist, and data sets often exhibit higher imbalance and overlap ratios.12,13 A comprehensive review and analysis of previous studies on imbalance and class overlap can be found in Vuttipittayamongkol et al., 11 and Santos et al. 14 The analysis concluded that class overlap can have varying degrees of negative impact on classification results, whereas imbalance does not always have such an effect. However, when imbalance and class overlap are present simultaneously, the influence of class overlap becomes more pronounced. Consequently, studying data sets that are highly imbalanced and highly overlapped holds significance importance.
In this article, we propose a novel quantum-based oversampling method (QOSM) that addresses the challenges of data imbalance and overlapping simultaneously, with the goal of improving classification performance. QOSM utilizes cover structures to describe the data distribution and determine the decision boundary of the classification. Specifically, it focuses on changing the minority class distribution in the overlapping area. Each cover is represented by its center and radius.
Existing cover construction algorithms (CCAs) 15 often rely on random selection of cover centers, which may not be suitable, especially in the overlapping area. To tackle this limitation, we introduce the principles of quantum theory to describe the data distribution and determine cover centers. In quantum theory, the distribution states of microscopic particles within an energy field are determined by their energy levels. Particles with low potential energy exhibit increased stability and tend to cluster together. In the context of data analysis, we apply the concept of “quantum potential” to characterize data samples. This potential energy field is computed based on the distances or similarities between data samples. Quantum potential theory offers a distinctive approach to address clustering or covering challenges because it takes into account the intricate interactions and relationships among data points, inspired by principles from quantum mechanics. Motivated by these observations and the pioneering work of Horn, 16 we leverage quantum potential theory to optimize the process of determining cover centers in the CCA. In this approach, each data sample is analogously treated as a particle, and the particular samples with zero or minimum potential energy are considered central and are surrounded by more neighboring samples, making them suitable candidates for cover centers or cluster representatives.
QOSM aims to tackle the main cause of boundary migration in the classification of highly imbalanced and overlapped data. By increasing the number of minority class samples in the overlapping region, it can alter the minority class distribution, and partially shift the classification boundary toward the majority class, as illustrated in Figure 1(b). This method effectively addresses class overlapping while simultaneously reducing the IR. We expect that the oversampling method with quantum-based cover construction will improve classification accuracy for highly imbalanced and overlapped data.
The main contributions of this article are as follows:
We propose a novel quantum-based oversampling method for the classification of highly imbalanced and overlapped data.
The CCA is improved by incorporating the quantum potential energy theory, which better captures the spatial distribution of data in the overlapped area.
We demonstrate the superiority of QOSM over the state-of-the-art sampling methods through experiments on several extremely imbalanced and overlapped real-world data sets.
Related work
Several factors significantly impact the performance of classification on the imbalanced and overlapped data, including IR, the degree of overlap, the quantity of training samples, the ratio of noise samples, and the severity of intraclass sub-aggregation. Data-level sampling methods aim to mitigate the influence of these factors and improve classification performance. SMOTE 9 is a conventional oversampling method used to reduce the IR by synthesizing new minority class instances between existing minority class samples. However, SMOTE has limitations, such as potentially generating mislabeled synthetic samples and increasing the risk of class overlap, especially in data sets containing noise. Consequently, learning from data sets processed by SMOTE often leads to a higher false prediction rate. 17 To address these issues, several variants of SMOTE have been developed. Han proposed the borderline-SMOTE method, 18 which focuses on oversampling borderline samples under the assumption that samples located in the boundary areas between the two classes play a more crucial role in classification. He et al. 19 introduced the ADASYN (Adaptive Synthetic) method, which adaptively synthesizes new instances by considering the density distribution information of minority class samples. Clustering-based methods, such as Cluster_SMOTE 20 and DBSMOTE 21 take into consideration dense or sparse subclusters of minority and majority instances.
Class imbalance generally has a detrimental effect on classification performance. Existing methods for addressing this problem can be categorized as follows. One approach involves using a kernel function to map the original data to a high dimensional feature space, aiming to increase the separability between classes. 22 Another category of methods focuses on addressing class overlap through data cleaning techniques, such as SMOTE + ENN (Edited Nearest Neighbors) and SMOTE + TomekLinks. 23 In the SMOTE–ENN algorithm, synthetic instances are generated using SMOTE based on the minority samples. The class label of each synthetic instance is compared with the majority vote of its k-nearest neighbors (KNNs). Only the instances with consistent class labels are retained. Our previous work also demonstrated that the removal of mislabeled instances in SMOTE–ENN can improve the classification accuracy. 3 Vuttipittayamongkol proposed a neighborhood-based undersampling framework for handling class imbalance in binary data sets, which involves removing potentially overlapping data points and enhancing the visibility of minority class instances. 12 Another interesting approach involves detecting overlapping regions and employing different strategies for classification in these regions. 24 However, these methods may lead to the loss of important information in datasets due to undersampling or fail to fully leverage the distribution and data structure within the overlapping region.
In recent years, there has been significant research activity in developing and improving quantum-based methods for clustering and classification. Quantum clustering methods were initially introduced by Horn and Gottlieb 16 who drew inspiration from the observation that data points in a feature space can be associated with a Schrödinger equation, where the potential is determined by the data. Weinstein and Horn 25 further advanced this approach by developing a dynamic quantum clustering method using a time-dependent Schrödinger equation. Scott et al. 26 demonstrated that quantum mechanics serves as the foundation for several useful data clustering methods. Maignan and Scott 27 explored the mathematical task of finding all the roots of the exponential polynomial corresponding to the minima of a two-dimensional quantum potential and established that, if the points are contained within a square region of a specific size, there exists only one minimum. Decheng et al. 28 introduced a distance measure that enhances quantum clustering analysis by projecting non-spherical overlapping data in the Euclidean space onto a weighted Euclidean space, effectively creating non-overlapping data. Tian et al. 29 proposed a quantum clustering ensemble (QCE) technique derived from quantum mechanics, offering another approach to clustering tasks. Quantum clustering has also been successfully applied in data mining applications, such as outlier detection and text analysis. 30 Li and Kais 31 presented a quantum algorithm for data classification based on the nearest neighbor learning algorithm. These methods have demonstrated the potential of quantum approaches in clustering and classification tasks. However, these existing methods directly applied the quantum theory for clustering and classification, without specifically addressing the challenges posed by the imbalance and overlapping data sets. Our QOSM takes a different approach by utilizing quantum theory to construct optimal covers from overlapped data. These covers are then employed to oversample the imbalanced data sets, effectively addressing both imbalance and overlap. Notably, our novel oversampling method is independent of classifiers, allowing for the applications of various advanced classification methods in subsequent classification tasks.
Materials and methods
We introduce a novel quantum-based oversampling method designed specifically for highly imbalanced and overlapped data in classification tasks. Our approach utilizes CCA,15,32 to create a set of disjoint covers that represent the data distribution. Each cover consists of a center and radius, and samples within a cover share the same class label. While CCA provides a foundation for exploring spatial characteristics, the selection of cover center is traditionally random, which may lead to suboptimal classification performance, especially for highly imbalanced and overlapped data. To address this, we improve the cover center selection by ranking the quantum potential energy of each sample, resulting in more representative covers. Subsequently, we utilize these optimized covers to investigate the sample distribution, with a particular focus on identifying minority class samples in the overlapping area.
Our approach considers both individual sample relationship and cover relationships to capture the data set’s sample distribution. Initially, we apply the improved cover construction method to the original data set, taking into account the distribution characteristics of each individual sample. In our approach, we partition the minority class sample space into a set of covers, while also dividing the majority class samples into their respective covers. Our subsequent step involves identifying the minority class covers within the overlapping area. Typically, samples located in the regions of class overlap and the boundary region between classes are more susceptible to misclassification. The address this, we employ the KNN method to explore the distribution relationship between covers and extract the minority class covers situated in the overlapping area. Once the relevant covers are identified, we perform oversampling on the samples belonging to the minority class covers, generating synthetic instances to address the data imbalance. For a more detailed understanding of our approach, in the following subsections, we provide an overview of the CCA that outlines the process of cover construction, a discussion of quantum potential theory that explains its role in optimizing cover selection, and the technical details of our proposed QOSM that encompasses the steps involved in identifying minority class covers in the overlapping area and conducting oversampling to generate synthetic instances.
Cover construction algorithms
CCAs play an important role in our proposed method. CCA is a domain construction algorithm that constructs covers based on the distance between samples. 15 Each cover consists of multiple samples and is characterized by a cover center and cover radius. These covers exhibit the following characteristics: (1) samples within the same cover share the same class label; (2) if samples with the same label exhibit significant differences, they are assigned to separate covers; and (3) samples belonging to different categories cannot be projected onto the same cover.
To provide an overview of the CCA, let us consider an input data set
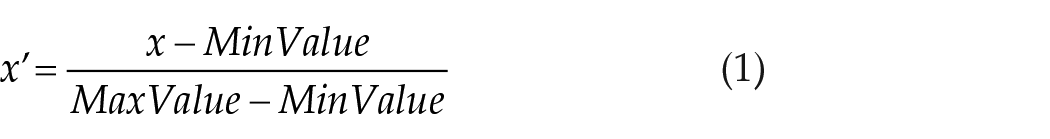
Step 1: Data normalization
Normalize the feature values of each sample to [0,1] using the max–min normalization technique, as shown in equation (1):
Step 2: Projection
Projecting the data set
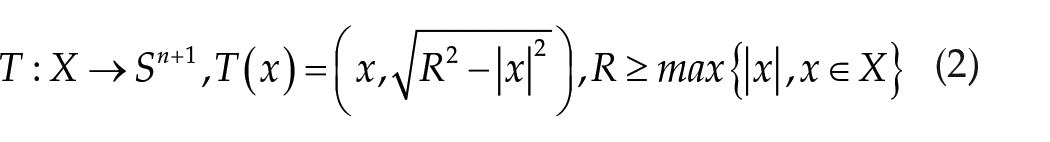
where
Step 3: Cover construction
Each cover is determined by a cover center

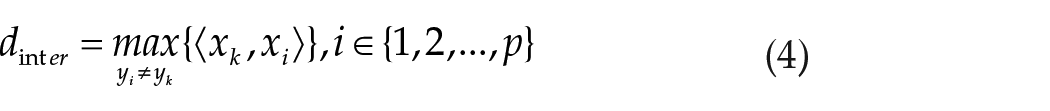
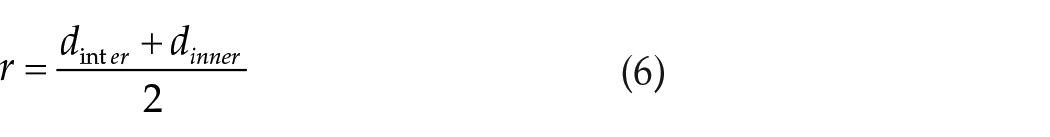
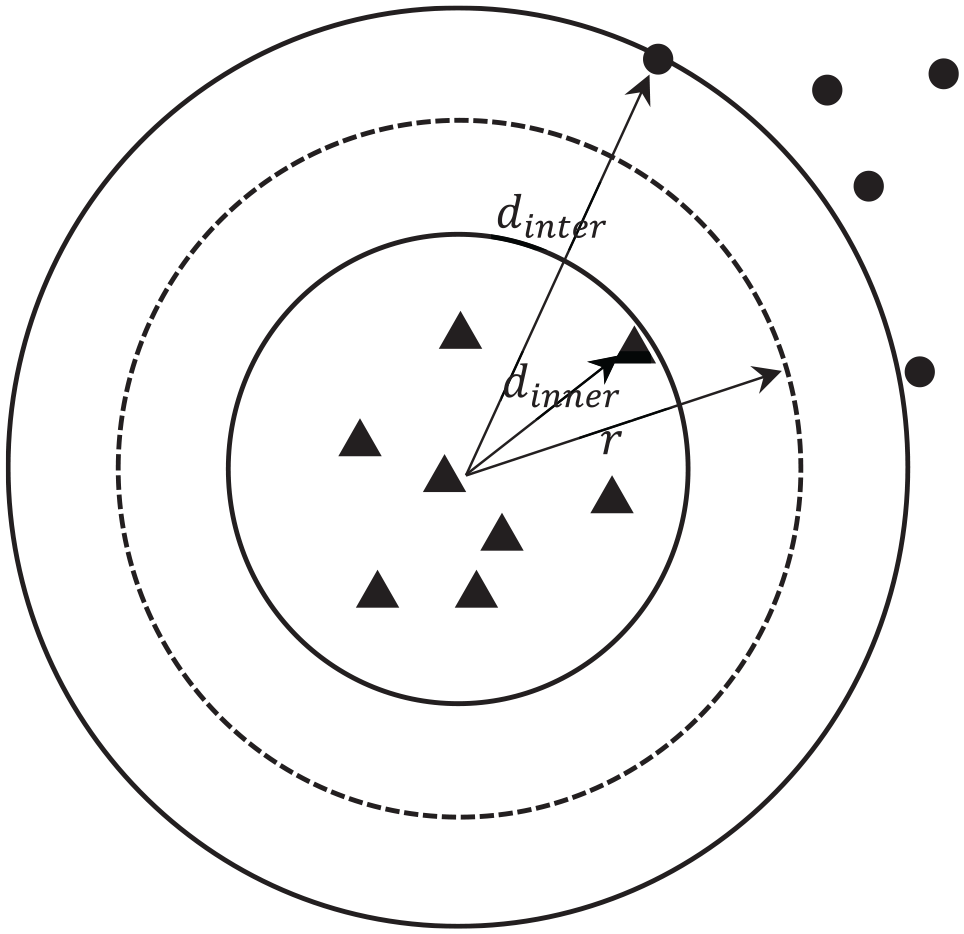
Calculating the cover radius
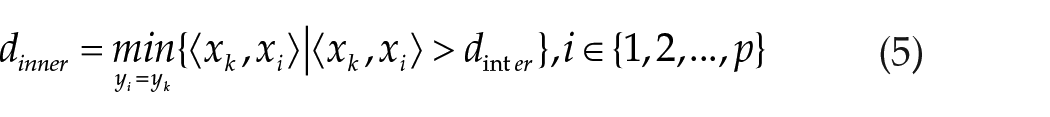
In equation (4), the maximum inner product, which represents the minimum distance from samples between different classes. Here,
Step 4: By iterating Step 3, we continue constructing covers until all samples in the data space are covered.
Quantum potential theory
In our proposed method, we leverage the theory of quantum potential energy in the cover construction process to improve the selection of cover centers. This subsection introduces the relevant theory of quantum potential energy and describes how the potential energy of each sample is calculated.
In the field of quantum mechanics, 33 a wave function represents the quantum state of a particle. Traditionally, the Schrödinger equation is solved to determine the particle distribution in various potential fields to obtain the corresponding wave function. The time-independent Schrödinger equation is given by:
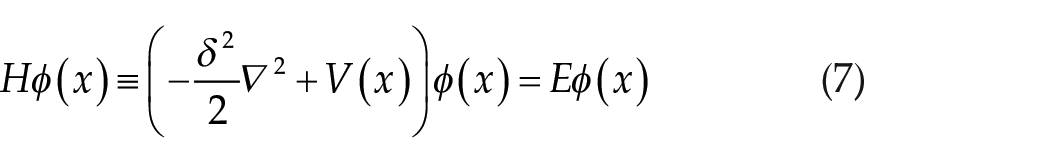
where
With the known wave function, we can determine the quantum potential function
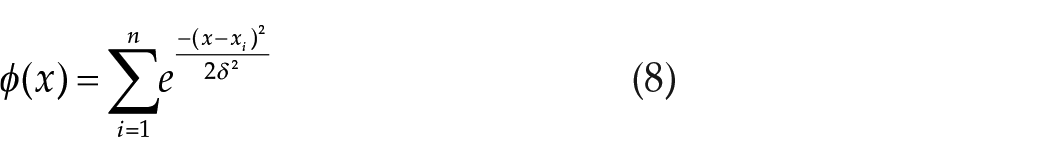
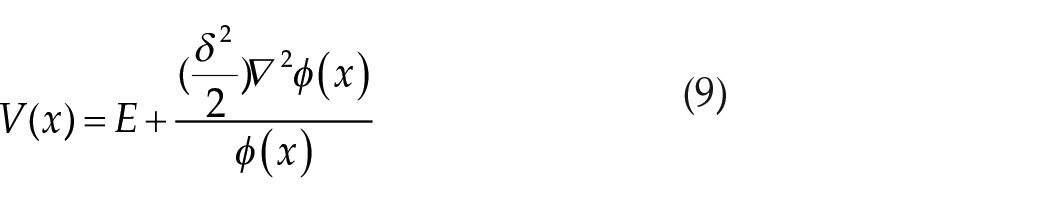
By substituting equation (8) into equation (9), the potential function
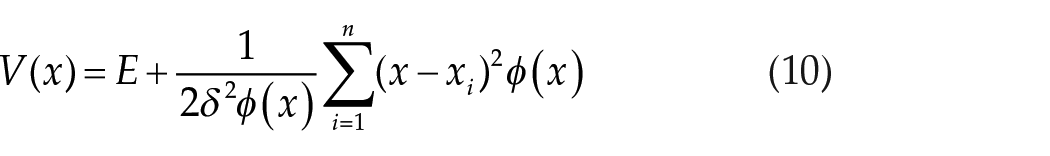
Hence, the potential of each sample can be calculated precisely. Consequently, the center of the cover is determined by the sample with the minimum potential energy.
Quantum-based oversampling method
The proposed QOSM aims to address the bias in the classification boundary by modifying the distribution of the minority class samples in the overlapping regions, thereby improving classification performance. The method involves three stages: cover construction, identification of minority covers in the overlapping area, and oversampling.
In the cover construction stage, the spatial distribution of the original data set is determined based on the relationship between individual samples. Both the minority- and majority-class cover sets are created, where each cover represents a group of samples with the same class label. The center of each cover is determined by selecting the sample with the minimum quantum potential energy calculated by equation (10).
In the second stage, the KNN method is employed to explore the distribution characteristics between covers at a finer granularity. QOSM leverages the cover properties to investigate the spatial relationships of covers. This analysis allows for the identification of minority class covers located in the overlapping area.
Finally, oversampling is applied to the samples belonging to the minority class covers identified in the second stage. This increases the sample size of the minority class in the overlapping area, resulting in a balanced data set. The technical details are presented in the following subsections.
Constructing covers using sample quantum potential energy
The construction of covers is based on the characteristics of the sample space. Each cover comprises two crucial parameters: the cover center and cover radius. The principle underlying cover construction is to gather more samples with the same label around the cover center, ensuring high similarity among these samples. In CCA, the cover center is selected randomly, and different choices of cover centers yield varying coverage areas. Consequently, the output of CCA is greatly influenced by the cover center selection. Improper selection of the cover center plays a critical role in the overall learning process.
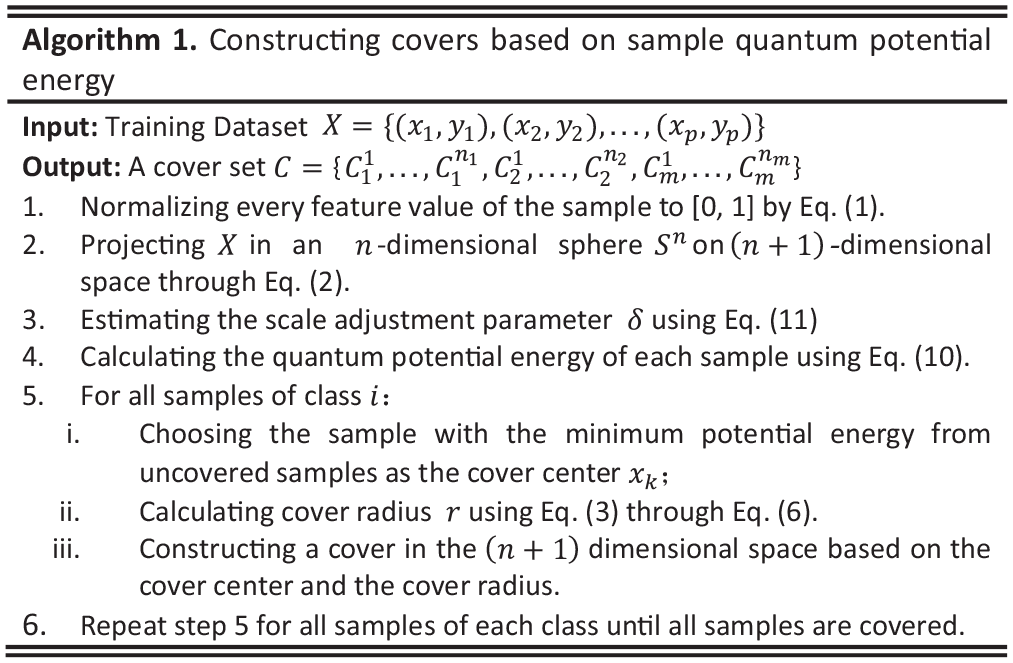
The proposed QOSM address this issue by selecting cover centers based on quantum theory, aiming to construct cover sets that align better with the sample distribution. For all samples with known class labels in the training data set, the potential energy of each sample is calculated using the method described in previous sections. Then, for all uncovered samples with the same class label, the sample with the lowest potential energy of this class is selected as the center used to construct the cover. The remaining uncovered samples of the same class are also used to construct covers in a similar manner until all samples are covered. The details of cover construction in our method are described in Algorithm 1 (Figure 3).
Cover construction algorithm.
In Step 3 of Algorithm 1, the scale adjustment parameter is estimated by equation (11) as described in the literature: 35

where
Figure 4(a) illustrates a given data set, and Algorithm 1 constructs a cover set for samples with the same label, as shown in Figure 4(b). In the figure, solid circles represent the covers of minority-class samples, while dotted circles represent the covers of majority-class samples. The algorithm maps an n-dimensional input vector to an (n + 1)-dimensional space, thus representing an (n + 1)-dimensional input vector covering problem. Different classes of inputs are covered by distinct sets of sphere neighborhoods. For binary classification, two cover subsets,
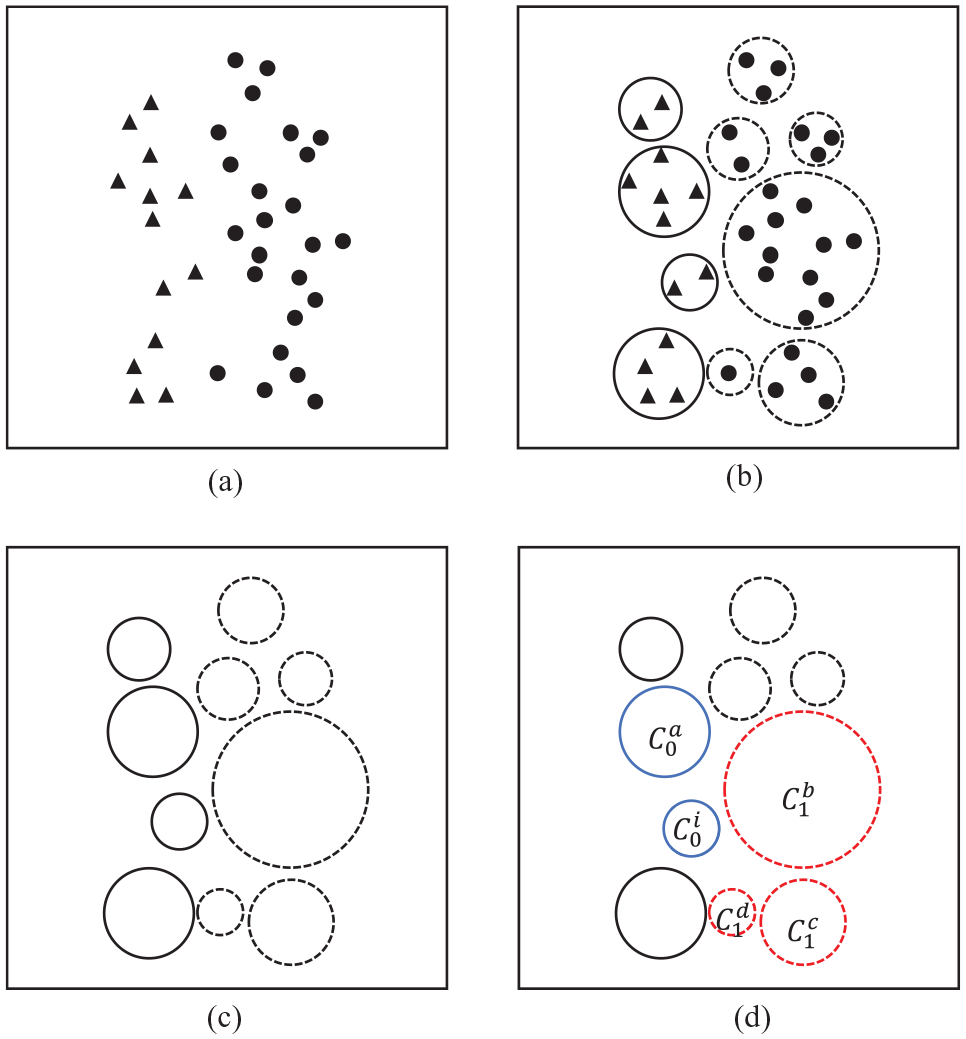
The process of finding minority class samples of the overlapping area. (“▲” represents minority class samples and “•” represents majority class samples.) (a) Original data set; (b) constructing two cover sets from minority and majority class samples; (c) constructed cover sets; (d)
Finding the minority covers in the overlapping area
The second stage of the proposed method focuses on finding the minority class covers in the overlapping area. The cover construction method described previously is applied to the input data set
If
If
If
To illustrate the process of identifying minority covers within the overlapping area, let’s consider an example. For a minority class cover
Oversampling in the overlapping area
The proposed QOSM incorporates oversampling of the minority class covers in the overlapping area. The goal is to ensure that the synthetic samples are distributed evenly within the overlapping region, thereby enhancing the representation of the minority class and expanding its area. The oversampling process follows these steps:
Calculate centroids,
Generate synthetic samples,
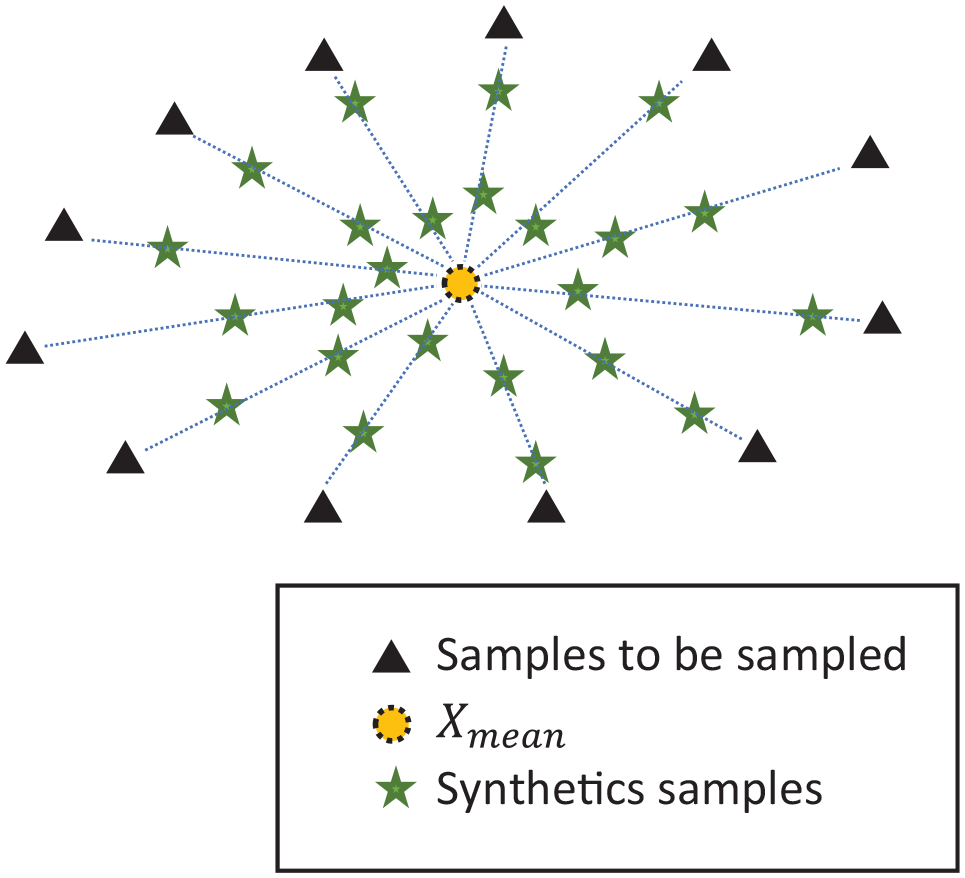
The process of oversampling in the overlapping area.
The number of synthetic samples generated for each minority sample is a parameter that can be determined on a case-by-case basis, considering factors, such as data characteristics (e.g. IR and maximum Fisher’s discriminant ratio maxF) and the desired IR after the oversampling process.
It is important to note that QOSM focuses on generating synthetic samples specifically in the overlapping area. By applying oversampling, the total number of samples in the minority class increases, which tends to balance the training set. Moreover, the distribution of the minority class within the overlapping region is altered. After addressing the issue of imbalance and overlap using QOSM, the traditional classification algorithms can be employed to build the models for further classification and prediction.
Based on the principle of minimizing overall error, the decision boundary will shift to some extent toward the majority class area, aiming to achieve higher accuracy in predicting the minority class samples in the overlapping area. QOSM seeks to achieve an improved balance between the classification of the minority and the majority class, thereby improving the overall classification performance. The oversampling of the minority class samples in the overlapping area increases the discriminative capability of the classifiers to some extent. The pseudo-code for the QOSM algorithm is presented in Algorithm 2 (Figure 6).
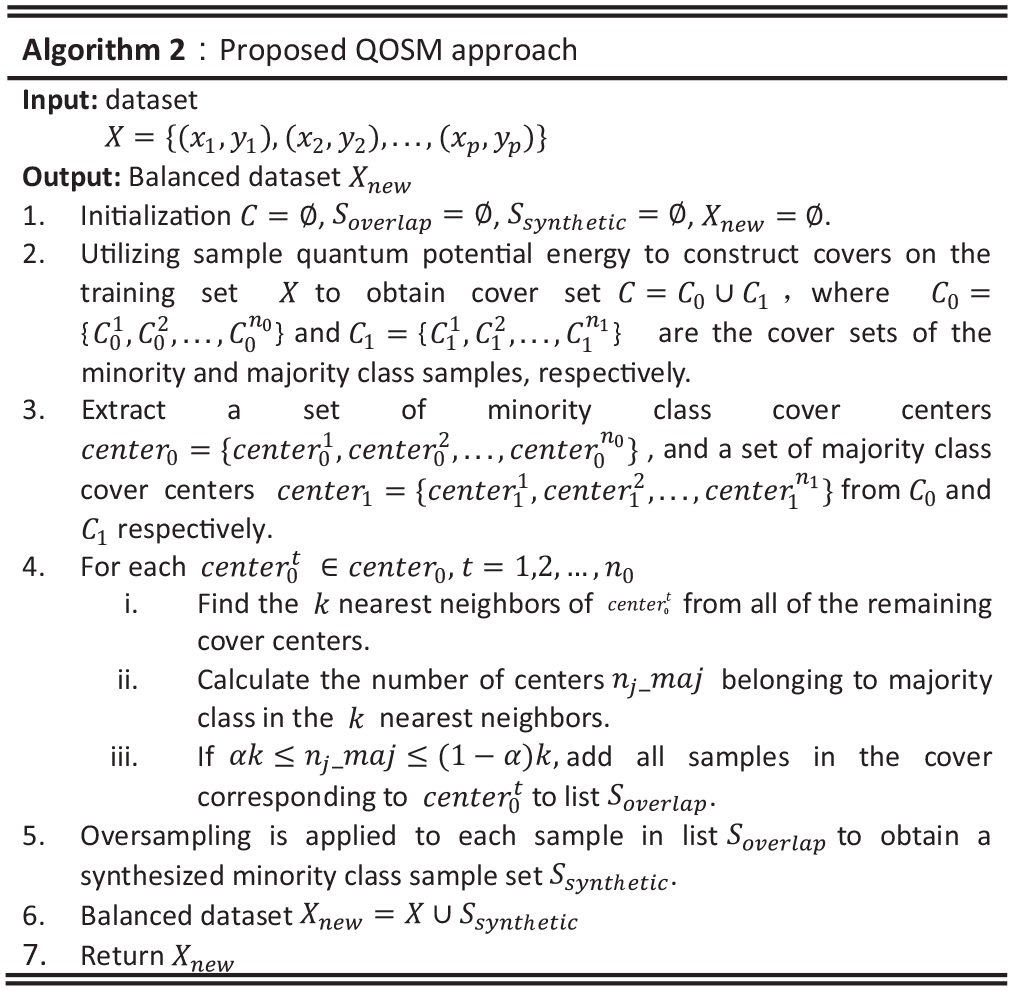
Algorithm of QOSM.
Results
Data sets
To validate the effectiveness of our proposed QOSM, we conducted experiments on 10 imbalanced and overlapped data sets from the KEEL repository website (https://sci2s.ugr.es/keel/imbalanced.php). These data sets are widely used for evaluating the performance of imbalanced classification algorithms. Table 1 provides a summary of these data sets, including their Abbreviation (Abb), Instances (Ins), Features (Fea), Minority Class Sample Proportion (%min), Majority Class Sample Proportion (%maj), IR, and maxF (the degree of overlap). Data sets are arranged in ascending order by the maxF value. A smaller maxF value indicates a higher degree of overlap. All 10 data sets exhibit high levels of class imbalance with IR values greater than 9, and significant overlap with maxF values less than 4.5. Among these data sets, only one exhibits a relatively low overlap, with a maxF value greater than 2.5, while the remaining nine data sets have maxF values below 2.5.
Data set description.
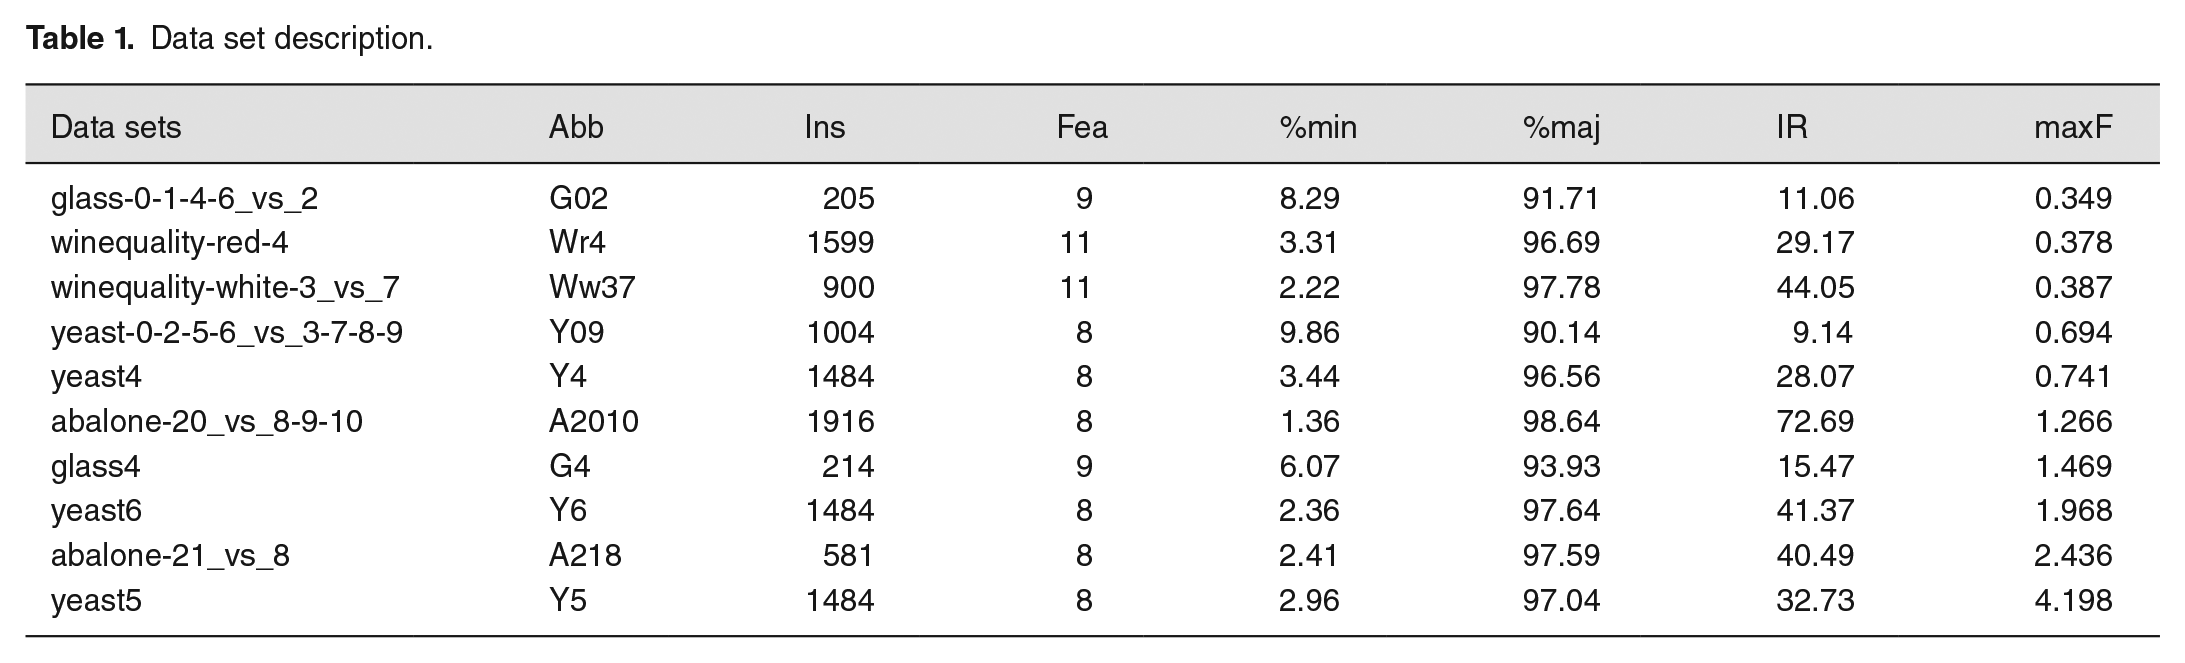
In Table 1, maxF is a measurement used to quantify the degree of overlap between classes.36,24 It calculates the maximum discriminant ratio achieved by Fisher’s method across all the dimensions of an object. Fisher’s discriminant ratio for a single dimension is defined as:
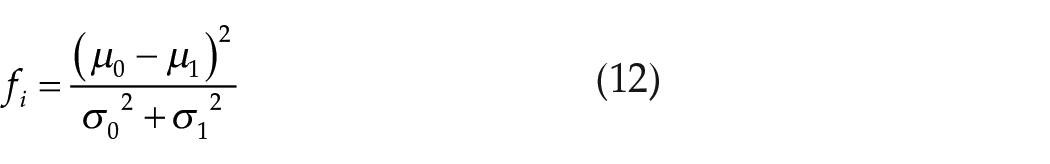
where

where maxF ranges from 0 to infinity, and a lower maxF value indicates a higher degree of overlap in the data set.
Evaluation metrics
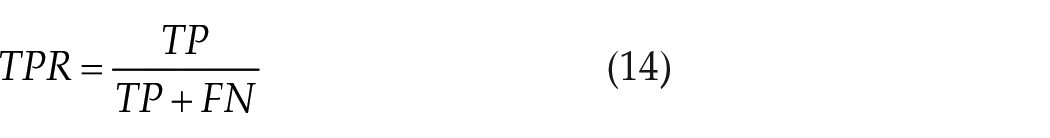
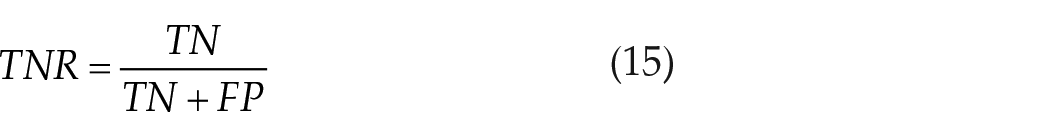
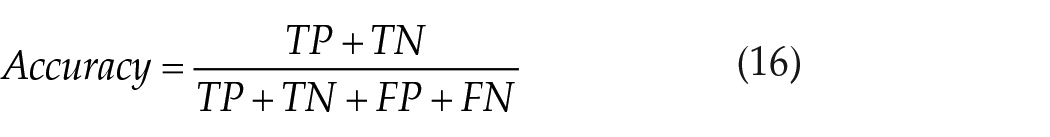
We employed three evaluation metrics to assess the performance of our proposed algorithm: F-measure, area under the receiver operator characteristic (ROC) curve (AUC), and G-mean. These metrics can be derived from the confusion matrix where the positive and negative classes represent the minority and majority classes, respectively. In the confusion matrix, TP represents the number of positive samples that are correctly classified as positive, FN represents the number of positive samples that are misclassified as negative, FP represents the number of negative samples misclassified as positive, and TN represents the number of negative samples that are correctly classified as negative. The evaluation metrics true positive rate (TPR), true negative rate (TNR), accuracy, precision, recall, F-measure, and G-mean are defined by equations (14) to (20), respectively.
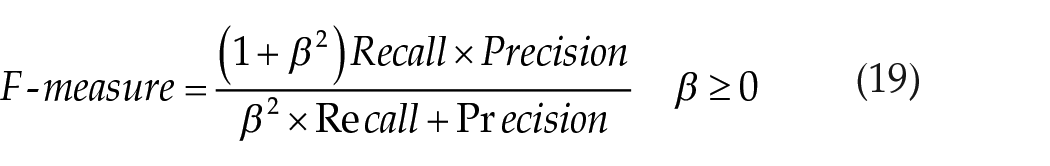

Generally, Precision and Recall exhibit an inverse relationship, where increasing one may come at the cost of reducing the other. F-measure provides a comprehensive measure by combining Precision and Recall, where β is the parameter used to adjust their relative importance. In our experiments, β is set to 1 making F-measure the harmonic mean of Recall and Precision. In addition, we employed G-mean as an evaluation metric, which represents the geometric mean of the classification accuracy of positive and negative samples. The ROC curve can be drawn by plotting the TPR against the false positive rate (FPR) at various threshold settings, where TPR and FPR can be calculated based on the confusion matrix. The ROC value, ranging from 0 to 1.0, indicates the overall performance of an algorithm. A higher ROC value signifies superior overall performance.
Comparison experiments and analysis
We conducted three sets of experiments to evaluate the effectiveness of our proposed method. The first set aimed to validate the performance improvement of three traditional base classification algorithms when QOSM is used, as illustrated in Figure 7 and reported in Table 2. The second set of experiments aimed to verify the effectiveness of the improved constructive covering algorithm based on quantum potential energy, and the results are presented in Table 3. Finally, we compared the performance of our QOSM with three other oversampling methods, and the results on three base classifiers (SVM, KNN, and BN) are reported in Tables 4 to 6.
The average F-measure, AUC, and G-mean on the 10 data sets using three classifiers with and without QOSM.
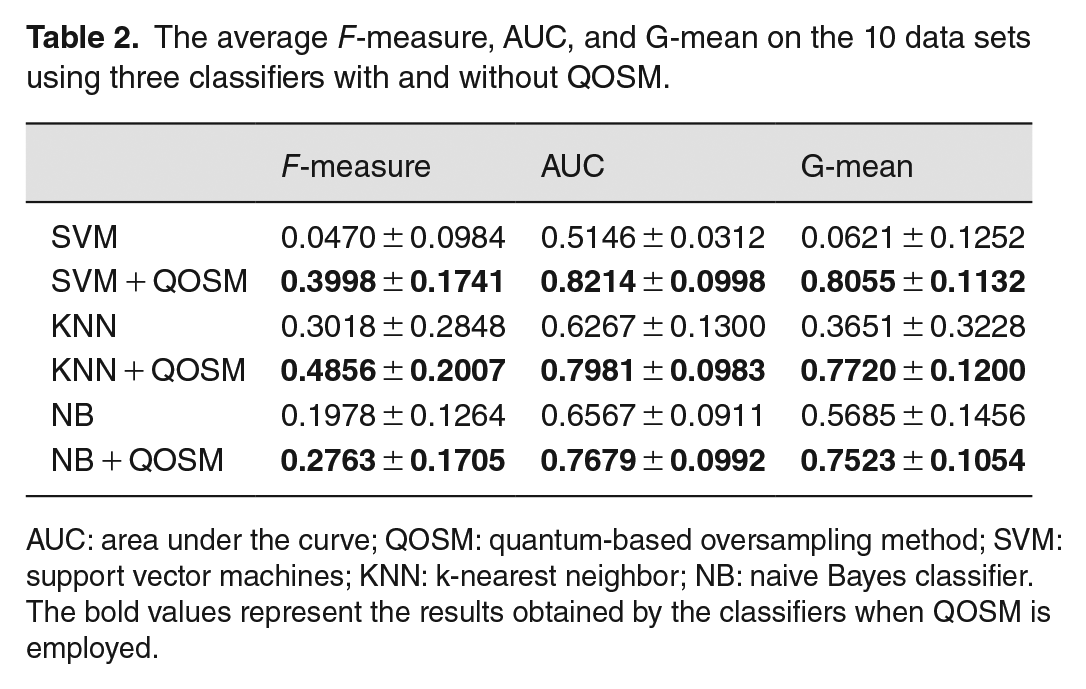
AUC: area under the curve; QOSM: quantum-based oversampling method; SVM: support vector machines; KNN: k-nearest neighbor; NB: naive Bayes classifier.
The bold values represent the results obtained by the classifiers when QOSM is employed.
F-measure, AUC, and G-mean values of QOSM and ROSM methods using SVM, KNN, and NB classifiers.
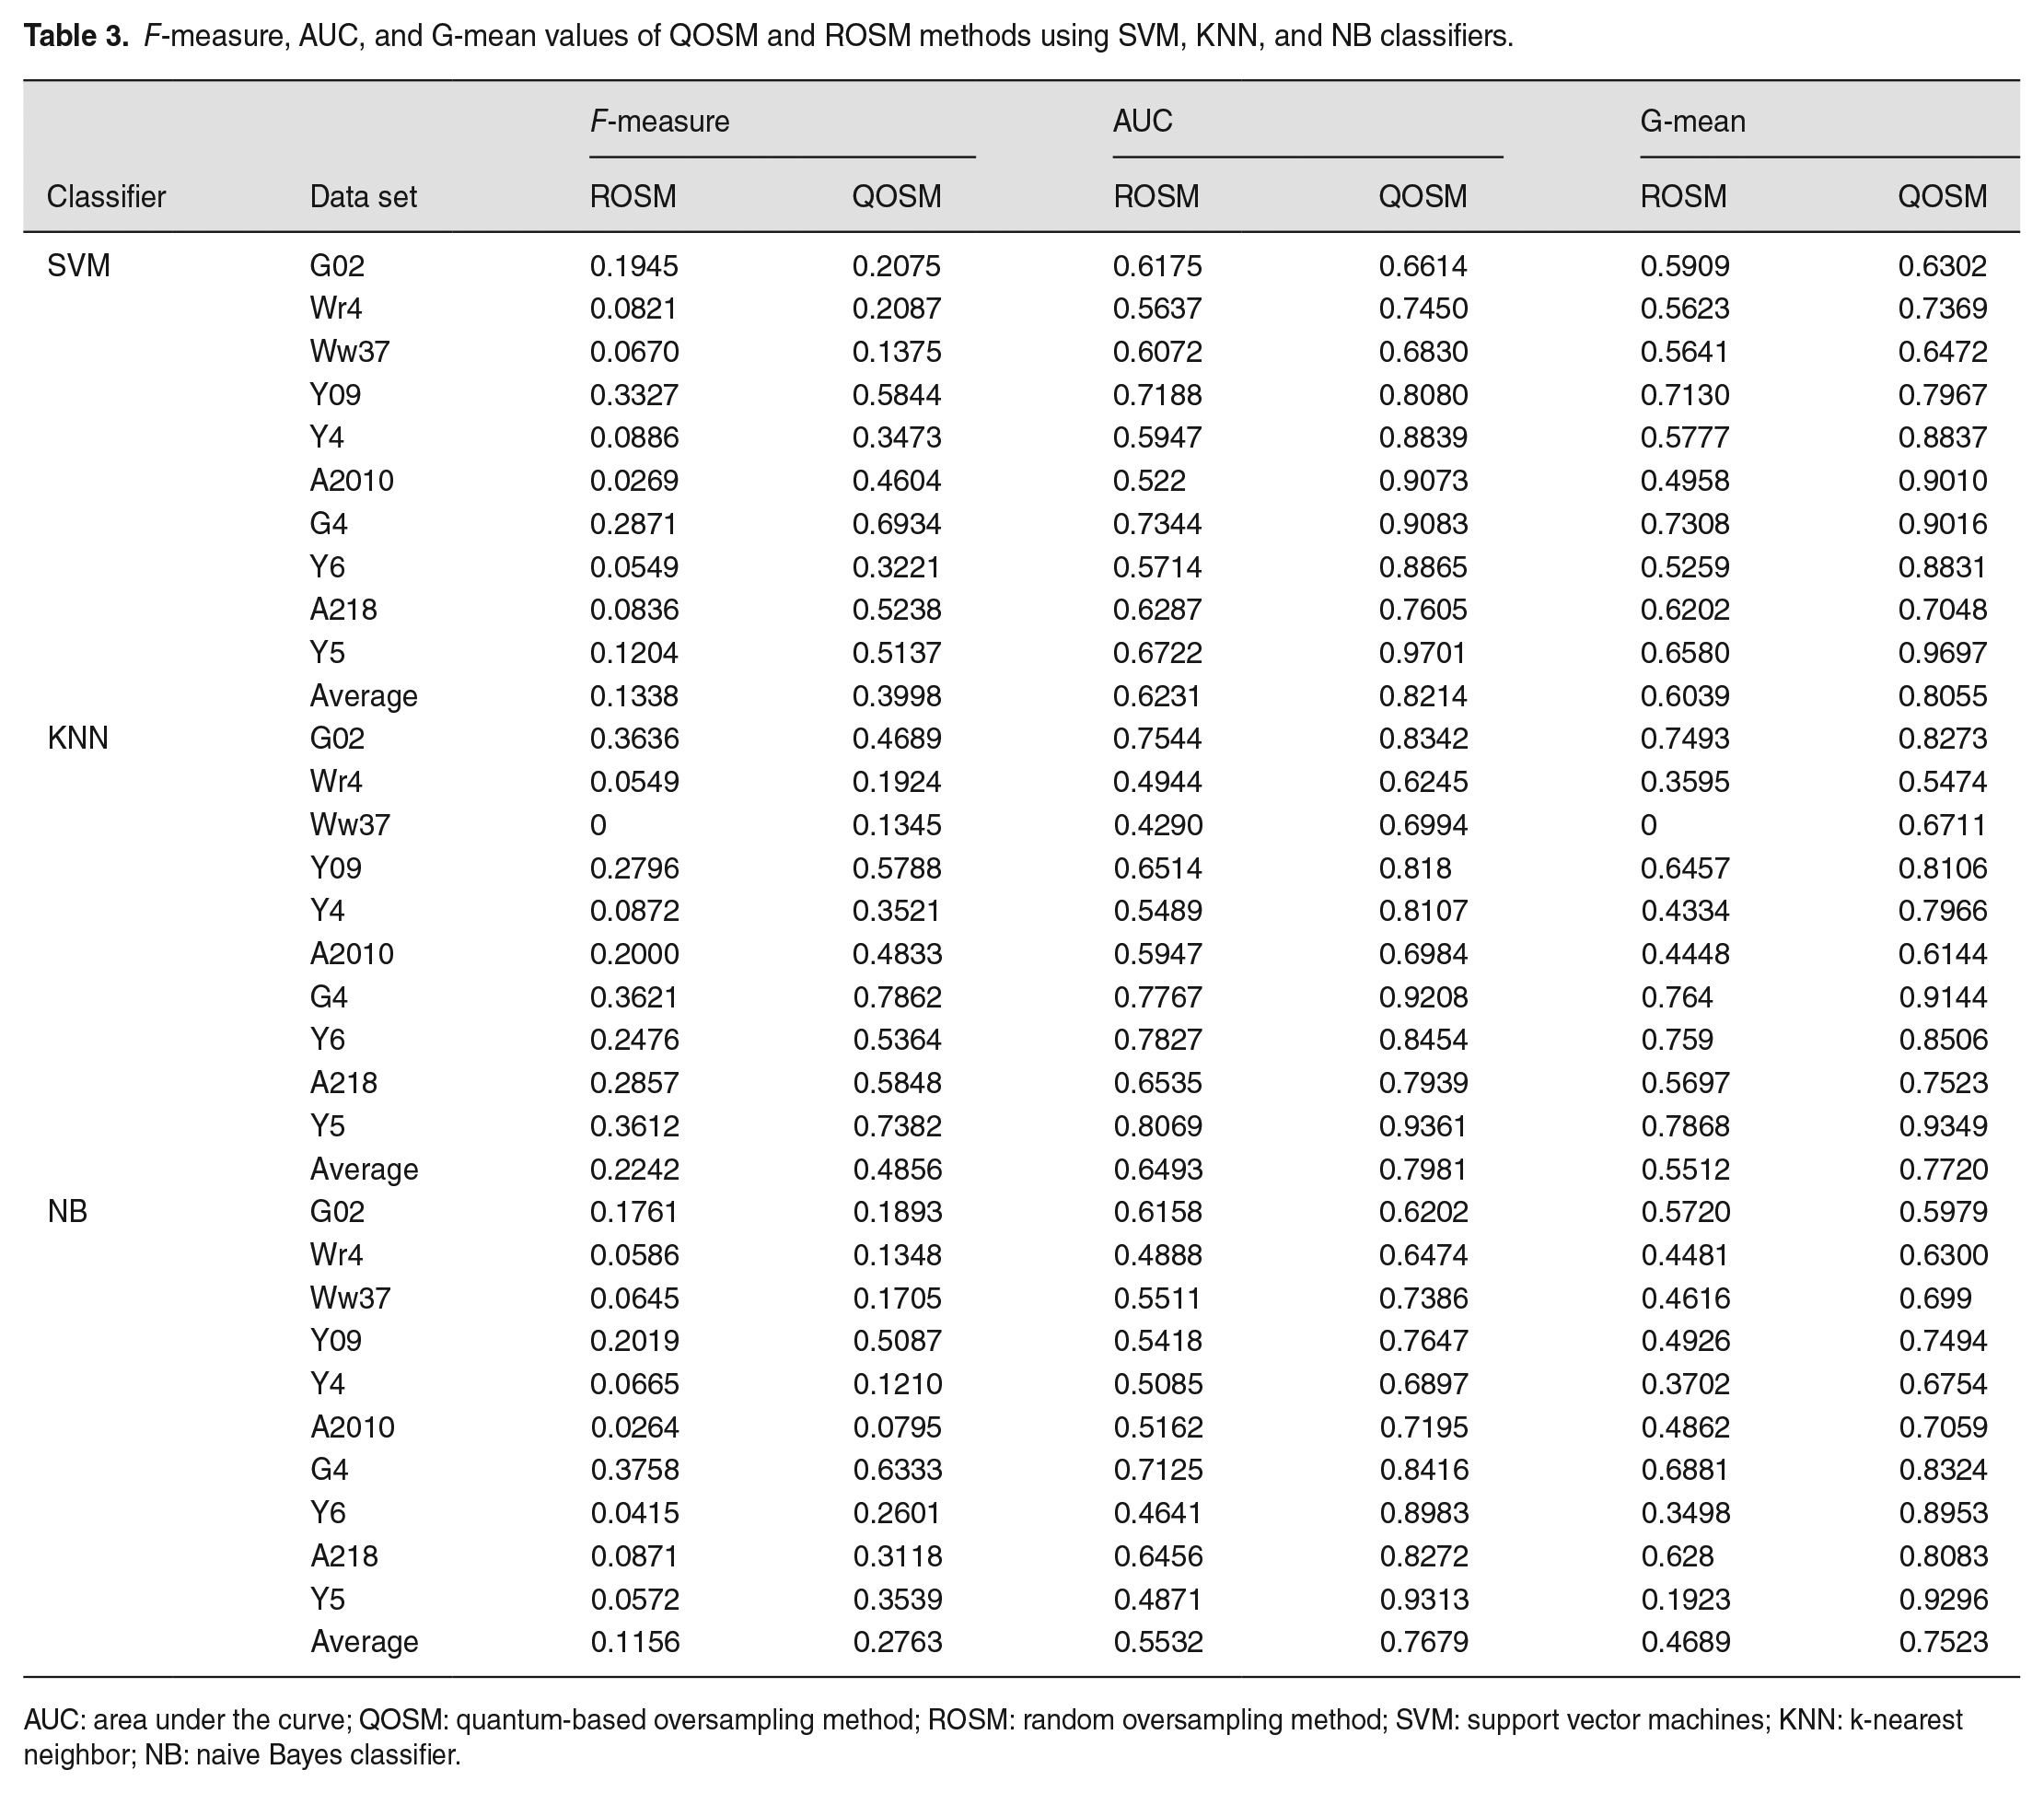
AUC: area under the curve; QOSM: quantum-based oversampling method; ROSM: random oversampling method; SVM: support vector machines; KNN: k-nearest neighbor; NB: naive Bayes classifier.
F-measure, AUC, and G-mean values of each oversampling method using SVM.
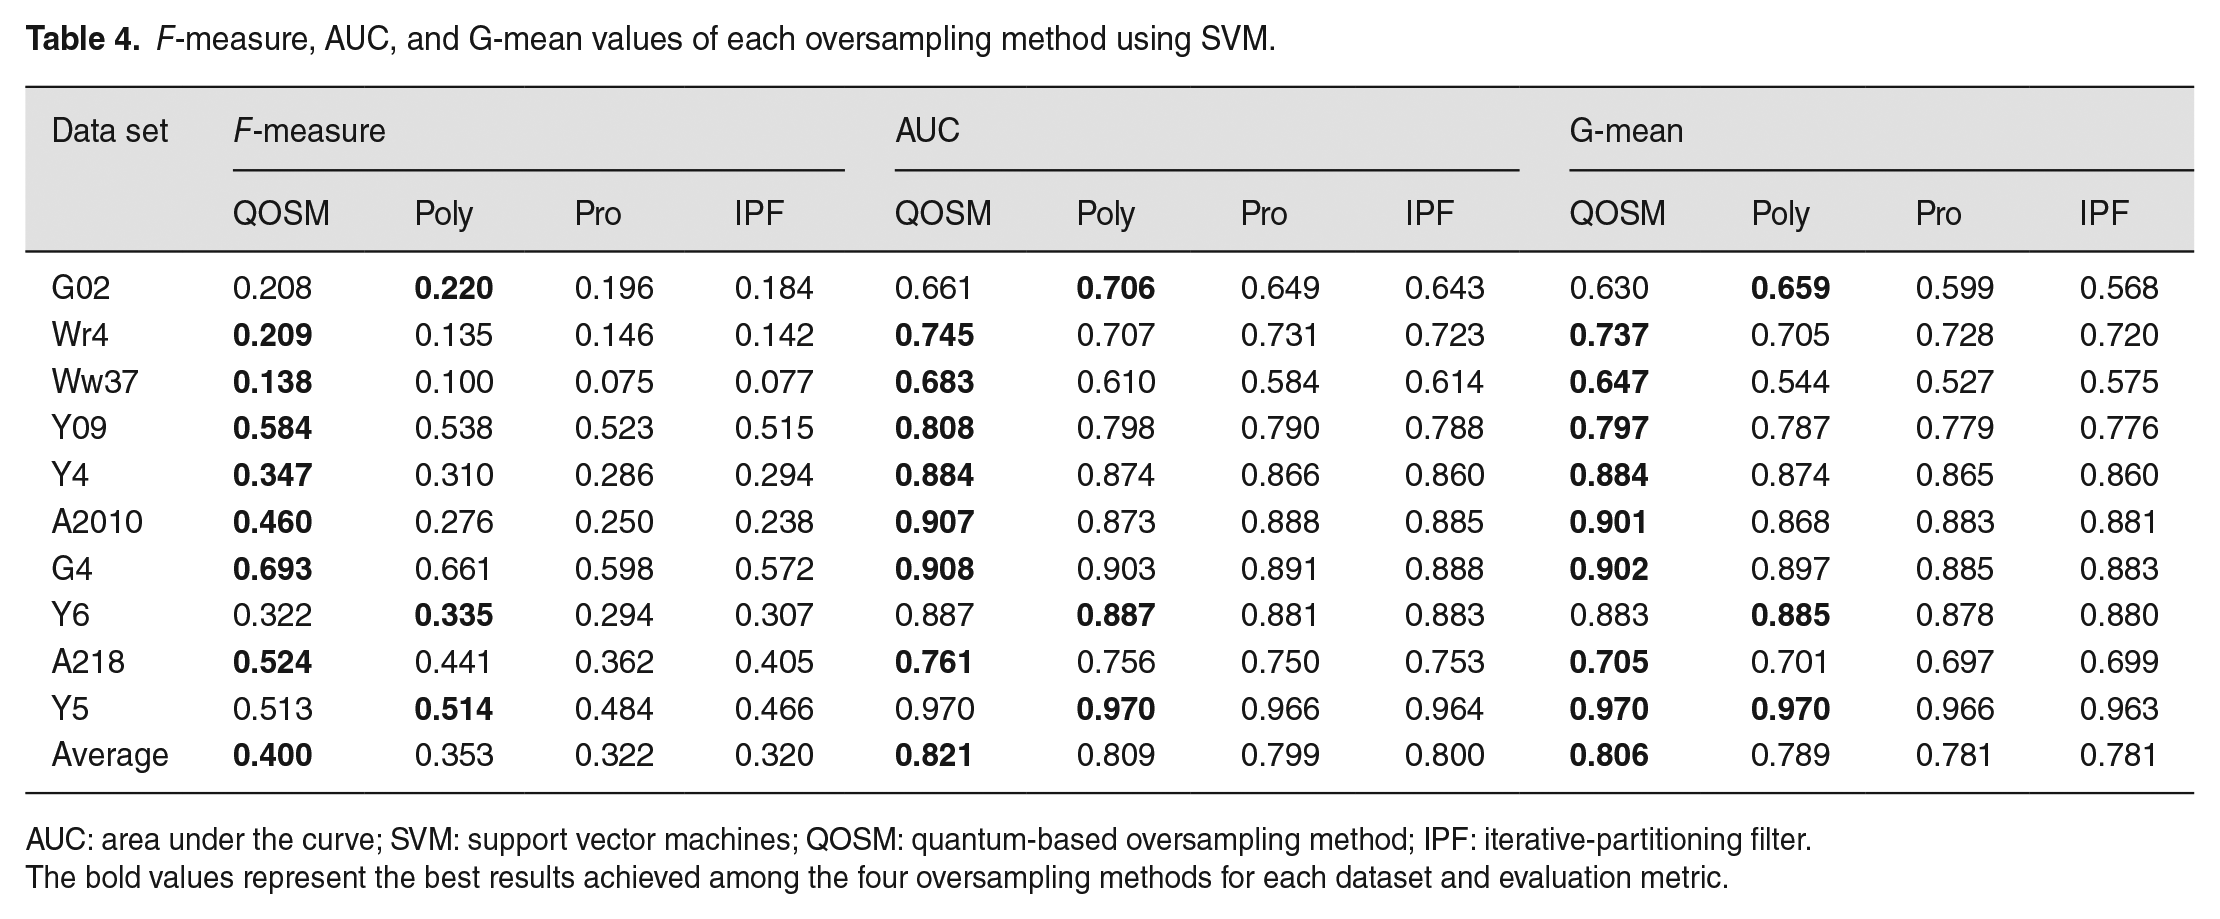
AUC: area under the curve; SVM: support vector machines; QOSM: quantum-based oversampling method; IPF: iterative-partitioning filter.
The bold values represent the best results achieved among the four oversampling methods for each dataset and evaluation metric.
F-measure, AUC, and G-mean values of each oversampling method using KNN.
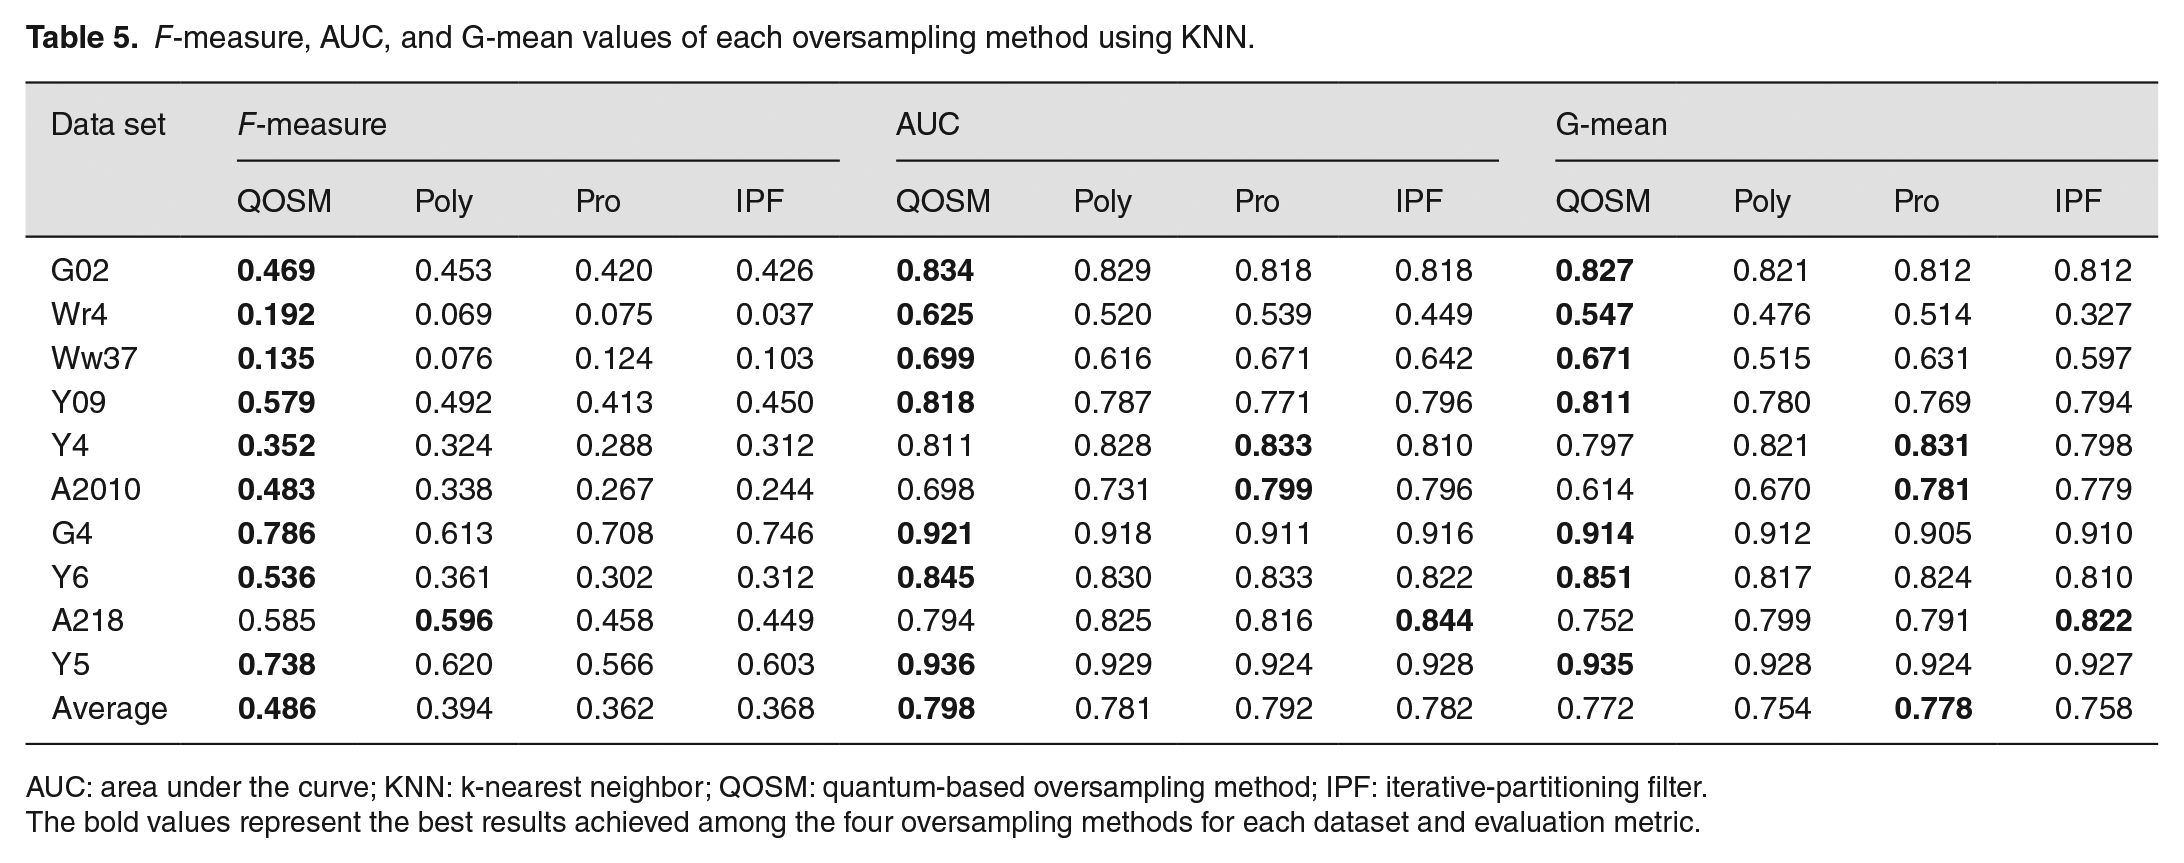
AUC: area under the curve; KNN: k-nearest neighbor; QOSM: quantum-based oversampling method; IPF: iterative-partitioning filter.
The bold values represent the best results achieved among the four oversampling methods for each dataset and evaluation metric.
F-measure, AUC, and G-mean values of each oversampling method using NB.
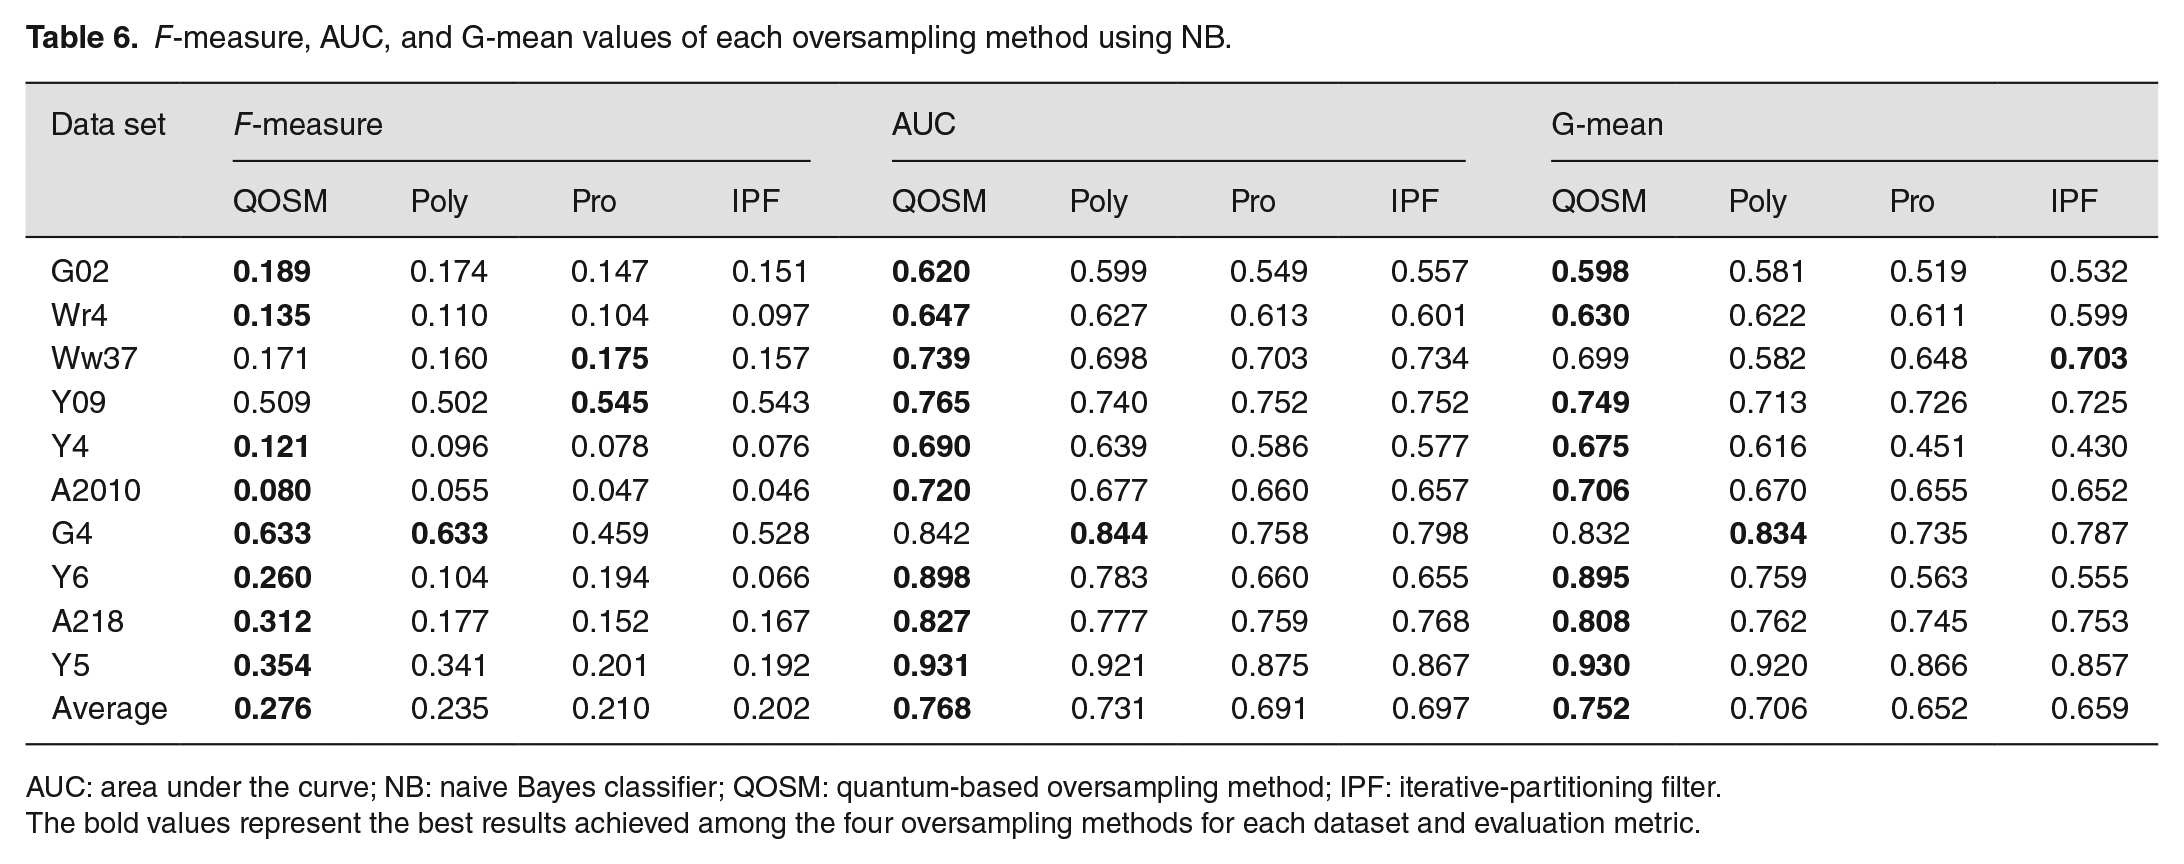
AUC: area under the curve; NB: naive Bayes classifier; QOSM: quantum-based oversampling method; IPF: iterative-partitioning filter.
The bold values represent the best results achieved among the four oversampling methods for each dataset and evaluation metric.
It is important to note that, in QOSM, the step of finding the
Our work primarily focuses on the oversampling methods rather than the classification algorithms themselves. Therefore, we utilized three widely used classifiers, namely, SVM, 37 KNNs, and NB, 38 as the base classifiers in our experiments. These classifiers were implemented using the scikit-learn machine learning library in Python, with their default parameter settings. In our experiments, the data sets are partitioned into training and testing sets at an 80–20% ratio, and five-fold cross-validation was employed for model selection. The models were evaluated using F-measure, AUC, and G-mean metrics. The results of three sets of experiments are presented and analyzed in detail in the following three subsections.
Classification performance with and without QOSM
To demonstrate the effectiveness of QOSM, we applied it to oversample 10 highly imbalanced and overlapped data sets. Then, we used three base classifiers to classify the oversampled data and compared the results with the classification performance on the original data sets without utilizing QOSM. Table 2 reports the average F-measure, AUC, and G-mean values, along with their corresponding standard deviation, obtained by three traditional classifiers with and without QOSM on the 10 data sets. It is evident that SVM performs poorly when not using QOSM, with an F-measure of only 0.047 and an AUC of 0.5145. This demonstrates the sensitivity of SVM to data sets that are both imbalanced and overlapped, as the support vectors in SVM struggle to be determined within the overlapping area. However, when QOSM is applied, SVM’s F-measure and AUC significantly improve to 0.3998 and 0.8214, respectively. The results indicate that, after QOSM oversampling, the average F-measure, G-mean, and AUC increased across all three classifiers. Specifically, for KNN, the average F-measure, G-mean, and AUC improved by 18.38, 40.69, and 17.14%. Using SVM, the corresponding improvements were 35.28, 73.34, and 30.68%, whereas for NB, they were 7.85, 18.38, and 11.12%, respectively. It is important to note that these improvements were observed even when using the same classifiers and parameter settings in both cases. Table 2 also reveals that the standard deviations of our method are slightly higher than those of the classifiers without QOSM on the original data. This can be attributed to the poor ability of the base classifiers to identify minority class samples in these data sets, as depicted in Figure 7. Consequently, the evaluation results on each data set are relatively poor, resulting in smaller standard deviations.
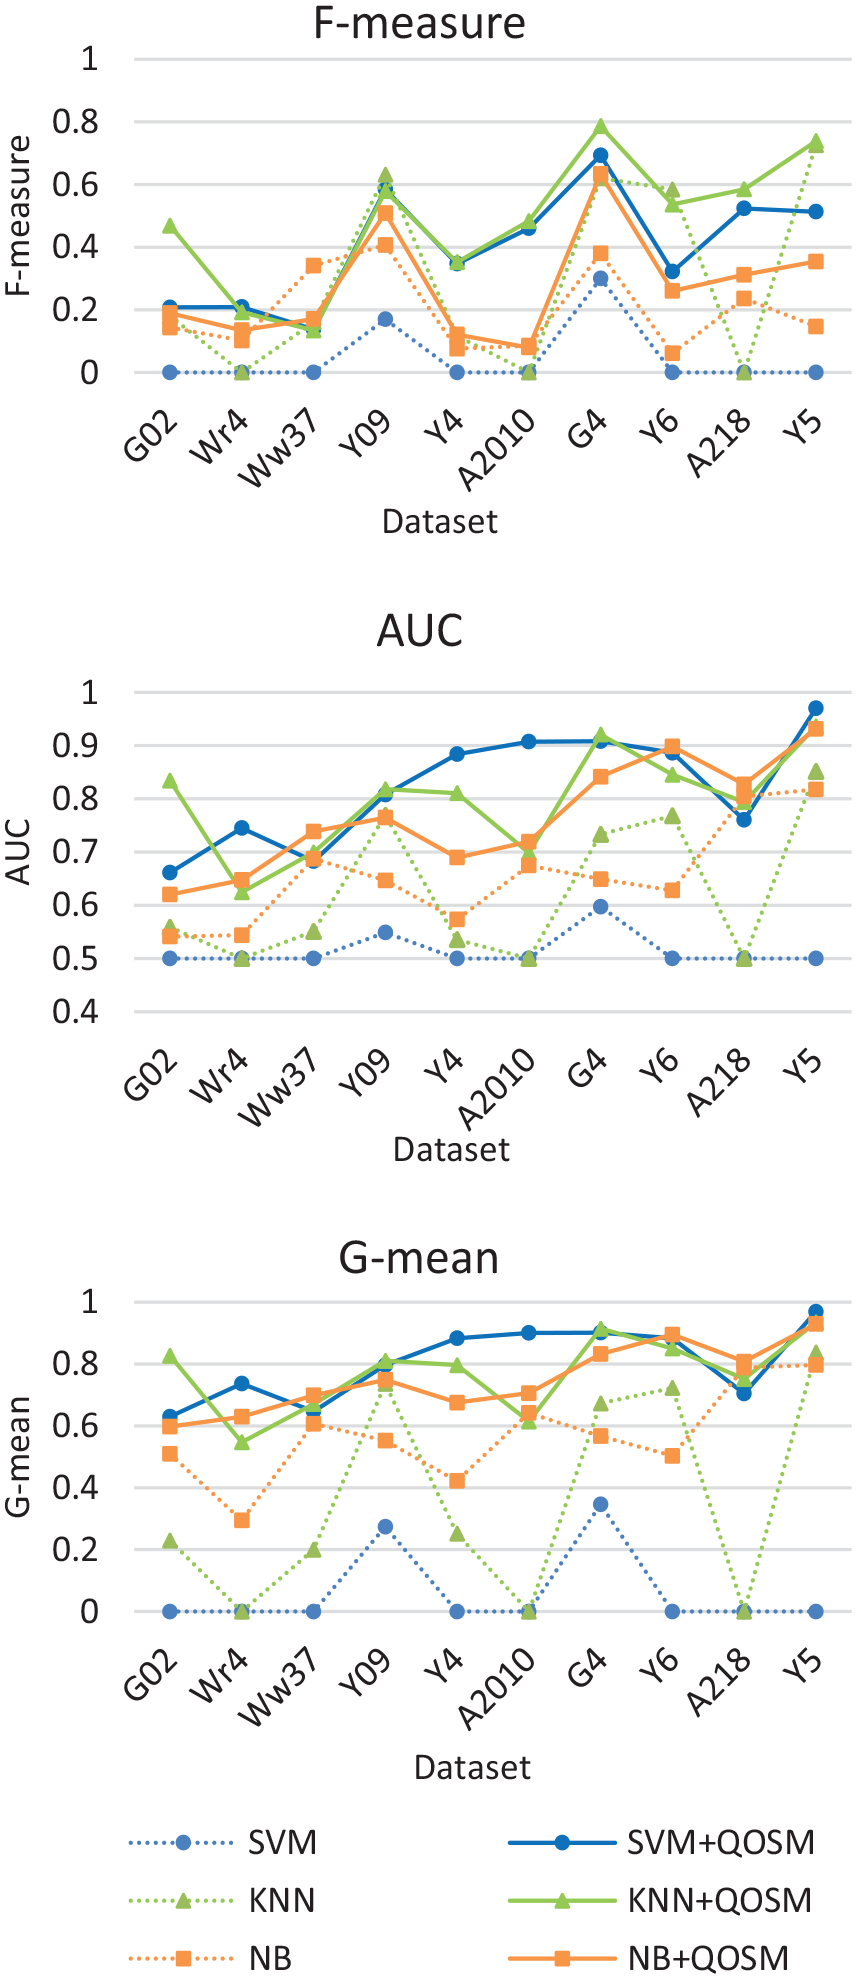
F-measure, AUC, and G-mean values of each data set using the base classifiers and the QOSM.
Experimental results for each combination of data set and base classifier are depicted in Figure 7. The three sub-figures illustrate the results of F-measure, AUC, and G-mean results obtained by the three base classifiers with the default parameters on the 10 data sets, respectively. The solid lines represent the classification results using QOSM and dashed lines represent the results without using QOSM. It is evident that the QOSM significantly improves the classification performance of the three traditional classifiers on all ten data sets. This improvement can be attributed to the capability of the proposed QOSM in effectively handling the issues of class imbalance and overlap present in the data sets.
Comparison between QOSM and random oversampling method
We conducted experiments to compare the classification performance between QOSM and random oversampling method (ROSM). The key difference between QOSM and ROSM lies in the method of selecting cover centers. While ROSM randomly selects cover centers, QOSM utilizes quantum potential theory for cover center selection.
Table 3 presents the comparison results of each evaluation metric using SVM, KNN and NB classifiers. “Average” values represent the mean performance across 10 data sets. The results in Table 3 demonstrate that QOSM achieved superior performance compared with ROSM on all 10 data sets. The average values of all three metrics with QOSM were consistently higher than those with ROSM for all three classifiers and across all 10 data sets. It is noted that the F-measure values with ROSM were very low for several data sets (e.g. Ww37, Y4, and Y6), indicating that only a few positive samples were correctly classified. In contrast, QOSM significantly improved the classification performance, and the base classifiers achieved better results when combined with QOSM.
Although both methods performed poorly on the A2010 data set due to its extremely high IR (IR = 72.46), QOSM outperformed ROSM. These experimental results demonstrate that the proposed oversampling method based on the constructive covering algorithm and quantum potential theory is effective. By optimizing cover center selection and generating covers that align more with the original sample distribution, QOSM better defines the decision boundary through oversampling in the overlapping region, leading to improved classification accuracy.
Comparison of QOSM with other oversampling methods
We compared the performance of our proposed QOSM with three state-of-the-art oversampling algorithms: Polynom-fit-SMOTE (Poly), 39 ProWsyn (Pro), 40 and SMOTE-IPF (IPF). 41 Polynom-fit-SMOTE focuses on improving the TPR while maintaining a reasonable TNR by employing polynomial fitting functions for oversampling the minority class. ProWsyn introduces a synthetic oversampling algorithm that assigns appropriate weight values to minority samples based on proximity information, ensuring a balanced distribution of synthetic samples. SMOTE-IPF extends the SMOTE algorithm by incorporating an iterative ensemble-based noise filter called Iterative-Partitioning Filter (IPF) to address challenges posed by noisy and borderline examples in imbalanced data sets. In this discussion, we refer to these algorithms as Poly, Pro, and IPF, respectively. These three algorithms have demonstrated superior performance in Kovács. 42 The parameter settings for these algorithms in our experiments are the default values provided in the scikit-learn library for Python.
The evaluation results for F-measure, AUC, and G-mean corresponding to QOSM, Poly, Pro and IPF on the 10 data sets using SVM, KNN, and NB classifiers are reported in Tables 4, 5 and 6, respectively. The best results achieved by each oversampling method on each data set are highlighted in bold. The average values for different metrics on 10 data sets are provided in the last row of each table. Observing the results in Tables 4 through 6, it is evident that when using the SVM classifier, QOSM outperformed Poly, Pro, and IPF on 7 out of 10 data sets for all three evaluation measures. In fact, QOSM combined with SVM achieved better performance than the Pro and IPF oversampling methods on all 10 data sets, as shown in Table 4. When using KNN and NB, QOSM also exhibited better performance than the other three oversampling methods on most data sets, as indicated by all three evaluation measures.
The average values of F-measure, AUC, and G-mean across the 10 data sets are illustrated in Figure 7. The results demonstrate that QOSM consistently outperformed the other three methods for all three metrics when the SVM and NB classifiers were used. QOSM achieved higher average performance in terms of F-measure and AUC metrics, while its performance in terms of G-mean is slightly lower but still comparable when using the KNN classifier. These findings indicate that QOSM exhibits superior performance across multiple data sets and is less affected by different classifiers, highlighting its good generalization ability and potential for handling the imbalance and overlapping issues that exist in many real-world data sets.
Significance test
To determine the significance of the differences between QOSM and the other three compared oversampling methods, we conducted statistical tests using the Friedman test. 43 The Friedman test compares the mean ranks of all the algorithms across the experimental data sets. The result of the Friedman test for each combination of the metrics and the classifiers are presented in Table 7.
Friedman test results on F-measure, AUC, and G-mean for all the compared methods with SVM, KNN, and NB as base classifiers.
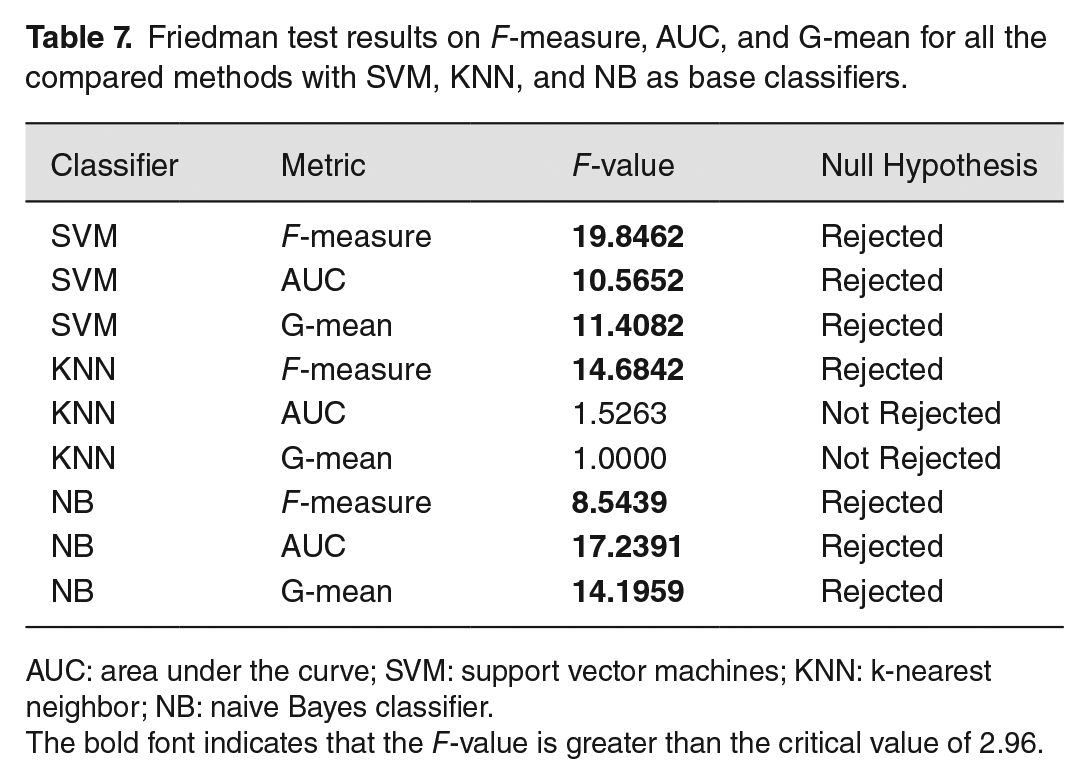
AUC: area under the curve; SVM: support vector machines; KNN: k-nearest neighbor; NB: naive Bayes classifier.
The bold font indicates that the F-value is greater than the critical value of 2.96.
With a significance level of
More discussion
The results presented in Table 3 demonstrate that QOSM systematically improves classification performance, and this improvement is statistically significant. It is interesting to explore the impact of the IR and degree of overlapping (maxF) on the classification performance improvement. Table 1 provides IR and maxF values for ten data sets. Previous research, including our own work, 3 has shown that F-measure is a better metric for evaluating classification performance on imbalanced data compared to AUC, and this has been acknowledged by other researchers. 44 Therefore, in this analysis, we use F-measure to investigate the influence of IR on classification accuracy. From Table 3, we define the performance Fdiff as the difference of F-measure values obtained by QOSM and ROSM for each classifier. We then compute the correlation coefficient (r) between Fdiff, IR, and maxF. The correlation coefficients between Fdiff and IR are 0.371, 0.004, -0.266 for the classifiers SVM, KNN and NB, respectively. It is important to note that the data characteristics of the ten data sets are diverse, and the IR varies significantly, ranging from 9 to 72. Therefore, we observe no strong correlation between Fdiff and IR. On the other hand, the correlation coefficients between Fdiff and maxF are 0.674, 0.673 and 0.637 for SVM, KNN, and NB classifiers, respectively. These values indicate a strong positive correlation between Fdiff and maxF. Notably, the maxF values ranges from 0.3487 to 4.1976, as shown in Table 1, suggesting that a higher degree of overlapping leads to a more significant improvement in classification. These findings indicate that QOSM is more effective in addressing the issues of overlap issue rather than the issue of imbalance.
However, there are serval limitations in the current work. QOSM has only been tested on ten diverse data sets with varying characteristics, particularly in terms of their wide range of IRs. It is necessary to evaluate the performance of the proposed QOSM on a larger number of high-quality data sets, considering different IRs. In addition, in the future work, we plan to separately assess the performance of QOSM on data sets with imbalance and overlapping, to study the combined and individual influence of these two factors on classification performance.
While the proposed QOSM can be seamlessly integrated with various classifiers, we chose not to include deep learning-based classification methods in our analysis due to their usual requirement for large data sets for effective training, which was not met by the data set used in this study. We acknowledge that if we were to acquire a larger data set characterized by high imbalance and overlap, we would be eager to investigate the performance of deep learning-based methods in conjunction with QOSM.
Conclusions
In this study, we introduced QOSM, a novel oversampling method based on quantum potential theory, to address the challenges posed by highly imbalanced and overlapped data sets in classification tasks. By leveraging the constructive covering algorithm and quantum potential theory, QOSM selects cover centers based on their potential energy, resulting in improved representation of the original sample distribution, particularly in the overlapped region. In addition, QOSM calculates the centroid of minority covers with their KNNs, allowing for the generation of synthetic samples through linear interpolation. Compared to SMOTE and its variants, QOSM considers both the individual sample relationships and the relationships between covers, which mitigates the impact of noisy data and reduces the generation of mislabeled synthetic samples in highly imbalanced data sets.
Our experiments involved three traditional classifiers (SVM, KNN, and NB) and 10 public data sets characterized by high IRs and significant overlap. The results demonstrate that QOSM significantly enhances classification accuracy when compared to approaches that do not address the imbalance and overlap in the data. Furthermore, QOSM consistently outperforms three existing oversampling methods when evaluated with the same classifiers and data sets. Due to its classifier independence, QOSM can be effectively combined with various classifiers, offering promising potential for improving classification accuracy on highly imbalanced and overlapped data.
In conclusion, QOSM introduces a novel approach to tackle the challenges of imbalance and overlap in classification tasks. Through comprehensive evaluations and comparisons, we have shown its effectiveness in improving classification accuracy and its superiority over existing oversampling methods. With its versatility and potential for integration with different classifiers, QOSM provides a valuable tool for addressing imbalanced and overlapped data in real-world scenarios.
Footnotes
Authors’ Contributions
BY and CZ conceived the project. GT and BY completed most experiments. BY, GT, and CZ collaborated on drafting the manuscript. JL and PG provided insightful inputs and revised the manuscript. All authors have reviewed and approved the final version of the manuscript.
Declaration Of Conflicting Interests
The author(s) declared no potential conflicts of interest with respect to the research, authorship, and/or publication of this article.
Funding
The author(s) disclosed receipt of the following financial support for the research, authorship, and/or publication of this article: This work was supported or partially supported by the Key Research Projects of Universities in Henan Province of China under grant number 17A520015, the Key Scientific and Technological Research Projects in Henan Province of China (grant numbers: 192102310216 and 232102210006), the Major Research Programs of Science and Technology in Henan Province of China (grant number: 221100210600), the Major Science and Technology Project in Henan Province of China (grant number: 201400210400), and the Medical Science and Technology Joint Construction Project in Henan Province of China (LHGJ20220215).