
Abstract
Urban theorists offer varying explanations for why communities use austerity policies that limit or cut government. We develop a synthesis of political-economic and institutional explanations. Using this new synthetic approach, we analyze the characteristics of communities that promote the use of cutback policies and question whether relationships derived from urban theories can be extended across the urban-rural continuum. We draw on original primary data for over 1,000 communities. Our study provides a new lens on local austerity policies and the distinctiveness of the urban experience. We find that economic pressures, political context, and local governments’ characteristics influence cutback policies across both urban and rural America. Large metro counties use more cutback policies suggesting progressive communities are downsizing, and fiscal stress is a strong determinant. Among rural counties, political context and governmental attributes further influence cutback policies. Surprising similarities exist across urban and rural communities in citizen pressures to reduce government. The findings demonstrate that urban frameworks can be pushed beyond their conventional focus. Our study highlights the importance of viewing communities across a continuum rather than analyzing urban and rural communities as if they occupy different worlds.
Keywords
Introduction
Urban and rural areas have come to represent the politicization of space in the United States. They are widely cast in divided light even as some sociologists challenge this portrayal (Lichter and Brown 2011). In this article, we examine the character of urban and rural communities focusing on their use of policies that cut or limit the local public sector. Cutback policies, often conceptualized as urban austerity policies (Adua and Lobao 2019; T. N. Clark 2000), have concerned social scientists especially with the rise of neoliberal governance. Localities face striking questions about how to address forces that push them toward retrenchment. Yet for the most part, theorizing about local austerity policies is grounded in the urban experience, especially the experience of large cities (Adua and Lobao 2019; Davidson 2020b).
Recently, urban sociologists have been challenged to study a range of communities (Brown-Saracino 2020; Ocejo, Kosta, and Mann 2020). We examine theories about localities’ austerity policies and the manner by which they are transferable to cases beyond the urban. Storper (2016) cautions researchers that some processes are intrinsically urban in that they occur only in high-density places, yet others are present across communities, but the urban context may exacerbate or diminish them. We argue that localities’ adoption of austerity policies follows the second path and analyze whether and how the urban experience differs from the rural.
A long-standing literature examines local austerity policies such as service cuts, layoffs, hiring freezes, outsourcing, selling assets, and other common cutback strategies (Adua and Lobao 2019; T. N. Clark 2000). 1 Researchers put forth varied theoretical arguments about why communities adopt cutback policies. However, the scope of communities that inform theory is limited. We ask two questions: (1) What types of communities are most likely to adopt policies designed to cut or limit the scope of local government?; and (2) To what degree does the experience of urban localities extend to that of rural localities? Our central interest is whether there are different worlds of cutback processes. Are austerity policies used more by urban (metropolitan) or rural (nonmetropolitan) communities and what mix of local economic, political, and governmental forces are at the root of these policies? 2
Our study contributes to theory in several ways. First, we bring together theoretical perspectives often treated disparately. We engage with perspectives that explain why localities use cutback policies, showing how they have drawn from two general traditions. The first builds from Marxian political economy and stresses the structural (economic and political) characteristics of communities; the second considers institutional factors such as the qualities of local government, adding elements of the Weberian view. Both traditions tend to be layered upon an urban landscape, with policies theorized in light of urban conditions. As such, they raise open questions. Second, we advance these traditions by synthesizing their arguments and developing a conceptual account that incorporates the case of rural communities. Third, our interest in rural communities responds to calls to re-assess urban theories in new places (Brown-Saracino 2020). 3 Fourth, the study sheds light on the politicization of space as denoted by scholars addressing the urban-rural divide (Cramer 2016; Monnat and Brown 2017). Rodríguez-Pose (2018) notes that to understand political forces impinging on cities, it is important to compare rural areas, often assumed to be the “places that don’t matter.”
This study also makes a unique empirical contribution. It is among the first to document whether urban and rural communities vary in using cutback policies. We draw on original primary data. In spanning communities across the United States during 2018–2019, to our knowledge these data offer the most recent national coverage of cutback policies. The research design follows a long-standing urban sociological tradition that analyzes austerity policies and other policies by collecting primary data from surveys of local governments such as cities and counties (Adua and Lobao 2019; T. N. Clark 2000; Logan and Crowder 2002). We use the county as a unit of analysis because it captures communities across the urban-rural continuum. Counties are often used to study communities’ policies, including cutback policies (Adua and Lobao 2019; Fording, Soss, and Schram 2011; Kim and Warner 2017).
Finally, our study generates a series of novel findings. By bringing in a range of places, we provide a new lens on the distinctiveness of the urban experience. We find the austerity policy process only fully unfolds when the urban is contrasted with the rural.
In the following section, we draw together different perspectives about factors that promote local cutback policies and develop a critique by bringing in rural communities. Building from a synthesis of perspectives, we outline expected relationships.
Theorizing Local Governments’ Use of Cutback Policies
Social scientists have long been concerned with policies that limit or reduce the scope of local governments as these put communities’ well-being at risk (Swanstrom, Dreier, and Mollenkopf 2002). But much of the cutback process remains stealth. While a handful of extreme cases of fiscal stress leading to bankruptcy exist (Davidson 2020b), some scholars characterize U.S. local governments overall as operating today under “ordinary austerity” conditions where they routinely struggle with fiscal stress as they must balance budgets yet serve disadvantaged populations (Peck 2020; Pill 2020; Shefner and Blad 2020). Urban austerity policies, such as service and employment cuts, selling assets, and outsourcing, were first conceptualized as a strategy used by cities to cope with such general economic pressures in the 1980s (T. N. Clark 1988, 2000). Today, local governments have become more skilled at avoiding cutbacks, but pressures remain that vary across communities (Kim and Warner 2017). We address cutback policies in this contemporary context of ordinary austerity conditions where there is community variation in economic pressures and other factors that affect the use of these policies.
To situate the contemporary context of our study, we provide a brief overview of the background behind U.S. localities’ use of austerity policies. First, Adua and Lobao (2019) note that with neoliberal governance from Reagan onward, localities increasingly experienced fiscal pressures. They have tended to use cutback policies over tax increases to address these pressures, potentially finding the latter less palatable to residents. With the Great Recession, there were cuts to local governments’ workforce (U.S. Bureau of Labor Statistics 2021) and ideological efforts to popularize support for austerity policies (Donald et al. 2014; Peck 2012). At the time of our study, during the Trump presidency, ideological attacks on local governments were reported to have grown (Badger and Bui 2016; Benton et al. 2020). Some federal policies were aimed at placing operating constraints on urban counties and cities (Benton et al. 2020). 4 State governments seeking to pre-empt local policy-making also reportedly increased (Garnham and Rich 2019; Kim et al. 2021).
Different theoretical literatures address factors that explain why localities make use of cutback policies. We draw together explanations by distinguishing conceptual commonalities. We aim to bring order to diverse perspectives by adopting a sociological lens from which to capture community factors relevant for urban-rural comparisons. Some perspectives emphasize political-economic factors. Others call additional attention to institutional factors involving the local state. We see existing perspectives as more complementary than competing. Even as they highlight Marxian political-economic or Weberian-oriented factors, they are not mutually exclusive. The frameworks discussed all recognize economic pressures from fiscal conditions and the local economy as a significant driver of austerity policies. This follows empirical research. Past studies find that economic pressures are the most consistent determinant of austerity policies, especially when measured by local officials’ own reports of fiscal stress (Adua and Lobao 2019; Nelson 2012). Current perspectives share limitations and say little explicitly about cutback policies across contexts. For example, Davidson (2020b) notes that it is unclear how perspectives formulated from the experiences of large cities apply to smaller cities. We extend this question to rural communities.
Existing Explanations about Why Localities Adopt Cutback Policies
We bring together multiple theoretical perspectives for the common purpose of deriving factors that explain localities’ use of austerity policies and potential urban-rural differences. 5
Economic pressures and political factors: Marxist-oriented political economy perspectives
The most prominent perspectives on urban austerity policies have Marxist underpinnings. They take a political-economy approach which emphasizes intertwined economic and political factors that lead to the cumulative scarcity of local public resources and fiscal stress. Localities respond to this context around them with austerity policies. We identify three perspectives that theorize economic and political drivers of cutback policies.
First, austerity policies are conceptualized in general political economic theory (Harvey 2005; Jessop 2002; Shefner and Blad 2020). Here, neoliberal development is viewed as behind the factors fostering these policies, with implications for the types of communities likely to adopt them. 6 For local governments, neoliberal development creates economic pressures by exacerbating poverty and fiscal stress (Harvey 2005) and fosters anti-government stances among populations (Bardhan and Walker 2011) which contribute to cutback policies. Further under neoliberal development, upper-level governments decentralize governmental functions, often providing insufficient resources (Harvey 2005). As localities strive to make up shortfalls, they engage in pro-business entrepreneurialism such as offering growth incentives. The general political economy perspective suggests that austerity policies should be used more frequently in contexts more reflective of neoliberal governance (Harvey 2005; Jessop 2002). In this sense, rural communities could be expected to use a greater number of cutback policies.
Second, cities’ austerity policies are theorized in a line of research on “austerity urbanism” which focuses on the Great Recession (Davidson and Ward 2014; Hackworth 2015; Peck 2012, 2014). Here, policy outcomes tend to be portrayed as the doubling-down of neoliberalism. According to Peck (2012:638), a leading proponent, localities are more likely to use these policies when driven by: budget cuts pushed down by upper-level governments; loss of intergovernmental revenues; long-term economic decline; and falling tax revenues. 7 Market-driven ideology also filters down to some communities where a “folk-neoliberalism” prevails, characterized by “a morbid fear of tax hikes with deep antipathies to the social redistribution” (Peck 2012: 639). Finally, Peck (2012:628) argues that austerity policies reflect a “distinctly urban crisis.” That is, Recession downturn was greater in urban areas that are also vulnerable to neoliberal pressures owing to their poor populations and public sector unionization.
Third, sociology’s classic urban political-economy as seen in Logan’s and Molotch’s (1987) growth machine theory has implications for austerity policy. They suggest growth incentives lead to cutback policies as they cater to business and absorb public resources. Building from this theory, Adua and Lobao (2019) find that where growth elites are active, counties are more likely to use hiring freezes, sell assets, and cut spending.
Drawing together political economy perspectives, we make the following observations. First, scholars identify kindred explanatory factors that speak to localities’ structural context. That is, cutback policies are more likely to be implemented where localities experience: economic pressures from the local economy, upper-level governments, and general fiscal stress; and political pressures from tax-adverse citizens, pro-business initiatives, and unions. Second, the political economy tradition tends to assume neoliberal pressures wash broadly across communities, even as some studies affirm that context matters. Yet little is said about how different contexts matter systematically. For example, economic and political pressures are likely to differ between urban and rural communities. Third, it remains unclear about which communities are most likely to adopt cutback policies today. Do rural communities and/or those in more neoliberal-like environments make greater use of these policies? Or are these policies used more by cities? Fourth, political-economic theories give little direct scrutiny to race and ethnicity (Hackworth 2019), a point discussed later. Finally, the political economy tradition is often viewed as over-emphasizing structural constraints. We now turn to perspectives framed at a different analytic level, on agentic aspects of local governments.
Local government characteristics: Institutionally oriented perspectives
Another set of factors influencing policy and potentially urban-rural differences comes from perspectives addressing the qualities of local governments. These perspectives agree that economic pressures foster austerity policies. But they see more local maneuverability than the political economy perspectives above. In emphasizing institutional capacity, such as the quality of local bureaucracy, financial resources, and autonomy from upper-level governments, these perspectives bring in elements of sociology’s Weberian tradition (Lobao, Adua, and Hooks 2014; Mollenkopf 1989). Local governments’ capacity to respond to pressures in different ways adds contingency to policy adoption. These perspectives thus argue that the use of cutback policies is more unpredictable and geographically varied than conventionally assumed. We denote two institutionally oriented perspectives, state-rescaling and pragmatic municipalism. 8
The state-rescaling framework addresses local policies under decentralized governance, where national governments have rescaled (i.e., restructured) operations in a manner that gives localities increased responsibilities and authority (Brenner 2004, 2009; Burchs 2009; Lobao and Adua 2011). While the general political economic tradition (above) focuses on decentralization as constraining localities’ behavior, the state-rescaling framework indicates it may also be enabling by increasing autonomy from upper-level governments and governing expertise. Higher-capacity local governments are more activist overall, providing more services and policies of all types (Lobao et al. 2014). The state-rescaling framework calls attention to how local governments’ unique institutional attributes influence policy (Brenner 2004, 2009; Howlett 2009; Lobao and Adua 2011). Localities vary in administrative capacity, financial resources, and autonomy which can influence policy in sometimes countervailing ways. For example, with state-rescaling, high-skilled professionals are needed to develop policy, write grants, and manage contracts. Localities with more professionalized staff have greater administrative capacity to navigate pressures. But capacity can produce contrasting outcomes, such as resistance to austerity policies or decisions to use them because local bureaucracy is better equipped to manage outcomes (Lobao and Adua 2011). Greater autonomy likewise adds flexibility to avoid or enact cutbacks. Finally, because higher-capacity governments provide more services, they may be more predisposed to trim operations (Lobao et al. 2014). While the state-rescaling framework calls attention to agentic institutional attributes, the direction of effects is not predetermined and needs to be empirically assessed (Donald et al. 2014).
The second perspective, “pragmatic municipalism,” views the local state as a strategic administrator navigating change (Aldag, Kim, and Warner 2019; Kim and Warner 2016). As such, this perspective views competent, high-capacity local bureaucracies as better adapting to pressures. Local bureaucrats are seen as juggling multiple factors, such as local needs, resources, and other conditions, which contribute to variation in policy adoption (Aldag et al. 2019; Kim and Warner 2016, 2021). Moreover, localities pursue alternative service delivery methods and make policy choices for practical reasons that fit specific circumstances rather than for political reasons. Pragmatic municipalism can be seen as a more formalized version of observations long made in public administration and planning (Nelson 2012; Raudla, Savi, and Randma-Liiv 2015). It has been posed as challenging the austerity urbanism framework (Aldag et al. 2019; Davidson 2020a, 2020b; Kim and Warner 2016), although some researchers see complementary insights (Kim 2019). Proponents argue that: austerity policies arise for many reasons including efforts to maintain service delivery; political factors do not play a strong role; and U.S. cutbacks are not extreme relative to other nations.
Drawing together institutionally oriented perspectives, we make several observations. First, these perspectives stress governmental attributes that allow localities to better manage economic and political pressures. Institutional factors accompany and/or possibly override political factors in setting austerity policies. Second, these perspectives see local capacity (administrative, resource, service) and autonomy as playing key roles but do not assume predetermined effects. Third, attention is on agentic qualities—high or sufficient bureaucratic capacity to respond to pressures tends to be assumed. This begs the question of how less professionalized bureaucracies, more common in rural areas, handle pressures. Finally, these perspectives also neglect race and ethnicity and often take the Great Recession as a touchstone raising questions about whether key explanatory factors persist.
Urban Theories, Empirical Findings, and Race/Ethnicity
Taken together, urban austerity theories conceptualize the role of economic, political, and local governmental factors. We note briefly empirical findings about how these factors affect policies and then turn to race/ethnicity. The University of Chicago’s Urban Fiscal Austerity project brought about the use of large-sample, quantitative studies of cutback policies (T. N. Clark 2000). We draw from such studies as they share our research design.
Both political-economic and institutional traditions view economic pressures as the main precipitator of cutbacks. Empirical research supports this notion (Nelson 2012; Raudla et al. 2015). Officials’ own reports of declines in the tax base and state/federal revenues appear to be most closely connected to cutback policies (Adua and Lobao 2019; C. Clark and Walter 1991; Clingermayer and Feiock 2001; Lobao and Adua 2011; Maher and Deller 2007; Scorsone and Plerhoples 2010). Distress as reported by officials is thought to reflect more nuanced fiscal conditions that local bureaucracies perceive in the course of decision making.
Empirical research is far less consistent for political and governmental attributes. To assess political context in quantitative studies, researchers mainly examine presidential voting. Although researchers often hypothesize cutback policies are used more in bastions of Republican support, they tend to find few consistent differences between Democratic and Republican leaning communities (C. Clark and Walter 1991; Lobao and Adua 2011; Scorsone and Plerhoples 2010). Few nationwide studies scrutinize political factors besides presidential voting and none to our knowledge examine how political pressures from residents affect cutback policies. Past studies have found some effects of local governmental characteristics. Localities with greater administrative capacity and service provision are reported to use a greater number of cutback policies, indicating activist local governments appear more prone to cut expansive agendas (Adua and Lobao 2019; C. Clark and Walter 1991; Clingermayer and Feiock 2001).
A critique of all austerity theories, that they neglect race, is leveled by Hackworth (2019). He argues that racial resentment and neoliberal governance left Rust Belt cities vulnerable to fiscal stress and cutback policies. The size of the Black population, a marker of racial division, figures important in inducing cutback policies as he contrasts cities with high Black populations with White outlying suburbs. Focusing on 25 large cities in six states, Hackworth (2019) cautions that his findings should not be generalized elsewhere. Few large-sample studies of cutback policies analyze Black and Hispanic population size, reinforcing Hackworth’s (2019) critique. One exception is a nationwide study that included racial/ethnic size, but it found little consistent relationship with counties’ cutback policies (Adua and Lobao 2019). Another study suggests that where the Black population is higher, Black political power and aggregate need might mitigate against some service declines (Lobao et al. 2014). Nevertheless, Hackworth (2019) demonstrates the importance of scrutinizing racial/ethnic composition in different contexts.
Urban and Rural Communities: Different Worlds of Cutback Processes?
Little is known about whether urban and rural communities differ in using cutback policies. Lack of comparison is problematic for research and theory if studies rest on truncated observations from one set of communities over another. Failure to consider communities across the urban-rural continuum can create empirical inconsistencies and flaws in causal inference. 9 Likewise if studies assume urban normativity, a range of communities are left out of scrutiny, hampering theory development. Treating rural and urban communities in a binary manner creates conceptual imprecision as well as danger in reifying the urban, the rural, or both.
Comparative research is hampered by data limitations. Large-sample urban-rural studies generally are based on secondary, census data that cover few political and governmental indicators with useful detail. Apart from presidential voting, urban-rural political differences (and many other differences) are mainly distinguished at the national population level, rather than each U.S. community. 10 Using existing work, we briefly compare communities along factors relevant to our study. Our empirical analysis provides more detail. While differences within metro and nonmetro areas exist, to condense discussion we focus on general contrasts.
With regard to economic pressures, nonmetro (relative to metro) communities face disadvantages. They tend to have a poorer quality economic structure with lower wage jobs and industries pressured by globalization. Their tax base is thus generally considered poorer (Johnson et al. 1995). Rural communities have higher poverty historically as measured by the official rate and older, less affluent, less educated, more White populations (Brown and Schafft 2019; Partridge and Rickman 2006).
As noted, political variation across urban-rural communities is mainly analyzed with presidential voting. With some exceptions, nonmetro counties have leaned Republican since the 1970s (Fisher 2014; Scala and Johnson 2017). At the national population level, surveys have long shown that political attitudes vary among urban, suburban, and rural residents with general gradation from liberal to conservative. Rural residents have more negative views of government writ large (Parker et al. 2018) although it is unclear whether this extends to local governments. Some researchers link political differences to neoliberal development, arguing that it has created economic disadvantages for rural people which the state fails to buffer (Edelman 2021; Monnat and Brown 2017; Schafft 2021). It is important not to overstate urban-rural differences. A vivid reminder is that Trump won Staten Island in 2016 and by an even larger margin in 2020.
Few studies compare urban and rural community governments but those that do examine counties. Nonmetro counties generally have lower administrative capacity with less professionalized staff (Lobao and Kraybill 2005) and provide fewer public services (Tickamyer et al. 2007; Warner 2006). They have small budgets but need to raise more revenue as they face diseconomies of scale in serving sparsely settled populations (Johnson et al. 1995). Nonmetro counties tend to have higher fiscal stress (Johnson et al. 1995; Lobao and Kraybill 2005).
Conceptualizing Cutbacks: Expected Relationships
To conceptualize the types of communities that use cutback policies, we bring together different theoretical perspectives situating them in two traditions. As discussed, we view these traditions as more complementary than competing. First, they operate at different analytical levels, which add to complementarity. Political economy frameworks offer a social structural account, emphasizing economic and political forces that create the operating context in which localities are embedded. Institutionally oriented perspectives agree with much of this account. But their attention is to a lower analytical level, on local governments’ qualities and how they enable localities to overcome the context in which they are embedded. Second, taken together, the forces that the two traditions emphasize, structural and agentic, should provide a more holistic account than either force separately, a point that others have made about urban policy formulation in general (Lobao et al. 2014; Mollenkopf 1989). Certainly tensions exist, 11 but for our purposes we see a synthesis of both theoretical traditions as fruitful for urban-rural comparisons. Together these traditions recognize the importance of economic pressures and acknowledge, but give different emphasis to, political factors and institutional attributes of local government. Both traditions neglect racial/ethnic dimensions of communities.
A theoretical gap remains in how urban austerity perspectives apply to different types of communities. Synthesizing these perspectives, cutback policies are expected to be used more where communities face greater economic pressures (from the local economy and general fiscal pressures) and where the political context is Republican-leaning, pro-business, and less favorable toward local government. Cutback policies may also arise where public sector unionization is higher, given anti-union pressures. Local governments’ attributes are further expected to differentiate communities, but as discussed, theorists do not see predetermined effects. As local governments with greater capacity and autonomy are assumed to better navigate pressures, these characteristics should either be associated with fewer cutback policies or reflect localities’ greater ability to handle cuts if such policy choices are made.
Our central interest is the degree to which austerity perspectives shed light beyond the urban. Urban and rural communities are likely to vary in their use of cutback policies, but theorists are unclear about which adopt more of these policies.
Based on our synthesis of perspectives, we expect that economic pressures, communities’ political context, and institutional attributes of local governments influence cutback policies. However, these factors may have differential effects on policies for urban and rural communities. Communities vary along these factors, such as rural communities are likely to have a more rightward-leaning political context and lower capacity governments. Economic pressures could also be different: tax base decline has long been a salient problem for rural communities but not for most large metros. Should urban theory apply at a more generalizable level, we would expect similar factors to be significant across the nation when including both rural and urban communities together in our analyses. Here, the aforementioned factors should account for any observable rural-urban differences that exist in the use of austerity policies. Finally, by analyzing urban and rural communities separately, we expect to identify any contextually specific, in-kind differences that might be occurring.
Data and Methods
We follow urban sociology’s quantitative tradition, using a research design developed by the University of Chicago’s Fiscal Austerity and Urban Innovation Project (T. N. Clark 2000) where primary data are collected from large numbers of local governments. Data are obtained by surveying officials such as mayors and county commissioners (e.g., see Adua and Lobao 2019; Aldag et al. 2019; C. Clark and Walter 1991; Kim and Warner 2017; Lobao et al. 2014; Logan and Crowder 2002; Logan, Whaley, and Crowder 1997; Reese and Rosenfeld 2002). Primary data are needed due to the lack of secondary sources on local policies and determinants. We also employ data from the American Community Survey, Census of Governments, and other secondary sources. Our study is a cross-sectional comparative study conducted at one point in time, as are all the studies cited above. All large-scale quantitative studies of local austerity policies to date have been cross-sectional to our knowledge.
Researchers studying communities’ policies analyze cities or counties as both are general purpose local governments that provide wide-ranging services. 12 Counties offer advantages for our research. Nationally, rural-urban variations are measured largely with counties as they are the local unit by which metropolitan and nonmetropolitan America is defined (Lichter and Brown 2011). County governments are studied in previous large-sample community studies of fiscal stress, cutback policies, and social services, making our research compatible (Adua and Lobao 2019; Aldag et al. 2019; Kim and Warner 2017; Lobao and Adua 2011; Warner 2006). Finally, by working with the National Association of Counties (NACo) (parallel to the National League of Cities), we collected the most recent nationwide data on communities’ policies. Like other territorial units, counties have limitations and subunit geographies cannot be separated out. While we cannot drill down into smaller communities within metro areas, we can compare big-city metros, outlying suburban metros, and rural communities across the nation.
Primary data come from a national survey of county governments conducted in late 2018-early 2019. NACo developed a list of officials to report on their counties’ policies, fiscal stress and related issues. These officials were key informants used in other NACo surveys and included county commissioners, managers/administrators, auditors, and clerks. Survey implementation followed Dillman’s (1978) methodology. Surveys were mailed to approximately 3,000 counties (including Louisiana parishes) in the 45 contiguous states with county governments. 13 For more information about the methodology, consult Adua and Lobao (2019), Lobao and Kelly (2019), and Lobao and Kraybill (2005). The survey response rate was 36 percent (1,097 counties). The response rate is slightly higher than most large-sample policy surveys which typically obtain a response rate of about 30 percent (Kim and Warner 2017; Warner 2006). 14 Metro and nonmetro counties are represented in generally similar proportions as they are nationally though within categories there are differences. Suburban metros (defined below) have somewhat greater representation (16 percent of surveyed counties compared to 13 percent nationally, p < .05) and remote rural counties, smaller (27 percent compared to 30 percent nationally, p < .05). The poverty rate (12 percent) is similar to counties nationally. As discussed in the “Analysis” section, we tested whether the response rate affects national representativeness of the findings and found little evidence.
We follow previous local government studies in constructing variables and models (Adua and Lobao 2019; C. Clark and Walter 1991; Kim and Warner 2017; Lobao and Adua 2011; Lobao et al. 2014; Logan and Crowder 2002; Sun 2010). Studies collecting government information from officials have limitations. They generally are limited to dichotomous response categories such as the use/nonuse of a policy and data that officials can more efficiently provide. As a result, construction of variables is limited: researchers typically employ dichotomous variables or count-variables of the number of policies in use. Potential for response bias in local government surveys has been given little attention. We examined the characteristics of responding officials and tested for their effects in our models. These tests yielded no evidence of systematic bias. 15
Dependent Variable: Cutback Policies
Our study analyzes austerity policies that researchers view as imposing limits or cutbacks to the scope of community governments. Indicators of these policies were initially developed by the Urban Fiscal Austerity Project (T. N. Clark 1988) and are used in a range of quantitative studies (Adua and Lobao 2019; C. Clark and Walter 1991; Kim and Warner 2017; Lobao and Adua 2011; Sun 2010). Officials are asked to report whether their government used a given policy “to balance its recent budgets.” 16 We measure eight policy strategies: hiring freezes, staff layoffs, outsourcing a service to a non-government provider, eliminating a service, decreasing expenditures, deferring maintenance, depleting the fund balance (e.g., rainy-day funds), and selling assets. Responses are coded 1 = yes, 0 = no. Overall, 83 percent of counties report decreasing expenditures, 64 percent report deferred maintenance, and 43 percent report depleting the fund balance; remaining policies are generally reported by 20–25 percent of counties. Researchers use a count of policies to capture policy intensity, the degree to which a policy domain is employed by a local government (Aldag et al. 2019; Lobao et al. 2014; Reese and Rosenfeld 2002). We create a count-index of the eight policies above. Cronbach’s alpha = .65 for the reliability of the index. In addition to tapping policy intensity, this summary index allows for parsimonious contrasts between urban and rural communities as opposed to displaying results for each of eight policy measures separately. 17
Metropolitan-Nonmetropolitan Counties
As little, if any, research compares urban-rural communities on a range of cutback policies, our focus is on these general differences. We also go further to capture some within urban and rural variation. We examine four types of counties: core metropolitan, suburban metropolitan, nonmetropolitan adjacent, and nonmetropolitan nonadjacent (remote rural). Metro-nonmetro classification is based on Office of Management and Budget (OMB) criteria. Metro counties contain or are located within a region that has large urban cores. We then differentiate core metro counties that contain the large principal city/cities of the metro area from outlying counties, suburban metro counties. Nonmetro counties are also differentiated into two types. Nonmetro adjacent counties are located next to metropolitan counties while remote rural counties are not adjacent to metropolitan counties. 18 We chose this four-tier classification for several reasons. It is consistent with our interest in extending austerity theory whose touchstone is large-city metros, to a gradation of communities defined in relationship to these areas. It follows established conceptualizations of urban-rural differences by metro and nonmetro status (Lichter and Brown 2011). Previous local government studies have used this classification (Kim and Warner 2017). Finally, it allows national differences to be analyzed succinctly.
Independent Variables
Three factors should affect communities’ use of cutback policies and urban-rural differences: economic pressures, political context, and local government characteristics. Additionally, we examine ethno-racial composition.
Economic pressures
Economic pressures vary across communities. Theorists view long-term structural economic conditions and recent fiscal stress as central drivers of cutback policies. Structural conditions are measured as tax-base decline and the county poverty rate. Tax-base decline is derived from the county survey. Officials were asked to report: “how important has a declining tax-base been for your county’s finances?” Response options are 1 (important), 2 (somewhat important), and 3 (very important). Poverty is a common indicator of communities’ structural conditions (Partridge and Rickman 2006). We use the official, five-year family poverty rate from the 2014 ACS, selected to capture conditions prior in time to the dependent variable.
Recent fiscal conditions are measured with two variables constructed from the county survey. The first is an index of fiscal problems related to decentralized governance and constructed following Adua and Lobao (2019). Here, officials are asked to report how important the following problems are to county finances: loss of federal revenue; loss of state revenue; state tax, revenue, or expenditure limits; and mandated costs from federal/state governments (coded 1 = not important; 2 = somewhat important; 3 = very important). We summed across these four items to create an index which ranges from 4 to 12. Cronbach’s alpha = .69 for the index. The second indicator is fiscal stress. No consistent measure of fiscal stress is employed in large-sample community studies and no direct measure is available from secondary sources. We asked officials directly to report the county’s level of fiscal stress. Response options are 1 (none), 2 (slight), 3 (moderate), and 4 (significant). While we developed other fiscal measures such as changes in per capita revenue using Census of Governments’ data (collected every five years), they were not statistically significant. As discussed, researchers suggest that officials’ own reports are more sensitive than Census indicators as the former pick up on nuanced, time-proximate financial conditions.
Political context
Local governments are embedded in different political contexts. We examine political context using five measures. As presidential voting is the major way of measuring partisanship across communities, we use the proportion of Republican voting in the 2016 election. Political-economy theories see local anti-government views as a driver of austerity policy. We asked officials to report whether most voters would prefer the county to reduce service spending and reduce taxes. Both variables are coded similarly, 1 (majority of voters prefer reduced county spending/taxes) and 0 (majority do not prefer). 19 As discussed, focusing on business interests may lead to cutback policies. We measure pro-business growth focus with counties’ use of business attraction tools. We follow Lobao et al. (2014) in creating an index of the use/non-use of seven common tools such as tax abatements, external business recruitment, and business loans. This index ranges from 1 to 7 and the alpha coefficient is .78. Finally, we measure the share of unionized county employees.
Institutional attributes of county governments
Based on institutionally oriented perspectives, we measure key characteristics of local governments that reflect capacity (resource, administrative, and service) and autonomy. Resource capacity is measured by total revenue per capita, constructed from the 2017 Census of Governments. Remaining indicators are constructed from the county survey. Administrative capacity is measured by two indicators of staff expertise (each coded 1 if the county retains this staff position and 0 otherwise). The first is whether the county uses an administrator/executive, a position that indicates more expert leadership and centralized administration (Benton 2002). Counties having this board officer or centralized administrator tend to engage more in policy development (Benton 2002; Lobao et al. 2014). The second indicator is whether the county has a grant-writer on staff, important to compete for external funds. Service capacity is measured by the number of public services the county provides. This count index ranges from 0 to 28 and the alpha coefficient is .82. Policy autonomy assesses counties’ current independence in policy-making given the state government. Officials were asked a straightforward question whether “the state has affected your county’s ability to make local policy.” Responses are coded 1 to indicate policy autonomy (i.e., the state has not affected policy-making) and 0 otherwise. 20
Racial and ethnic composition and other variables
As noted, the share of racial/ethnic groups is considered an indicator of racial divisions (Hackworth 2019; Lobao et al. 2014). We include the proportions of the Black and Hispanic populations in the county, using the 2014 five-year ACS. In addition, we control for county population size (logged) and the state in which the county is located as explained below.
Analysis
Urban-Rural Differences in Community Characteristics
We first examine the degree to which cutback policies and determinants have an urban-rural dimension. Summary statistics by urban-rural status are shown in Table 1. Core metro counties report the greatest use of cutback policies, particularly relative to remote counties. This lends some support for the concept of austerity urbanism, that big cities are more the site of austerity policy. Suburban counties, by contrast, are similar to nonmetro counties in using cutback policies.
Descriptive Statistics for All Counties and Counties by Rural-Urban Status.
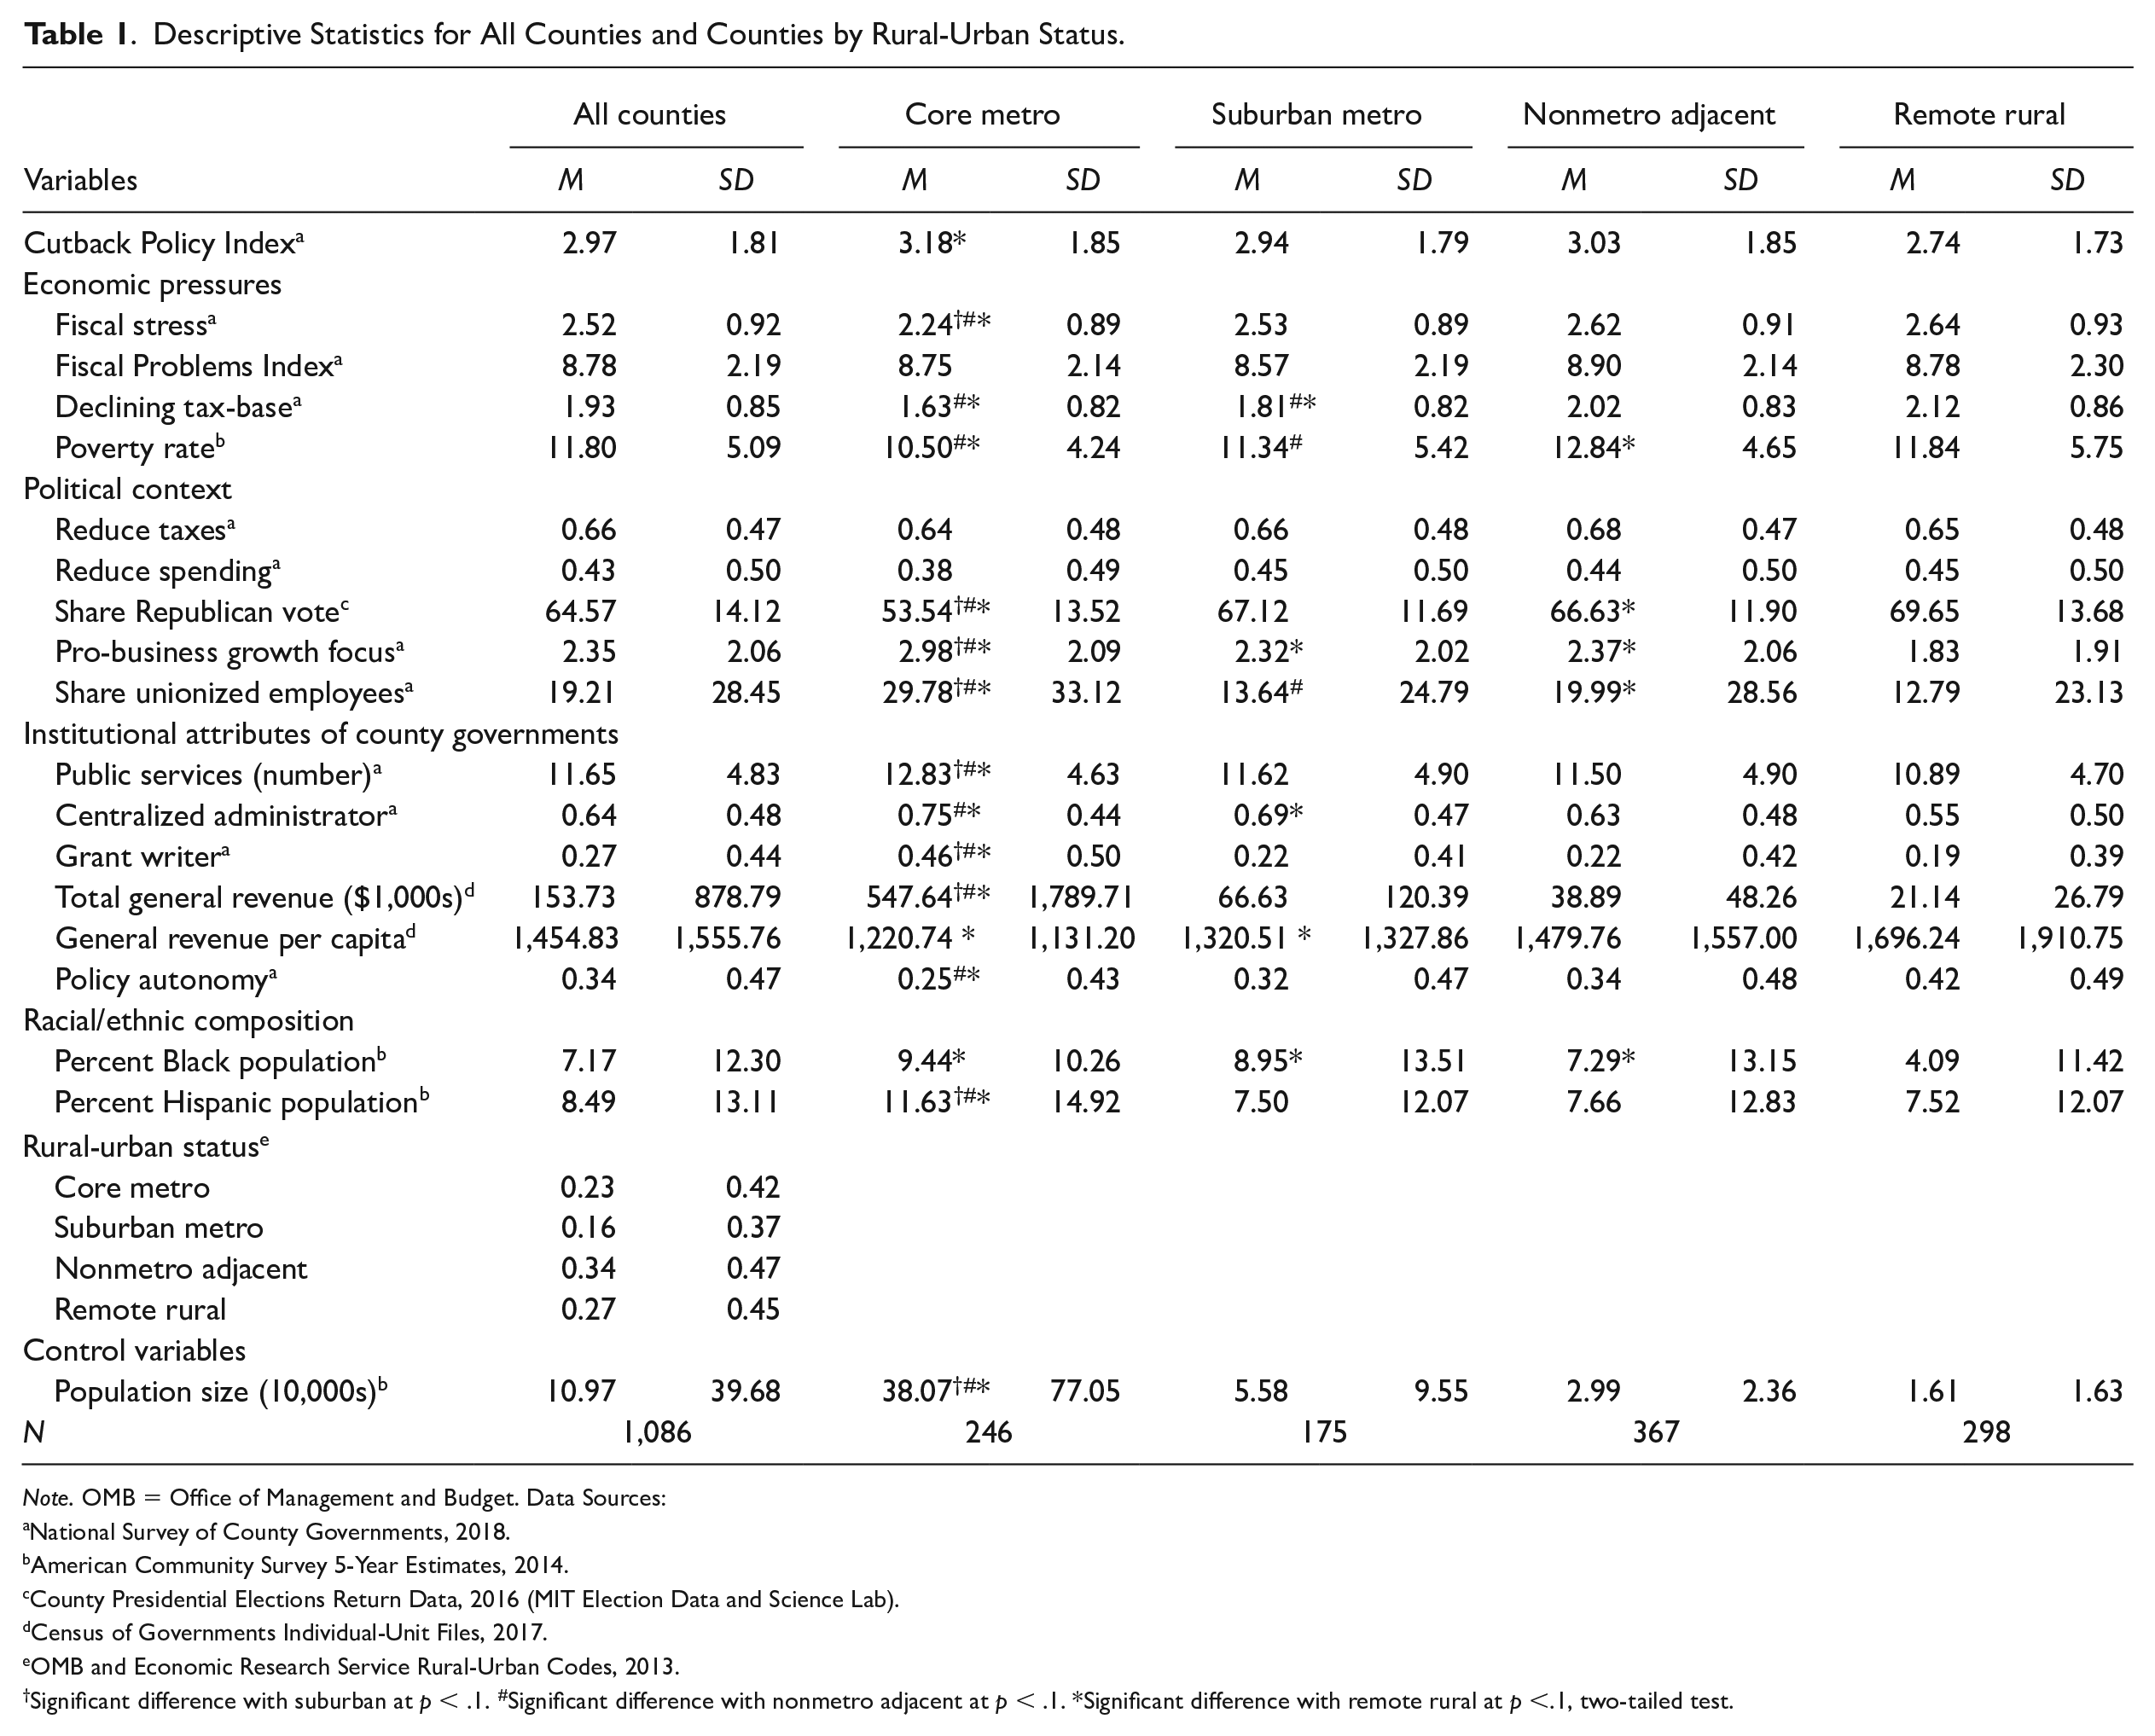
Note. OMB = Office of Management and Budget. Data Sources:
National Survey of County Governments, 2018.
American Community Survey 5-Year Estimates, 2014.
County Presidential Elections Return Data, 2016 (MIT Election Data and Science Lab).
Census of Governments Individual-Unit Files, 2017.
OMB and Economic Research Service Rural-Urban Codes, 2013.
Significant difference with suburban at p < .1. #Significant difference with nonmetro adjacent at p < .1. *Significant difference with remote rural at p <.1, two-tailed test.
Turning to economic pressures, core metro counties fare best with lowest reported fiscal stress, tax-base decline, and poverty, while overall nonmetro counties fare worse. Interestingly, fiscal problems brought about by state/federal governments are reported at similar levels across counties, indicating that operating difficulties are widespread. Most counties report they experience problems related to decentralized governance such as state/federal mandates and spending restrictions that affect their finances.
Regarding political context, our findings challenge some common assumptions about urban and rural communities. Pressures to reduce taxes and spending are not greater in rural places. Rather they are widespread. Sixty-six percent of counties report pressure from local taxpayers to reduce taxes and 43 percent report pressure to reduce spending. Moreover, core metro counties are the most pro-business oriented in policies they undertake. As expected, core metro governments are the most unionized and their residents were least likely to vote Republican.
Governmental attributes vary by urban-rural status in unique ways. Core metro counties have highest capacity along several indicators: they are most active in providing public services and most likely to have centralized administrations and grant writers. General revenue is highest in core metros but not on a per capita basis. Remote rural counties have greater per capita revenue. As noted, such counties tend to need more revenue to cover sparsely distributed populations. Finally, core metros report less policy autonomy from state government. 21 Because core metros are more activist overall, they may be more likely to run into state interference.
In sum, core metro counties differ most from others, particularly remote counties. Yet surprising similarities exist in how all counties experience some fiscal and political pressures. 22
Multivariate Analyses
Following study objectives, we first analyze the full sample to assess whether urban austerity theory can be extended to the nation as whole, urban and rural communities. We then focus on within-urban and within-rural differences.
Results from multivariate analyses for the full sample are based on state fixed-effects, OLS (ordinary least squares) regression models. As noted, state fixed-effects account for differences across counties due to state context. State differences could arise from the state’s policy, economy, or other factors and this provides a method of control used in multi-state studies (Adua and Lobao 2019). We also checked for whether an OLS, Poisson, or negative binomial regression best fit the distribution of our dependent variable and found that OLS was the best fitting model (based on log-likelihoods and Akaike information criterion [AIC]/Bayesian information criterion [BIC]). Additionally, we checked whether using a random-intercept for state location better accounted for cutback polices but found state fixed-effects models were better fitting.
We examined other methodological issues. Variance inflation factors show no high collinearity. We undertook sensitivity analyses to ensure the findings reported remained stable. These included analyzing other potential independent variables. We examined home rule status, revenue changes, and whether the county reported any debt, but these measures were not statistically significant. We also checked for potential interaction effects between urban-rural status and other variables. One was statistically significant as we explain below. Finally, we checked whether the results reported are nationally representative. We compared them to weighted analyses where county variables are weighed in proportion to the full national population of counties. The results are similar in significance and direction of relationships to the unweighted results reported here.
Cutback policies across urban and rural America
In Table 2, we report the results for the full sample. Here, we use core metro counties as the comparison category as they parallel the focus of urban austerity theories. Thus, relationships for suburban metro, nonmetro adjacent, and remote rural counties are interpreted relative to this category. The first model (Model 1) shows that core metro counties vary significantly only from remote rural counties (b = −.441, p < 0.01) in their relationship to cutback policies. In Model 2, we add the other independent variables. If urban theories fully applied to rural as well as urban communities, we would expect that the covariates (derived from theory) would explain this difference with remote rural counties; however, the coefficient for remote rural counties remains significant. We then tested for interaction effects. We found that fiscal stress sets core metro counties apart from remote rural counties. Including this interaction term in the model effectively explains the difference. We focus on Model 3 to discuss this and other relationships.
OLS Regressions of Cutback Policy Index Among Counties (N = 1,086).
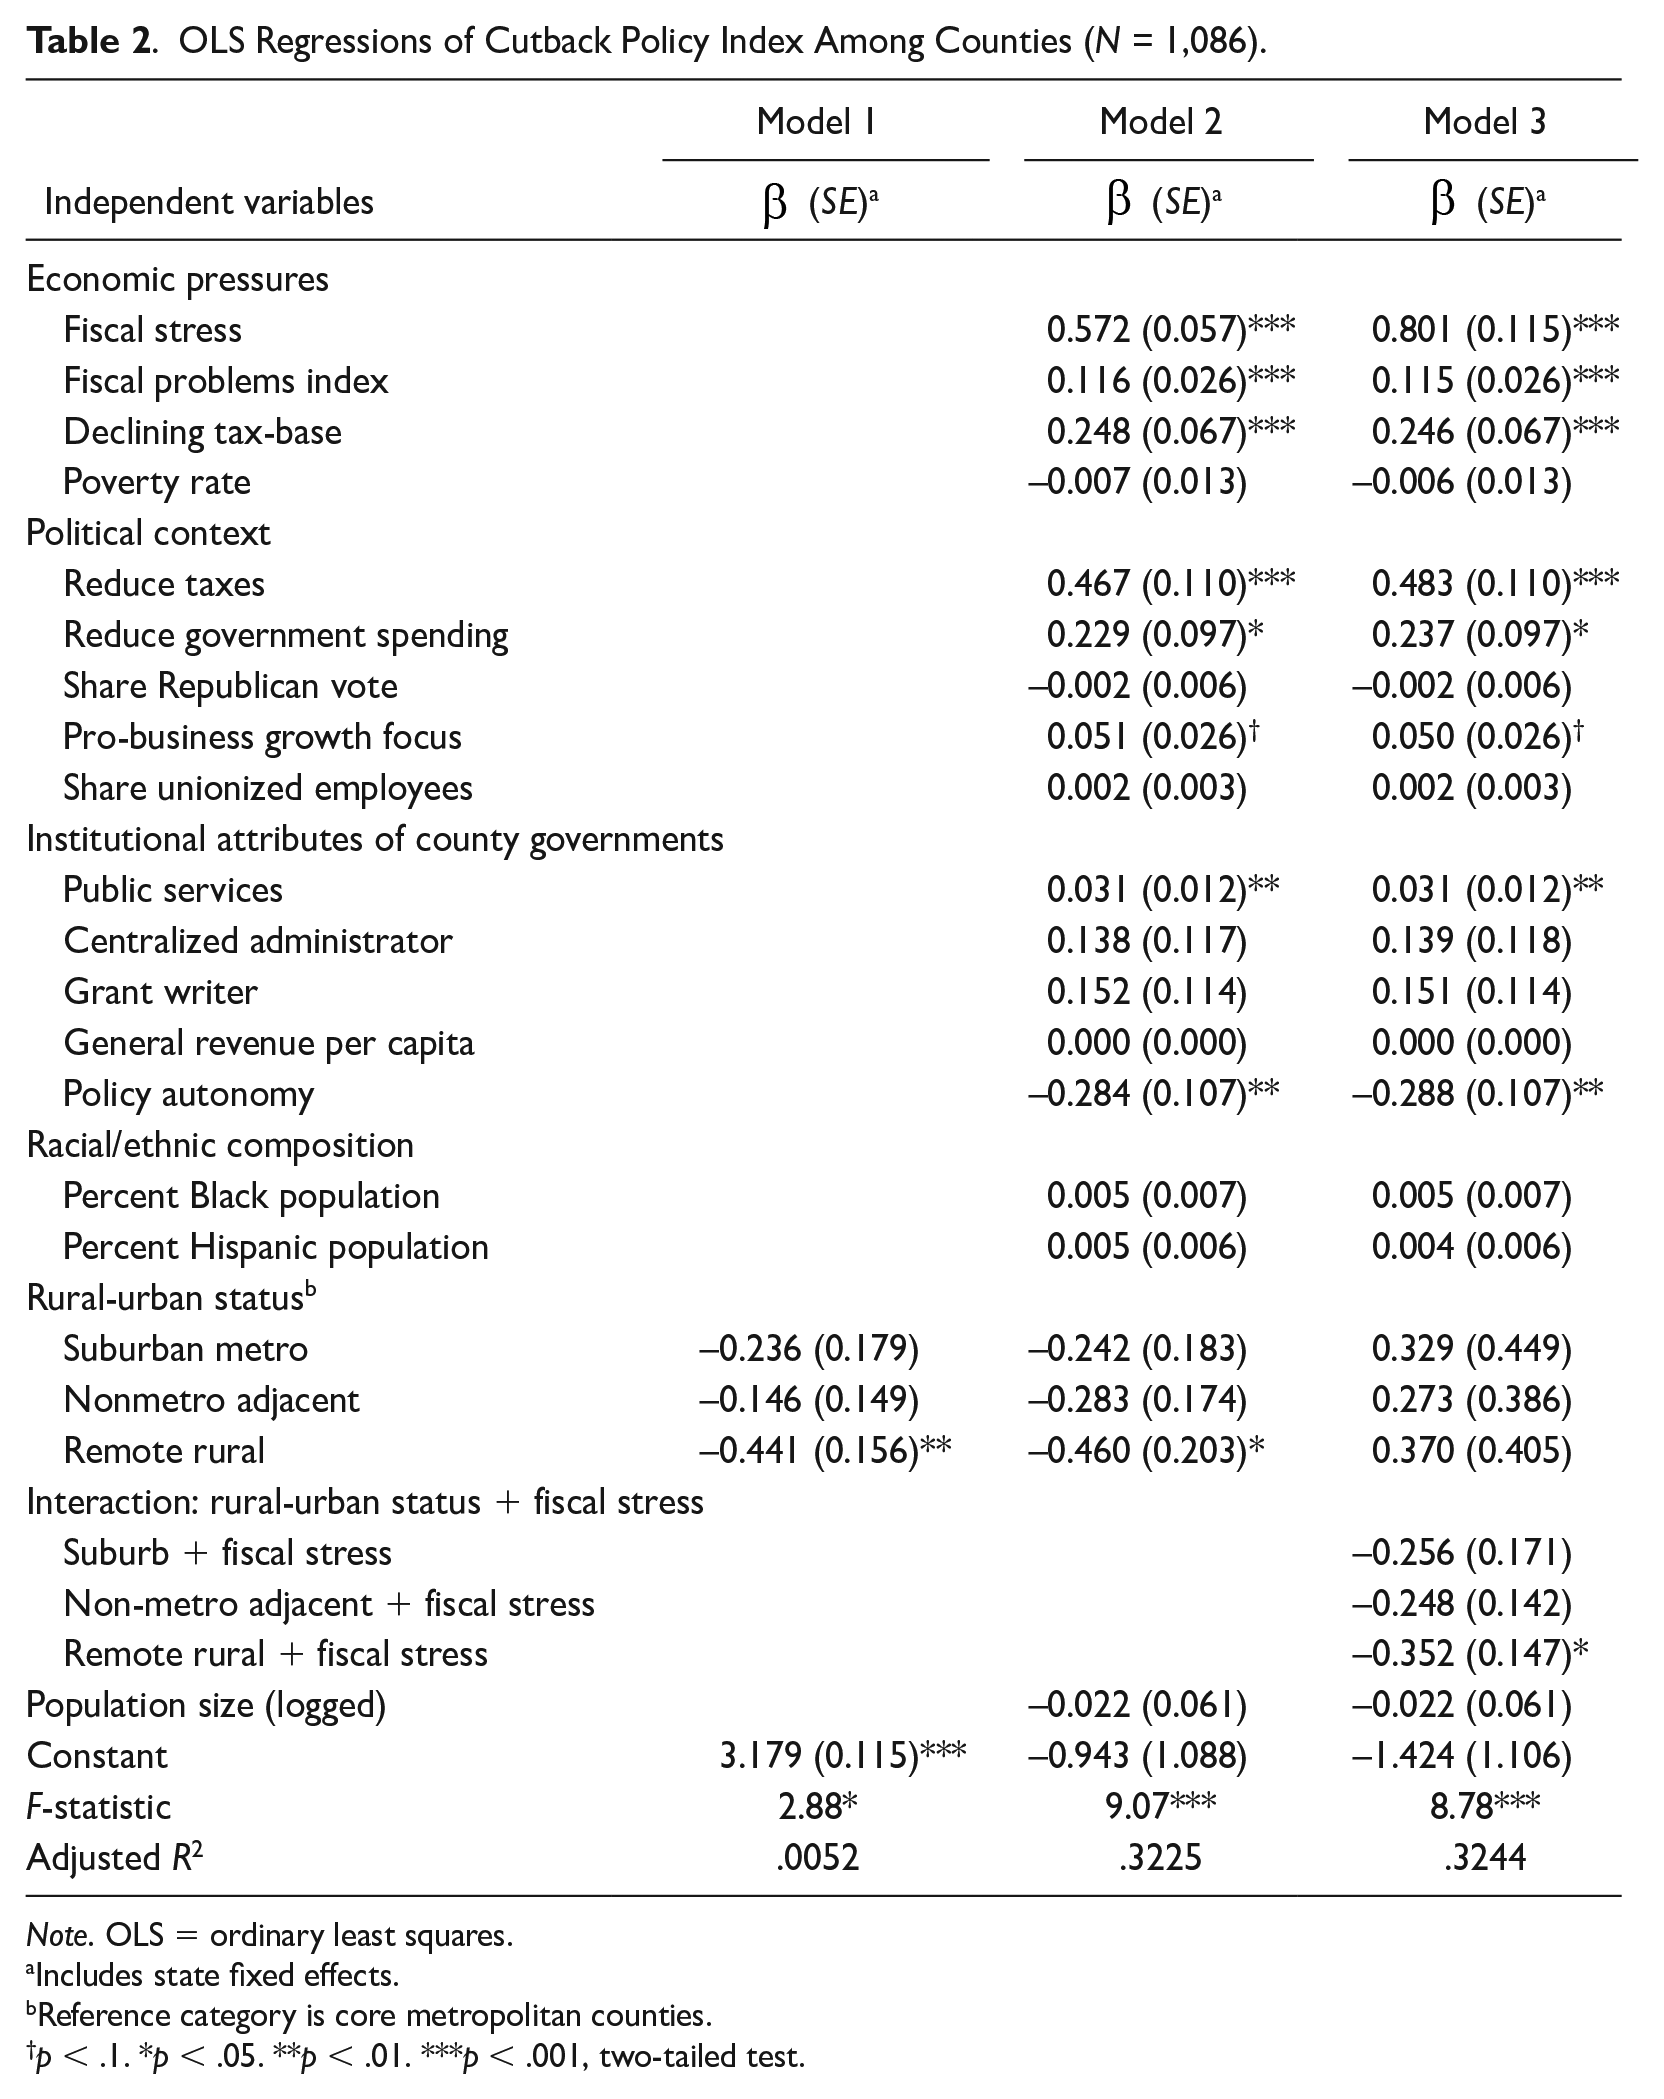
Note. OLS = ordinary least squares.
Includes state fixed effects.
Reference category is core metropolitan counties.
p < .1. *p < .05. **p < .01. ***p < .001, two-tailed test.
Our study confirms theorists’ emphasis on economic pressures with findings that extend across the United States. Both political-economic and institutional perspectives recognize the importance of such pressures. County governments that face greater pressures from current fiscal stress, financial problems from upper-level governments, and a declining tax-base report significantly more cutbacks. Poverty is not related to cutbacks: this indicates the unique financial situation of each government is more at the root of cutbacks rather than whether the community is structurally low or high income. These same relationships are confirmed in another analysis (available from the authors) that only includes economic pressure variables, indicating that austerity conditions (i.e. fiscal stress, financial problems, and tax base decline) felt across all local governments are linked to cutback policies.
Findings for political context provide some support for its emphasis in political economy perspectives. Pressures to reduce county government taxes and spending are significantly related to greater use of cutbacks. Few, if any, nationwide studies investigate such pressures. These unique findings support contentions that citizens’ anti-government views influence local policies. Counties with pro-business climates are also somewhat more likely to use cutbacks. However, in contrast to what might be expected from political economic perspectives, counties that voted Republican did not significantly differ from other counties. This follows some empirical work (discussed earlier) that finds few differences between Democratic and Republican leaning communities in use of cutback-type policies. 23 More highly unionized counties also did not vary appreciably from others.
Institutionally oriented perspectives stress the qualities of local governments. We find that activist governments, those providing more public services, use more cutbacks. This follows studies noted earlier which indicate activist governments are prone to trimming expansive agendas. Counties with greater reported autonomy from state government are significantly less likely to use cutbacks. Greater autonomy appears to provide flexibility to adapt to locally specific conditions and thus to avoid cutbacks, supporting institutionally oriented perspectives. However, neither revenues nor staff capacity are significantly related to cutbacks.
For ethno-racial composition, there are no significant differences. In the national context, communities are using cutback policies at similar levels irrespective of composition.
Finally, to compare whether the relationships above vary between urban and rural communities, we tested for interaction effects but found little evidence. This indicates that variables derived from theory tend to operate similarly across communities regardless of urban-rural status. As noted, one significant interaction effect exists with fiscal stress and core metro-remote counties. By including the interaction term in Model 3, the coefficient for remote rural counties (significant in Model 2) becomes non-significant. The interaction term (b = −.352, p < .05) shows that fiscal stress has a stronger impact in core metros (relative to remote rural counties) in increasing the number of cutback policies. This fits with Peck’s (2012) austerity urbanism in its emphasis on fiscal stress in large cities. Thus, large cities experiencing more fiscal stress particularly characterize the current context of austerity policy adoption in the United States.
Cutback policies within urban and rural communities
Table 3 presents within urban-rural analyses. As samples for each community type are smaller and more homogeneous than for the full sample, relationships are more truncated. These analyses likewise show that variables derived from both political economic and institutionally oriented perspectives differentiate communities.
OLS Regressions of Cutback Policy Index by Counties’ Rural-Urban Status.
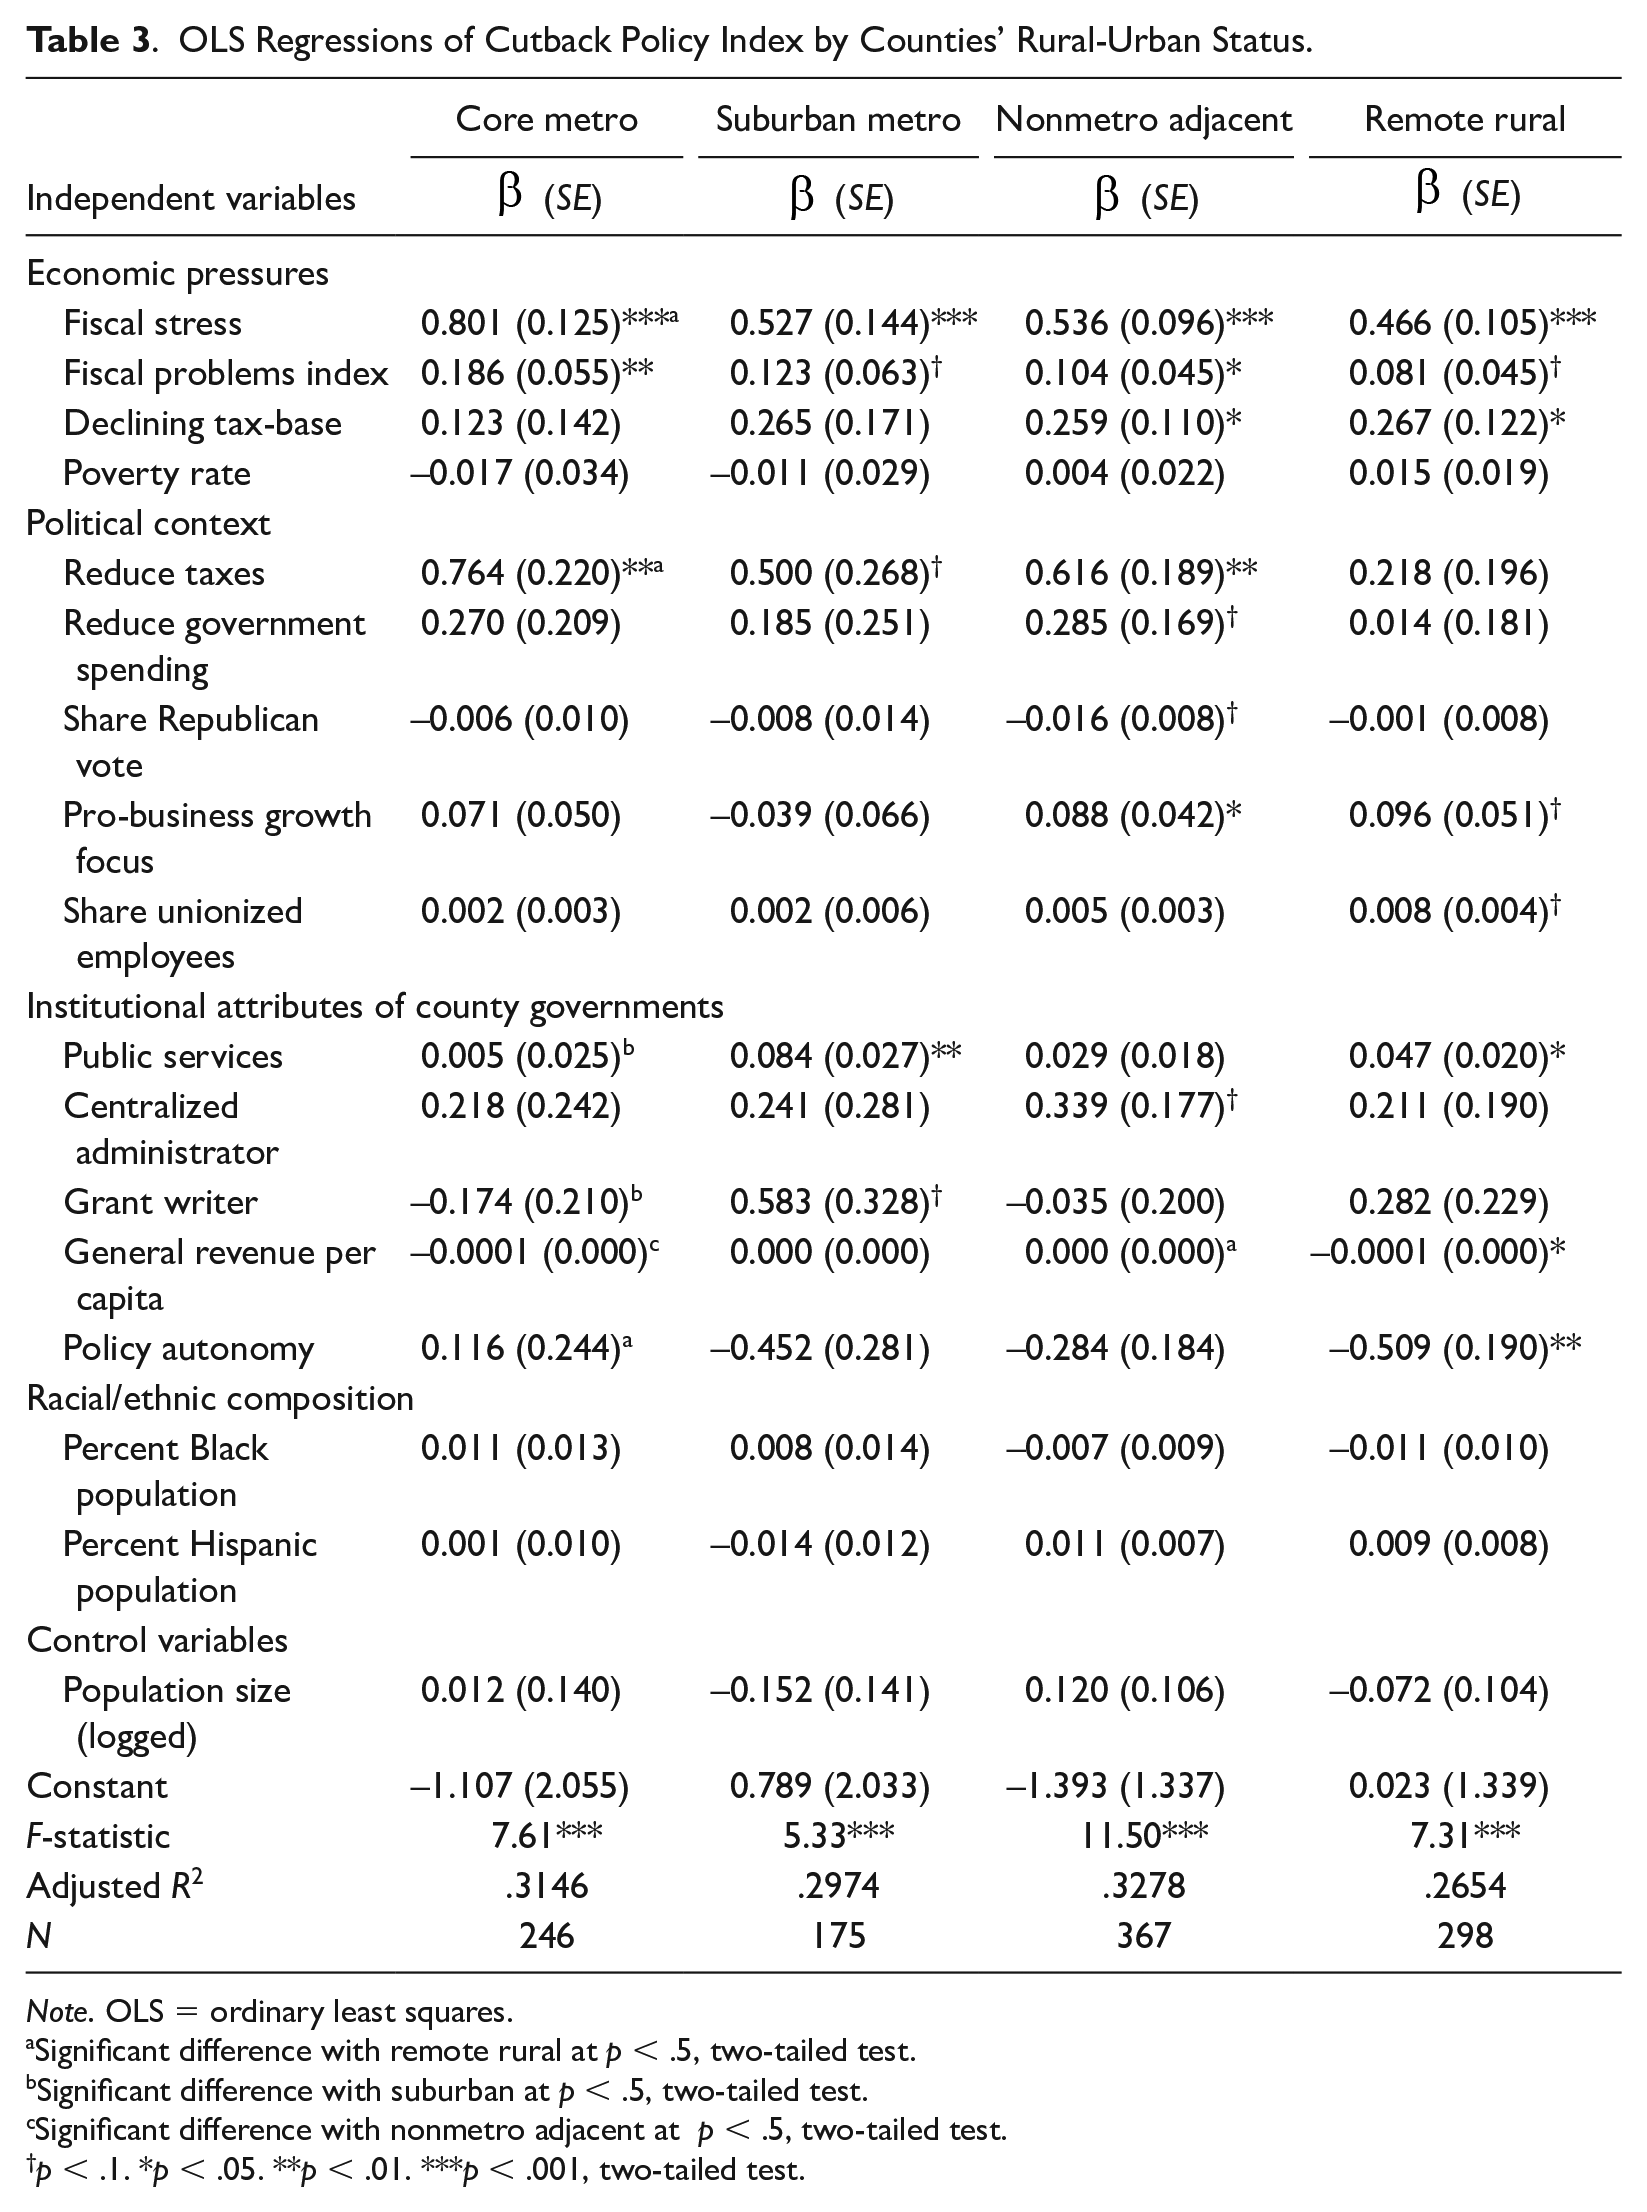
Note. OLS = ordinary least squares.
Significant difference with remote rural at p < .5, two-tailed test.
Significant difference with suburban at p < .5, two-tailed test.
Significant difference with nonmetro adjacent at p < .5, two-tailed test.
p < .1. *p < .05. **p < .01. ***p < .001, two-tailed test.
Among core metro counties, recent fiscal pressures are the main factors that differentiate counties using more cutback policies. Again, this fits with political economic portrayals that fiscally stressed large cities are the site of cutbacks. Pressures from residents to reduce taxes also significantly affect cutbacks. As core metros generally have high capacity and political similarities, few other differences are statistically significant.
For suburban metros, fiscal pressures and public service activism differentiate counties. Suburban metros, which are often growing communities, face pressures from providing services (Kim and Warner 2017). Greater public service provision is significantly associated with cutbacks. To some degree, suburban metros with greater staff capacity (i.e., grant writers) also employ more cutback policies, potentially because they can better manage outcomes. Finally, anti-tax pressures have some influence on suburbs.
Cutback policies in nonmetro counties stem from varied factors. This highlights the fact that rural communities are not homogeneous. Nonmetro adjacent counties are larger and more diverse than remote counties (see Table 1). Recent fiscal pressures, tax-base decline, and political context differentiate these counties. Notably, tax-base decline, a greater problem in nonmetro counties overall, is significantly associated with cutbacks. Catering to business with pro-growth policies in the attempt to recapitalize communities is further related to cutbacks. Additionally, the role of politics is seen in anti-government views about taxing and to some degree spending. Nonmetro adjacent counties voting more Republican, however, use slightly fewer cutbacks, again showing that formal political partisanship is not consistently related to cutback policies.
Remote rural counties are differentiated by economic pressures, both fiscal stress and tax-base decline, and governmental attributes. Here, counties tend to be more minimalist in public service provision. Activist counties that reach out to provide more services employ significantly more cutbacks. Counties having lower per capita revenue and less policy autonomy likewise use significantly more cutbacks. Finally, political factors as indicated by pro-business policies and unionization are related to cutbacks in the direction posited by theory.
Based on the coefficients in Table 3, we can compare across counties to assess whether nationally there are different worlds of cutback processes. Chow tests for the equality between coefficients show that of the 68 relationships displayed, only seven are statistically significant across metro-nonmetro categories. Hence, factors drawn from theory generally play a similar role across urban and rural America.
Conclusions
A variety of urban theories offer explanations for why communities adopt cutback policies. Large cities are generally the touchstone. We develop a synthesis of explanations. Some attend more to communities’ economic and political context; others offer a more institutional stance, adding the agency of local governments. Using this synthetic approach, we document the characteristics of communities that create variation in the use of cutback policies. In terms of advancing theory, we illustrate how bodies of work from different traditions can be complementary. We bring out points of overlap and show how bridging traditions offers new insights for extending austerity theory across a range of communities.
Our study is based on a comparative analysis using original primary and secondary data. To our knowledge, it is the most recent large-scale, nationwide community study of cutback policies and among the first to compare urban and rural America. We follow the urban quantitative survey method of collecting primary data (C. Clark 2000) to provide locally specific information on policies and policy determinants where secondary sources do not exist. As discussed, studies using this methodology have limitations with the construction of variables and response rates and ours is no exception. We noted that our use of sensitivity analyses ensure the results are representative; that different measures and variables were assessed as to their performance; and that potential methodological issues such as collinearity are not present. Like other large-scale quantitative studies of austerity policies, our study is limited to one time period and thereby to determining causality. Comparative case studies of these policies likewise tend to focus on single periods such as the Great Recession. In the future, panel design studies that track austerity policies nationwide across the same communities over time would improve theory and understanding of causal relationships.
With large cities guiding the formulation of austerity theory, researchers have seldom analyzed whether systematic variation across different types of communities exists. This diminishes our understanding of austerity processes everywhere, urban as well as rural communities. Our study sheds light on open questions and new issues raised by theory.
First, with a full national analysis, we find that economic pressures, political context, and local government attributes influence the use of cutbacks. Our national analysis along with tests for urban-rural differences indicates that policy processes generally work across U.S. communities in a similar manner, kindred factors promoting cutbacks. There are not distinctly separate worlds of policy processes. This supports our contention that urban austerity theories can be pushed beyond their conventional focus. It also demonstrates that urban and rural communities should not be treated in binary fashion but rather along a continuum.
Second, when looking across communities, in some ways, the urban story of austerity becomes more compelling when cast against the rural. As noted, austerity theories are unclear whether cutbacks are used more in rural communities as opposed to the more progressive cities. We find that large core metros use a greater number of cutbacks. That relatively high capacity, activist localities cut back operations more corresponds with the attention given to cities in theorizations of austerity urbanism.
Third, when we look within urban and within rural communities, we find that theory plays out in some contextually specific ways. For metro areas, fiscal difficulties play an important role in differentiating large metros that use more cutback policies; while for nonmetro areas, a greater range of fiscal, political, and institutional factors differentiate communities. Still for the most part, as shown in Table 3, these variations within each type of community are not so dramatic as to signal that separate processes are operating in urban versus rural communities.
Fourth, our study sheds light on factors suggested by scholars to influence cutbacks but that are not well-studied. A unique contribution is our finding that pressures from residents to reduce taxes and spending are related to cutback policies across all communities. These pressures also differentiate communities within the same metro-core, suburban, and nonmetro adjacent category. Political economy perspectives observe that local populations may internalize worldviews about limiting government through taxing and spending which pushes localities toward cutback policies. Our findings are consistent with this observation.
Another understudied issue comes from Hackworth’s (2019) critique that austerity theories neglect racial/ethnic divisions, particularly as marked by communities’ racial composition. He clarifies that his findings about racial composition are limited to large Rust Belt cities. Our study responds to the lack of research on this issue. Nationally, our findings show that communities make similar use of cutback policies even though racial/ethnic composition may vary. These findings are not incompatible with Hackworth’s (2019) because our research context is different. Still our study is limited in that we cannot drill down into intra-metropolitan relationships and points to the need for researchers to analyze other geographic contexts.
Our study has highlighted how bridging theoretical approaches can be a fruitful path to analyzing community policies. Attention to variation among local governments fills in a gap in political economic perspectives, while our findings about communities’ political context show that institutionally oriented perspectives could give more attention to structural constraints. Relationships derived from political economic and institutionally oriented traditions thus provide joint insights across urban and rural communities. Our findings do not suggest that one tradition should be elevated over another. Tensions and nuances among theories of course exist. Our study is limited in providing a brief synopsis of theories and stressing a synthesis of perspectives aimed at understanding urban-rural variations.
Finally, our study provides new insights about urban-rural community differences that challenge conventional assumptions about the politicization of space. As noted, pressures on counties to reduce taxes and spending are not just confined to ostensibly right-wing rural constituencies but pervade large-core metros as well. Likewise, urban and rural counties report similar concerns with fiscal well-being due to problems introduced by upper-level governments. In this sense, urban as well as rural governments have been stymied in the contemporary period.
Our study calls for broadening the scope of urban theory and research to a range of communities. Urban and rural communities can and should be placed on the same continuum. This would shed greater light on community processes and penetrate more of the urban-rural divide that has seemingly polarized the nation.
Footnotes
Funding
The author(s) disclosed receipt of the following financial support for research, authorship, and/or publication of this article: Funding for this study was provided by USDA-NIFA, Grant No. 2021-67023-34437.