The Women’s Empowerment in Agriculture Index (WEAI) is a standardized, survey-based tool that has been widely used to track gender equality and measure empowerment, agency, and women’s inclusion in the agricultural sector (Alkire et al., 2013, World Development 52: 71–91). Since the WEAI’s release in 2012, an abbreviated version of the WEAI (A-WEAI) and a project-level version of the WEAI (pro-WEAI) have been developed (Malapit et al., 2017, The abbreviated Women’s Empowerment in Agriculture Index [A-WEAI]; Malapit et al., 2019, Development of the project-level Women’s Empowerment in Agriculture Index [pro-WEAI]). In this article, we review the shared methodology that underlies all members of the WEAI family of indices and introduce a command, weai, that can be used for index calculation. We describe the command and its options and provide empirical examples using publicly available data from the Gender, Agriculture, and Assets Project, Phase 2.
Achieving gender equity and women’s empowerment is important intrinsically to advance the well-being of all people, as well as instrumentally as a means to improve other development outcomes. This is particularly relevant for agriculture and agrifood systems, which employ 36% of working women globally (FAO 2023). Over the past decade, the increased attention to gender equity and women’s empowerment also facilitated the development of new measurement tools and data collection efforts that enable researchers and practitioners to generate valuable insights for development interventions and policies.
One popular metric is the Women’s Empowerment in Agriculture Index (WEAI), a standardized, survey-based tool that has been widely used to track gender equality and measure empowerment, agency, and women’s inclusion in the agricultural sector (Alkire et al. 2013). To date, WEAI-based metrics have been collected in 62 countries by 256 organizations, including international development organizations like the Food and Agriculture Organization of the United Nations, the International Fund for Agricultural Development, UN Women, the World Food Programme, and the World Bank. Since the WEAI’s release in 2012, an abbreviated version of the WEAI (A-WEAI) and a project-level version of the WEAI (pro-WEAI) have been developed (Malapit et al. 2017, 2019).
Empowerment is a complex, multidimensional concept. The WEAI uses Kabeer’s (1999) definition of empowerment: the ability to make strategic decisions, particularly in contexts where this ability has been denied to people. Thus, a measure of empowerment should be able to capture this ability or lack thereof across different dimensions and simultaneously be able to compare these achievements for women and men within households to measure the gender gap. Notably, measuring “disempowerment” has many similarities to measuring multidimensional poverty in that it also seeks to directly capture critical shortfalls (lack of agency) in different dimensions, and the policy goal is to find ways to address the constraints faced by the poor (the “disempowered”). To be effective, a measure of empowerment should be easy to communicate and understand while also being technically sound in capturing the relevant aspects of empowerment experienced by the population of interest. Therefore, the Alkire–Foster approach that underpins the Multidimensional Poverty Index (MPI) is a useful example to follow because it is simple to communicate and the composition of the index is fully transparent (Alkire and Foster 2011a). However, preparing the data and calculating these indices are challenging, especially in lowand middle-income country settings where the capacity of partners is limited. For example, Suppa (2023) notes that it is not uncommon to accumulate around 2,000 point estimates for preparing multidimensional poverty results for a single country alone, and these challenges compound when analyzing data across countries and time periods. The weai command aims to simplify this process for researchers and practitioners.
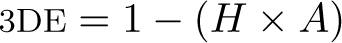
Following the Alkire–Foster dual-cutoff-counting methodology (Alkire and Foster 2011b), the WEAI constructs individual-level empowerment profiles that reflect a person’s overlapping achievements in different domains and aggregates them to create individual-level component indicators and an aggregate subindex called the five domains of empowerment (5DE) for WEAI and A-WEAI and the three domains of empowerment (3DE) for pro-WEAI. The 5DE and 3DE are reported separately for women and men and can be decomposed at the subgroup and indicator levels. A unique aspect of the WEAI, distinct from the MPI, is the Gender Parity Index (GPI), which compares the achievements of women and men within the same household and is aggregated at the subgroup or program level. While the addition of the GPI distinguishes the WEAI family of metrics from the MPI, it satisfies the same desirable properties, such as replication invariance, symmetry, disempowerment focus, and weak monotonicity (Alkire and Foster 2011a,b). The overall index, subindices (5/3DE), and GPI are useful for summarizing the extent of empowerment and gender parity at a glance, facilitating comparisons across countries and over time. The individual indicators on the other hand are useful for diagnosing the constraints to disempowerment for women and men and can be used to prioritize investments in particular areas. WEAI users have reported both features to be complementary. Donors and policymakers can use the indices to track progress and advocate for more resources, while practitioners can use the individual indicators to design and measure the impact of programs and interventions.
In this article, we review the methodology for calculating the WEAI family of multidimensional empowerment indices and describe how to apply it in Stata with the weai command. The weai command is a new tool for WEAI users that draws from the mpi command (Pacifico and Poege 2017). While users must still process the WEAI survey data into indicators, the weai command streamlines the analysis of WEAI data by automating index calculation. It enables users to construct different versions of the WEAI, including A-WEAI and pro-WEAI, and is flexible in the specification of the binary adequacy indicators, empowerment cutoff, and indicator weights. Results are decomposed by indicator and, when specified, by subgroups.
The article proceeds as follows: section 2 provides a brief review of the WEAI methodology, section 3 presents the weai command and the main options, section 4 provides an empirical application based on example data, and section 5 concludes.
Index calculation
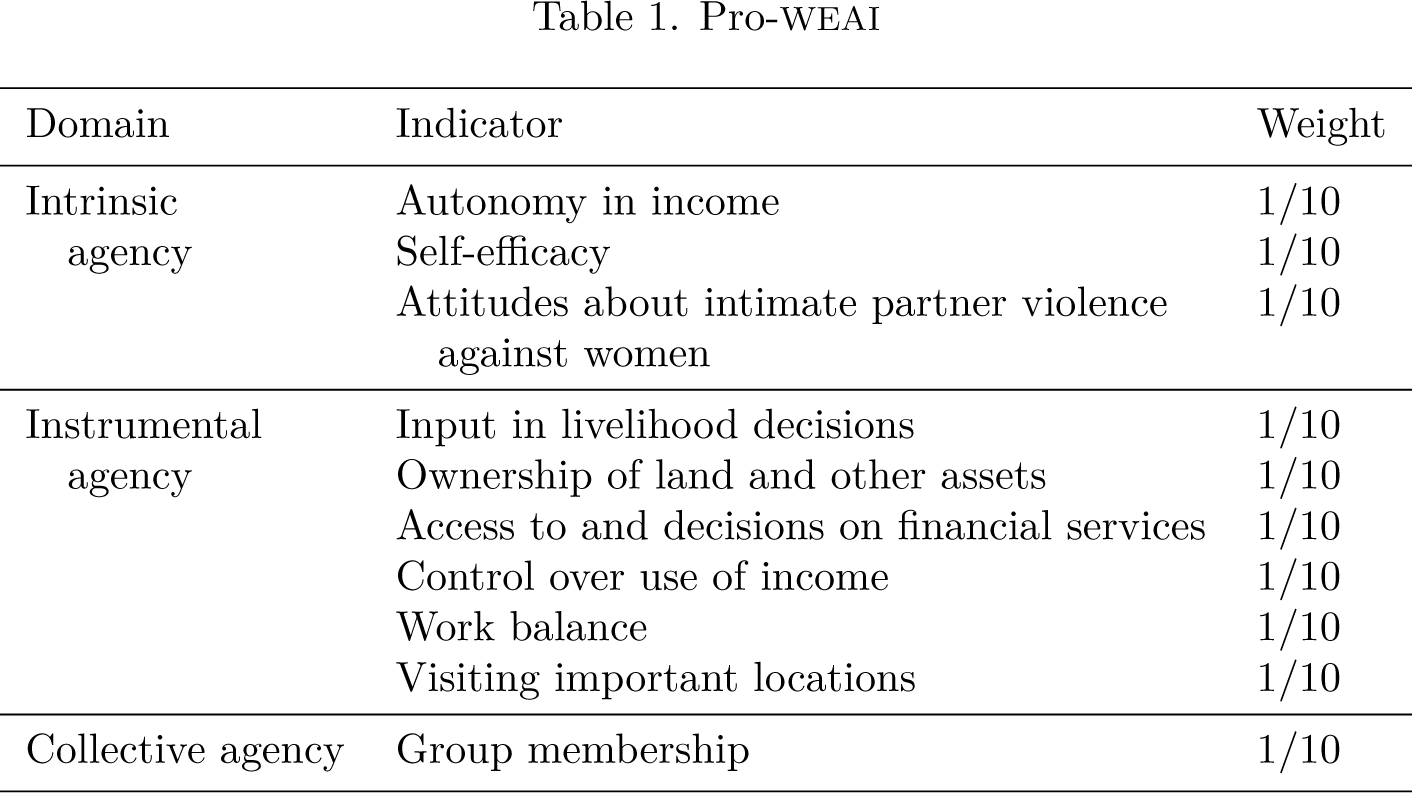
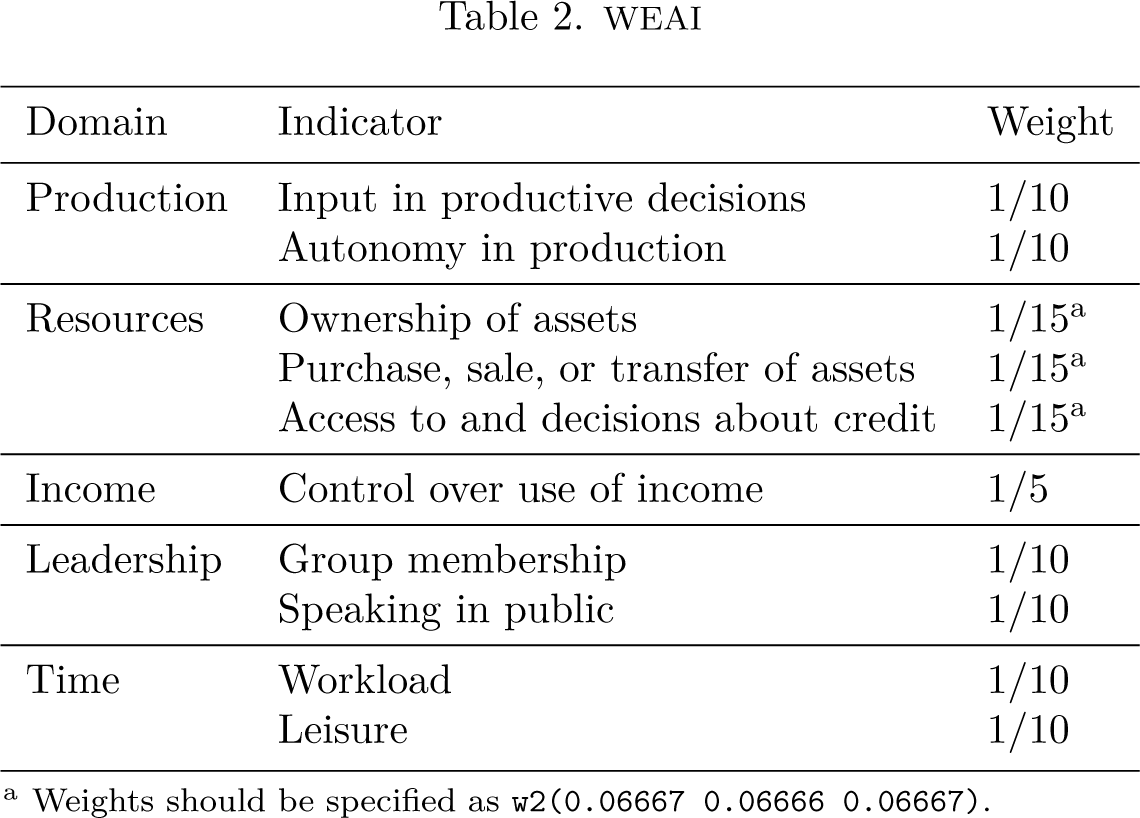
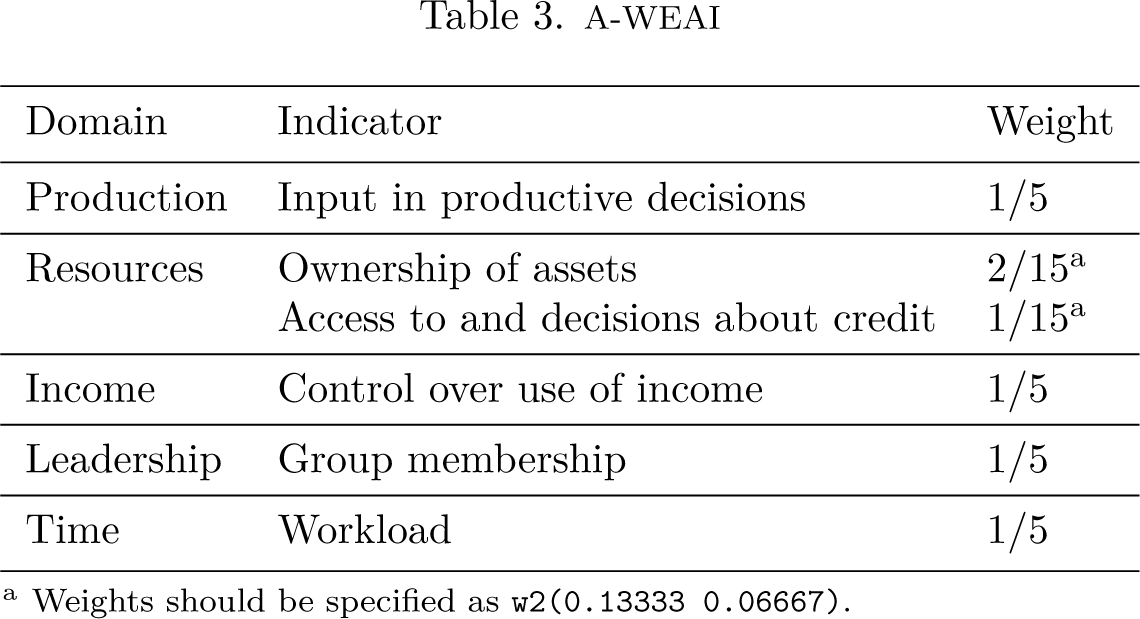
This section briefly describes the methodology used to calculate the WEAI family of multidimensional empowerment indices. For more in-depth discussion of the WEAI methodology, please see Alkire et al. (2013) and Malapit et al. (2017, 2019). Tables 1–3 show the indicators and weighting structures used in pro-WEAI, WEAI, and A-WEAI, respectively. In WEAI and A-WEAI, each of the five domains and the indicators within are equally weighted. In pro-WEAI, on the other hand, all indicators are equally weighted regardless of domain. Despite the differences in indicators and weights, pro-WEAI, WEAI, and A-WEAI rely on the same underlying measurement concepts, based on the Alkire– Foster methodology (Alkire and Foster 2011b). Hence, while we nominally focus in this section on the concepts used to calculate pro-WEAI, the discussion applies equally to WEAI and A-WEAI except where explicitly noted.
Pro-WEAI
Domain
Indicator
Weight
Intrinsic agency
Autonomy in income
1/10
Self-efficacy
1/10
Attitudes about intimate partner violence against women
1/10
Instrumental agency
Input in livelihood decisions
1/10
Ownership of land and other assets
1/10
Access to and decisions on financial services
1/10
Control over use of income
1/10
Work balance
1/10
Visiting important locations
1/10
Collective agency
Group membership
1/10
WEAI
Domain
Indicator
Weight
Production
Input in productive decisions
1/10
Autonomy in production
1/10
Resources
Ownership of assets
1/15a
Purchase, sale, or transfer of assets
1/15a
Access to and decisions about credit
1/15a
Income
Control over use of income
1/5
Leadership
Group membership
1/10
Speaking in public
1/10
Time
Workload
1/10
Leisure
1/10
Weights should be specified as w2(0.06667 0.06666 0.06667).
A-WEAI
Domain
Indicator
Weight
Production
Input in productive decisions
1/5
Resources
Ownership of assets
2/15a
Access to and decisions about credit
1/15a
Income
Control over use of income
1/5
Leadership
Group membership
1/5
Time
Workload
1/5
Weights should be specified as w2(0.13333 0.06667).
Data requirements
As noted above, all WEAI indices rely on data collected using specialized survey instruments and according to set interview protocols. WEAI and A-WEAI are designed to be implemented with the primary male and female adult decision-makers in a household. Pro-WEAI is designed to be implemented with the female beneficiary of an intervention and her spouse or, if she is unmarried, a primary male decision-maker in a household.
Following data collection, the raw survey data must be processed to create composite (binary) indicators, which are then aggregated to create a multidimensional index according to the methodology below. Each indicator is constructed from multiple survey items (questions) based on specific definitions and cutoffs. For details on the definitions and cutoffs used to construct the indicators in WEAI, A-WEAI, and pro-WEAI, please see Alkire et al. (2013) and Malapit et al. (2017, 2019), respectively, or visit the WEAI Resource Center.1 A do-file that automates the data-processing step is available on the “Guides and Instruments” page of the WEAI Resource Center, as are the WEAI survey instruments, enumerator manuals, and other guidance on index calculation.2
3DE
The 3DE index measures empowerment at an individual level. To calculate the 3DE, respondents are first classified as either adequate or inadequate in a given indicator by comparing their responses with the relevant survey questions with a given indicator-specific threshold. Empowerment scores are then calculated as a weighted average of respondents’ adequacy status in each indicator. As shown in tables 1–3, the specific indicators and weights used in pro-WEAI, WEAI, and A-WEAI differ. While pro-WEAI includes 10 equally weighted indicators, WEAI and A-WEAI include different indicators, equally weighted by domain. Following calculation of the empowerment scores, respondents are classified as either empowered or disempowered based on whether their empowerment score meets or exceeds a threshold of 80% (or 8 out of 10 indicators), referred to as the empowerment cutoff.
Formally, using similar notation as in previous work on the multidimensional measurement of poverty and women’s empowerment (Alkire and Foster 2011b; Alkire et al. 2013; Malapit et al. 2019), person i is considered inadequate if their level of achievement, xij, in indicator j is less than the adequacy cutoff, zj, for the indicator, xij<zj. Person i’s inadequacy score is calculated by summing the inadequacy status of all indicators, gij, multiplied by their corresponding weights, where . Person i is considered empowered if their inadequacy score, ci, is less than or equal to the disempowerment cutoff, k; that is, person i is empowered if ci ≤ k, where k = 0.2.3
The 3DE reflects the percentage of women in the sample who are empowered and the average empowerment score among disempowered women in the sample. It thus reflects how widespread empowerment is within the sample and how close disempowered women in the sample are to becoming empowered.
However, it is most succinctly calculated in terms of disempowerment, as shown here:
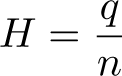
H refers to the disempowerment headcount ratio and is calculated as
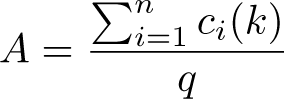
where q is the number of disempowered women in the sample and n is the total number of women in the sample. A is the mean share of weighted indicators in which women do not achieve adequacy (referred to as the disempowerment score) among disempowered women and is calculated as follows:
GPI
The GPI measures empowerment at the household level, based partly on comparison of the empowerment scores of the respondent and her spouse, or the male respondent, in each household. Households are classified as achieving gender parity if either of the following conditions is true: 1) the respondent is empowered, or 2) the respondent’s empowerment score is equal to or greater than her spouse’s empowerment score. Thus, all empowered women are classified as having achieved gender parity.
The GPI is based on the Foster–Greer–Thorbecke Poverty Gap (Foster, Greer, and Thorbecke 1984) and measures two aspects of empowerment in the sample: the proportion of households that achieves gender parity and the mean difference between men’s and women’s empowerment scores in households that lack gender parity.
The GPI is calculated as shown here:
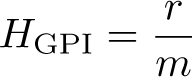
HGPI refers to proportion of households achieving gender parity and is calculated as
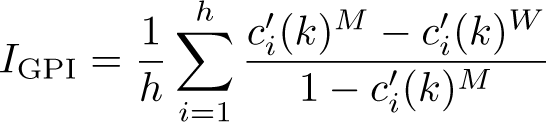
where r is the number of households in the sample that lack gender parity and m is the number of dual-adult households—that is, households that include an adult female and adult male—in the sample. IGPI refers to the average percentage shortfall that women without gender parity experience relative to men in their households, referred to as the empowerment gap, and is calculated as
where are the censored disempowerment scores of the woman and man, respectively, living in household i and h is the number of dual-adult households that lack gender parity.4
Pro-WEAI
Pro-WEAI is the weighted average of the 3DE and GPI, where the 3DE receives 90% weight and the GPI receives 10% weight. These weights reflect the greater overall importance of individual empowerment. The smaller weight assigned to GPI acknowledges the importance of empowerment dynamics within the household but also recognizes that the GPI can be calculated only in households where both men and women respondents are present.
The weai command
weai can compute all versions of the WEAI according to the methodology outlined in section 2. weai provides users with flexibility when specifying the binary adequacy indicators, empowerment cutoff, and indicator weights directly in the command line.
Syntax
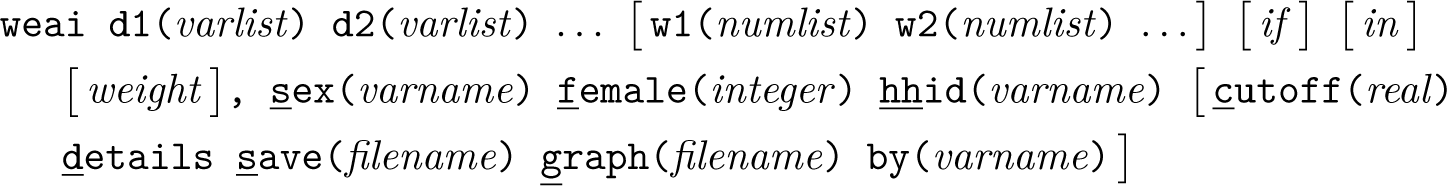
The general syntax for weai is
d1(varlist), d2(varlist), . . . denote the empowerment domains. At least one indicator must be specified for each domain, and at least three domains must be specified. The indicators should be binary variables (1 = adequate; 0 = inadequate). Respondents with missing values for any indicator are excluded from the estimation sample. Tables 1–3 show the domains, indicators, and weights for pro-WEAI, WEAI, and A-WEAI, respectively. Pro-WEAI is composed of 10 indicators across 3 domains (intrinsic agency, instrumental agency, and collective agency). WEAI is composed of 10 indicators across 5 domains (production, resources, income, leadership, and time). A-WEAI is composed of six indicators across the same five domains. Users must follow these guidelines to correctly calculate the indices. Guidance and background information on the construction of the indicators, as well as do-files, can be accessed on the WEAI Resource Center website.5
w1(numlist), w2(numlist), … denote the weights used when summing indicators to calculate the empowerment score. If indicator weights are unspecified by the user, all indicators receive equal weight if 3 domains are specified (that is, the weighting structure used by pro-WEAI). If indicator weights are unspecified and 5 domains are specified, indicators are weighted equally within each domain. See above for the weighting structures used by WEAI and A-WEAI. If weights are specified by the user, the following requirements apply: 1) weights must be values between 0 and 1 and must sum to 1; 2) the number of weights must equal the number of indicators; and 3) weights and indicators must be listed in the same order to ensure proper correspondence.
pweights and fweights are allowed; see [U] 11.1.6 weight.
Options
sex(varname) and female(integer) are required and, respectively, specify a variable and value that identify female respondents.
hhid(varname) is required and specifies a variable that uniquely identifies households.
cutoff(real) denotes the empowerment cutoff, or the minimum empowerment score required for a person to be considered empowered. The empowerment cutoff should be a value between 0 and 1. For each person, weai computes an empowerment score, that is, the share of weighted indicators in which they achieve adequacy. A person is considered empowered only if their resulting score is equal to or greater than the specified empowerment cutoff. If unspecified by the user, a default value of 0.80 (or 80% of the weighted indicators) is used, which reflects the cutoff used when calculating WEAI, A-WEAI, and pro-WEAI. A modified version of pro-WEAI may be calculated if at least 8 of 10 indicators, including at least 1 from each domain, are present in the index. For a modified version of pro-WEAI calculated with 8 or 9 indicators, the empowerment cutoff should be set at 0.75.
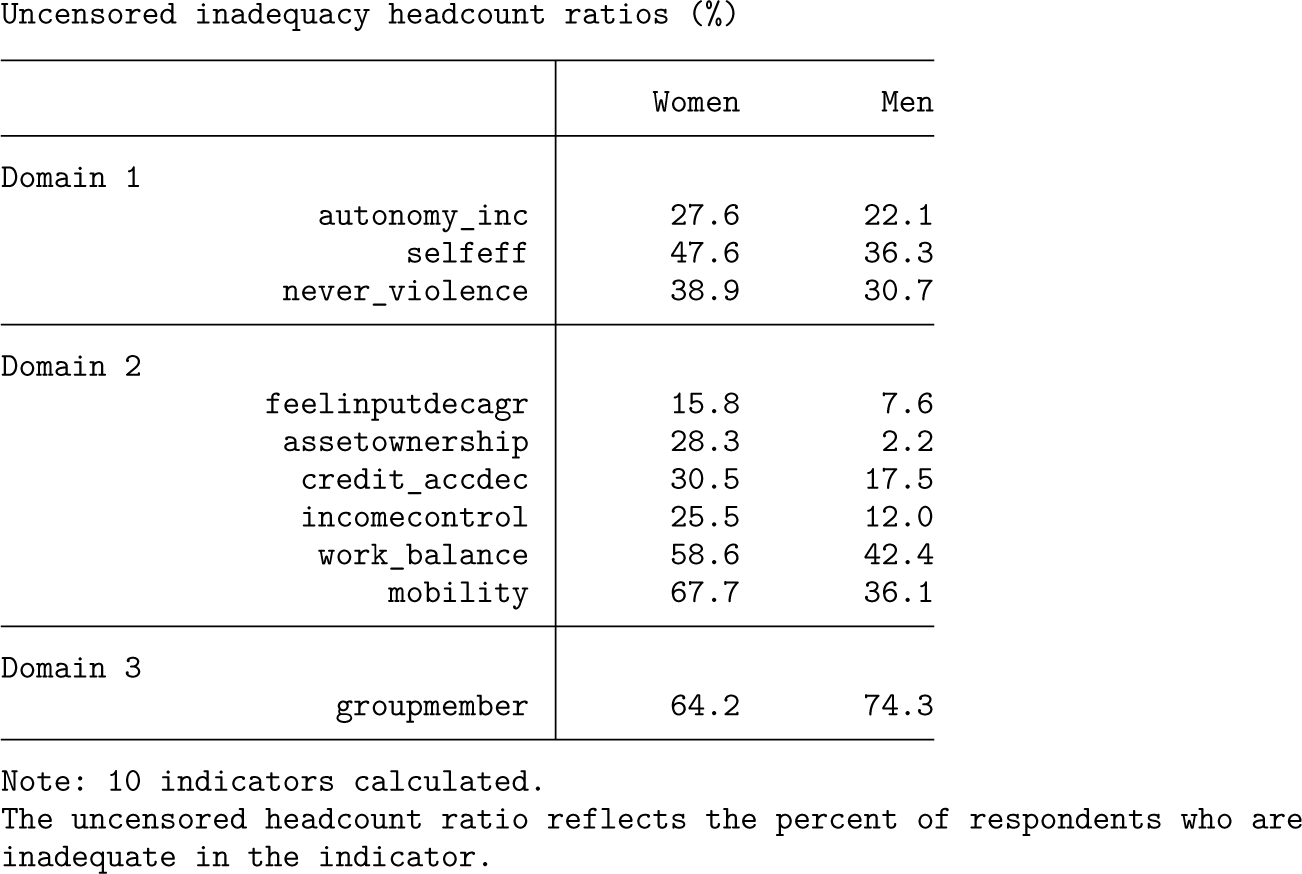
details provides additional tables showing 1) the uncensored inadequacy headcount ratio, that is, the proportion of women or men in the sample who are inadequate in an indicator, regardless of whether they are empowered or disempowered; 2) the censored inadequacy headcount ratio, that is, the proportion of women or men in the sample who are disempowered and simultaneously inadequate in an indicator; and 3) the relative contribution of each indicator to disempowerment, calculated by multiplying the censored inadequacy headcount ratio by the indicator weight and dividing by (1 −3/5DE).
save(filename) saves the results tables in Microsoft Word format (.docx) using filename.
graph(filename) displays a bar graph showing the absolute contribution of each indicator to disempowerment, calculated by multiplying the censored inadequacy headcount ratio by the indicator weight. This option saves the graph in Stata .gph format using filename. To reproduce the color scheme used in Malapit et al. (2019), use the weai scheme, provided in the ancillary files of the weai package. Note that labels for the binary indicator variables should be no longer than 80 characters to avoid an error.
by(varname) decomposes all output measures by the numeric categorical variable varname. Missing values are excluded from the estimation sample.
Stored results
Given a suitable set of adequacy indicators, sex, and household ID variables, weai computes all index components presented in section 2, displays the results in table format, and optionally saves them as a Microsoft Word document using filename. Related figures showing the absolute contribution of each indicator to disempowerment can be optionally generated and saved in Stata .gph format using filename. This format allows users to customize the figure or figures as needed using the Graph Editor. Last, weai computes and saves the following variables in the working dataset:
empowered: Empowerment status, a binary indicator that reflects whether a person is empowered (1 = empowered; 0 = disempowered).
emp_score: Empowerment score, the share of weighted indicators in which a person achieves adequacy. Higher scores reflect greater empowerment.
gender_parity: Gender parity status, a binary indicator that reflects whether a household achieves gender parity.
hh_ineq: Intrahousehold inequality score, the difference between the empowerment scores of the male and female respondents within the same household. A positive score indicates that the man is more empowered than the woman; a negative score indicates that the woman is more empowered than the man.
emp_index, gpi, and weai: The 5/3DE, GPI, and WEAI/A-WEAI/pro-WEAI aggregate indices, respectively, and are suitable for use in hypothesis testing, for example, using the ttest command.
Empirical examples
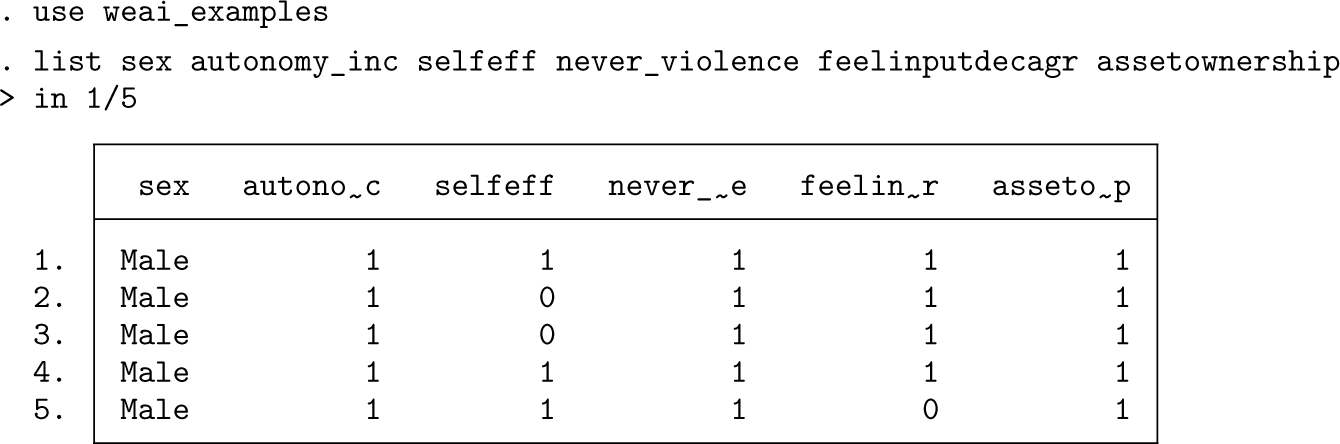
To illustrate the use of weai, we analyze data from the Gender, Agriculture, and Assets Project, Phase 2 (GAAP2). weai_examples.dta is provided in the ancillary files of the weai package or, alternatively, may be downloaded as part of the replication materials for Malapit et al. (2019) on the International Food Policy Research Institute (IFPRI) Dataverse (2020). It includes data collected by five agricultural development projects as part of GAAP2 to develop and validate pro-WEAI.
The data include the household ID, member ID, sex, household type, and project number for 23,088 respondents from the 5 projects along with the binary indicators necessary for calculating pro-WEAI and A-WEAI. The table below shows the first five lines of the dataset, including sex, and the first five indicators used to calculate pro-WEAI:
Pro-WEAI with the details option
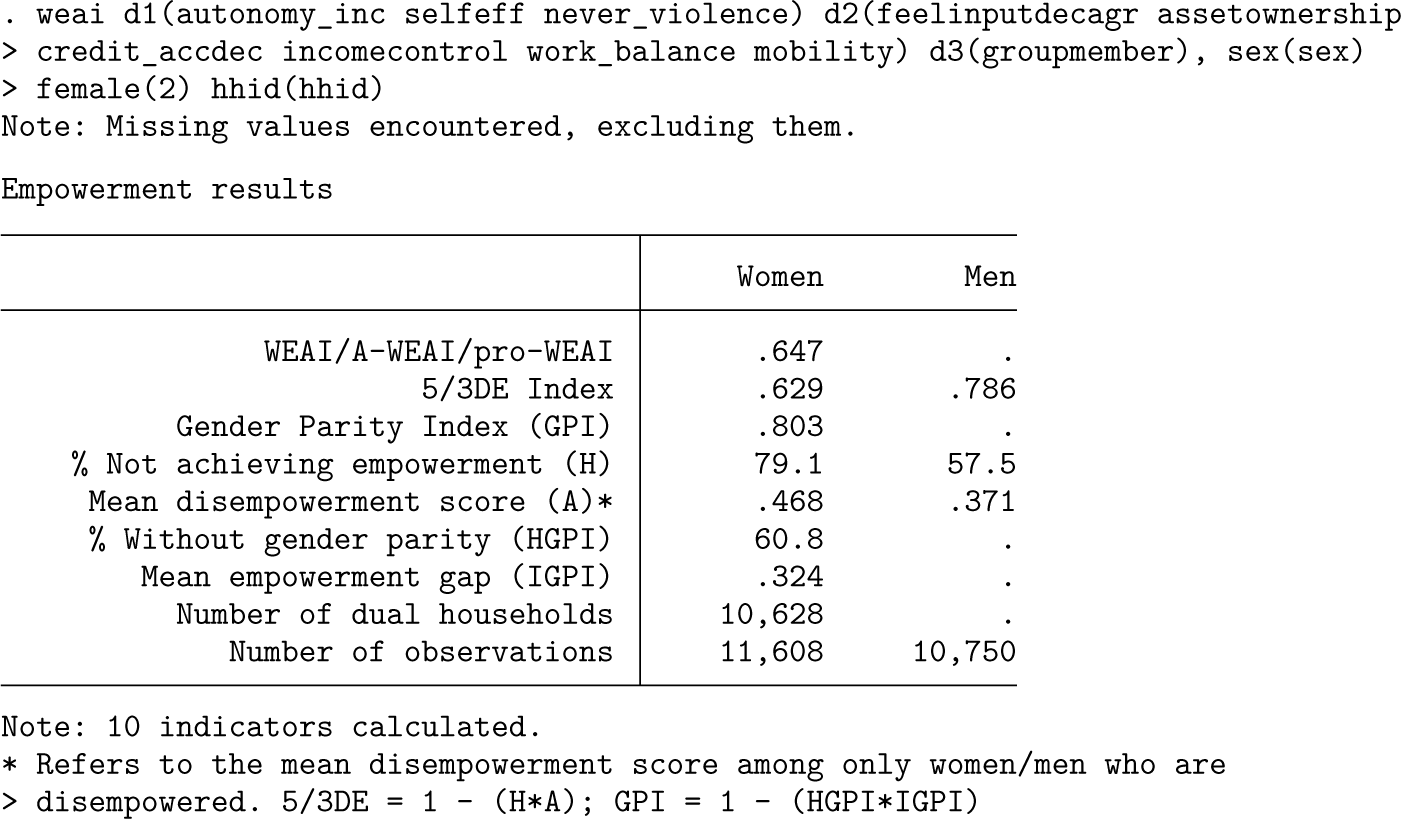
The following example shows the use of weai to compute pro-WEAI from 10 indicators using the details option, which provides additional tables and figures that aid analysis of empowerment within the study population. Because we are using all 10 required indicators, we will be using an empowerment cutoff of 0.8, making the cutoff() option unnecessary.
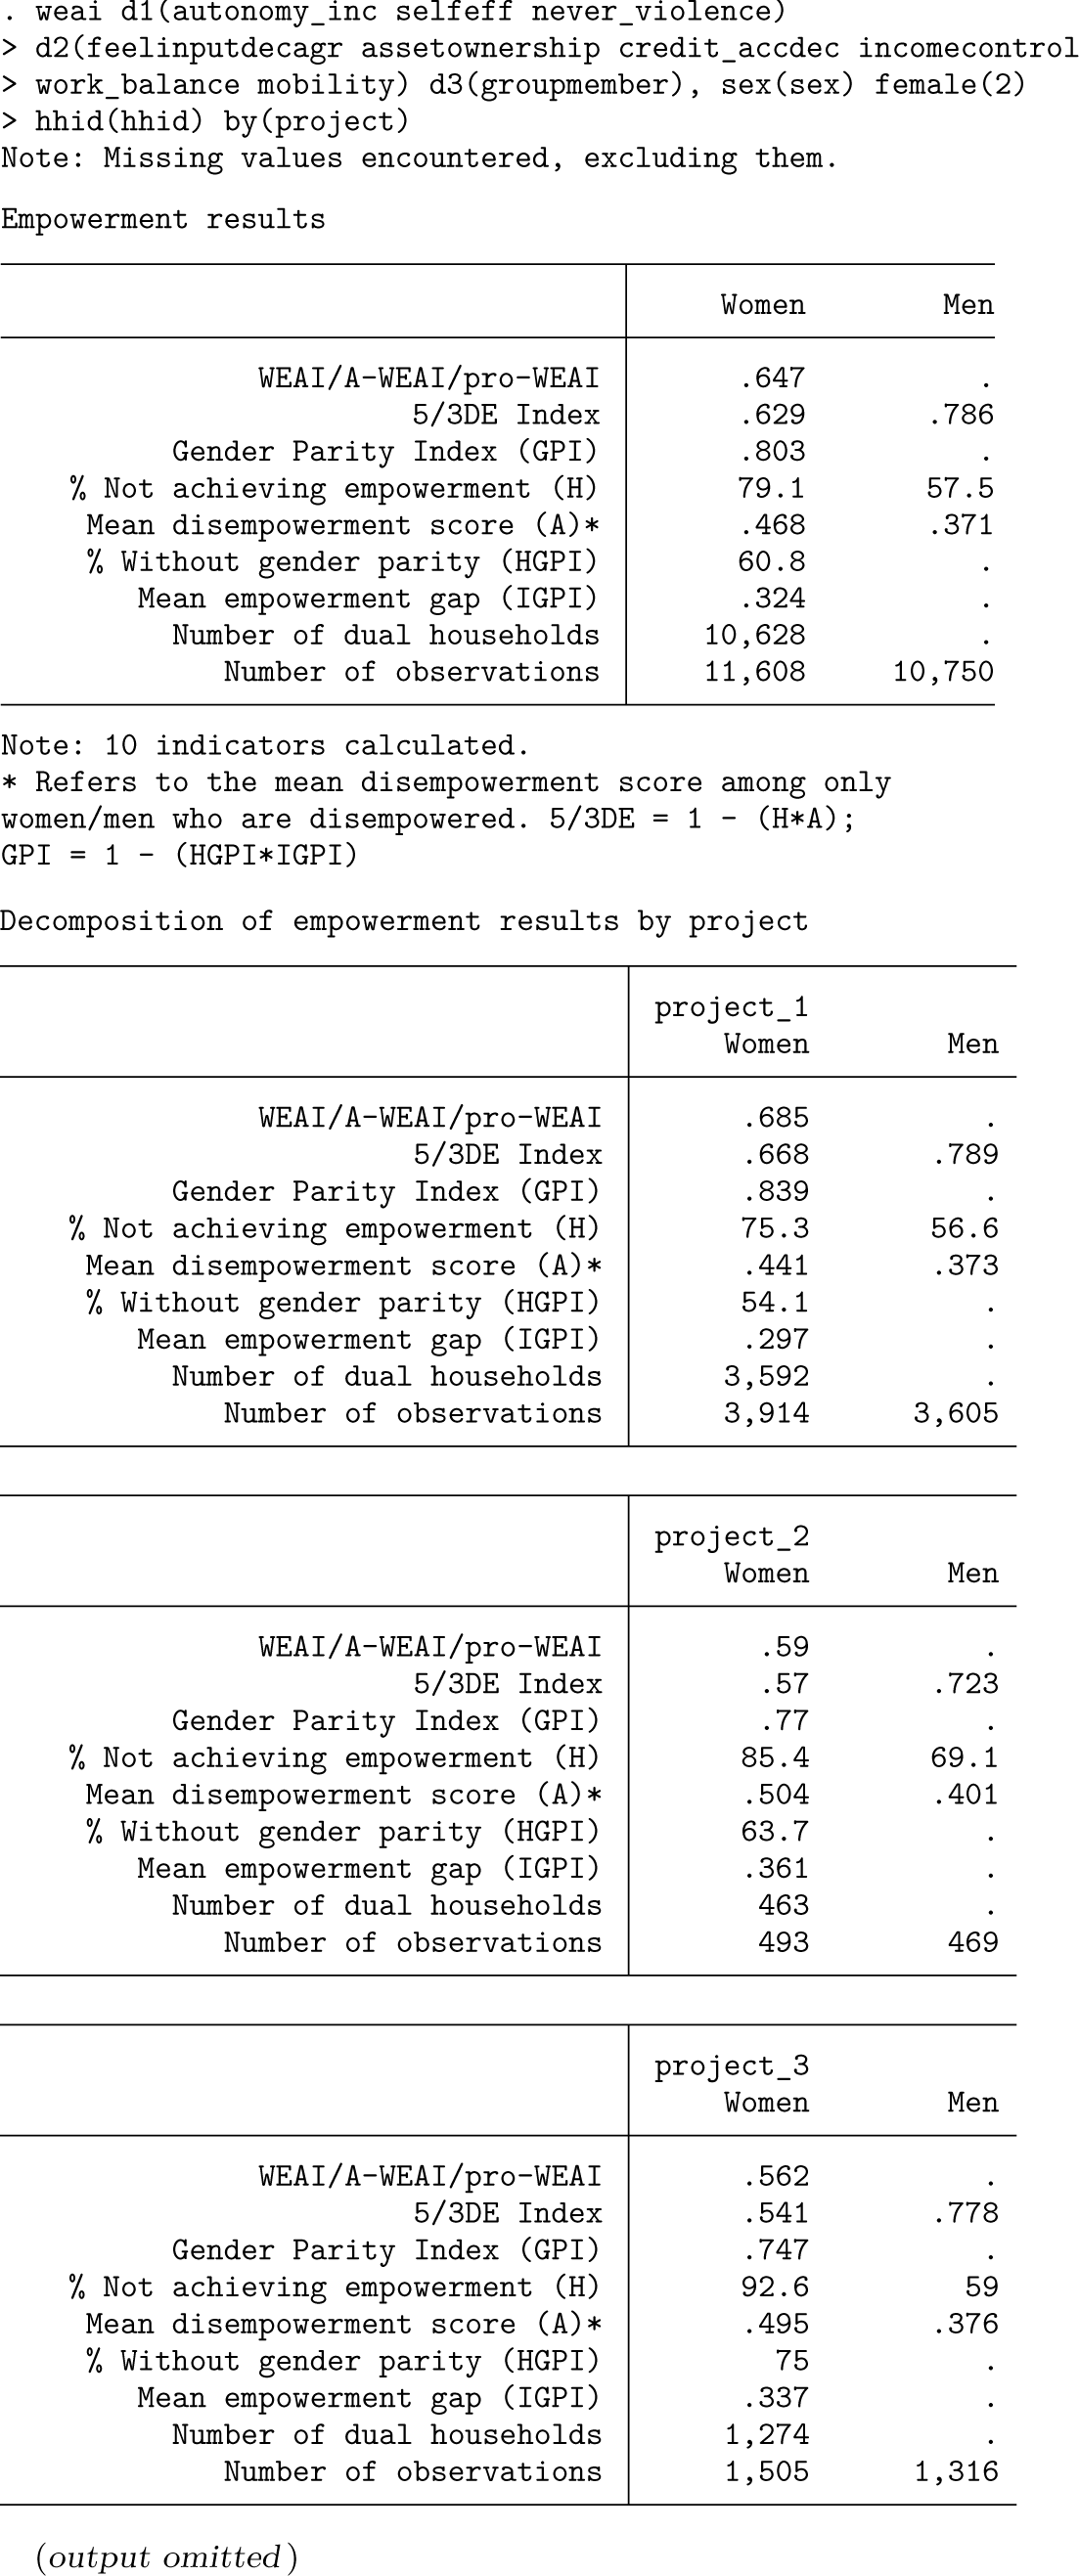
The table above displays the basic empowerment results, such as the 3DE and GPI, calculated for the entire sample. This table shows, for example, that women who have not achieved gender parity exhibit, on average, an empowerment shortfall of 0.324 relative to the men in their households.
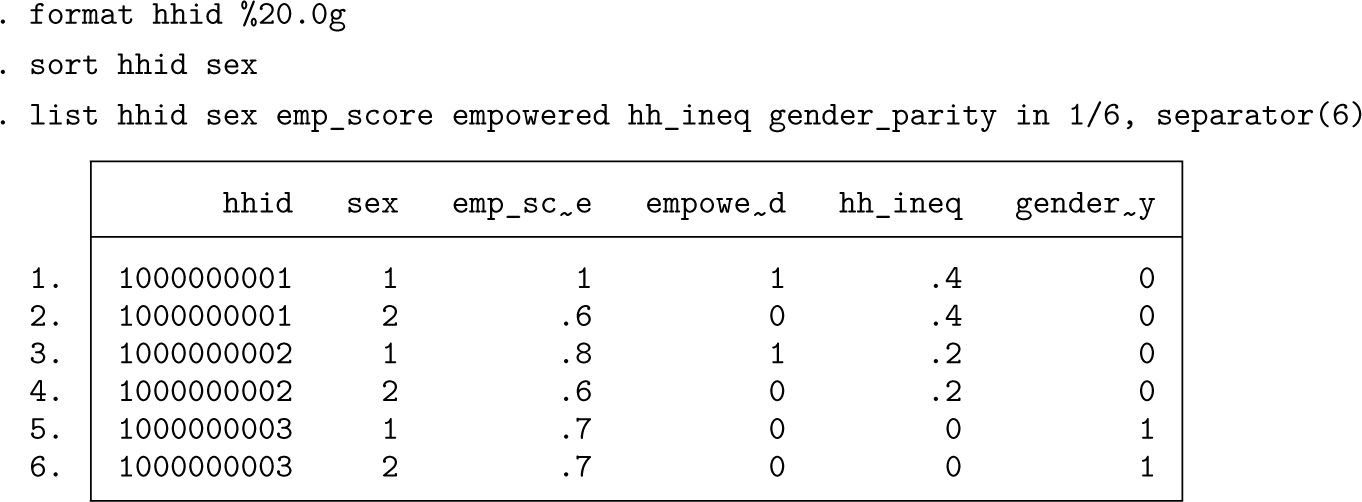
Note that when weai is run, it creates four individual- and household-level indicator variables in the dataset: emp_score, empowered, hh_ineq, and gender_parity. In contrast to the population-level variables displayed in the output tables, these variables describe individuals. The first six rows of these variables are shown below, along with the household ID. hh_ineq and gender_parity will always be the same for both members of a household because they describe the empowerment gap between them. Additionally, aggregate indices (emp_index, gpi, and weai) reflecting the 5/3DE, GPI, and WEAI/AWEAI/pro-WEAI, respectively, are also saved as new variables in the dataset.
Had weai been run with the details option, three additional tables would have been added to the output. The first of these displays the uncensored inadequacy headcount ratios, or more simply, the percentage of respondents of each sex who are inadequate in each indicator. As shown in the table below, the indicator for which the largest percentage of women are inadequate is the ability to visit important locations (mobility). For men, more are inadequate in group membership (groupmember) than in any other indicator, and their inadequacy ratio for this indicator is higher than for women. Importantly, the uncensored inadequacy headcount ratios do not differentiate between respondents who are empowered or are not.
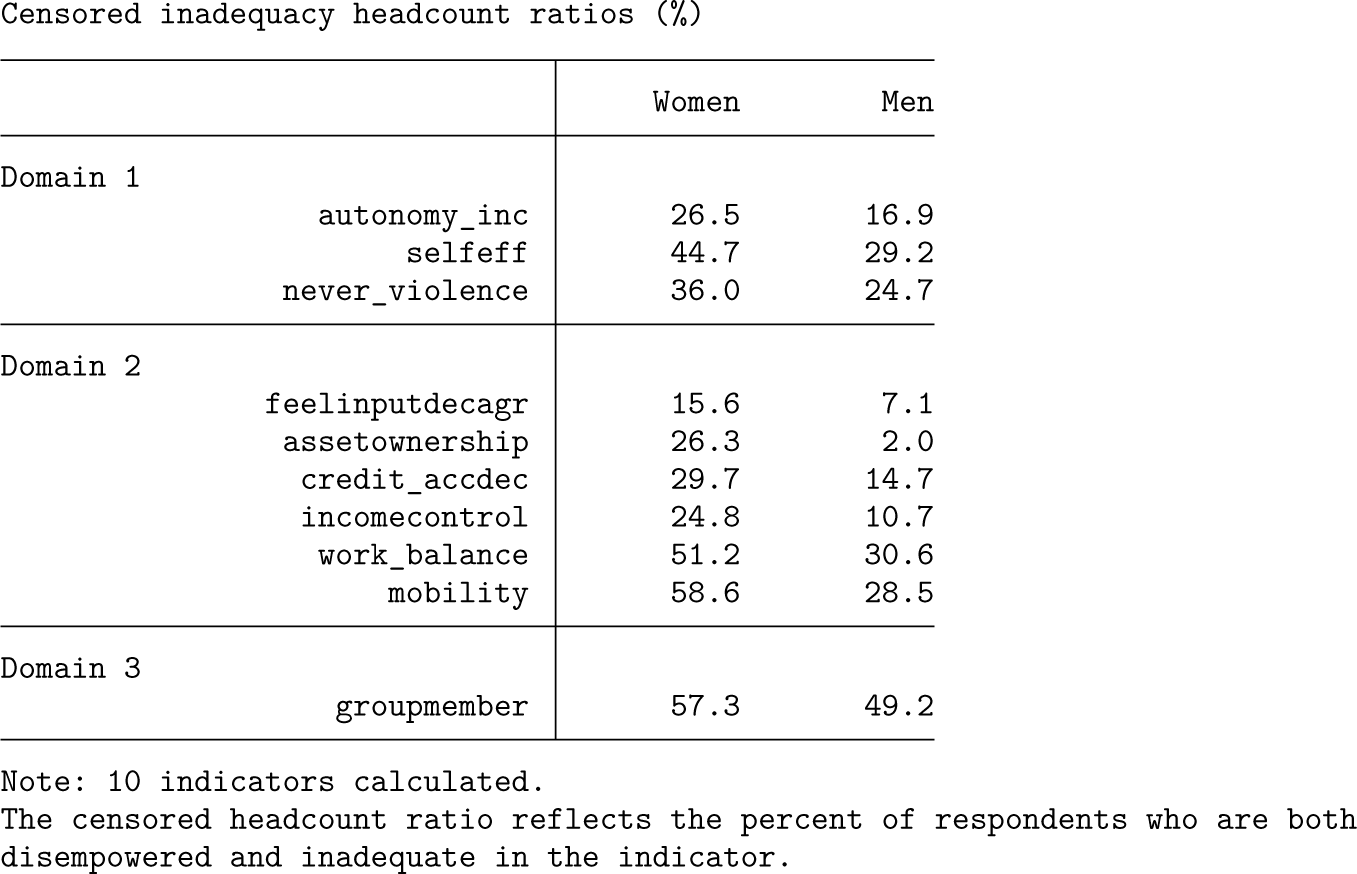
The following table displays the censored inadequacy headcount ratios. These ratios, unlike the uncensored ratios, reflect the percentage of respondents of each sex who are both inadequate in a particular indicator and disempowered. Censoring the results like this focuses measurement on the least empowered individuals within the sample.
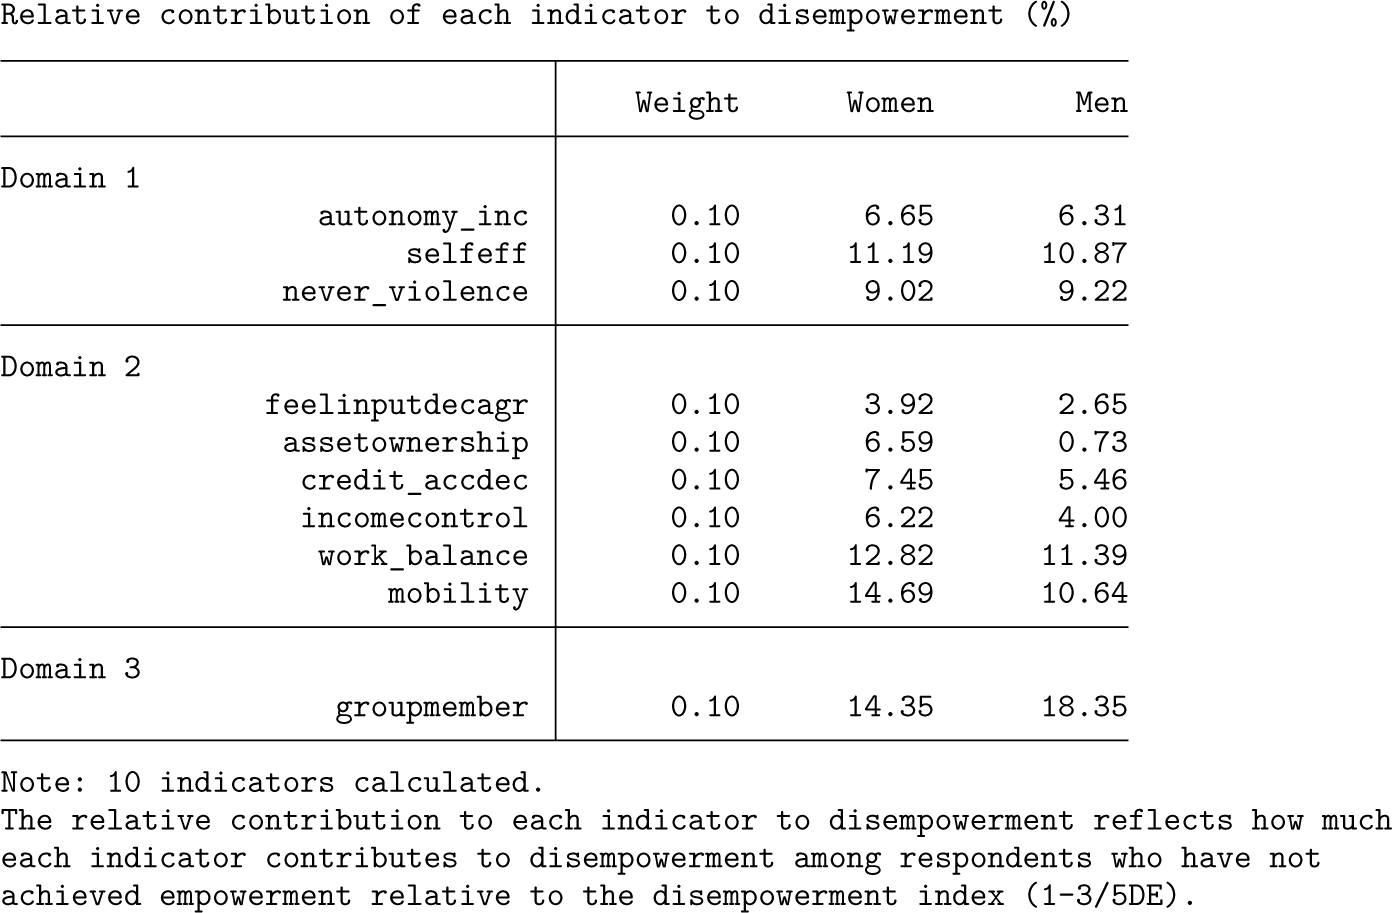
The next table shows the relative contribution of each indicator to disempowerment. This is equal to the censored inadequacy headcount ratio for each indicator multiplied by the weight assigned to the indicator and divided by (1 −3DE). Just as in the table showing the uncensored inadequacy headcount ratios, we see that the ability to visit important locations (mobility) and group membership (groupmember) contribute the most to disempowerment among women and men, respectively.
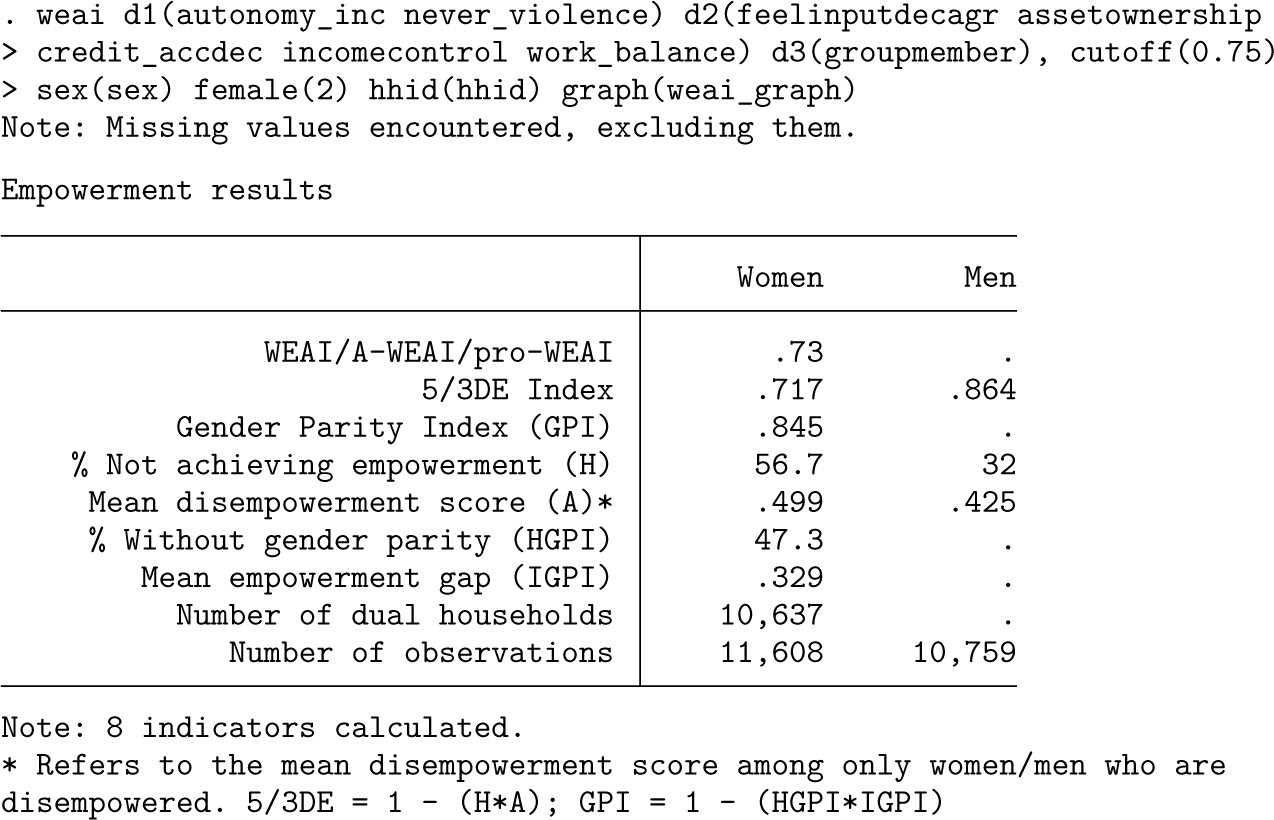
Pro-WEAI with eight indicators and graph() option
The next example uses the weai command to calculate pro-WEAI, this time using eight indicators. Pro-WEAI can be calculated with fewer than 10 indicators as long as there is no more than a single indicator missing from the intrinsic agency and instrumental agency domain, and the single indicator in the collective agency domain, group membership, is not missing. In this example, Pro-WEAI is calculated without the self-efficacy and visiting-important-locations indicators.
As shown in the output below, the percentage of women and men not achieving empowerment is far lower in this calculation than in the previous example. This can be attributed to the two missing indicators, self-efficacy and visiting important locations, that were among the highest contributors to disempowerment in the first example.
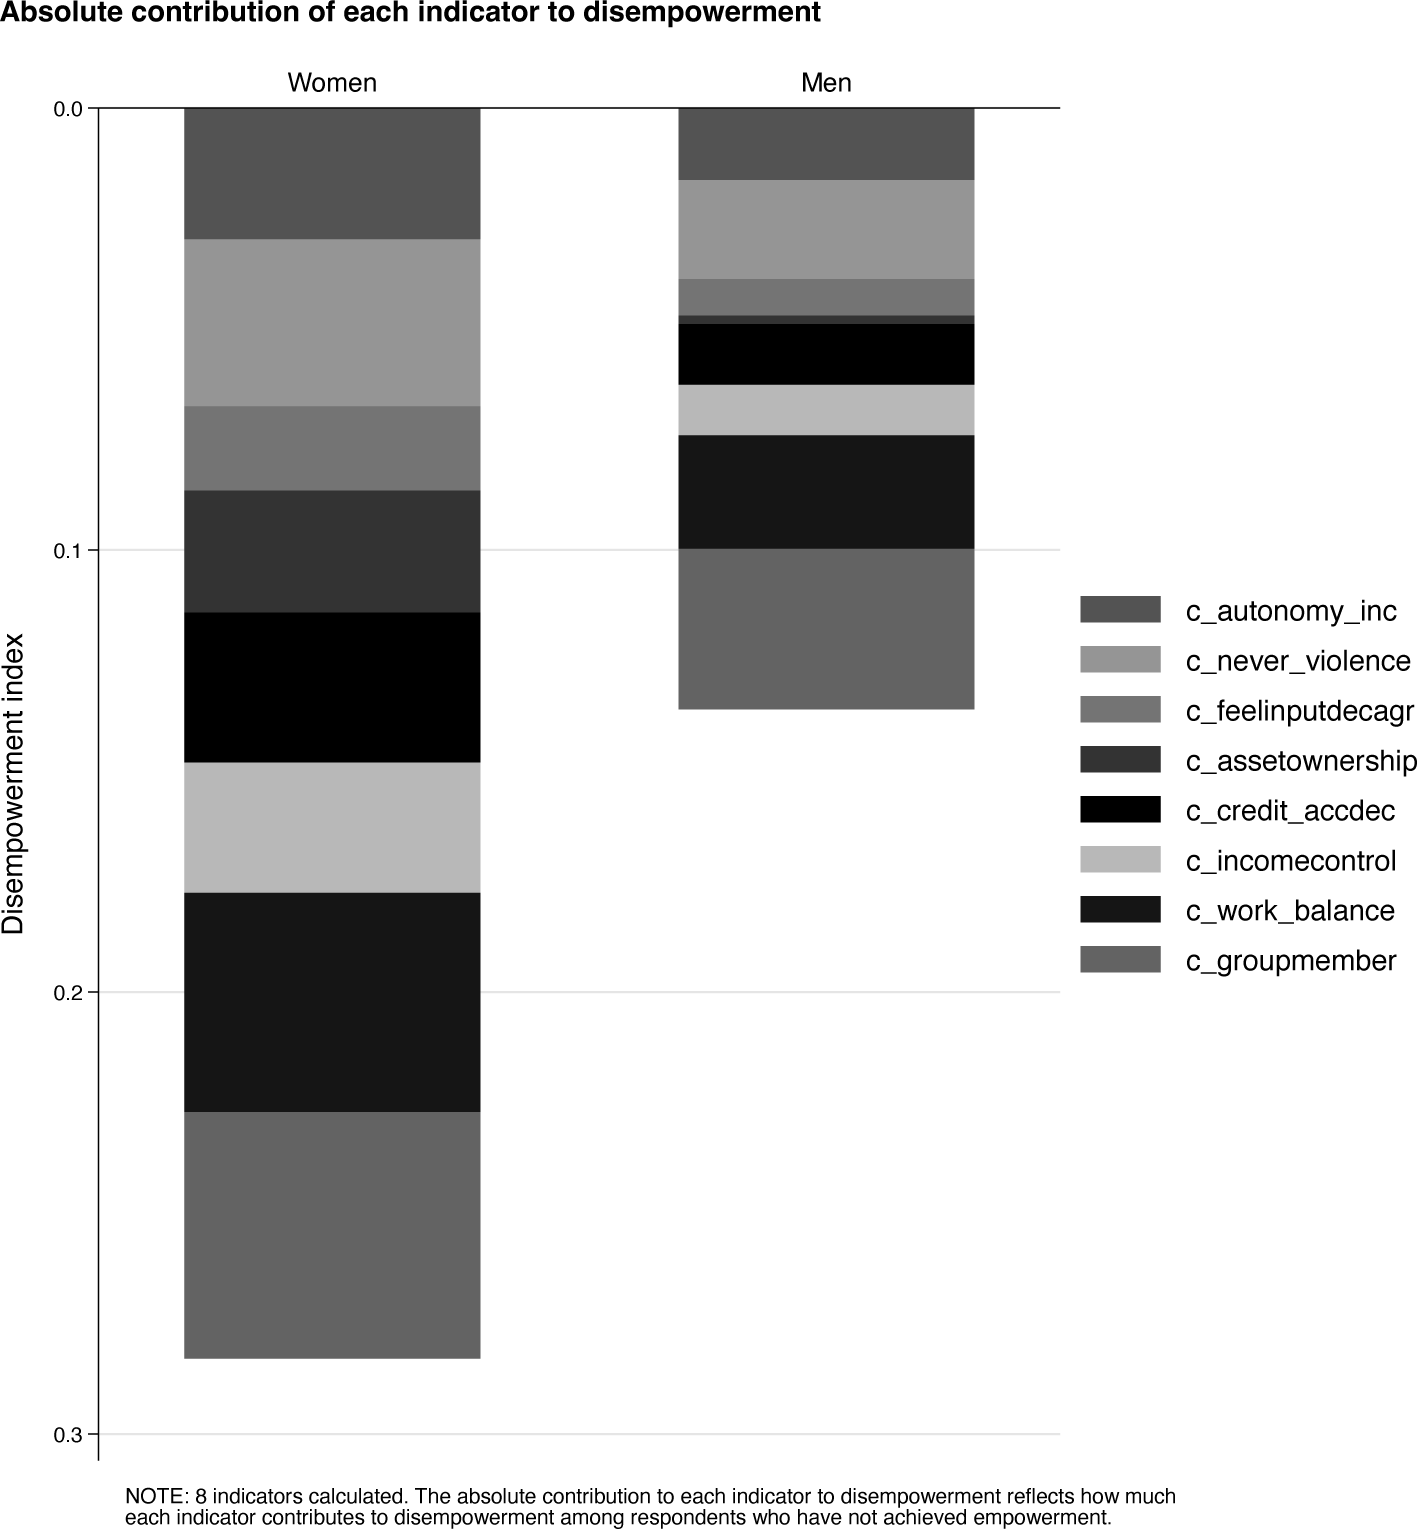
When the graph() option is used, the output also includes a bar graph showing the absolute contribution of each indicator to disempowerment (figure 1). This is equal to the censored inadequacy headcount ratio by the indicator weight multiplied by the weight assigned to the indicator. The total length of the bar shows the overall level of disempowerment among women and men, and the size of each layer of the bar shows each indicator’s contribution to disempowerment. The weai scheme, provided in the ancillary files of the weai package, can be used (set scheme weai) to replicate the color scheme used in Malapit et al. (2019).
Absolute contribution of each indicator to disempowerment
Pro-WEAI disaggregated by group
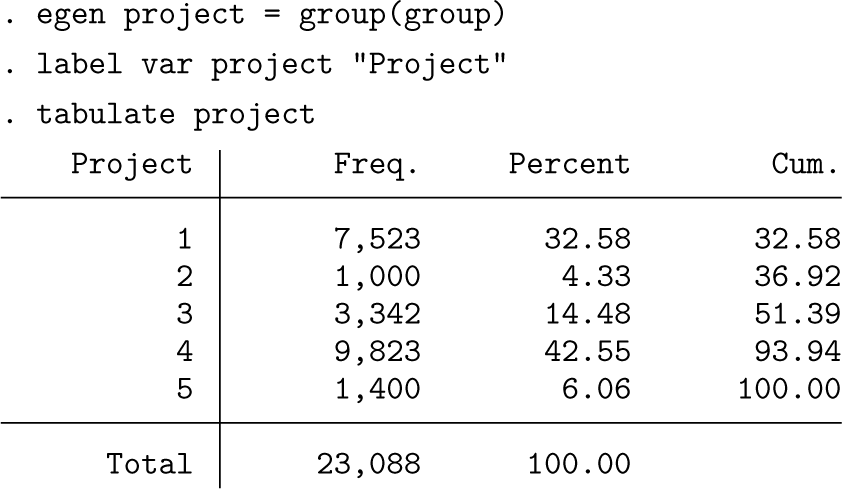
The next example shows the calculation of pro-WEAI with all 10 indicators, but now the by() option is used to decompose the output according to the project. However, to do this, we must first convert the group variable from a string variable to a numeric variable.
In the table above, the total number of respondents is shown decomposed according to the project they were part of. In the following command, the pro-WEAI variables will be calculated for the entire sample and decomposed by project. Note that projects 4 and 5 are omitted because of space.
As seen in the empowerment output table, the 3DE score is 0.629 for women in the sample and 0.786 for men. However, when the sample is decomposed by project, there is a wide variance in 3DE scores. For example, the 3DE for women ranges from 0.500 in project 5 to 0.668 in project 1. Similarly, the GPI, which is 0.803 for the entire sample, ranges from 0.681 in project 5 to 0.839 in project 1. Disaggregation by other factors, such as rural or urban, is possible, but these data are not available in the provided dataset.
A-WEAI
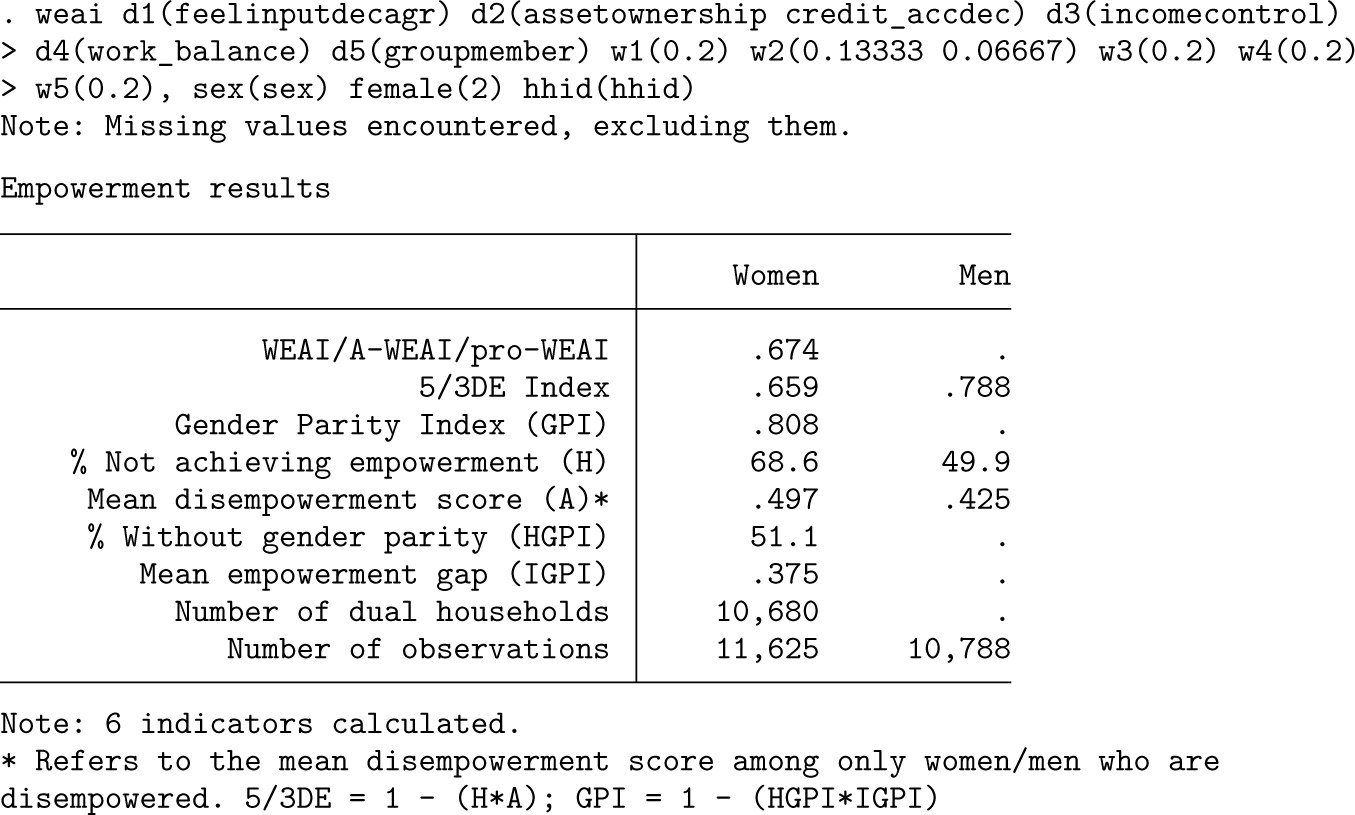
The final example demonstrates the calculation of A-WEAI from six indicators. For this version of WEAI, it is important to ensure that the weights are designated properly because the two indicators in the resources domain are weighted differently than the rest of the indicators. In this way, and unlike in pro-WEAI, each domain of empowerment is weighted equally despite the indicators having uneven weights. Also unlike pro-WEAI, A-WEAI cannot be calculated with any of the six indicators missing.
The main empowerment results for A-WEAI are shown in the following output. The A-WEAI score for women in the sample is 0.674. Note the differences in sample size relative to the other examples. This is due to the different set of indicators included in each example. For a more insightful look into the statistics presented below, one can add the details option or the by() option to disaggregate the results according to project.
Conclusions
In this article, we outlined weai, a new command for calculating all members of the WEAI family of multidimensional empowerment indices. Results are organized and displayed in formatted tables and can be decomposed by indicator and population subgroup. A key feature of weai is its flexibility. It allows users to specify the numbers of domains and indicators, as well as their weights. Thus, in addition to calculating WEAI, A-WEAI, and pro-WEAI, weai can be used to calculate variations of these indices, for example, instances in which data are missing for particular indicators.
The weai command fills an important gap in the literature. While WEAI indices bear similarities to the Alkire and Foster (2011b) class of individualor household-level multidimensional poverty measures (the 5/3DE is an adjusted headcount ratio and equivalent to the M0 poverty measure), its inclusion of the GPI separates it from other Alkire– Foster indices. The GPI contains an intrahousehold-level component, which requires comparing empowerment scores between men and women within the same household. Thus, existing commands for calculating the Alkire and Foster (2011b) class of multidimensional poverty measures, such as mpi and mpitb, cannot calculate the WEAI family of multidimensional empowerment indices (Pacifico and Poege 2017; Suppa 2023). Previously, WEAI users had to create complex calculation do-files to analyze their data, which was cumbersome and error prone. The weai command streamlines this step. Thus, while users must still process the WEAI survey data into indicators, the weai command should substantially shorten the time it takes for WEAI users to turn their data into actionable findings and recommendations.
Footnotes
6
This work was carried out under the CGIAR GENDER Impact Platform, which is grateful for the support of CGIAR Trust Fund contributors: . It also draws from GAAP2 at IFPRI, supported by the Bill & Melinda Gates Foundation (grant number: INV-008977), the United States Agency for International Development (grant number: EEM-G00-04-00013-00), and the former CGIAR research programs on Agriculture for Nutrition and Health and Policies, Institutions, and Markets. We thank the Oxford Poverty and Human Development Initiative for providing the source code for the original WEAI calculation do-file. We also thank all current and former IFPRI colleagues who worked to maintain and improve the WEAI do-file. Last, we thank the many users of the WEAI, who have provided us with invaluable feedback on the WEAI do-file and suggestions for improvements. We hope that the weai command makes your lives easier.
7
To install the software files as they existed at the time of publication of this article, type
Notes
About the authors
Malick Dione is a research analyst in the Poverty, Gender, and Inclusion Unit at IFPRI.
Greg Seymour is a survey statistician in the American Community Survey Office of the United States Census Bureau.
Nathaniel Ferguson is a research analyst in the Natural Resources and Resilience Unit at IFPRI.
Hazel Malapit is a senior research coordinator in the Poverty, Gender, and Inclusion Unit at IFPRI.
References
1.
AlkireS.FosterJ.. 2011a. Understandings and misunderstandings of multidimensional poverty measurement. Journal of Economic Inequality9: 289–314. https://doi.org/10.1007/s10888-011-9181-4.
Alkire, S., R. Meinzen-Dick, A. Peterman, A. Quisumbing, G. Seymour, and A. Vaz.2013. The women’s empowerment in agriculture index. World Development52: 71–91. https://doi.org/10.1016/j.worlddev.2013.06.007.
Foster, J., J. Greer, and E. Thorbecke.1984. A class of decomposable poverty measures. Econometrica 52: 761–766. https://doi.org/10.2307/1913475.
6.
International Food Policy Research Institute (IFPRI). 2020. Replication data for: Development of the project-level women’s empowerment in agriculture index (pro-WEAI). Harvard Dataverse. https://doi.org/10.7910/DVN/ZZRV3J.
7.
KabeerN. 1999. Resources, agency, achievements: Reflections on the measurement of women’s empowerment. Development and Change30: 435–464. https://doi.org/10.1111/1467-7660.00125.
8.
Malapit, H., C. Pinkstaff, K. Sproule, C. Kovarik, A. Quisumbing, and R. Meinzen-Dick.2017. The abbreviated Women’s Empowerment in Agriculture Index (A-WEAI). Discussion Paper 1647, International Food Policy Research Institute. https://ebrary.ifpri.org/cdm/ref/collection/p15738coll2/id/131231.
9.
MalapitH.QuisumbingA.Meinzen-DickR.SeymourG.MartinezE. M.HeckertJ.RubinD.VazA.YountK. M.. 2019. Development of the project-level Women’s Empowerment in Agriculture Index (pro-WEAI). World Development122: 675–692. https://doi.org/10.1016/j.worlddev.2019.06.018.