
Abstract
Parkinson’s disease (PD) is a neurodegenerative disorder that affects fitness to drive. Research that has examined clinical predictors of fitness to drive in PD, using the on-road assessment as the gold standard, has generally used a dichotomous pass/fail decision. However, on-road assessments may also result in one of two additional outcomes (pass with recommendations, or fail-remediable). Individuals within these subgroups may benefit from interventions to improve their fitness to drive abilities. This study investigated clinical predictors that could be indicative of the pass, pass with recommendations, or fail-remediable categories for drivers with PD (N = 99). Trails B, Left Finger to Nose Test, and contrast sensitivity measures were identified as significant predictors for the pass, and pass with recommendations subgroups. No significant predictors were identified for the fail-remediable subgroup. Results from this study provide a foundation for clinicians to identify drivers who can benefit from recommendations to preserve their driving abilities.
Introduction
Automobiles constitute the primary mode of transportation in Western countries. In the absence of adequate alternative transportation options, driving a vehicle affords individuals, especially older adults, opportunities for independence and participation (Canadian Association of Occupational Therapists [CAOT], 2009; Korner-Bitensky, Toal-Sullivan, & von Zweck, 2007). Driving as a complex occupation requires individuals to integrate sensory, cognitive, and motor functions while making fast-paced critical decisions (Cordell, Lee, Granger, Vieira, & Lee, 2008; Hoggarth, Innes, Dalrymple-Alford, Severinsen, & Jones, 2010). Neurodegenerative disorders that result in compromised sensory, cognitive, and motor skills can negatively affect an individual’s fitness to drive (Uc & Rizzo, 2008).
Second to Alzheimer’s disease, Parkinson’s disease (PD) is the most common neurodegenerative disorder of mid-to-late life in developed countries (Lai & Tsui, 2001; Massano & Bhatia, 2012). By 2030, it is expected that between 8.7 and 9.3 million people above the age of 50 will live with PD in Western Europe’s 5 most and the world’s 10 most populous nations (including the United States; Dorsey et al., 2007). PD is characterized by four cardinal motor symptoms (bradykinesia, resting tremor, rigidity, and postural instability) that along with several non-motor symptoms (Aarsland et al., 2009; Jankovic, 2008; e.g., depression, anxiety, sleep disturbance, dysautonomia, pain) have a known impact on fitness to drive (Classen et al., 2014; Crizzle et al., 2013; Crizzle, Classen, & Uc, 2012; Cubo et al., 2010). In fact, individuals with PD make more driving errors when compared with healthy drivers, and fail an on-road assessment to a greater extent (41% vs. 9%; Classen et al., 2014).
Several sensory, cognitive, and motor tests (e.g., contrast sensitivity, rapid pace walk [RPW], Useful Field Of View [UFOV]®) exist to assess and predict passing/failing an on-road assessment (i.e., the current gold standard for driving assessment; Bedard & Dickerson, 2014; Classen et al., 2009; Classen et al., 2011; Crizzle et al., 2013). Although this dichotomized pass/fail outcome is most often reported and used in studies investigating clinical predictors, on-road assessments can also result in drivers falling under “pass with recommendations” or “fail-remediable” categories (Classen et al., 2014; Classen et al., 2009; Classen et al., 2011; Justiss, Mann, Stav, & Velozo, 2006). If these subgroups are identified, then targeted driving assessments and evidence-based interventions to improve their fitness to drive may be developed. However, the existing literature provides little guidance for doing so.
On-Road Assessment
Generally, fitness to drive is evaluated through a comprehensive driver evaluation (CDE) conducted by a certified driver rehabilitation specialist (CDRS). The CDE typically includes a battery of clinical tests and an on-road assessment (Bedard & Dickerson, 2014; Classen et al., 2014; Justiss et al., 2006). For the on-road assessment, the CDRS drives on the passenger seat while the participant drives through a predetermined course. Throughout the course, the CDRS records the type and number of driving errors (e.g., visual scanning, lane maintenance, speed regulation, vehicle positioning, adjustment to stimuli, gap acceptance) and determines a primary on-road outcome. The primary on-road outcome is usually reported in terms of safe versus unsafe, or pass versus fail, as a result of dichotomizing a broader scale that may include pass (the driver is fit to drive in any situation), pass with recommendations (the driver is generally fit to drive with moderate driving difficulty, thus would benefit from specific recommendations), fail-remediable (fit to drive only under optimal conditions, thus needs driving rehabilitation to be fit to drive), and fail (not fit to drive in any situation; Classen et al., 2011; Justiss, 2006; Radford, Lincoln, & Lennos, 2004; Singh, Pentland, Hunter, & Provan, 2007). Although the dichotomization of the outcome facilitates analysis of the results (Classen et al., 2014; Justiss et al., 2006), studies that have investigated the on-road outcomes of drivers with PD have found that when compared with healthy controls, drivers with PD receive more “pass with recommendations” and “fail- remediable” outcomes (Classen et al., 2014). Still, “pass with recommendations” and “fail- remediable” outcomes for drivers with PD and their relation to clinical assessments remain largely unreported (Classen et al., 2014).
Predictors of Driving Performance
Several studies have provided evidence to support the use of specific sensory (vision), cognitive, and motor tests as a way to screen and assess fitness to drive in drivers with PD. In the vision domain, the UFOV® and contrast sensitivity have emerged as accurate predictors of on-road outcomes. Classen et al. (2011) determined that the UFOV® Subtest 2 (p < .001), along with the RPW (p = .019), correctly classifies 81% of pass–fail outcomes for participants with PD (variance = 55%, sensitivity = 83%, specificity = 78%). Furthermore, Uc et al. (2009) found that the UFOV® total score (p = .0095) and the far visual acuity (p = .0041) are good predictors (R2 = .2462) of safety errors in drivers with PD. In addition, Devos, Vandenberghe, Nieuwboer, et al. (2013) found that contrast sensitivity (p = .0002), along with the Clinical Dementia Rating Scale (p = .001), the Unified Parkinson’s Disease Rating Scale (UPDRS; UPDRS III on p = .0008; UPDRS II on p = .05), and disease duration (p = .07), correctly classified 77% (sensitivity = 96%, specificity = 64%) of pass–fail outcomes for participants with PD. Worringham, Wood, Kerr, and Silburn (2006) also found contrast sensitivity (as assessed with the Pelli–Robson chart; r = .40, p < .01) to accurately predict pass versus fail outcomes.
Cognitive and perceptual assessments that have been identified as adequate predictors of the outcomes of an on-road assessment include the Purdue Pegboard Test, the verbal Symbol Digit Modalities, and the Trail Making Test Part B (Trails B). Worringham et al. (2006) found that both the Purdue Pegboard Test (r = .54, p < .005) and the verbal version of the Symbol Digit Modalities Test (r = .46, p < .005) predict pass versus fail outcomes for PD participants with 72.7% sensitivity and 64.3% specificity. In addition, Amick, Grace, and Ott (2007) found that longer time of completion on the Trails B (p = .03) was associated with unsafe driving in participants with PD.
Crizzle et al. (2013) examined the driving performance of participants with PD (N = 55) and found that 100% of the participants with a Mini-Mental State Examination score of <27 and an RPW score of more than 6.22 s (slower time) failed the on-road assessment. Furthermore, Devos, Vandenberghe, and Tant, et al. (2013) determined that motor subtype, motor symptom severity, binocular acuity, executive dysfunction, divided attention, and visual scanning provide 60% of the variance in a predictive model of on-road failure, in individuals with PD.
In summary, drivers with PD’s on-road outcomes (passing vs. failing) are predicted by poor performance in aspects of visual, cognitive, and motor domains (Classen et al., 2014; Devos, Vandenberghe, Nieuwboer, et al., 2013; Devos, Vandenberghe, Tant, et al., 2013; Uc et al., 2009). The extant literature focuses primarily on identifying predictors of pass–fail on-road outcomes. Therefore, we know little about the characteristics of those who achieve a pass with recommendations or fail-remediable outcome. Because drivers with PD are a high-risk group for impaired fitness to drive, identifying drivers who may benefit from specific recommendations (those who are likely to receive a “pass with recommendations” score) or driving rehabilitation strategies (those likely to receive a “fail-remediable” score) can help clinicians to implement strategies that can preserve the patient’s driving abilities and improve his or her fitness to drive. The purpose of this study was to identify clinical predictor(s) indicative of pass, pass with recommendations, or fail-remediable outcomes of the on-road assessment.
Method
We conducted a secondary data analysis using de-identified data collected for our recent work (see Classen et al., 2014). The Ethics Review Board of the University of Western Ontario (Canada) certified the exception of board review for the secondary data analysis, as per Chapter 2, Article 2.4 of the Canadian Tri-Council Policy Statement: Ethical Conduct for Research Involving Humans (TCPS-2). The Institutional Review Board of the University of Florida approved the original study. All participants provided written informed consent.
Participants
For the original study, participants (N = 101) with PD were recruited from the University of Florida’s Center for Movement Disorders and Neurorestoration (CMDNR), as well as support groups and websites of the PD community (e.g., American PD Association) and advocacy groups. All participants recruited through the center (N = 80) were evaluated by a center’s neurologist trained in movement disorders and met the United Kingdom Parkinson’s Disease Society Brain Bank Criteria for assigning a diagnosis of PD (Hughes, Daniel, Blankson, & Lees, 1993). An additional 21 participants with PD who were recruited for the original study (via support groups, websites, etc.) reported a confirmed diagnosis of PD by their neurologist, or movement disorder specialist. The diagnoses and accompanied medical information were verified through self-report and caregiver report. This secondary data analysis included data from 99 of the 101 participants (from the original study) because of missing on-road data from two of the participants.
Participants were included if they (a) had been diagnosed with PD, (b) were between the ages of 35 and 89, (c) were driving with a valid driver’s license at the time of recruitment or had quit driving within the past 3 months, (d) had more than 10 years of driving experience, (e) met the Florida State Statute requirement for visual acuity (e.g., 20/70), (f) lived independently in the community, and (g) were proficient in reading and speaking English. Participants were excluded from the original study if they (a) had other neurological conditions (e.g., stroke, uncontrolled seizures, dementia); (b) had active, untreated psychiatric disorders (e.g., psychosis) or physical conditions (e.g., missing limb) precluding full participation; or (c) used psychotropic medications that impaired mental or physical functioning.
Measures and Study Variables
Questionnaires
Demographic information was collected via questionnaires including age, gender, and the number of years the participant had been experiencing PD symptoms.
Medical history
A neurologist evaluated the participants (while on medication) using indexes of disease severity and progression: the UPDRS Section 3 (Motor) and the modified Hoehn and Yahr (H&Y) Scale (Goetz et al., 2004; Goetz et al., 2008). The score for the UPDRS Section 3 ranges from 0 to 108, with higher scores indicating more severe symptoms, and scores closer to 0 indicating being symptom free (Goetz et al., 2008). The modified H&Y Scale is an expanded version of the original five-stages scale developed in 1967 (Hoehn & Yahr, 1998). The scale is composed of a seven-stage system that ranges from 1 to 5, with 1 representing unilateral involvement only, and a score of 5 representing significant impairment wherein the individual may be wheelchair-bound or bedridden (Goetz et al., 2004).
Clinical variables
The research team selected clinical variables based on most significant predictors from past studies (Amick et al., 2007; Classen et al., 2014; Classen et al., 2011; Devos, Vandenberghe, Nieuwboer, et al., 2013; Devos, Vandenberghe, Tant, et al., 2013). The clinical variables are discussed under the domains of vision, cognition, and motor ability. All assessments were administered by a CDRS/occupational therapist.
Vision
Contrast sensitivity and binocular visual acuity were measured with the Optec® 2500 visual analyzer (Stereo Optical Company Inc., Chicago). The total scores from the five contrast sensitivity slides (measuring different aspects of the visual system) were categorized as impaired or within functional limits. Binocular visual acuity was categorized in one of six categories (20/20, 20/30, 20/40, 20/50, 20/70, 20/200, with 20/20 being optimal visual acuity). These six categories were then collapsed and recoded into the following three groups: 20/20, 20/30-20/40, and ≥20/50.
Cognition
Trails B is a timed test that measures set shifting or mental flexibility, which are important functions for fitness to drive (Kortte, Horner, & Windham, 2002). The test required an individual to draw lines between numbers and letters in an ascending consecutive order, as fast as they could and according to standardized protocol (Kortte et al., 2002).
Motor
The Finger to Nose Test (FNT), a timed test that measures bilateral upper-extremity coordination, was used. The FNT required the participant to stand opposite the assessor at a distance that requires the participant to fully extend his or her elbow to reach the examiner’s target finger and to touch his or her own nose with his or her index finger to the assessor’s index finger, 5 times back and forth (Swaine, Lortie, & Gravel, 2005). The therapist noted the presence or absence of dysmetria and tremors during the FNT (Swaine et al., 2005). Inability to complete the FNT indicates coordination deficits due to possible neurological damage or injury to the cerebellum, basal ganglia, dorsal columns, or cortex of the brain (Swaine et al., 2005).
RPW is a measure that indicates lower limb strength, endurance, range of motion, motor coordination, balance, and speed (Carr, Schwartzberg, Manning, & Sempek, 2010). A 3-m path was marked on the floor with tape, and the participant was asked to walk to the farthest piece of tape, turn around, and return to the starting position as fast as he or she could (Carr et al., 2010). The therapist recorded the time of completion, starting when the participant initiates the first step and ending when the participant’s rear foot crossed the start line (Carr et al., 2010). A correlation exists between older adults who score 7 s or higher on this test and adverse traffic events, while a time greater than 9 s suggests that the client will benefit from a fitness-to-drive intervention (Carr et al., 2010).
On-road assessment
Participants drove a 45-min predetermined standardized on-road course with demonstrated validity and reliability for older drivers’ on-road assessment (Classen et al., 2014; Justiss et al., 2006). The on-road assessment began in a parking lot with acclimation maneuvers and then progressed to more complex driving situations including residential, urban, and interstate driving. Participants drove only during daytime and during non-peak hours. The on-road assessment was re-scheduled if there was inclement weather on the day of assessment. All participants drove a dual-brake 2004 Buick Century testing vehicle with the CDRS performing the assessment from the passenger seat. The car was equipped with an auxiliary brake should the CDRS’s intervention be required during testing. The CDRS evaluated the overall on-road driving performance of the participants using a Global Rating Score (GRS; Justiss et al., 2006). The GRS was indicated by a score of 3 = pass, 2 = pass with restrictions or recommendations, 1 = fail-remediable, and 0 = fail not remediable. Although the CDRS assessed and scored 91 on-road maneuvers (e.g., speed regulation, lane maintenance, visual scanning, gap acceptance, adjustment to stimuli, vehicle positioning, yielding, and signaling), for the purposes of this study, we only analyzed the GRS.
Procedure
Based on the research question, the research team examined the most notable clinical variables from the existing data set. Variables included age, years with symptoms, gender, UPDRS Section 3, H&Y, contrast sensitivity, bilateral visual acuity, Trails B (s), left FNT (min), RPW (s), UFOV®, and the GRS. To avoid collinearity and because the two tests have comparable accuracy to predict on-road outcomes, we used Trails B instead of the UFOV® in the final analysis (Classen, Wang, Crizzle, Winter, & Lanford, 2013).
Data Management
Data were entered into a Statistical Package for the Social Sciences (SPSS) Version 22 (IMB Corporation, Armonk, New York) file and stored in a password protected server. Quality control was performed to ensure data accuracy and completeness. The research team collapsed and dummy coded variables (e.g., visual acuity). Missing data (>11.2% to <22.3%) were apparent for years with symptoms, UPDRS Section 3, and visual acuity. The SPSS software could not impute data for years with symptoms. As a result, we conducted data imputation for UPDRS Section 3 and visual acuity.
Data Analysis
The research team performed a descriptive analysis on all categorical (frequencies and percentages) and continuous variables (e.g., mean, standard deviation, range). Because a Spearman’s rho correlation examines the statistical dependence between two sets of variables (Portney & Watkins, 2000), we conducted such analyses between each independent variable and the GRS dependent variable. Only those variables in which a significant correlation was identified were used in the subsequent multinomial regression.
We conducted a multinomial regression (i.e., a regression accommodating multiple levels of a dependent variable; Fields, 2009) of the GRS, which had four levels (pass, pass with recommendations, fail-remediable, fail). We used the fail group as the reference category and regressed the independent variables on the remaining three levels of dependent variables (pass, pass with recommendations, fail-remediable). For all inferential statistics, alpha was set at .05.
Results
Table 1 presents the comparative findings by outcome group. Participants who passed the on-road assessment were younger than those who failed. The number of years with symptoms generally increased from participants who passed to those who failed. Participants who failed the on-road assessment had a higher score on the UPDRS Section 3 when compared with participants who passed, passed with recommendations, or failed-remediable. The pass and pass with recommendations groups had more participants with intact contrast sensitivity and less with impaired contrast sensitivity, whereas the fail-remediable and fail groups had a greater number of individuals with impaired contrast sensitivity. This overall trend is consistent with the fact that contrast sensitivity was found to be significantly correlated with GRS (Table 2). Participants in all four categories had varied levels of visual acuity, and most of the participants in all categories (68 out of 99) had a visual acuity of 20/30 to 20/40.
Demographic Data Separated by On-Road Outcome Group (N = 99).
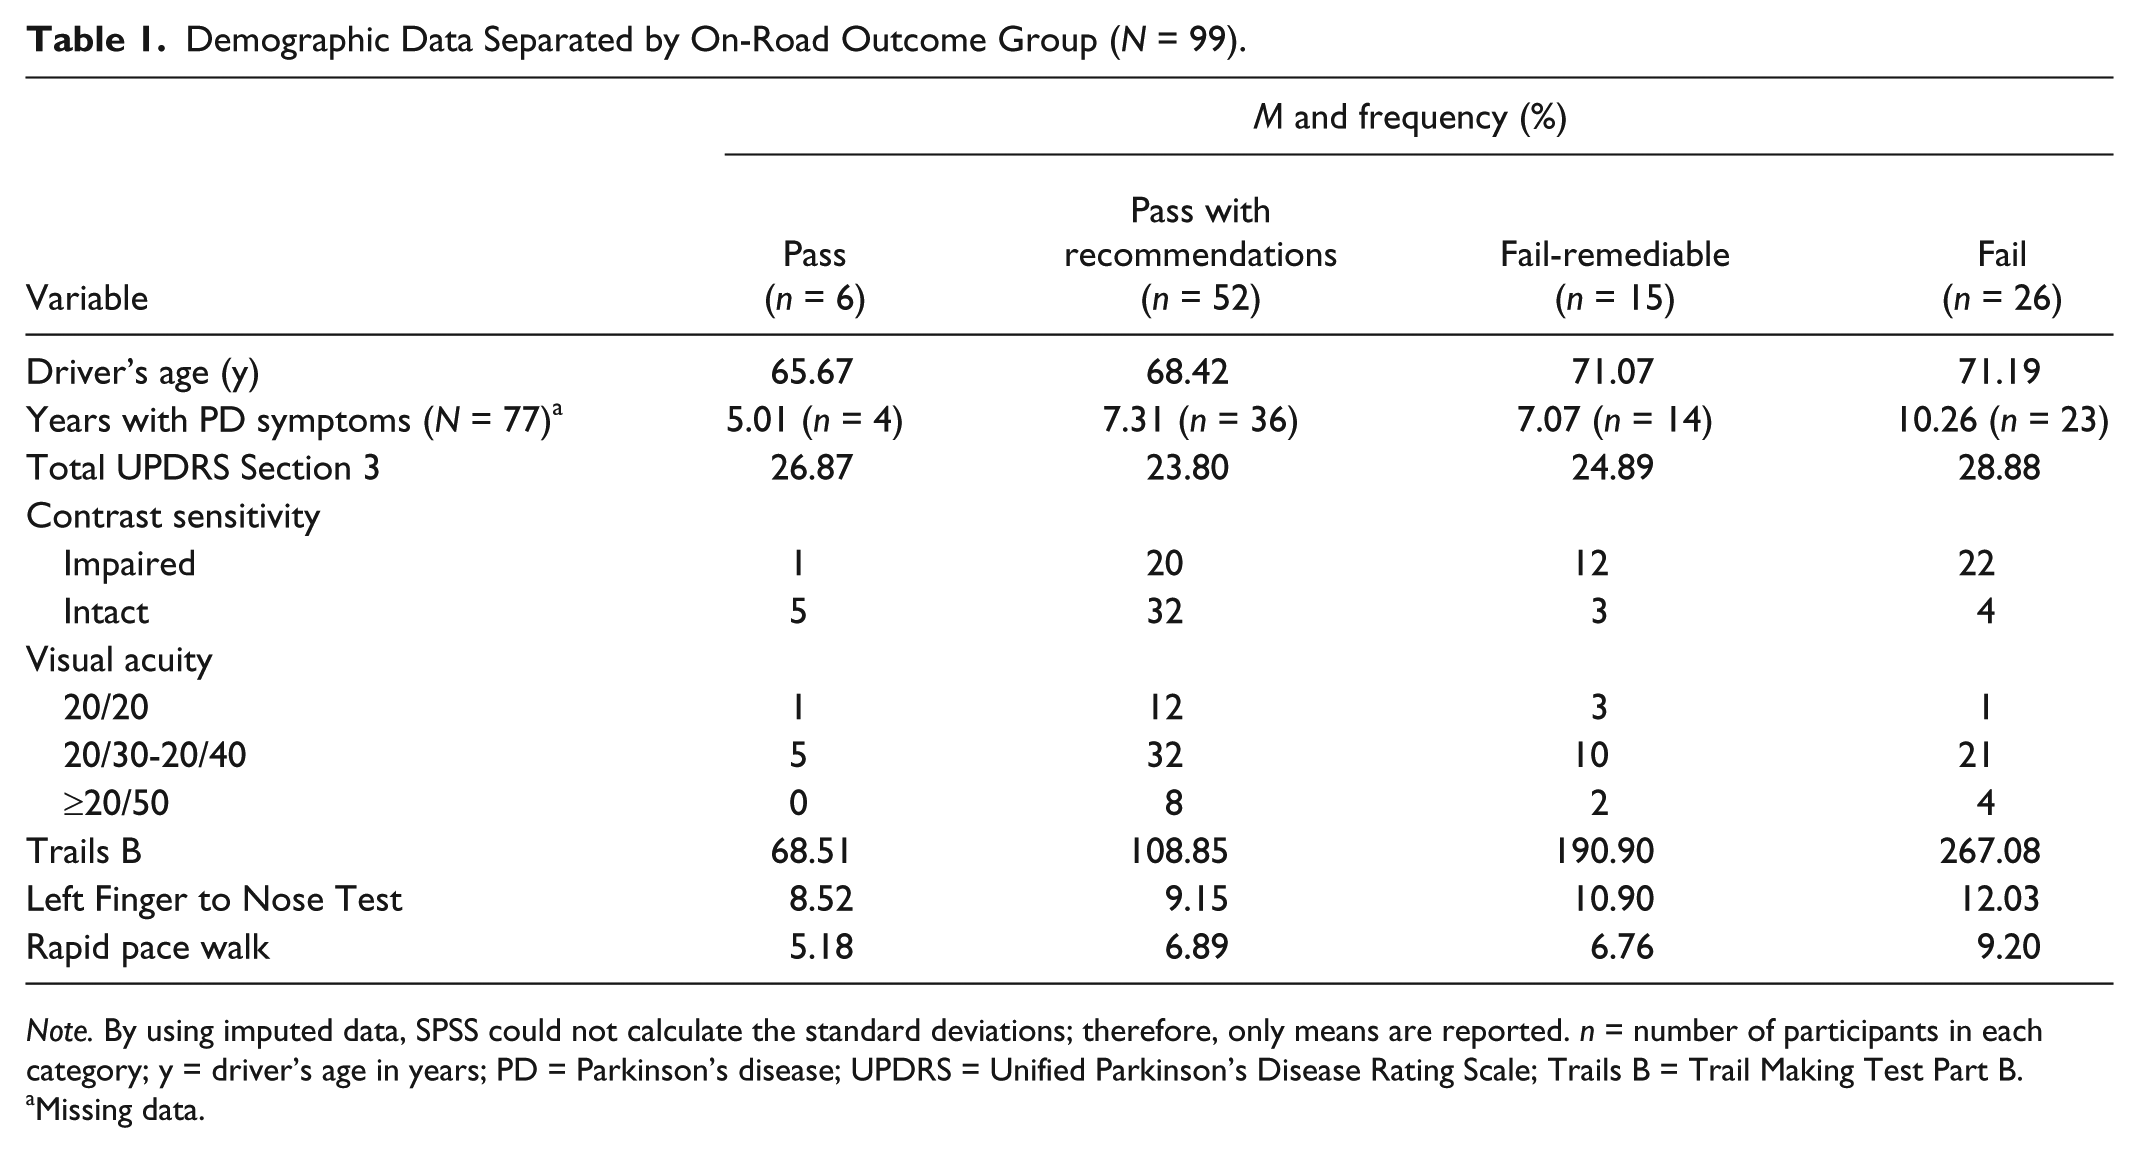
Note. By using imputed data, SPSS could not calculate the standard deviations; therefore, only means are reported. n = number of participants in each category; y = driver’s age in years; PD = Parkinson’s disease; UPDRS = Unified Parkinson’s Disease Rating Scale; Trails B = Trail Making Test Part B.
Missing data.
Spearman Rho Correlation Between Clinical Variables and GRS.
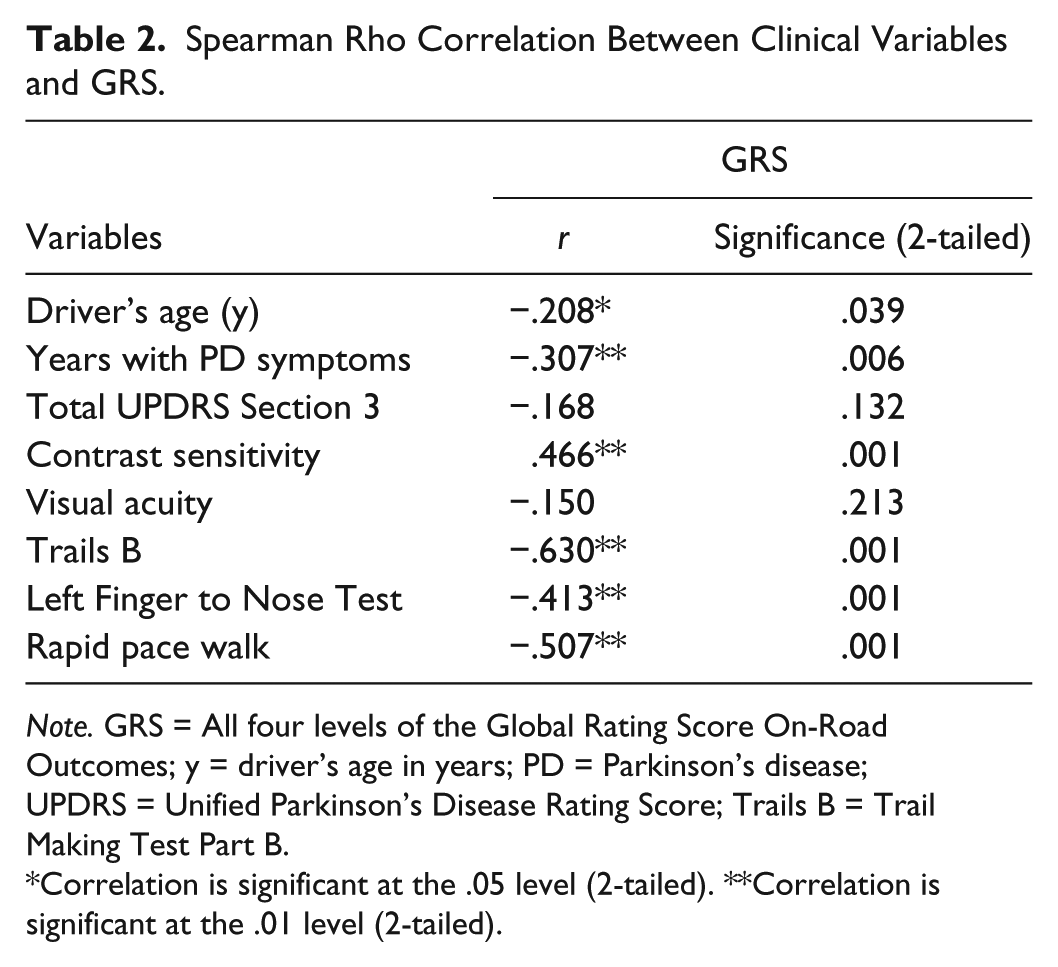
Note. GRS = All four levels of the Global Rating Score On-Road Outcomes; y = driver’s age in years; PD = Parkinson’s disease; UPDRS = Unified Parkinson’s Disease Rating Score; Trails B = Trail Making Test Part B.
Correlation is significant at the .05 level (2-tailed). **Correlation is significant at the .01 level (2-tailed).
For Trails B, a progressive increase in mean time of completion (Table 1) was observed starting with those who passed, followed by participants who passed with recommendations, participants in the fail-remediable category, and finally participants who failed, who took longer times to complete the test. A similar pattern was observed for the time required to complete the left FNT, starting with participants who passed (and took less time to complete the test), all the way to participants who failed and required longer times to complete the test. In terms of the RPW, participants who passed showed faster (better) completion time than those who failed. Although participants who failed were slower in completing the RPW test than those who passed with recommendations and fail-remedial, the two latter groups displayed similar times of completion.
Table 2 displays correlations between clinical variables and the GRS. An inverse relationship suggests that if participants perform better on the clinical tests (lesser time is better), they will also have a higher GRS, which is associated with better outcomes (e.g., a score of 3 is associated with passing, and a score of 0 is associated with failing). Therefore, PD drivers who were younger, with less years of PD symptoms and intact contrast sensitivity, and required less time to complete the Trails B, FNT, and RPW had better on-road outcomes. Overall, the strongest correlations between independent variables and on-road outcomes in hierarchical order were Trails B, RPW, contrast sensitivity, and left FNT.
Table 3 presents the multinomial regression results. Contrast sensitivity, Trails B, and left FNT were significant predictors of on-road outcomes. The findings suggest that while keeping all the other covariates fixed, individuals with intact contrast sensitivity are more likely to pass an on-road assessment by 3.1% and pass with recommendations by 8.6%. Furthermore, results showed that for every 1-unit speed reduction (1 s) observed for Trails B at the time of assessment, the increase in odds of the participant obtaining a pass was 94.4% over the fail group and the increase in odds of obtaining a pass with recommendations was 98.2%. Similarly, with a 1-unit speed decrease (1 s) for left FNT, the increase in odds of obtaining a pass was 47.3% over the fail group, and the increase in odds of obtaining a pass with recommendations was 55.9%. Although the RPW was statistically significant in the Spearman’s rho correlation, it did not emerge as significant in the multinomial regression. Interesting to note, there was no statistically significant difference found for the fail with recommendations group because an inadequate variance existed between the fail and fail-remediable groups.
Multinomial Regression Model Summary.
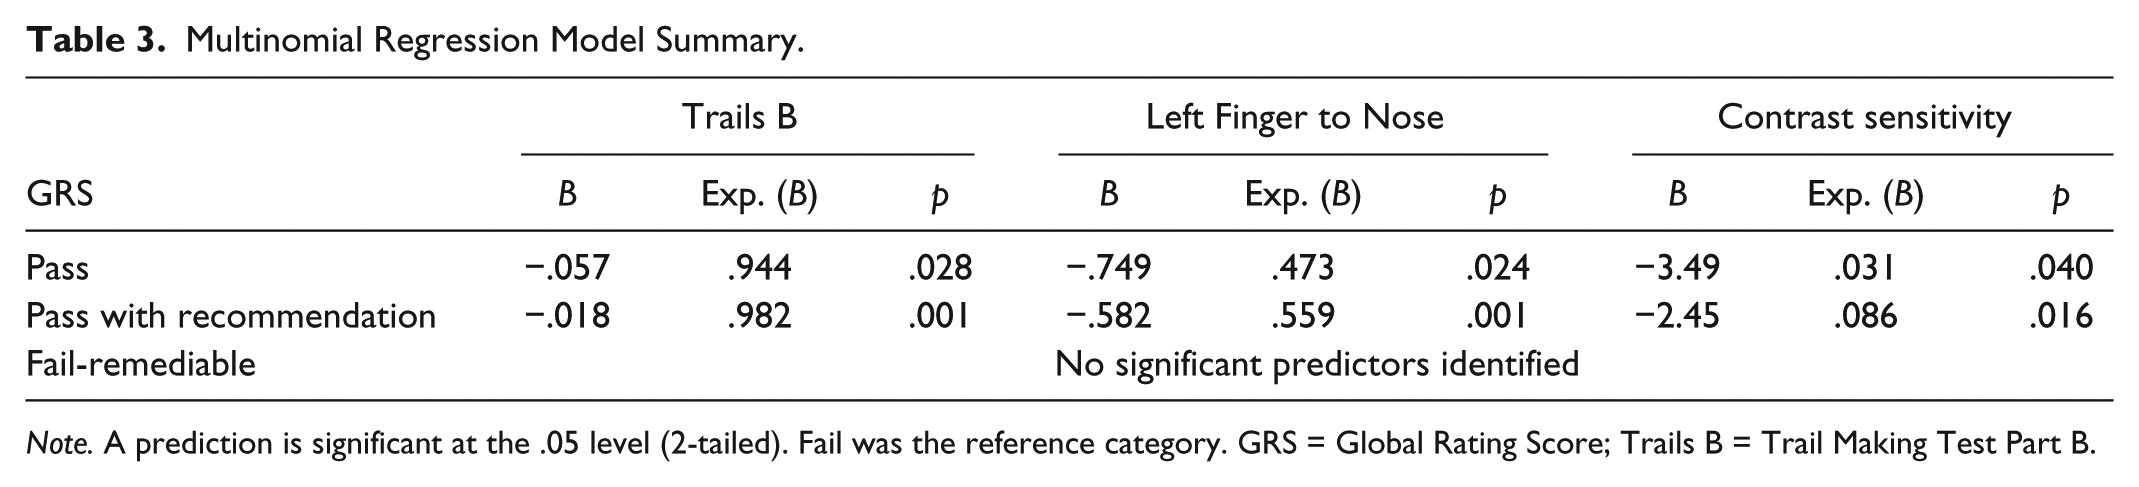
Note. A prediction is significant at the .05 level (2-tailed). Fail was the reference category. GRS = Global Rating Score; Trails B = Trail Making Test Part B.
Discussion
The purpose of this study was to identify clinical predictor(s) that are indicative of on-road outcomes including pass, pass with recommendations, or fail-remediable.
Overall, compared with those who failed the on-road assessment, those who passed or passed with recommendations were younger, had less years with PD symptoms, had contrast sensitivity within functional limits, and took less time to complete the Trails B and left FNT. These findings are consistent with the current literature (Amick et al., 2007; Classen et al., 2011; Crizzle et al., 2013; Devos, Vandenberghe, Nieuwboer, et al., 2013; Devos, Vandenberghe, Tant, et al., 2013). In contrast, the UPDRS Section 3, a commonly used and standard measure to assess motor symptoms and signs in PD (Vassar et al., 2012), was not found to be significant predictor on on-road outcomes. Similarly, in an investigation of road safety of 84 drivers with PD, Uc et al. (2009) did not find the UPDRS Section 3 to be a significant predictor. These findings further strengthen the need for specific assessments and clinical predictors of fitness to drive for drivers with PD.
In addition to the UPDRS, visual acuity did not emerge as a significant predictor of on-road outcomes. The majority of participants had visual acuity between 20/30 and 20/40; however, there were no distinguishing frequencies of the four GRS categories within the 20/20, 20/30 to 20/40, and ≥20/50 visual acuity groups. In Uc et al. (2009) study, visual acuity emerged as a significant predictor of error counts in a multivariate model for people with PD. Although our finding regarding visual acuity is not consistent with that of Uc et al., our outcome measure was different in that it was not related to error count but rather on the GRS, resulting in an overall estimation of fitness to drive.
Although RPW was significantly correlated with GRS, it did not emerge as a significant predictor in the regression model. With a sample of 41 drivers with PD, Classen et al. (2011) also found this test to be significantly correlated to on-road pass versus fail outcomes, and found it to be able to, along with the UFOV, classify 81% of participants in terms of a dichotomized pass versus fail outcomes. With a larger sample, our findings show that this test cannot discriminate between groups and may only provide information regarding passing versus failing.
Overall, contrast sensitivity, Trails B, and left FNT, were found to be significant predictors of passing or passing with recommendations an on-road assessment. Similarly, other studies have found these clinical tests to be predictive of passing an on-road assessment (Amick et al., 2007; Classen et al., 2014; Crizzle, Classen, & Uc, 2012; Classen et al., 2011; Crizzle et al., 2013; Devos, Vandenberghe, Tant, et al., 2013). However, this analysis takes this finding further by showing that such tests can not only serve as predictors of passing versus failing in drivers with PD but also discriminate between those who are fit to drive in any situation (pass) and those who are generally fit to drive but have moderate driving difficulty and would benefit from specific recommendations. Such findings can help clinicians to identify drivers who are currently fit to drive but, given their moderate difficulties, are in need of specific recommendations that can preserve their driving abilities. At the time of assessment, these tests can provide an indication of whether the patient may be likely experiencing driving difficulties that warrant further attention. It is important to note, however, that these results do not reflect an increased gain of using such tests as intervention strategies (by way of practicing the tests). We identified no significant predictors for the fail-remediable group, because little variance existed between this group and the fail group.
With an adequately powered study, and a comprehensive clinical and on-road assessment, this study provides evidence for occupational therapy practitioners to use clinical tests for identifying at-risk drivers who have potential for remediation. The findings of this study are also in concert with prior on-road studies conducted on drivers with PD, suggesting temporal plausibility of the findings.
Implications for Practice and Research
Contrast sensitivity, Trails B, and left FNT can be used as a battery of clinical tests to identify drivers with PD who may have moderate driving difficulties. This battery of well-utilized tests can be completed in a clinical setting within a short period of time. Contrast sensitivity can be determined using the Pelli–Robson Contrast Sensitivity Chart, which requires a one-time cost of US$390, and takes approximately 5 min to complete (Eby, Molnar, Shope, & Dellinger, 2007; Neargarder, Stone, Cronin-Golomb, & Oross, 2003). Trails B is a short test that, including set-up and instructions, takes approximately 5 min to complete. It requires only pencil and paper, with minimal cost (U.S.; Eby et al., 2007; Tombaugh, 2003). The FNT generally takes 1 min to complete and only requires the clinician to administer the appropriate protocol to the client.
In addition, these findings can inform occupational therapists and CDRSs on recommending strategies related to their impaired functional areas. For example, with respect to contrast sensitivity, clinicians may suggest strategies to optimize a client’s functioning such as to avoid driving at night and when it is raining. However, to decrease the cognitive load on set shifting, mental flexibility, and divided attention, clinicians can recommend that a client avoid driving during rush hour, limit communication with passengers within the vehicle, and avoid driving on highways that involve numerous lane changes. As well, clinicians can suggest that clients participate in coordination exercises (e.g., joining local-based exercise classes) as compensatory strategies that may improve upper-extremity motor coordination.
Moreover, identifying clients who pass with recommendations will allow clinicians to provide additional training, education, assistive devices, and so on, to keep this group of drivers on the road for longer than currently possible. Identifying clients who pass with recommendation can allow clinicians to adopt a preventive approach in helping to foster a client’s driving practices and increase his or her trust in consultation of driving rehabilitation services.
Limitations
Participants in this study were from one state in the United States. This limits the generalization of these findings to a population profile that fits this geographical region. Possible selection bias may limit the true representation of the population due to the associated risk (and therefore underrepresentation) of participants being fearful to enroll as they may be reported to regulatory agencies for license suspension. A CDRS conducted all aspects of the evaluation, which may have resulted in rater bias. A rater bias mitigating factor is that the CDRS that performed the assessments had more than 15 years of experience in the assessment and rehabilitation of medically at-risk drivers. Missing data and conducting multiple data imputations resulted in the researchers working with estimates of the data. In addition, approximately 20% of the participants had a self-reported (vs. physician-reported) diagnosis, although this information was further confirmed through caregiver report.
Conclusion
This study adds to previous driving studies in the PD literature by identifying that performance in contrast sensitivity, Trails B, and left FNT is not only predictive of passing versus failing an on-road assessment but can also discriminate between those who pass and those who pass with recommendations. These findings suggest that contrast sensitivity, Trails B, and left FNT can be used as screening tools to identify drivers with PD who can benefit from recommendations to preserve their driving abilities. As such, these findings have important implications for practice and future research.
Future research will take these findings further, by conducting Receiver Operating Characteristics (ROC) Curves to determine the cut-off points with optimal high sensitivity and specificity values for contrast sensitivity, Trails B, and left FNT clinical tests. Cut points will assist clinicians in determining whether a client should be referred to a CDRS for an on-road assessment as well support the appropriate utilization of these services, such as receiving specific recommendations that can help them remain on the road for as long as possible.
Footnotes
Acknowledgements
The authors acknowledge neurologists at the University of Florida’s Movement Disorder Center (UFMDC) for referring clients to this study and the University of Western Ontario’s i-Mobile Research Lab for providing infrastructure and support for the article preparation.
Declaration of Conflicting Interests
The author(s) declared no potential conflicts of interest with respect to the research, authorship, and/or publication of this article.
Funding
The author(s) disclosed receipt of the following financial support for the research, authorship, and/or publication of this article: The parent study was funded by the National Parkinson Foundation (Sherrilene Classen, Principal Investigator).