
Abstract
The current meta-analysis examined the use of deep touch pressure (DTP; e.g., weighted vests) with students with disabilities. DTP is a form of sensory integration therapy that is currently used extensively in schools with students with autism and other disabilities. Each study in the analysis was evaluated using the Council for Exceptional Children’s guidelines for evidence-based practices. In addition, noting the debate regarding appropriate single-case effect sizes, the current study calculated omnibus effect sizes utilizing a variety of single-case design effect sizes. Results of the current study suggest that DTP interventions are of generally poor quality and demonstrate effects that do not validate their current use for students with disabilities.
Both the No Child Left Behind Act (NCLB; 2001) and the Individuals With Disabilities Education Act (IDEA; 2004) mandate that instructional strategies must be research-based. While both pieces of legislation use different terms (research-based vs. peer-reviewed research), the end result is that the field of education has begun to devote considerable attention to identifying evidence-based practices (EBPs) for practitioners to use toward improving student performance (Cook & Tankersley, 2013). The primary method for determining the evidence base for a particular practice entails conducting a systematic review of the literature (Schlosser, Raghavendra, & Sigafoos, 2013). The field of education and special education has a long history of publishing reviews; however, only in the last few decades have guidelines been established for assessing groups of studies to determine whether a practice is evidence based. For example, both the What Works Clearinghouse (2014) and the Council for Exceptional Children (CEC; 2014) have established guidelines for determining the evidence that can be inferred from a single study and the body of studies as a whole.
In the case of providing a free appropriate public education (FAPE) to students with disabilities, the identification and use of EBPs is essential (Yell, Katsiyannis, & Losinski, 2015; Yell & Rozalski, 2013). Furthermore, Cook, Tankersley, and Landrum (2013) suggest that students with disabilities require the most effective interventions to succeed; however, practices meeting evidence-based standards are rarely used (Maheady, Smith, & Jabot, 2013). The reasons for the lack of EBP utilization by educators of students with disabilities are varied and are described as a research-to-practice gap. For example, in the late 20th century, facilitated communication was an oft-used practice to allow students with autism spectrum disorders (ASD) to communicate. However, the evidence of its validity was questioned, with researchers finding no evidence to support its use, ending in the American Psychological Association (1994) drafting a policy statement that it should no longer be used due to the lack of scientific evidence. Even with such evidence opposing its use as an intervention, facilitated communication continues to be investigated, researched, and used (Travers, Tincani, & Lang, 2014).
Sensory integration therapy, like facilitated communication, has a fairly complicated and controversial history. First discussed at length by Ayres (1972), sensory integration therapy is predicated on providing systematic sensory experiences to reduce hypothesized sensory dysfunctions in neurological processing. Sensory integration therapy uses a variety of modalities (e.g., auditory, tactile) that are designed to work on the specific sensory dysfunction. Sensory integration therapy continues to be one of the most commonly used interventions by occupational therapists for students with ASD (Lang et al., 2012) despite debate about its relative efficacy. That debate has led to numerous reviews of the literature and a policy paper from the American Academy of Pediatrics (2012) that discusses the limited research base of sensory integration therapy and urges physicians not to diagnose children with sensory processing disorder due to an inability to adequately assess it. The paper by the American Academy of Pediatrics was followed shortly by the American Psychiatric Association’s (2013) decision to exclude sensory processing disorder from its Diagnostic and Statistical Manual of Mental Disorders.
A subcategory of sensory integration therapy that is frequently used by school practitioners is deep touch pressure (DTP; Olson & Moulton, 2004). DTP is a form of tactile stimulation typically involving the use of weighted garments, swaddling, or therapeutic brushing (Chen, Yang, Chi, & Chen, 2012; Grandin, 1992; Zissermann, 1992), and is used to provide sensory input that is intended to calm individuals both physiologically (through input to the central nervous system) and psychologically (Grandin, 1992; Krauss, 1987). In schools, DTP has been used to treat a variety of issues in students with disabilities particularly those with ADHD, ASD, and intellectual and developmental disabilities (Olson & Moulton). In a survey of school-based occupational therapists, Olson and Moulton described the frequency with which occupational therapists used weighted vests to be between 82% and 92%. Participants noted particularly positive effects with regard to increasing student attention and decreasing stereotypy in students with autism. With regard to empirical research, somewhat promising results have been found on the effects of DTP across the school-related areas of (a) attention (Fertel-Daly, Bedell, & Hinojosa, 2001), (b) disruptive behavior (Quigley, Peterson, Frieder, & Peterson, 2011), (c) self-injury (Doughty & Doughty, 2008), and (d) stereotypical behaviors (Fertel-Daly et al., 2001).
A number of previous narrative and systematic reviews exist examining the effectiveness of DTP as an intervention for students with disabilities. Of the reviews examined, one lacked a section describing search methodology (Honaker & Rossi, 2005), making it difficult to replicate. Of the remaining reviews, two (Barton, Reichow, Schnitz, Smith, & Sherlock, 2015; Stephenson & Carter, 2009) included students with a wide range of disabilities including ASD and the other three (Lang et al., 2012; Morrison, 2007; Weeks, Boshoff, & Stewart, 2012) focused primarily on students with autism. With respect to type of DTP, two of the reviews (Morrison; Stephenson & Carter) focused specifically on weighted or pressure vests, whereas Weeks et al. examined therapeutic brushing, and Lang et al. and Barton et al. examined sensory integration therapy more broadly. Of the published reviews, only one (Barton et al., 2015) addressed bias within the studies and made an effort to determine the evidence base of the practice using an accepted guideline (What Works Clearinghouse). However, Barton et al.’s study investigated sensory integration therapy more generally, and none of the previous reviews utilized statistical methods to determine the relative efficacy of DTP.
Therefore, the present study seeks to extend findings of these reviews to determine the relative efficacy and evidence base of DTP on the outcomes of K-12 students with disabilities. This meta-analysis is concentrated on the following research questions:
Method
To determine the evidence base of DTP on the educational outcomes of students with disabilities, a systematic search of all publicly available (published and unpublished) experimental studies was conducted. The search included all previous dates with the last search conducted on May 23, 2014. Five databases were searched (ERIC, Education Full Text [H.W. Wilson], PsychINFO, Academic Search Premiere, and Medline) and utilized the following Boolean phrase: (“proprioception” OR “Deep Pressure” OR “inflatable vest” OR “snug vest” OR “Therapressure” OR “Wilbarger” OR “Brushing” OR “hug machine” OR “compression garment” OR “weighted vest” OR “weighted blanket” OR “weighted garment”) AND (“therap*”) AND (“adolescent” OR “student*” OR “child*” OR “youth”). In addition, hand searches were conducted in the following journals for the years 2010 through 2015: (a) American Journal of Occupational Therapy, (b) Focus on Autism and Other Developmental Disabilities, and (c) Journal of Autism and Developmental Disorders. These journals were selected because they comprised the journals found most often to include studies detailing DTP from previous reviews (e.g., Barton et al., 2015; Stephenson & Carter, 2009). Finally, the first author conducted ancestral searches by screening the reference lists of studies determined to be eligible to identify studies that may have been missed in the previous searches.
To be included in the current meta-analysis, studies must have been reports of single-case designs (SCD), experimental studies, or quasi-experimental studies. Inclusion was founded on the following: (a) the study was written in English, (b) the study involved children and adolescents with disabilities between birth and age 18, (c) DTP was identified as the independent variable, and (d) the study included, as a dependent variable, one of the following: attention, disruptive behavior, self-injurious behavior, or stereotypical behavior.
Coding Procedures
Studies meeting inclusion criteria were coded according to the following variables: (a) participant characteristics, (b) setting, (c) type of DTP, (d) experimental design, and (e) study quality. Participant characteristics included age, race, gender, and disability. The setting where the therapy took place was coded as home, clinic, general education classroom, special education classroom, self-contained classroom, and residential school. Coding of the type of DTP used included who provided the therapy (graduate research assistant, staff, researcher, school psychologist, teacher, occupational therapist, parent), independent variable (weighted vest, inflatable vest, hug machine, therapeutic brushing), dosage (e.g., weight of vest), and dependent variable (e.g., attention). The experimental design was coded as SCD, randomized control trial (RCT), or quasi-experimental.
CEC’s (2014) Standards for Evidence-Based Practices in Special Education was used to identify the quality of the included studies. For a study to be deemed evidence based, it must meet criteria in each of the following eight domains: (a) context and setting, (b) participants, (c) intervention agent, (d) description of practice, (e) implementation fidelity, (f) internal validity, (g) outcome measures/dependent variables, and (h) data analysis. Within our coding frame, the study had to explicitly state the information needed to meet each indicator in the domain. For example, to meet the first indicator in Domain 7, the study had to explicitly describe a measure of social validity. As it was likely that a large number of studies would not meet each of the quality indicators because the standards are fairly new (CEC, 2014; Losinski, Cuenca-Carlino, Zablocki, & Teagarden, 2014), a percentage of quality for each study was determined by adding the total number of indicators met in each domain and dividing by the total number of indicators. Two research members individually coded each study for each of the indicators. Results were compared to determine agreement, and a discussion was held between the coders to arrive at a consensus.
Data Extraction and Analysis
Group design effect sizes
To calculate group effect sizes, studies had to report means, standard deviations, and number of participants in each group in the study, or information that could lead to the calculation of a standard mean difference. Effects for group designs were calculated by entering means, standard deviations, and number of participants in each group of treatment and control groups into Comprehensive Meta-Analysis (CMA, Version 2.2.064). CMA then calculated the standard mean difference, d, and converted those results into Hedges’s g statistic. Hedges’s g was determined to be the most useful effect measure because of the small sample sizes of included studies and because it offers small-sample bias correction (Borenstein, Hedges, Higgins, & Rothstein, 2009).
Single-case effect sizes
The current study synthesized SCD effects utilizing four metrics: (a) a response rate (RR) derived from visual analysis, (b) the percent of non-overlapping data (PND; Scruggs, Mastropieri, & Casto, 1987), (c) the standard mean difference (d; Busk & Serlin, 1992), and (d) Hedges’s g for SCDs (Shadish, Hedges, & Pustejovsky, 2014). The four methods were used with the intention of adding to the current research in determining an appropriate effect measure by investigating the extent to which the respective results achieved are comparable.
Effects based on visual analysis of graphed data
To calculate the RR and PND, individual graphs were analyzed according to the following procedures.
RR
An RR was calculated for each study by visually analyzing the included graphs in each case using traditional SCD techniques described in the Procedures and Standards Handbook of the What Works Clearinghouse (2014) and by Gast and Ledford (2014). Within this framework, a functional relation is demonstrated if a predicted change in the dependent variable can be attributed to the introduction of the independent variable as demonstrated by a change in level, trend, and/or variability of data. With respect to RR, if a functional relation was found, the case was considered to be a responder. An overall RR was calculated within each study and across dependent and independent variables by summing the number of cases deemed responders and dividing by the total cases: RR = Responders / No. of Cases.
PND
PND was selected because it is consistently used in SCD, has a high degree of reliability, and is strongly correlated with observer ratings (Scruggs & Mastropieri, 1998). PND is calculated by determining the proportion of data in the treatment phase that exceeds the highest point in the baseline phase. PND is reported as a percentage with PND > 70% interpreted as an effective intervention, 70% > PND < 50% a questionable intervention, and PND < 50% as an ineffective intervention (Scruggs & Mastropieri, 1998). The combined PND effect size was calculated by weighting the studies by the sample size and then generating a mean PND with standard deviations.
Effects based on difference in means
To calculate mean differences (d and g), data for each case were extracted using Engauge Digitizer (Version 4.1), an open-source digitizing software that converts graphic images into XY numerical coordinates. In reversal designs (ABAB), data were only extracted from the first baseline and intervention phases (AB). In instances where an alternating treatments design was used (e.g., functional analysis was conducted), the condition with the most promising results for DTP (intervention) was used and compared with the absence of the condition.
Standard mean difference
Busk and Serlin’s (1992) standard mean difference (d) is calculated by subtracting the mean of the intervention phase (Xi) from the mean of the baseline phase (Xb) and dividing by the standard deviation of the baseline phase (SDb): d = (Xb − Xi) / SDb. Recently, this method for calculating d has been criticized for being unreliable (Scruggs & Mastropieri, 2012) and is limited by its reliance on within-case variability rather than between-case variability (Shadish et al., 2014) as is done in group designs. Previously, it has been stated that d can be interpreted using the methods outlined by (Cohen, 1988), where d ≤ 0.20 indicates a small effect and d ≥ 0.80 a large effect. However, Shadish et al. suggest that results from this, and other SCD effects using the standard mean difference, may be significantly higher than those in group designs and the Cohen guidelines for interpretation may be incorrect. We include it here because it allows comparison with other SCD meta-analyses that used it as a measure, it allows calculation of studies with only one case (unlike the Hedges’s g for SCD), and may provide context for the other measures.
Hedges’s g
Finally, Hedges’s g was calculated following procedures outlined by Shadish et al. (2014) using the DHPS Macro (Version 1.0) for IBM SPSS (Version 22). Data were de-trended in the analysis utilizing individual case sessions as the de-trending variable. A limitation of this statistic is that it uses between-case variance rather than within-case variation (see d above), and therefore necessitates at least three cases per study. Considering that many of the studies found in the search had fewer cases, we were unable to calculate this measure.
Analysis
Variance for d in SCDs are difficult to calculate, thus we weighted the d effects by sample size rather than the typical inverse variance and calculated the mean effects in SPSS (Version 22) using the MEANES.sps macro (Version 2005.05.23). Hedges’s g effect sizes were entered into CMA utilizing a random-effects model. Hedges, Pustejovsky, and Shadish (2012) recommend the random-effects model for synthesizing g. Raudenbush (2009) indicates that it allows for generalization to a larger population. Studies were “grouped” in CMA before running the analyses, yielding separate effect sizes for group and SCD designs along the dependent variables with further grouping within the dependent variables by independent variable. A combined effect size for DTP across all dependent variables was calculated for both SCD and group designs. Finally, to determine the relationship among the SCD effect sizes, a Pearson product–moment correlation was calculated among RR, PND, d, and g.
Risk of Publication Bias
The tendency for journals to publish only positive findings (publication bias) is a significant issue in meta-analysis, particularly in the social sciences (Liberatti et al., 2009; Maag & Losinski, 2015; Shadish et al., 2014). There is no agreed-upon method for addressing publication bias, particularly with respect to SCDs, however it is recommended that meta-analysts utilize at least two methods to increase confidence in the findings (Banks, Kepes, & Banks, 2012). Therefore, publication bias analyses of the SCD studies were conducted in CMA utilizing the following statistical analyses: Egger’s regression of the intercept test (ERI; Egger, Davey Smith, Schneider, & Minder, 1997), and Duval and Tweedie’s trim and fill method (T&F; Duval & Tweedie, 2000). ERI predicts the effect size, divided by its standard error, which would be zero if bias were not present. T&F uses a funnel plot of results (horizontal axis = effect size, vertical axis = standard error) to identify a hypothetical effect size. If no bias exists, the funnel plot should be symmetrical; if not, results are added to obtain symmetry and the effect size is recalculated.
Results
Database searches of Academic Search Premiere, Education Full Text (H.W. Wilson), ERIC, Medline, and PsychINFO resulted in 1,453 records, with 947 references left after removal of duplicates. Next, two researchers independently screened the titles and abstracts of the 947 remaining references, resulting in 47 articles that were read in their entirety and coded for inclusion. Of the 47 articles remaining, 26 were excluded because a more thorough reading revealed that they did not meet inclusion criteria. Finally, ancestral searches of the included articles were conducted as well as hand searches of the last 5 years of the Journal of Autism and Developmental Disorders, Focus on Autism and Other Developmental Disabilities, and the American Journal of Occupational Therapy. An additional three articles were found. After a final screening of the 24 articles for inclusion, a total of 23 studies met the current study’s inclusion criteria; however, four (Buckle, Franzsen, & Bester, 2011; Edelson, Edelson, Kerr, & Grandin, 1999; Grzankowski, 2001; Myles et al., 2004) did not provide enough information to calculate effect sizes and were therefore excluded from the statistical analyses. See Figure 1 for a flowchart of the article search methods.
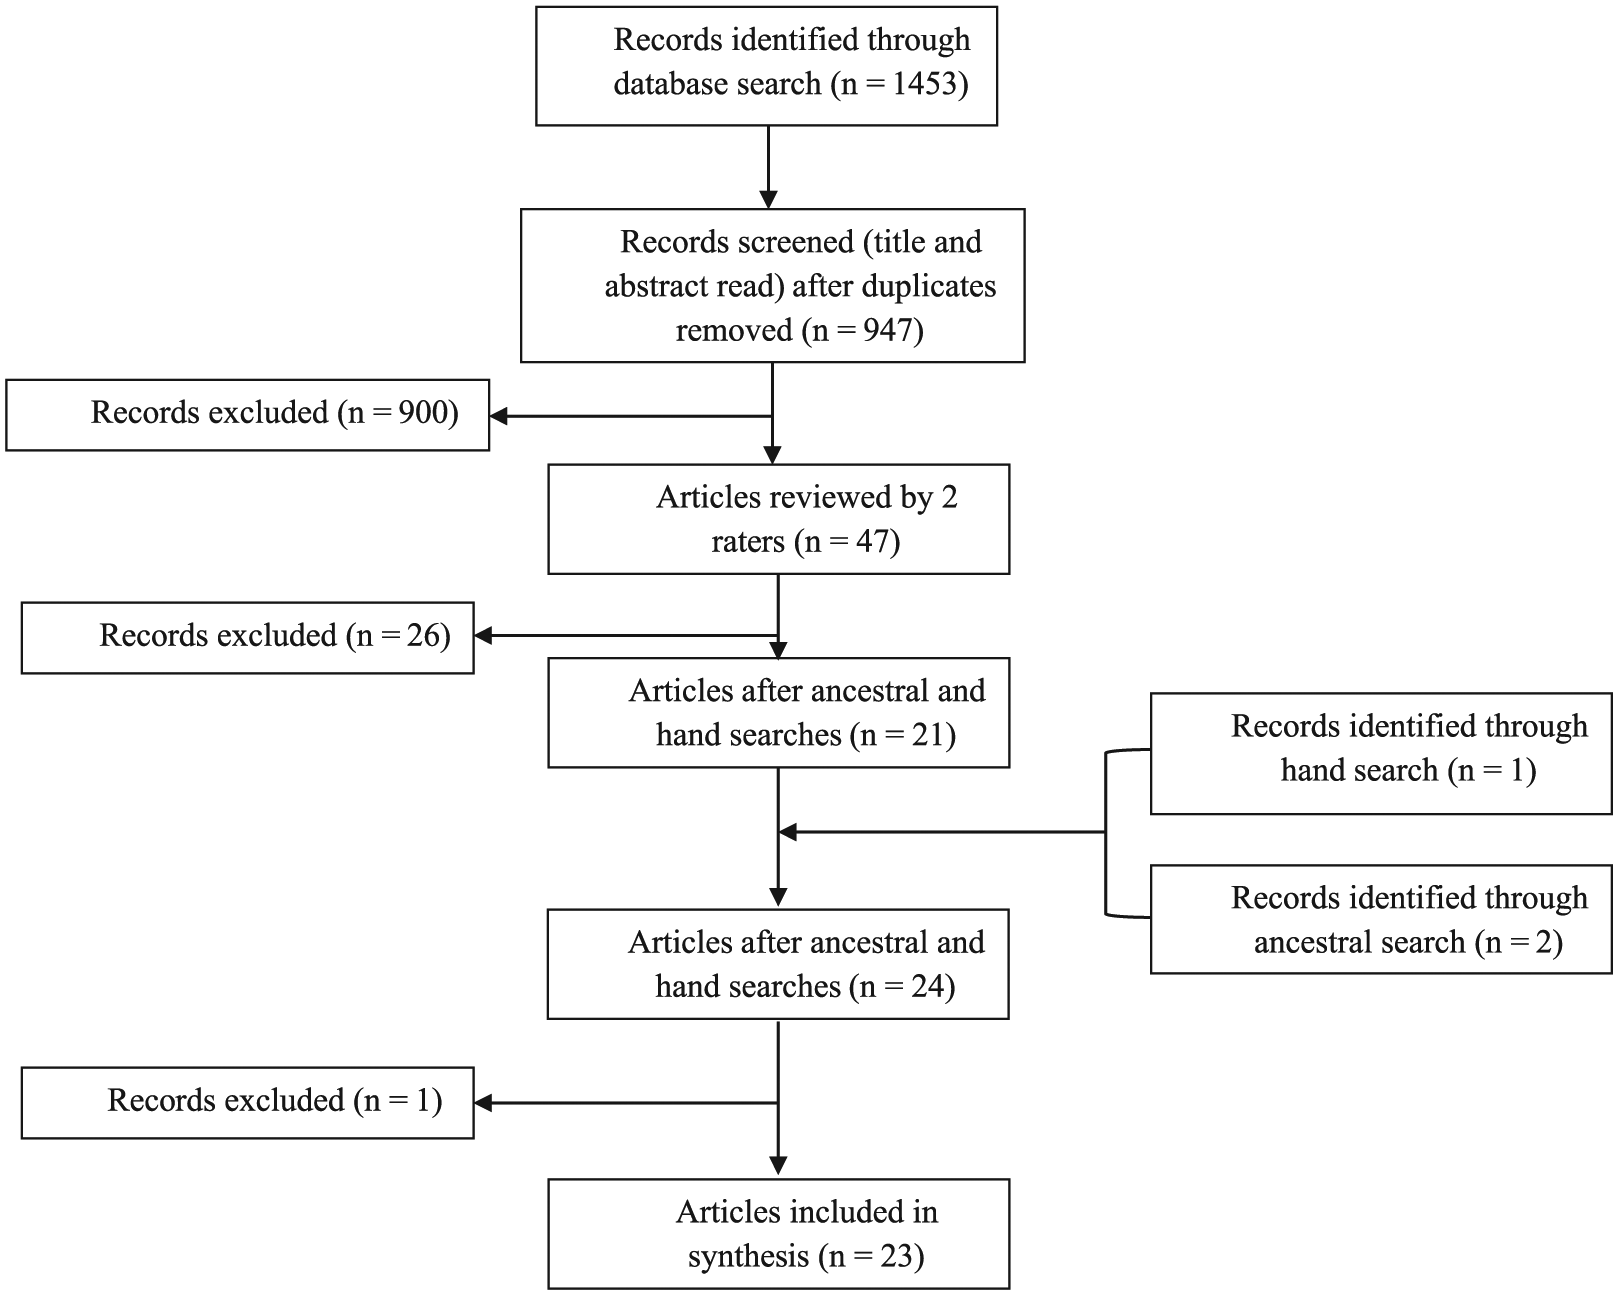
Search flowchart.
Study Characteristics
Twenty-three studies were included in this synthesis and involved a total of 258 participants. Descriptions of the participants, settings, and design features appear in Table 1. Participants ranged in age from 2.25 years of age (Leew, Stein, & Gibbard, 2010) to 14.5 years of age (Doughty & Doughty, 2008) with a median age of 5.60 and a mean age of 6.17. Males were represented significantly more (n = 205) than females in these studies. Participants identified with ASD (n = 16) were present in the majority of the studies followed by participants with ADHD (n = 4).
Study Characteristics.
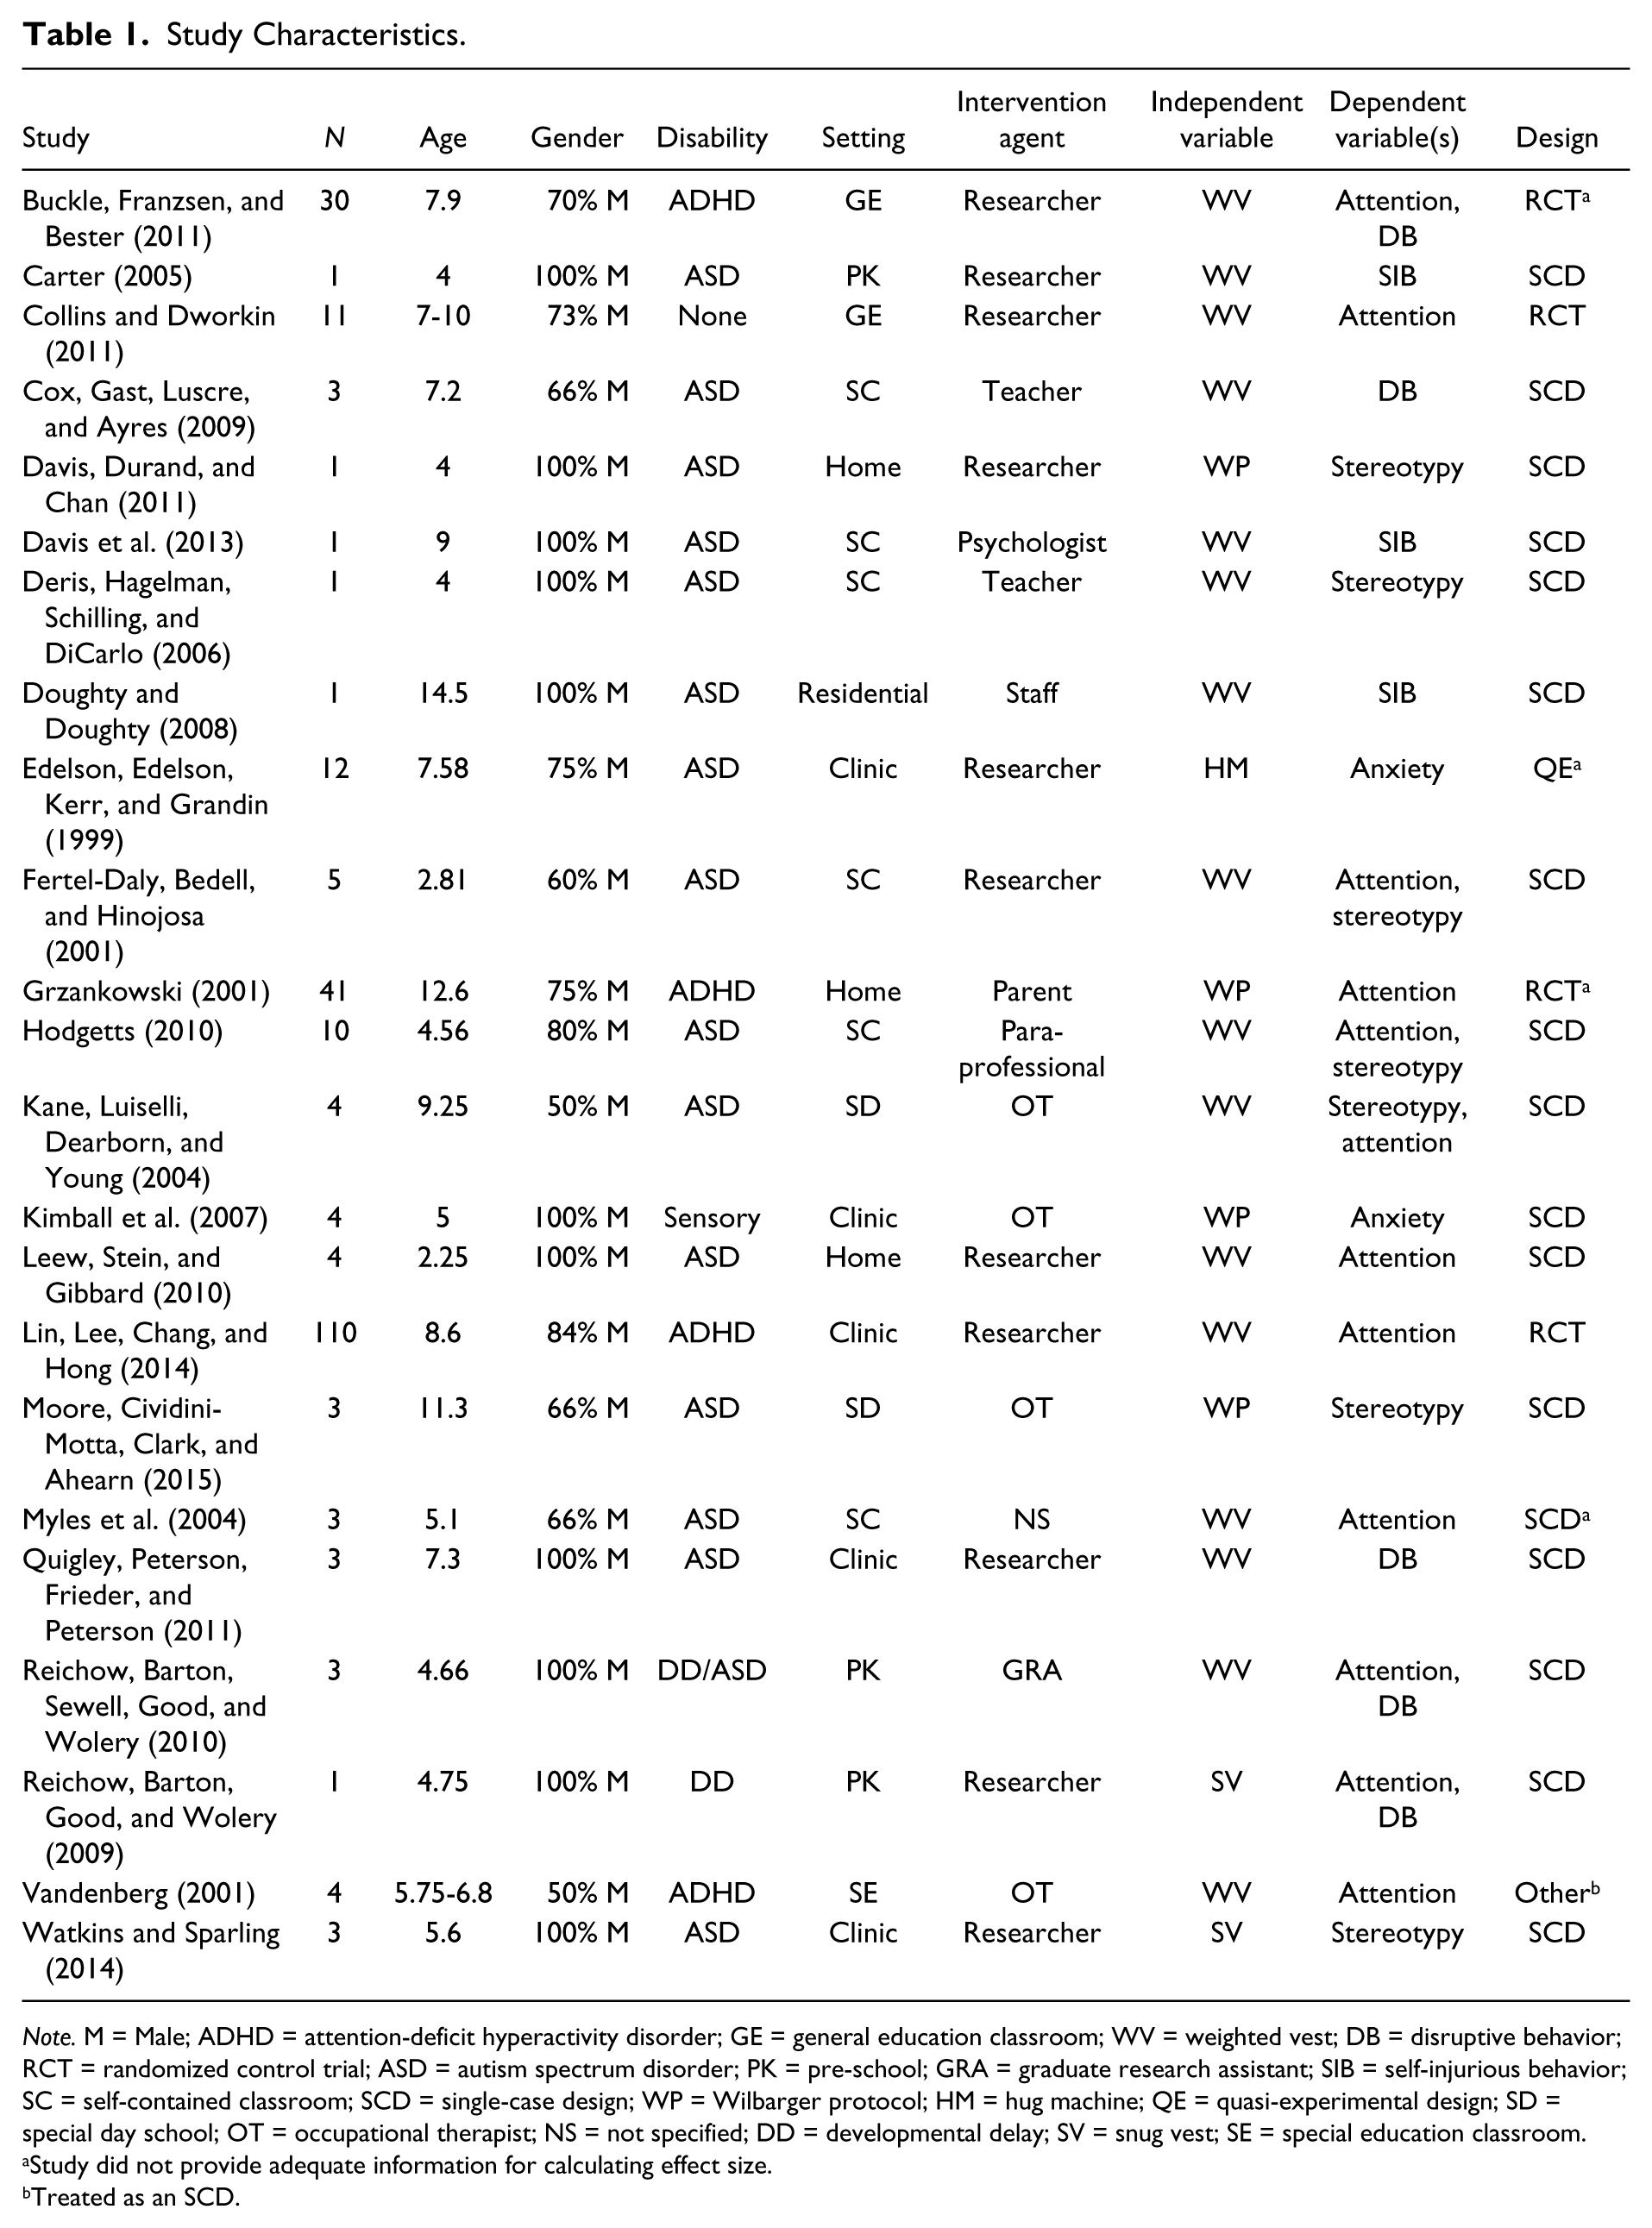
Note. M = Male; ADHD = attention-deficit hyperactivity disorder; GE = general education classroom; WV = weighted vest; DB = disruptive behavior; RCT = randomized control trial; ASD = autism spectrum disorder; PK = pre-school; GRA = graduate research assistant; SIB = self-injurious behavior; SC = self-contained classroom; SCD = single-case design; WP = Wilbarger protocol; HM = hug machine; QE = quasi-experimental design; SD = special day school; OT = occupational therapist; NS = not specified; DD = developmental delay; SV = snug vest; SE = special education classroom.
Study did not provide adequate information for calculating effect size.
Treated as an SCD.
Characteristics of the settings
The majority of the studies were conducted in a self-contained classroom (n = 6) followed by studies conducted in a clinic (n = 5). The remaining studies were either conducted in a pre-school classroom (n = 3), the home (n = 3), a general education classroom (n = 2), a day school (n = 2), a residential facility (n = 1), or in a special education resource classroom (n = 1). The most common intervention agent used in the studies was a researcher (n = 11) with the remaining studies utilizing either an occupational therapist, teacher, psychologist, unidentified staff member, paraprofessional, graduate research assistant, or parent.
Design features
A large portion of the studies targeted attention (n = 12) as their dependent variable. Stereotypical behaviors were targeted in seven of the studies and disruptive behavior in five of the studies. The remainder targeted self-injurious behaviors (n = 3) and anxiety (n = 2). Eighteen of the studies were SCD, with the rest using group designs, including RCT (n = 4), quasi-experimental design (n = 1), or other (n = 1). Interventions used included weighted vests, the Wilbarger protocol, compression vests, and the hug machine. Sixteen of the 23 studies used vests weighted with 5% to 10% of the participant’s body weight in 2-hr intervals as the independent variable. Four of the studies focused on the use of the Wilbarger protocol which is an extremely specific procedure that mainly focuses on brushing the student with a specialized brush every 2 hr while the person is awake, for at least 2 weeks. Two of the studies examined the use of a snug or compression vest made of a stretchy material that is sized to the individual. The final study examined the effectiveness of a squeeze, or “hug” machine comprised of a chute with levers that control hydraulic compression.
Quality of Included Studies
Only one of the included studies met all the CEC’s (2014) evidence-based standards (Cox, Gast, Luscre, & Ayres, 2009). The average quality percentage for each study was 77%, with a range of 59% (Doughty & Doughty, 2008) to 100% (Cox et al., 2009). The most common omissions in the corpus of studies were documenting implementation fidelity (Indicator 5), intervention agent (Indicator 3), and social validity (Indicator 7.1). Only two studies (Cox et al., 2009; Davis et al., 2013) included a measure of implementation fidelity. Fourteen of the studies failed to explicitly describe the intervention agent and how they received training in the intervention. Finally, social validity was only measured in two of the 18 SCD studies. Table 2 provides a listing of the quality indicator domains and the results by study.
Results of CEC Quality Indicators Across Studies.

Note. Number in parenthesis is the number of individual indicators within the domain. CEC = Council for Exceptional Children; SCD = single-case design.
Synthesis of Study Effects
The two group designs included in this analysis (Collins & Dworkin, 2011; Lin, Lee, Chang, & Hong, 2014) investigated the use of weighted vests on attention, finding small to medium effects across both effect measures (d = 0.36, var. = 0.02; g = 0.35, var. = 0.02, 95% confidence interval [CI] = [0.10, 0.61]). Table 3 displays summaries of study effects for group and SCD studies.
Study Effects.

Note. PND = percent of non-overlapping data (Scruggs, Mastropieri, & Casto, 1987); CI = confidence interval; SCD = single-case design.
Three of the four SCD effect sizes were correlated at the p < .05 level, with the standard mean difference measures d and g having the strongest relationship (r = −.89; p = .00), followed by PND and RR (r = .65; p = .00). Table 4 provides correlation descriptions for the SCD designs.
Effect Size Correlations.
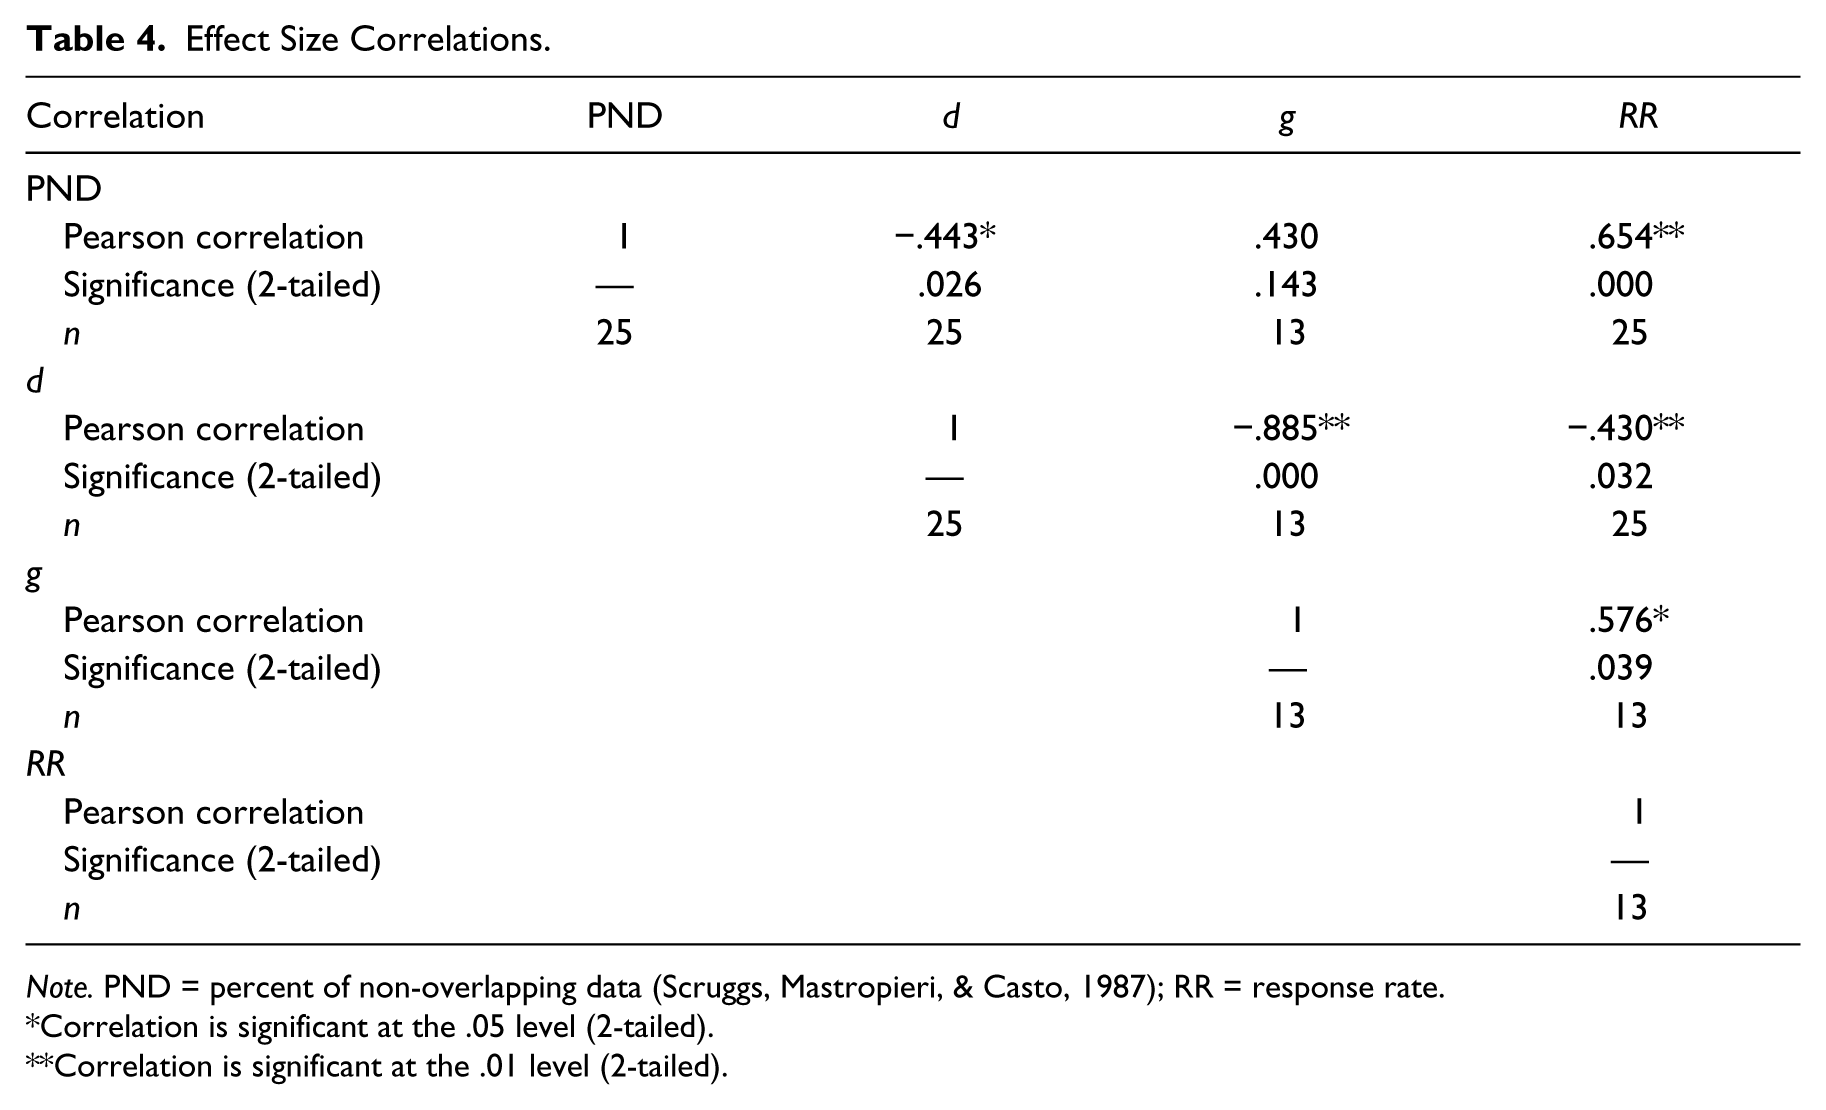
Note. PND = percent of non-overlapping data (Scruggs, Mastropieri, & Casto, 1987); RR = response rate.
Correlation is significant at the .05 level (2-tailed).
Correlation is significant at the .01 level (2-tailed).
The RR derived from the results of visual analysis of graphed data showed 32% (n = 23) of the total cases (n = 71) responded to DTP. In addition, the overall PND value (27.10) is considered an insignificant effect. Furthermore, results from the standard mean difference effect sizes were similarly insignificant: d = 0.20 (var. = 12.42) and g = −0.19 (var. = 0.01). As with the group designs, results for attention were the largest, though still relatively small: RR = 54%, PND = 33.7%, d = 0.27 (var. = 0.65), and g = 0.39 (var. = 0.56). Results for disruptive behavior were mixed, with insignificant results along RR (10%) and PND (5.4%), negative effects for d (0.67, var. = 0.85), and slightly positive effects for g (−0.37, var. = 0.05). Self-injurious behavior had few studies but showed insignificant results along RR (33%) and PND (33.3%), and large, but varied findings for d (−9.28, var. = 248.61). Finally, stereotypical behavior had insignificant results across all measures: RR = 16%, PND = 26.4%, d = 0.75 (var. = 2.27), and g = −0.23 (var. = 0.01).
Publication Bias
Analyses of publication bias were conducted using the SCD studies and the respective d statistic, as it was the most prevalent of the standard mean difference effect sizes. Results of ERI (intercept = −0.57; p = .21) show little evidence of bias in the literature. Results of the T&F also suggest little evidence of publication bias, with a symmetrical funnel and no studies added, resulting in an effect size identical to that found in the original analysis.
Discussion
The current study examined the effects of DTP on the educational outcomes of students with disabilities. The included studies were found to be of generally low quality, with only one of the studies meeting CEC’s (2014) standards for quality in determining an EBP. Effects of DTP were small across the four dependent variables (attention, disruptive behavior, self-injury, and stereotypy) and within the sub-types of DTP. However, even the small effects in the SCD studies should be taken with caution, as the small to moderate effects may be attributed to the overestimation of effect sizes based on standard mean differences. In the following, implications of the current meta-analysis are presented regarding the effects and evidence base of DTP for students with disabilities. Finally, limitations of the current meta-analysis will be presented, followed by suggestions for research.
Effects of DTP
Overall, our findings suggest that DTPs have little, if any, positive effects, and in some cases produce negative effects (e.g., increased disruptive behavior; Reichow, Barton, Good, & Wolery, 2009). What appears to be at odds are the effects achieved in this analysis and those described by occupational therapists (Olson & Moulton, 2004). Indeed, supporters of the methods (e.g., Grandin, 1992; Olson & Moulton, 2004) suggest that DTP is effective, while the included studies resulted in our conclusion that these therapies are ineffective. The omnibus PND value was insignificant (PND = 27.1%), with none of the individual independent or dependent variable groupings reaching significance on this measure of effect. For example, of the dependent variables, the largest effect was found for attention (PND = 33.7%), which is still considered insignificant. In some cases, using the standard mean difference effect sizes (d and g) showed overall improvement and moderate effects when using Cohen’s (1988) interpretation; however, it is likely that Cohen’s interpretation is not applicable to SCD. For example, Shadish et al. (2014) suggested that effects based on a standard mean difference tended to be larger in SCDs compared with group designs. Therefore, it is our contention that the small to moderate effects noted with the standard mean difference statistics here are likely null.
Noting the limitations of SCD effect measures, we also used traditional visual analysis. Results of our visual analysis of the graphed data confirmed our statistical analyses and added further weight to our conclusion that DTP lacks empirical support. Unfortunately, some of the studies identified (e.g., Edelson et al., 1999) did not provide enough information, or had enough threats to internal validity that we opted to exclude them for the statistical analyses. However, they were few enough, that the addition of their results would not likely alter the results in a meaningful way.
Evidence for DTP
As discussed in previous reviews, poor research design and method were pervasive in the included studies, raising questions about the validity of the results presented (Barton et al., 2015; Lang et al. 2012; Morrison, 2007; Stephenson & Carter, 2009; Weeks et al., 2012). Indeed, only one study (Cox et al., 2009) met all the CEC’s (2014) standards for quality reporting, and that study cast doubt on the utility of DTP to reduce challenging behaviors of students with ASD. Other issues of suspect study quality involved failure to describe the interventionist (70% of studies), assess treatment fidelity (88% of studies), and evaluate social validity of the intervention (88% of studies). These issues are unfortunately not uncommon in the special education literature, with previous meta-analyses using CEC’s indicators having similar findings (Losinski et al., 2014; Losinski, Wiseman, White, & Balluch, 2016). These problems are particularly troublesome for special education research because failing to address treatment fidelity opens up studies to threats to validity, while lacking a measure of social validity decreases the field’s ability to assess the impact and usability of an intervention in practice. In essence, these measures provide invaluable information regarding the intervention and its ability to bridge the research to practice gap. For example, if an intervention is difficult to use or theoretically aversive to practitioners, but requires 100% fidelity of implementation, it may not be implemented with the necessary fidelity. In any event, the studies in the current analysis provide little information about the social validity or fidelity needed to utilize DTP interventions. However, studies by Olson and Moulton (2004) suggest that these interventions, particularly weighted vests, are socially valid to the occupational therapists who continue to use and advocate for them despite empirical research to the contrary.
Limitations and Future Directions
A number of limitations exist in the current meta-analysis. First, with regard to study quality, CEC’s (2014) guidelines are relatively new, and as such, studies may not have included certain items due to a number of factors (e.g., page limitations) rather than not collecting the information. For example, describing interventionist characteristics, while helpful in determining social validity and issues that may arise within implementation fidelity, is a relatively new requirement and therefore may not have been reported in past studies. Second, a variety of SCD effect sizes were utilized, each with their own unique limitations, so conclusions drawn from them should be done so with caution. Third, the current analysis was limited to dependent variables that had direct implications for the education of students with disabilities and therefore could have overlooked uses in non-educational contexts. Finally, it is possible, though improbable, that these techniques work on a level that is difficult to measure, and thus could provide a calming effect that our measurement systems cannot detect. However, this inability to assess the construct of sensory integration is a central reason why the American Academy of Pediatrics (2012) and American Psychiatric Association (2013) suggested practitioners cease from diagnosing it.
Discussing future research in this area is difficult, as the current review and those previous (e.g., Lang et al., 2012) have found limited efficacy in the use of sensory-based therapies and it seems unlikely that future research will prove otherwise. Indeed, as discussed earlier, the social sciences have a major problem with bias toward publishing only positive results (Maag & Losinski, 2015). Thus, the presence of so many studies with null results without more positive results speaks of the suspect nature of the practices. In sum, the authors agree with Lang et al.’s (2012) statement toward sensory integration therapies in general, that in the context of students with disabilities, DTP falls outside of the IDEA (2004) and NCLB (2001) requirements for peer-reviewed and research-based services.
Footnotes
Declaration of Conflicting Interests
The authors declared no potential conflicts of interest with respect to the research, authorship, and/or publication of this article.
Funding
The authors received no financial support for the research, authorship, and/or publication of this article.
Editor in Charge: Fred Spooner