
Abstract
There is a dearth of research describing the small population of students who have significant cognitive disabilities and are also English learners (ELs). This study expands what is known about this population by describing EL students who participated in Dynamic Learning Maps Alternate Assessments in 16 states during the 2016-2017 year. Data sources include (a) teacher responses to a survey of student characteristics, including items about academic skills, expressive and receptive communication, and classroom setting; (b) accessibility supports used during assessment; (c) students’ alternate assessment results; and (d) student EL services. Results are described for students identified as ELs, likely-ELs, and non-ELs. Analyses identified small but statistically significant group differences in academic and expressive-communication complexity levels, mean receptive-communication scores, instructional setting, and overall performance differences for likely-ELs compared with their peers, indicating a need for further research on instructional and assessment approaches teachers take for addressing these students’ needs.
Keywords
Alternate assessments based on alternate achievement standards (AA-AAS) were devised to include students with the most significant cognitive disabilities in large-scale assessments. Since 2000, states have developed criteria and guidance to help local Individualized Education Program (IEP) teams identify this group of students who have a variety of disability labels and who comprise 1% of students. Within this population is a smaller group: students with the most significant cognitive disabilities who are English learners (ELs). Students with significant cognitive disabilities who are ELs have received more attention since the Every Student Succeeds Act (ESSA; 2016) requirement that states must provide alternate English language proficiency (ELP) assessments for ELs with the most significant cognitive disabilities who cannot participate in the state’s standard ELP assessment even with accommodations. States now face challenges in accurately identifying students with significant cognitive disabilities who are ELs and in understanding the population’s characteristics that may influence instruction and assessment for both language acquisition and academic needs. However, there is a lack of resources for identifying and describing these students. This study draws from census data across multiple states to identify and describe the population of students with significant cognitive disabilities who are ELs.
Background
Historically, ELs and students with disabilities were often treated as separate subpopulations in large-scale academic assessments—for example, in selecting accommodations, evaluating fairness and validity evidence, and reporting accountability. Recent years have seen recognition that students with disabilities and ELs are not mutually exclusive groups. For example, the latest Council of Chief State School Officers’ Accommodations Manual includes a section for students with disabilities who are ELs (Shyyan et al., 2013). Students with disabilities who are ELs is now a third group referenced in ESSA, in addition to students with disabilities and ELs. However, research describing the smaller group of students with significant cognitive disabilities who are ELs is only recently emerging.
Identification
Identification of students with significant cognitive disabilities who are ELs is a complex challenge because it requires evaluation of both parts of the label (Thurlow, Christensen, & Shyyan, 2016). Significant cognitive disability is a label created to define eligibility for AA-AAS and, under ESSA regulations, may not exceed 1% of a state’s population of students who participate in large-scale assessments. According to the National Center for Education Statistics (NCES; 2018), the population of ELs nationwide has increased to approximately 9.5% of the public school population. The Council of Chief State School Officers (2015) estimates this population will grow to 25% by 2025.
The percentage of ELs with disabilities is estimated to be almost 8% of all public school students with disabilities, and it is increasing (National Center on Educational Outcomes, 2011). Estimates of the percentage of students with significant cognitive disabilities who are ELs vary. Students with significant cognitive disabilities who are ELs may be assumed to be a subset of the 1% of students with significant cognitive disabilities, but it is not clear whether the prevalence of dual labels is the same in this subpopulation as in the broader population of ELs with disabilities. Calculating the prevalence in reverse—that 1% of all ELs statewide have significant cognitive disabilities—assumes students with significant cognitive disabilities are fully included in EL services. This is not necessarily the case (Gholson, 2018).
In recent years, there have been efforts to develop common definitions of ELs and students with significant cognitive disabilities. A 2017 review of states’ documentation revealed three common characteristics for identifying students with the most significant cognitive disabilities who are eligible for AA-AAS: low intellectual and adaptive functioning; intensive, individualized instruction and supports; and instruction using an alternate or modified curriculum (Thurlow et al., 2017). A recent federally funded project, Alternate English Language Learning Assessment, proposed a definition of students with significant cognitive disabilities who are ELs: English learners with significant cognitive disabilities are individuals who have one or more disabilities that significantly limit their intellectual functioning and adaptive behavior as documented in their Individualized Education Programs (IEP), and who are progressing toward English language proficiency in speaking, reading, writing, and understanding. (Christensen, Gholson, & Shyyan, 2018, p. 2)
Decisions about assessment eligibility, appropriate accommodations, and services to support language and academic goals are made by IEP teams. There is evidence, however, that these teams struggle to make such decisions for ELs with disabilities (Liu et al., 2013). A 2017 guide (Park, Martinez, & Chou, 2017) provided extensive guidance on identification and IEP development for ELs with disabilities but acknowledged the scope did not extend to students with significant cognitive disabilities who are ELs.
Another challenge to the accurate identification of students with significant cognitive disabilities who are ELs is the data sources used to determine both parts of the classification, particularly the EL component. For example, Ahumada and Williams (2013) reviewed statewide assessment data and discovered discrepancies between the number of students with significant cognitive disabilities enrolled in EL services and the number of students with significant cognitive disabilities whose primary home was not English. Home-language surveys may not adequately reflect current information about student language-learning status or consider students with significant cognitive disabilities (Shyyan, Gholson, & Christensen, 2018). Furthermore, results from locally administered home-language surveys may not be included in state-level database systems for identification purposes. Because students with significant cognitive disabilities who are ELs are often served by special educators in self-contained settings, students’ English language status, or EL service needs, may not be consistently evaluated or well understood (Ahumada & Williams, 2013; Gholson, 2018). Screeners used to determine eligibility for EL services may not produce valid results for students with significant cognitive disabilities (Christensen et al., 2018). Finally, there are challenges to identifying both labels before third grade. Although eligibility for a state’s AA-AAS may be a proxy for identifying a student as having a significant cognitive disability, this label is not typically applied until AA-AAS are required, beginning in third grade. EL assessments begin in kindergarten, however, so the identification of EL status may occur years before the significant cognitive disabilities label is applied.
Student Characteristics and Performance
Most of what is known about students with significant cognitive disabilities who are ELs comes from the last two decades of AA-AAS research and highlights student characteristics that may affect learning and assessment. The most common disability categories among students with significant cognitive disabilities are intellectual disability, autism, and multiple disabilities (Nash, Clark, & Karvonen, 2016; Thurlow, Wu, Quenemoen, & Towles, 2016). Students who take AA-AAS often have communication challenges that are compounded by their disability. In a multistate survey, Kearns, Towles-Reeves, Kleinert, Kleinert, and Thomas (2011) found that 37% to 56% of students independently followed one- or two-step directions and 61% to 79% used symbolic language to communicate. Towles-Reeves, Kearns, Kleinert, and Kleinert (2009) found that 18% to 30% of students with significant cognitive disabilities used augmentative and alternative communication (AAC) devices in addition to or instead of speech. Similarly, a census study of students taking Dynamic Learning Maps (DLM) alternate assessments indicated that 16% used AAC devices for expressive communication (Erickson & Geist, 2016) and 24% did not use spoken words, signs, or symbols to communicate (Nash et al., 2016).
Although these findings provide important insight into the population of students taking AA-AAS, these studies did not evaluate students’ English language status or disentangle disability-related communication and language acquisition needs. For students with significant cognitive disabilities who are ELs, disability-related communication challenges may be exacerbated by learning English as a second (or third) language. Students with significant cognitive disabilities who are ELs are more likely to be served primarily through special education services and may not receive language-related services as part of regular instruction (Gholson, 2018).
Although surveys may provide some insight into relevant student characteristics, less is known about the assessment experiences and outcomes for students with significant cognitive disabilities who are ELs. IEP teams are responsible for identifying appropriate assessment accommodations, but even for the broader population of students with disabilities who are ELs, there are challenges in ensuring that teams have both disability and English language expertise and that they make appropriate accommodation decisions (Liu et al., 2013). Although assessment manuals provide information on accommodations for all students taking AA-AAS (e.g., Arizona Department of Education, 2017; Measured Progress, 2017), we found only one example of accessibility guidance specific to ELs taking alternate assessments (Dynamic Learning Maps Accessibility Manual; dynamiclearningmaps.org). Only one fifth of states report AA-AAS outcomes for the subgroup of ELs (Lazarus, Albus, & Thurlow, 2016), leaving few opportunities to evaluate their outcomes. A study in Arizona compared AA-AAS performance data for students whose home was not English (EL group) with their peers and found the EL group had lower performance than the non-EL group (Ahumada & Williams, 2013).
Purpose
The identification and description of students with significant cognitive disabilities who are ELs has historically been challenging because of small sample sizes and identification constraints. The availability of AA-AAS data across states using DLM assessments allows for pooling sample sizes across states. In 2016-2017, 16 states administered DLM alternate assessments to nearly 90,000 students with significant cognitive disabilities. Several sources of data from that administration are used to identify and describe students with significant cognitive disabilities who are ELs. Research questions include the following:
Method
Sample
This study, conducted with institutional review board (IRB) approval, is based on the population of students who participated in DLM AA-AAS in English language arts (ELA), mathematics, and/or science during the 2016-2017 academic year (n = 89,233). Students take assessments in Grades 3 through 12, across 16 states and a Bureau of Indian Education tribal school. All students who take DLM assessments have been identified by local IEP teams as eligible for the assessment because they meet common eligibility criteria, which include (a) the student has a significant cognitive disability; (b) the student is primarily instructed using alternate content standards; and (c) the student requires extensive, direct, individualized instruction and substantial supports to achieve measureable gains in the grade- and age-appropriate curriculum. Each state provides additional guidance to help IEP teams identify eligible students.
The population of students taking DLM assessments is heterogeneous in nature. Collectively, students assessed in 2016-2017 represented 17 primary disability categories, the most prevalent being intellectual disability (25.6%) and autism (25.2%). Two thirds of students (66.6%) were male and one third (33.4%) were female. The predominant race was Caucasian (62.4%), followed by African American (19.4%), two or more races (9.9%), Asian American (4.4%), American Indian (3.2%), Alaskan Native (0.3%), and Native Hawaiian or Pacific Islander (0.3%). The percentage of students identified as ELs is described in the “Results” section.
Instruments
Data sources for this study include three instruments and EL service data provided upon student enrollment for the DLM AA-AAS.
First Contact survey
Information about student characteristics comes from the First Contact survey, which teachers complete or update online each year before administering DLM assessments (Nash et al., 2016). The survey includes sections on the student’s academic skills, expressive and receptive communication, and other topics, such as instructional setting and sensory capabilities. Survey items are ordinal forced-choice format based on behavioral descriptions (e.g., “Choose the highest statement that describes the student’s expressive communication”) or ranges that contain the percentage of time a student uses a skill (e.g., “Responds to single words that are spoken or signed”). Teachers indicate the response option most closely describing the student. Three other First Contact survey items are adapted from the home-language survey. The home-language survey is a common screening tool used in general education to identify students who may need to be further evaluated for EL status (Linquanti & Bailey, 2014). The teacher indicates whether English is (a) the primary language for the student, (b) used in the student’s home, and (c) used for instruction. First Contact English language items are used for operational research purposes and do not lead to a student’s classification as an EL.
The DLM assessment system uses a subset of the academic and expressive-communication items to calculate subject-specific complexity levels (i.e., Foundational, 1, 2, 3), which assign students to assessments that vary in complexity relative to grade-level expectations. Algorithms are used to translate survey responses to the four complexity levels in ELA, mathematics, science, and expressive communication. Content and special education experts selected items for inclusion in the algorithms and the use of the algorithms to assign students to assessments was statistically evaluated during pilot testing for the DLM assessment system (Clark, Kingston, Templin, & Pardos, 2014). For instance, the ELA complexity-level algorithm draws from items about a student’s frequency of symbol recognition and overall reading level, along with the student’s highest level of expressive communication, regardless of the communication mode.
Access Profile
Before administering the DLM AA-AAS, teachers indicate on each student’s Access Profile—the accessibility supports needed during administration; teachers are trained to select appropriate supports. Sixteen available supports are organized within three categories to support teachers’ decision-making: system-delivered supports (e.g., audio read aloud, magnification), additional tools and materials (e.g., calculator, switch system), and supports used outside the system (e.g., human read aloud, language translation).
Alternate assessments
Student performance is defined in this study as the student’s results on the DLM AA-AAS. Results include the student’s performance level (i.e., emerging, approaching the target, at target, advanced) in each subject (i.e., ELA, mathematics, science). Performance levels are determined by student mastery of the skills measured by the assessment (Clark, Nash, Karvonen, & Kingston, 2017). Extensive evidence of the technical quality of the DLM AA-AAS is provided in technical manuals (DLM Consortium, 2016, 2017a, 2017b).
EL service data
When a student is enrolled for the DLM AA-AAS, the enrollment record includes the student’s status with regard to EL services. Response options include six categories of EL services or eligibility and an option to indicate the student is not eligible or monitored. Options include (a) Title III funded, (b) state English for Speakers of Other Languages (ESOL)/bilingual funded, (c) both Title III and state ESOL/bilingual funded, (d) monitored ESOL student, (e) eligible for ESOL program based on an ELP test but not currently receiving ESOL program services, and (f) receives ESOL services and not funded with Title III and/or state ESOL funding.
Data Collection
EL service data were provided upon enrollment into the DLM online system. After enrollment, teachers complete the First Contact survey. The First Contact survey was completed for 98,937 students in 2016-2017. Because participating states have different policies regarding survey completion, only certain items require responses. Rates of missing data were low for required items (e.g., less than 0.1% for “Does the student use speech to meet expressive-communication needs”) and somewhat higher for optional items that do not apply to every student (e.g., 30.6% for “Is English the primary language used for instruction”). Furthermore, because the First Contact survey is completed before assessments are administered and participating states have differing data-management practices related to how students are ultimately assigned assessments, fewer final assessment results are available than completed First Contact surveys. Matched data for First Contact surveys, DLM AA-AAS results, and EL service data were available for 89,223 students. For 78,116 of those students, teachers selected accessibility options in the Access Profile.
Data Analysis
Responses to the six receptive-communication items from the First Contact survey (Nash et al., 2016) were scaled to provide an overall index of receptive communication (α = .96). The items, developed by special education experts and pilot tested before operational use, asked teachers to indicate the frequency students demonstrated receptive-communication behaviors ranging from 1 (almost never; 0%-20% of the time) to 4 (consistently; 80%-100% of the time). Summed ratings across items produced receptive-communication index values ranging from 6 to 24 (M = 18.3, SD = 5.7).
All four data sources were merged for analysis. All available data for each question were included in analysis, so the sample size varies across analyses. Frequency distributions were calculated for categorical variables across all research questions. For Research Question 2 (i.e., comparison of characteristics), chi square analyses were conducted to evaluate complexity band and performance-level differences. A Kruskal–Wallis one-way ANOVA on ranks was conducted to evaluate instructional setting differences. Because the F test is robust to violations of normality (Keppel & Wickens, 2004), an one-way ANOVA was conducted to evaluate group differences on the receptive-communication scale. For Research Question 3 (i.e., assessment outcomes), an ordinal logistic regression analysis was performed for each subject to assess performance-level differences by language group after adjusting for expressive-communication complexity. Expressive communication was a significant predictor of performance during the DLM pilot administration (Clark et al., 2014) and served as a proxy for severity of disability when addressing Research Question 3. We first evaluated the data for evidence of multicollinearity; variance inflation factors all rounded to 1.0 and correlation matrix values for predictors ranged from .01 to .07 indicating variables were not highly correlated.
Results
Identification of ELs
The EL services variable and First Contact survey responses identified potential students with significant cognitive disabilities who are ELs. According to responses to the EL services item, most students (n = 83,992, 94.1%) were neither eligible nor monitored for services. A total of 4,850 students (5.4%) were receiving services and 322 (0.3%) were eligible or monitored for EL services but not served. Very few students (n = 51, 0.1%) were missing data.
For the three First Contact survey items related to home language (see Table 1), teachers indicated that 9.9% of students used a language other than English as the primary spoken language in the home. For 5.0% of students, teachers indicated students’ primary language was a language other than English. Teachers reported only 0.5% of students receive instruction in a language other than English.
Teacher Response to Primary-Language Items (N = 98,937).
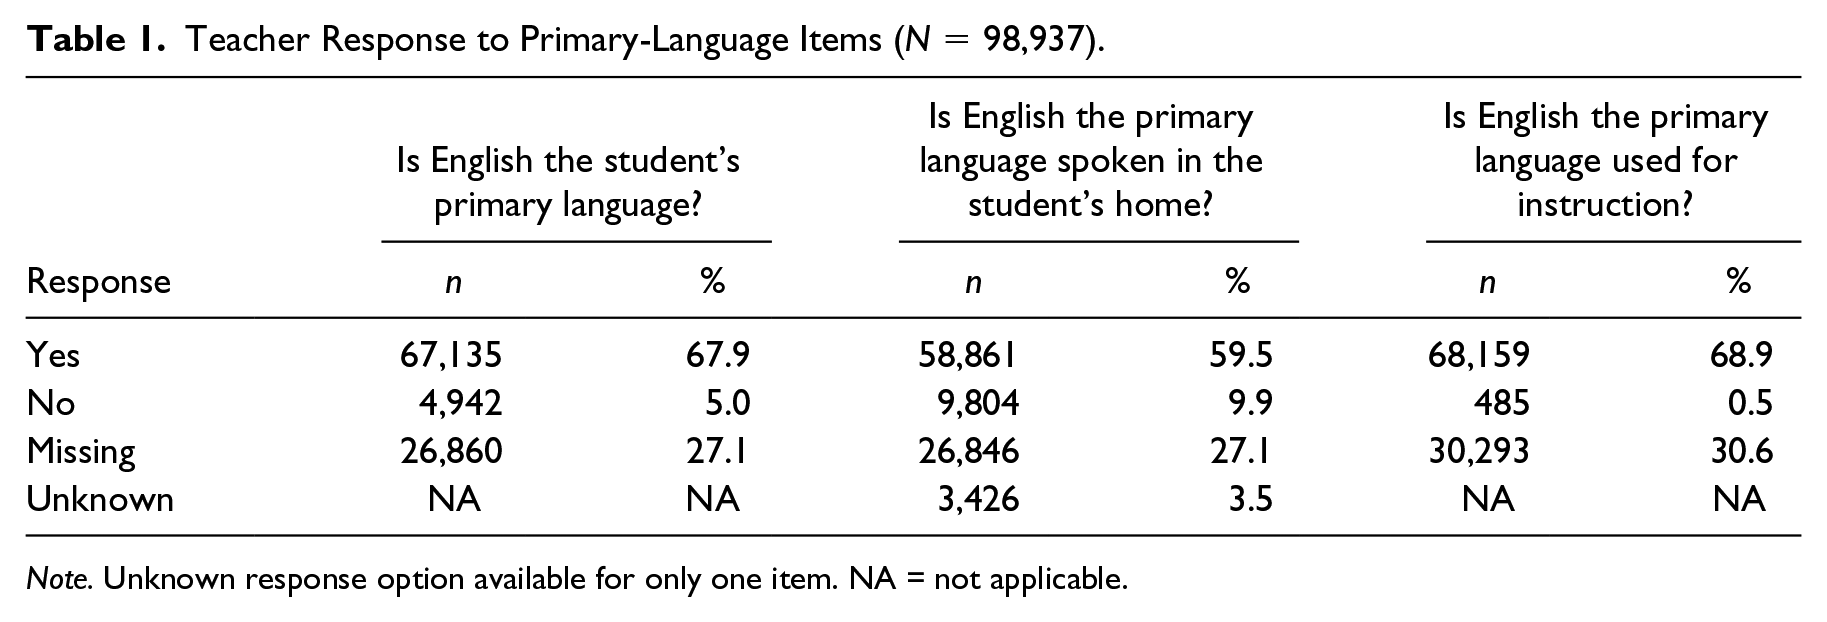
Note. Unknown response option available for only one item. NA=not applicable.
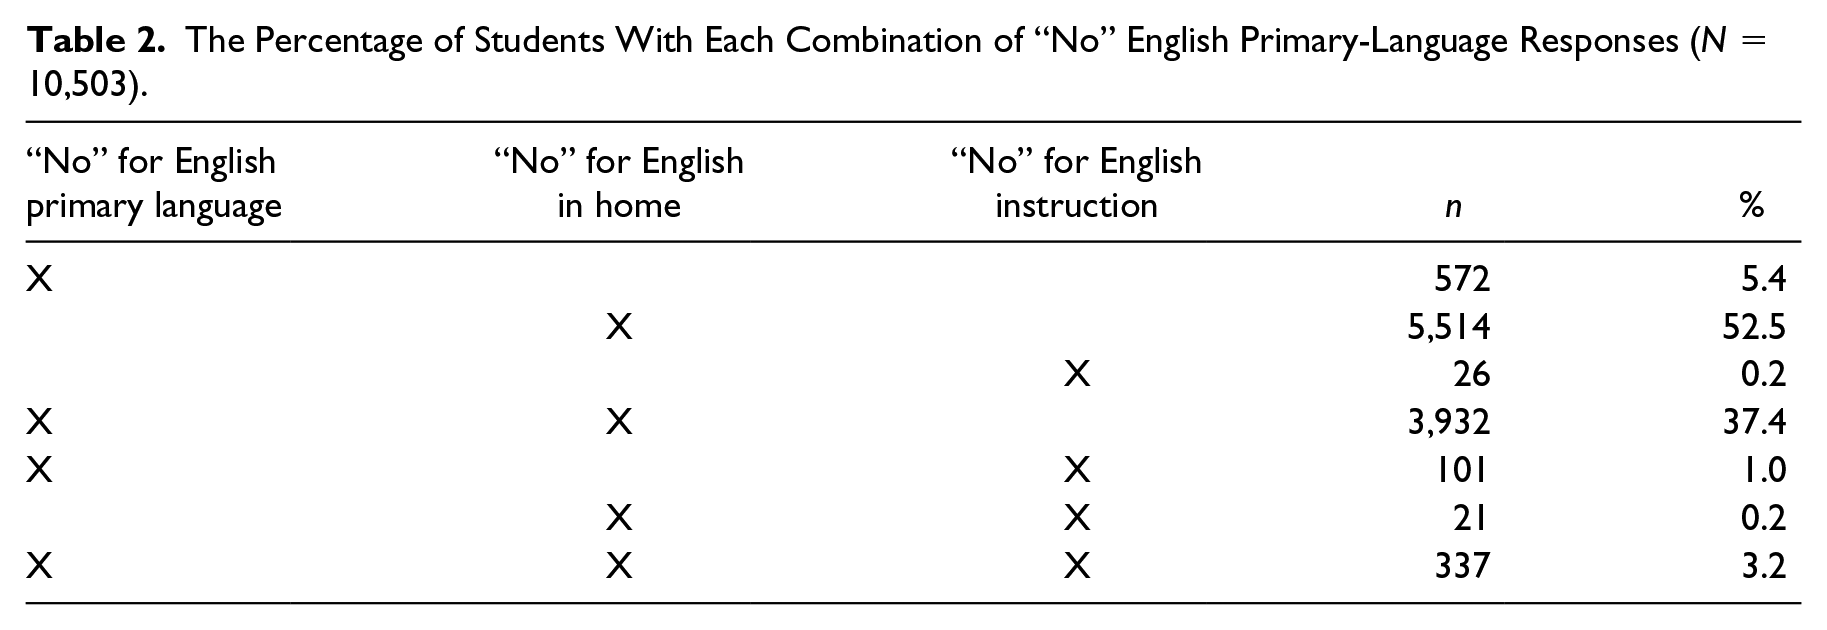
The relationship among responses to the three primary-language items was evaluated for students who had at least one non-English response (n = 10,503). Results are summarized in Table 2. Most students (58.1%) had only one non-English response across the three items, most commonly the language spoken in the home. More than one third (37.4%) of students reportedly used a language other than English as both their primary language and their home language. In only 3.2% of the cases did teachers report that a language other than English was the student’s primary language, language spoken in the home, and language of instruction.
The Percentage of Students With Each Combination of “No” English Primary-Language Responses (N = 10,503).
The results presented above could lead to different estimates of the prevalence of students with significant cognitive disabilities who are ELs depending on the variables used for that definition. We next examined the percentage of students within each primary-language variable receiving EL services. Less than half of students identified by each non-English primary-language item also received EL services. About one third of students who were identified as not having English as his or her primary language participated in EL services (34.8%, n = 1,718, n = 4,942), and a smaller percentage of students who were identified as having English not be the primary language spoken in his or her home participated in EL services (30.6%, n = 3,001, n = 9,804). Nearly half of students who were identified as having English not be the primary language used for his or her instruction participated in EL services (46.6%, n = 226, n = 485).
Because of (a) the differences in response patterns for the First Contact primary-language items, (b) the likelihood that students receiving EL services were a subset of the ELs who took DLM assessments, and (c) the desire to learn more about a population that is likely to be underidentified and underserved, we identified three student groups for the remainder of this study: (a) ELs, who received services or were monitored; (b) likely-ELs, whose teachers indicated a “no” response to any of the First Contact primary-language items but who did not receive services; and (c) non-ELs, who received no EL services and had English as the primary language for all First Contact items. The percentage of ELs and likely-ELs in the DLM assessment population ranged by state from 0.0% to 21.2% (see Table 3), and there were slightly more likely-ELs (8.1%) than ELs (5.8%).
The Percentage of Students Identified in Each Subgroup, Total, and by State (N = 85,210).
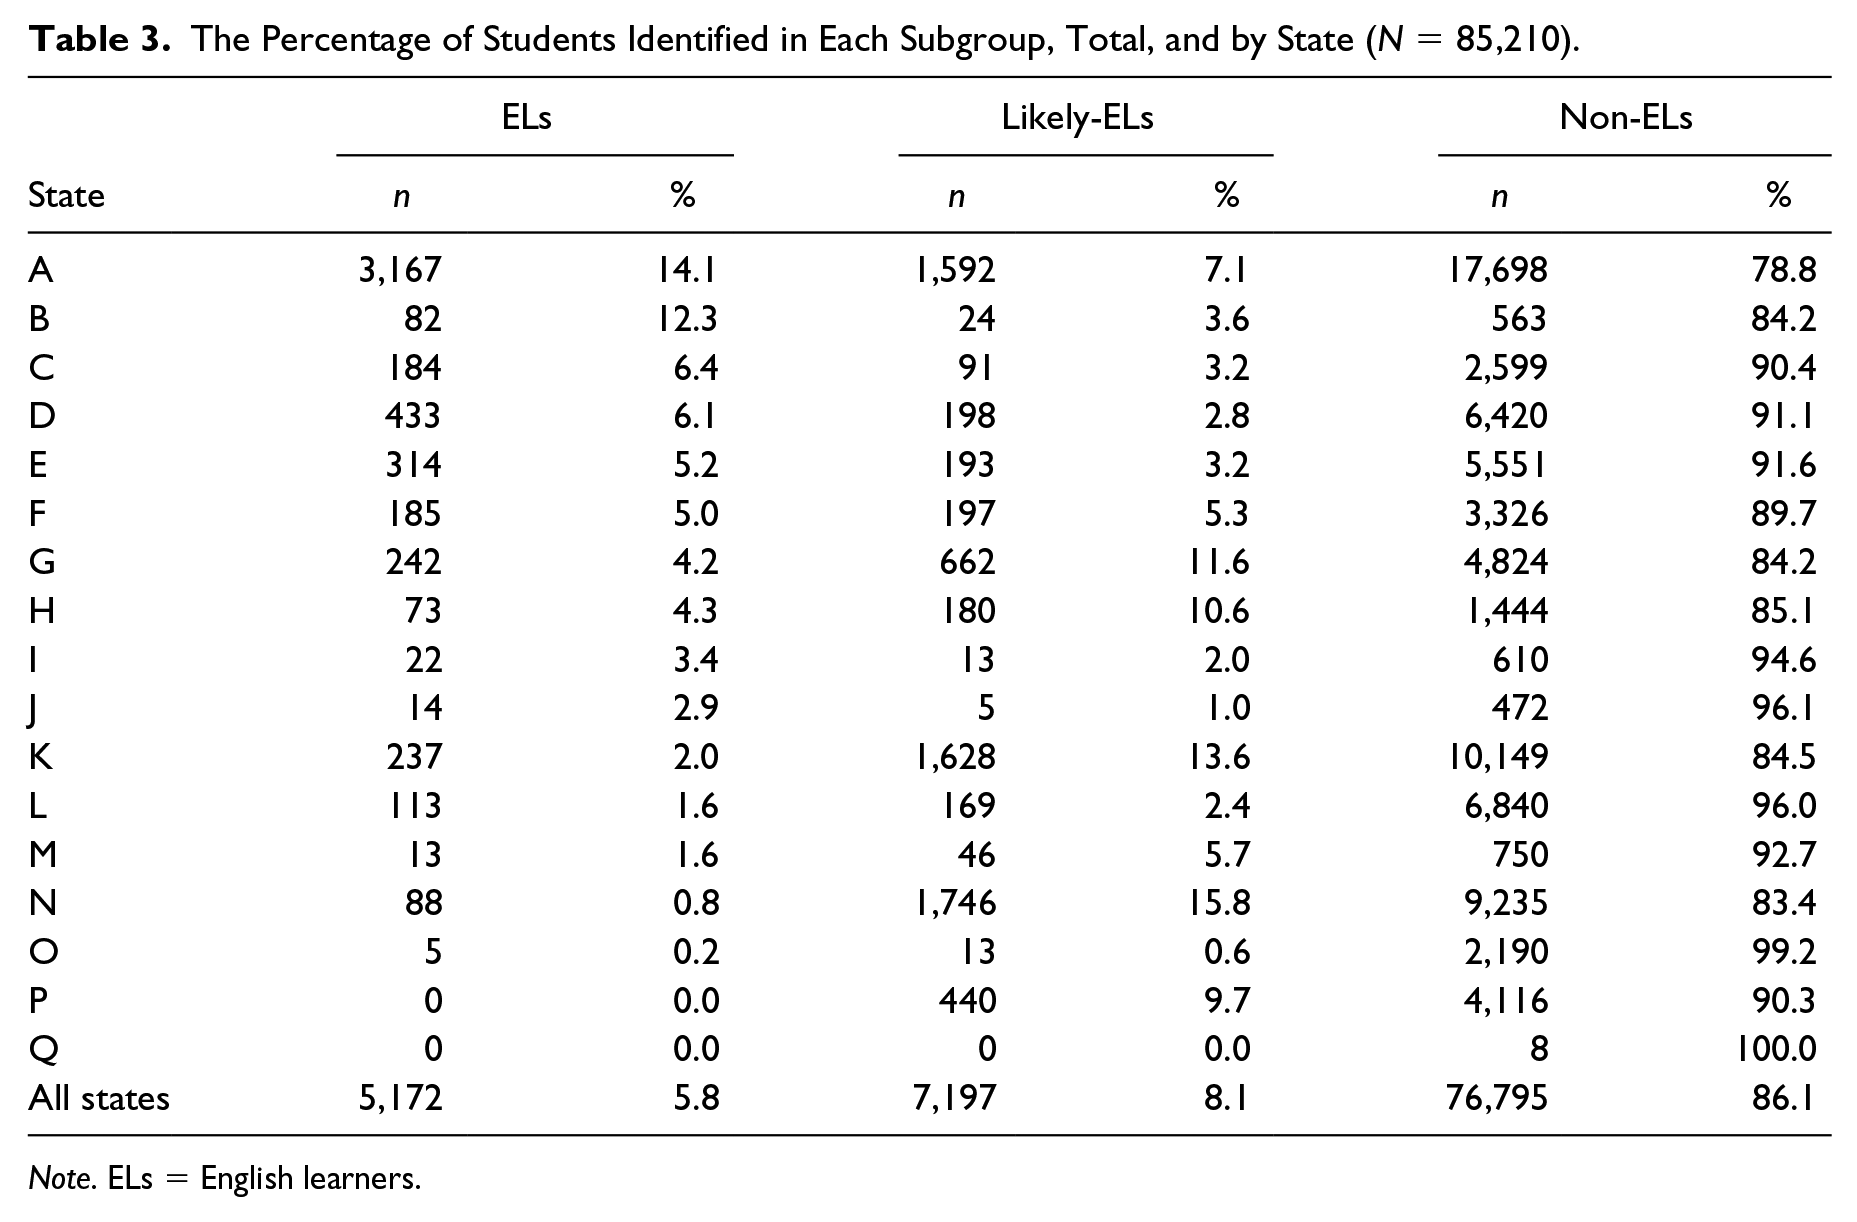
Note. ELs = English learners.
Student Characteristics
Results for the second research question regarding student characteristics are based on responses to the First Contact survey questions about academics, expressive and receptive communication, and instructional setting. Complexity levels were collected for ELA, mathematics, science, and expressive communication. Table 4 summarizes the percentage of students classified to each complexity level by group. Across all subjects and expressive communication, the distribution of students across language groups tended to be similar: smaller proportions of students at the highest and lowest complexity levels and larger proportions of students in the middle two levels. However, there tended to be more likely-ELs in the lowest level and fewer students in the highest level, compared with ELs and non-ELs. Results were statistically significant with minimal effect size values.
Distribution of Students Across Complexity Levels for Each Subject.
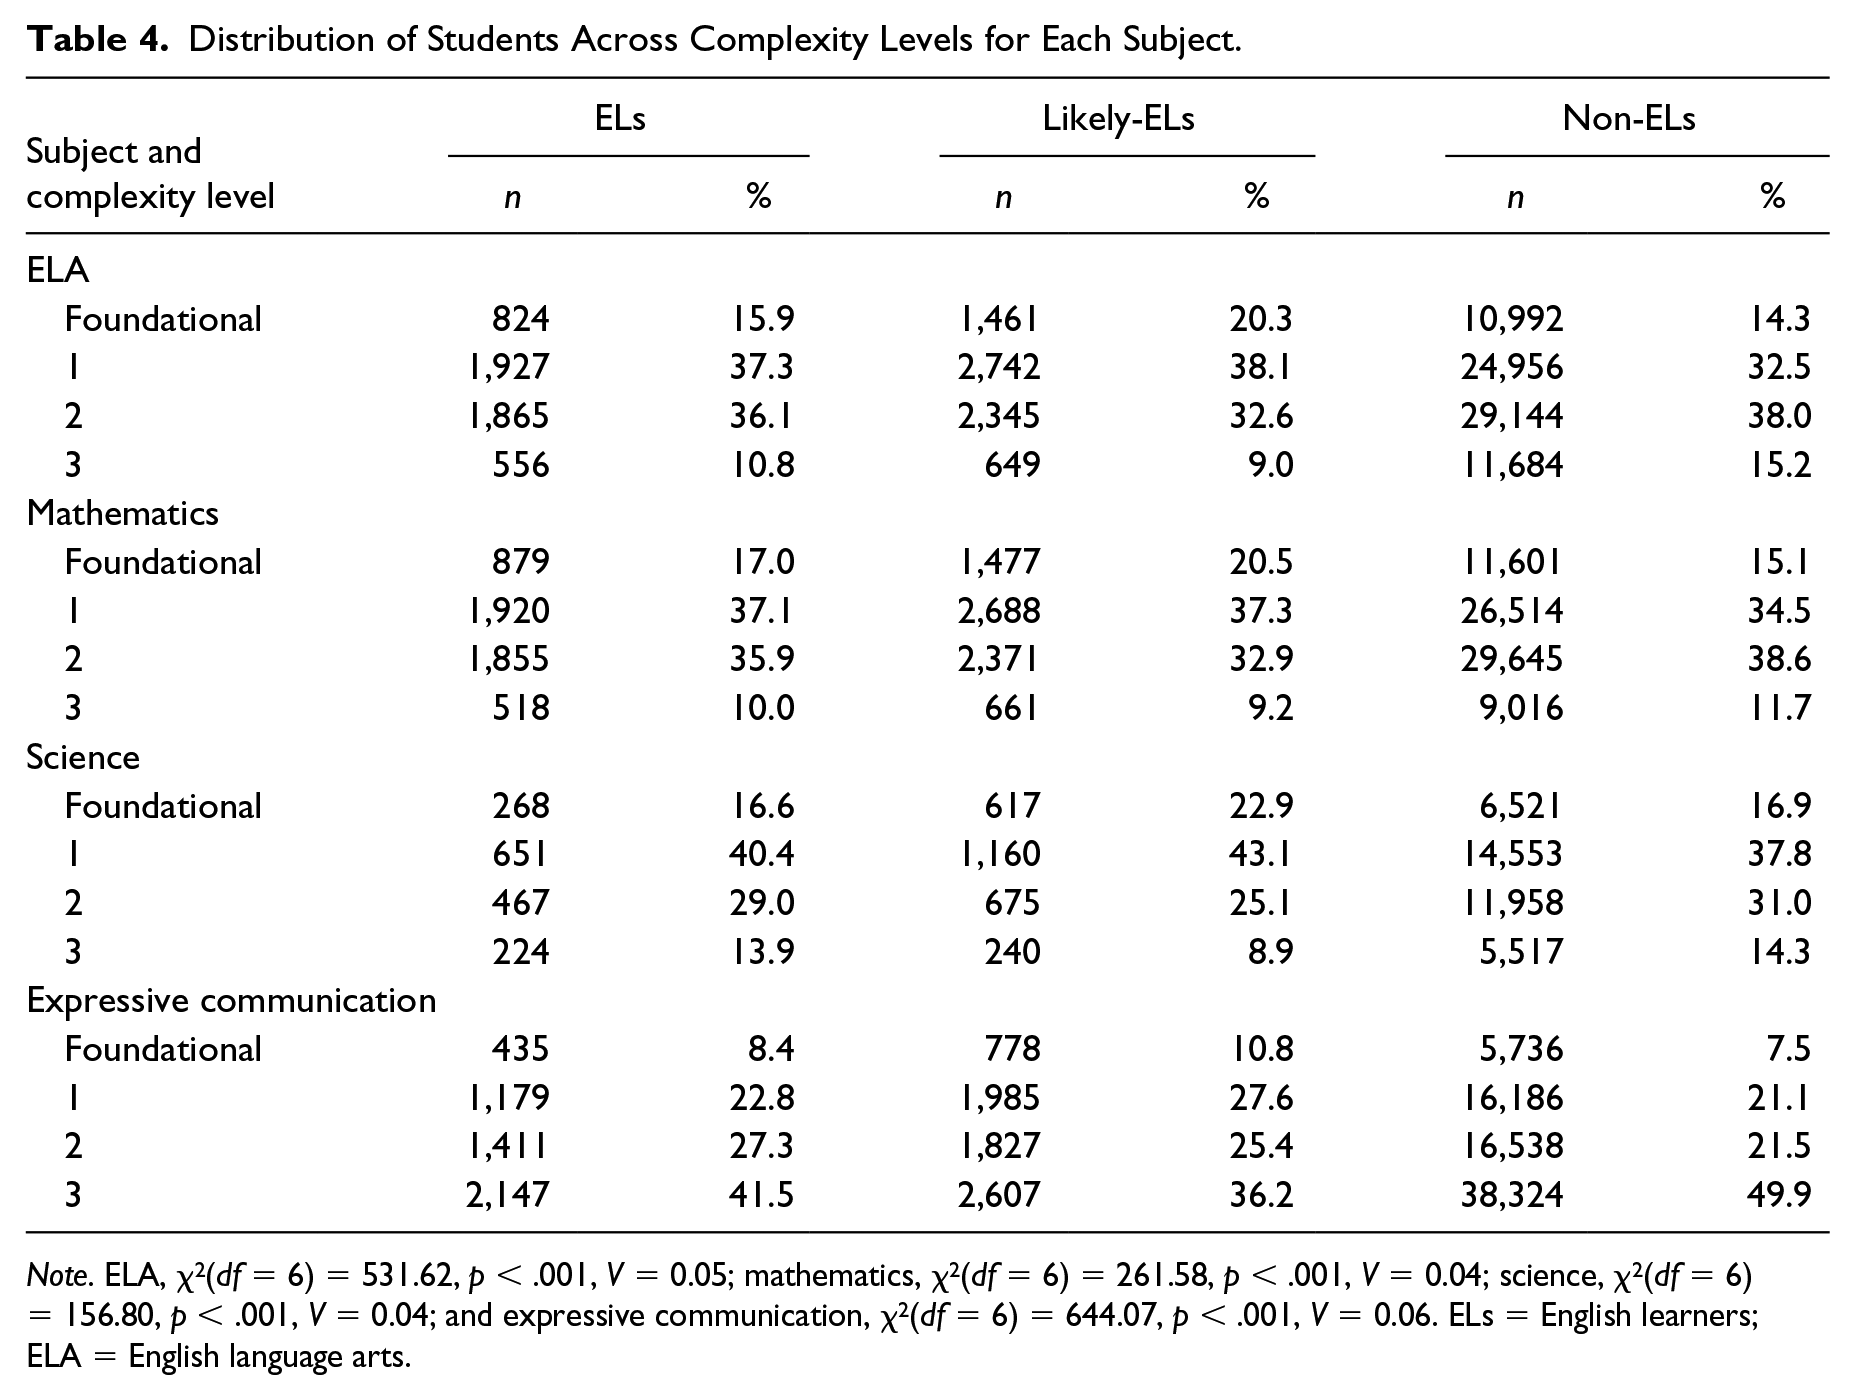
Note. ELA, χ2(df = 6) = 531.62, p < .001, V = 0.05; mathematics, χ2(df = 6) = 261.58, p < .001, V = 0.04; science, χ2(df = 6) = 156.80, p < .001, V = 0.04; and expressive communication, χ2(df = 6) = 644.07, p < .001, V = 0.06. ELs = English learners; ELA = English language arts.
The most pronounced difference across student groups was observed for the highest complexity level of expressive communication (i.e., just 36.2% of likely-ELs, compared with 41.5% of ELs and 49.9% of non-ELs). To evaluate group differences in expressive communication, responses to specific expressive-communication items on the First Contact survey are summarized in Table 5. Fewer ELs (51.8%) and likely-ELs (50.8%) than non-ELs (63.8%) regularly combined three or more words, signs, or symbols when communicating. ELs and likely-ELs tended to choose from fewer symbols when communicating than their non-EL peers (e.g., 19.3% of non-ELs chose from 10 or more symbols compared with 15.4% of ELs and 13.6 of likely-ELs).
Responses to Expressive-Communication Items.
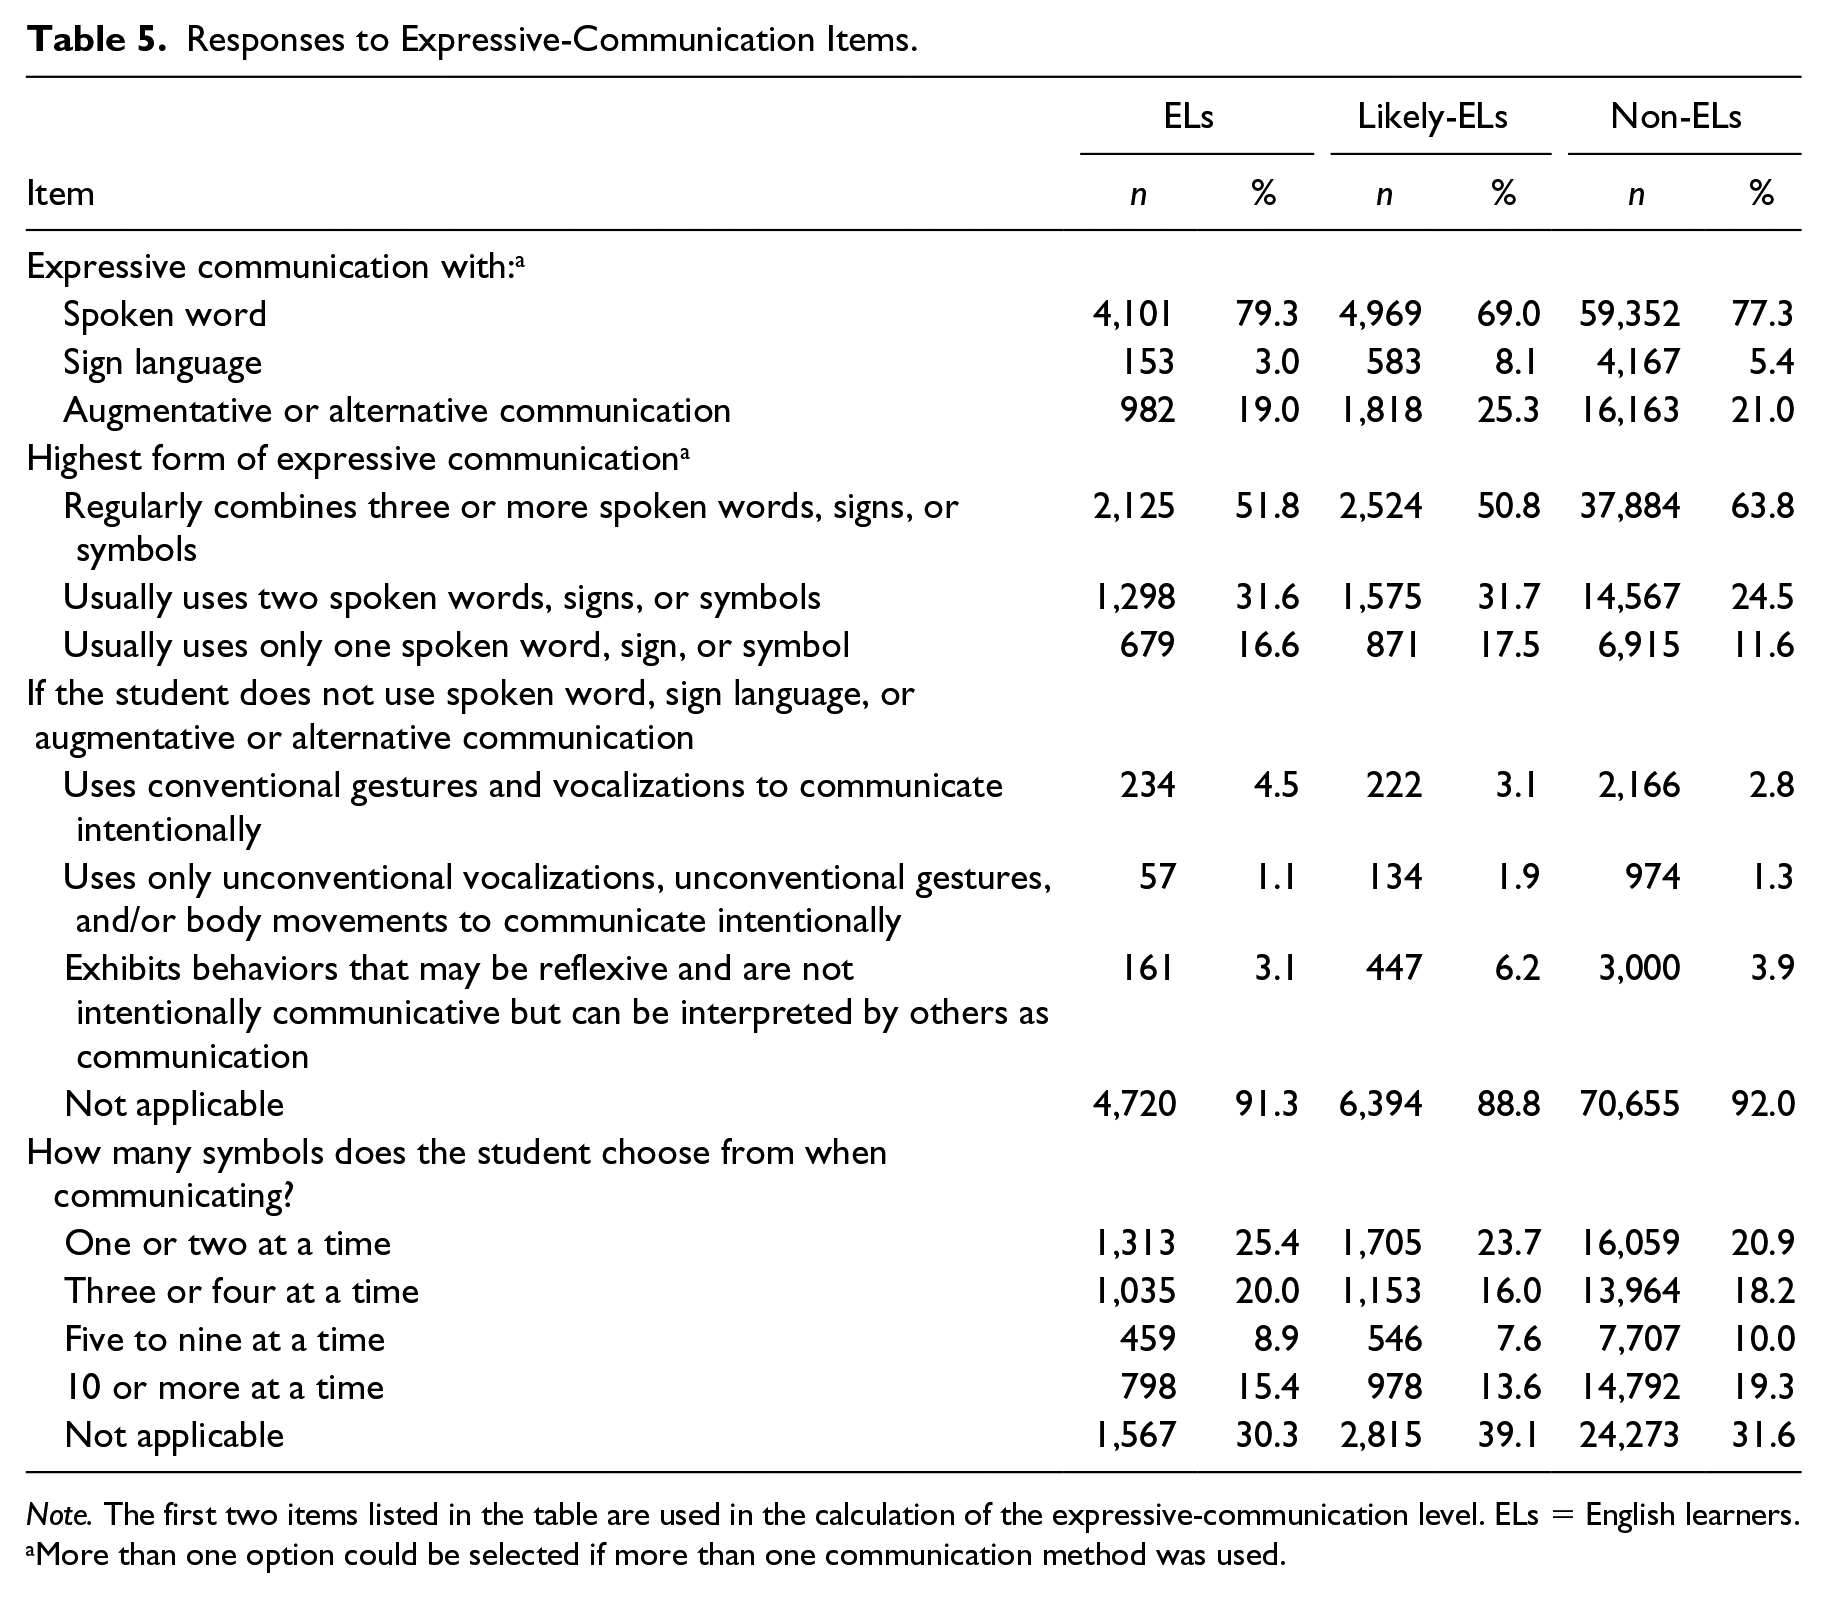
Note. The first two items listed in the table are used in the calculation of the expressive-communication level. ELs = English learners.
More than one option could be selected if more than one communication method was used.
The First Contact survey also collects teacher responses regarding students’ receptive-communication skills. Responses to the receptive-communication items by language group are summarized in Table 6. Across all items, likely-ELs less frequently exhibited receptive-communication skills than their peers. When summed into an overall receptive-communication index ranging from 6 to 24, means were significantly different among ELs (M = 18.0, SD = 5.67), likely-ELs (M = 17.2, SD = 5.98), and non-ELs (M = 18.4, SD = 5.65), F(2, 87,259) = 157.24, p < .001. Tukey’s post hoc tests indicated all three groups were statistically significantly different from one another (p < .001) but the minimal effect size (ω2 = 0.004) indicates language group alone does not explain substantial variance in students’ receptive communication.
Responses to Receptive-Communication Items.
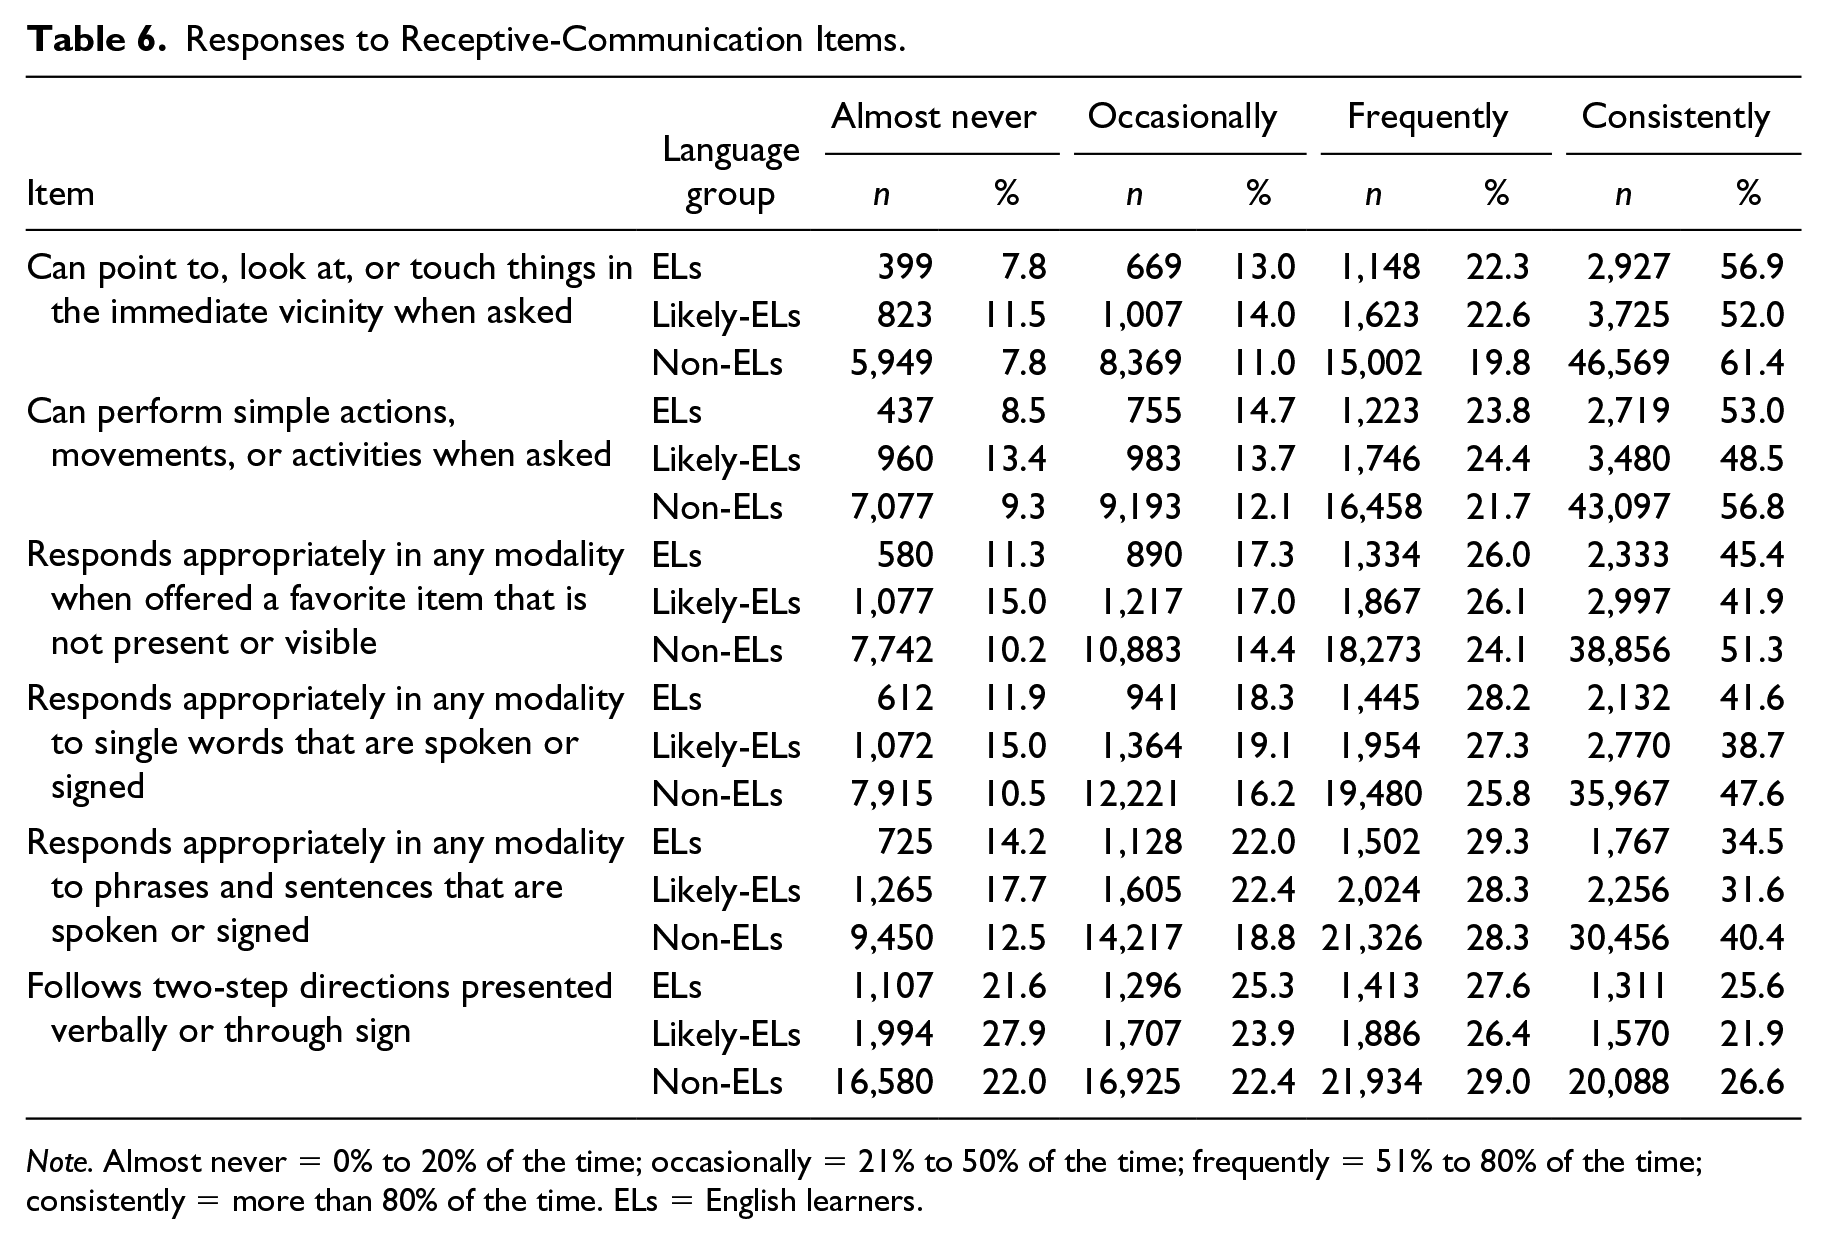
Note. Almost never = 0% to 20% of the time; occasionally = 21% to 50% of the time; frequently = 51% to 80% of the time; consistently = more than 80% of the time. ELs = English learners.
Students’ instructional setting is summarized in Table 7 by language group. There were statistically significant differences in instructional setting. Likely-ELs tended to spend less time than their peers in a regular classroom each day, whereas more ELs (39.5%) than non-ELs (25.7%) or likely-ELs (23.3%) attended a separate school.
Percent of Students Served in Each Instructional Setting (N = 85,364).
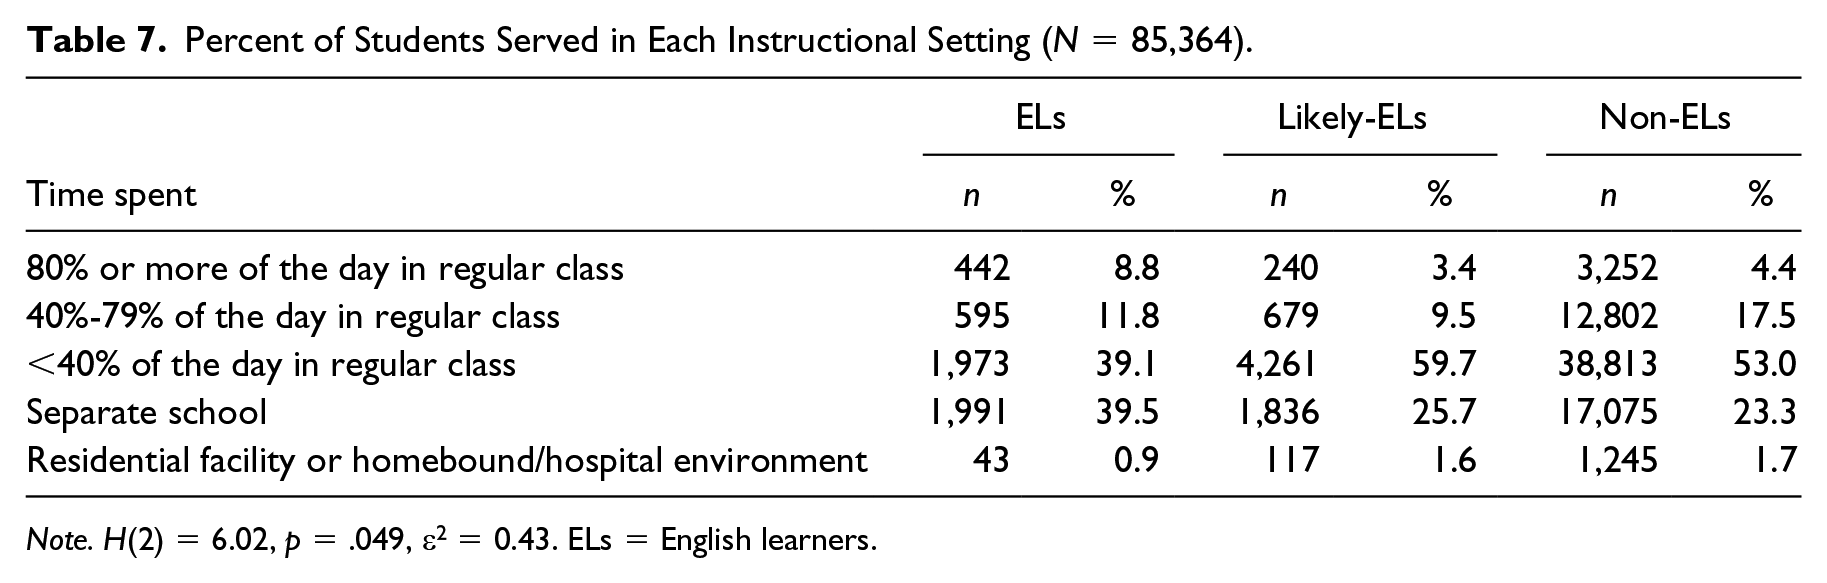
Note. H(2) = 6.02, p = .049, ε2 = 0.43. ELs = English learners.
Accessibility Supports and Assessment Outcomes
Results for the third research question about students’ accessibility supports and assessment outcomes are summarized in Tables 8 through 10. Accessibility supports across language groups (Table 8) tended to be similar, indicating teachers generally do not select different supports for ELs or likely-ELs than for non-ELs. The support intended for use with ELs—language translation—was reportedly used with 10.4% of ELs and 5.6% of likely-ELs and 0.8% of non-ELs.
Accessibility Supports by Language Group (N = 78,116).
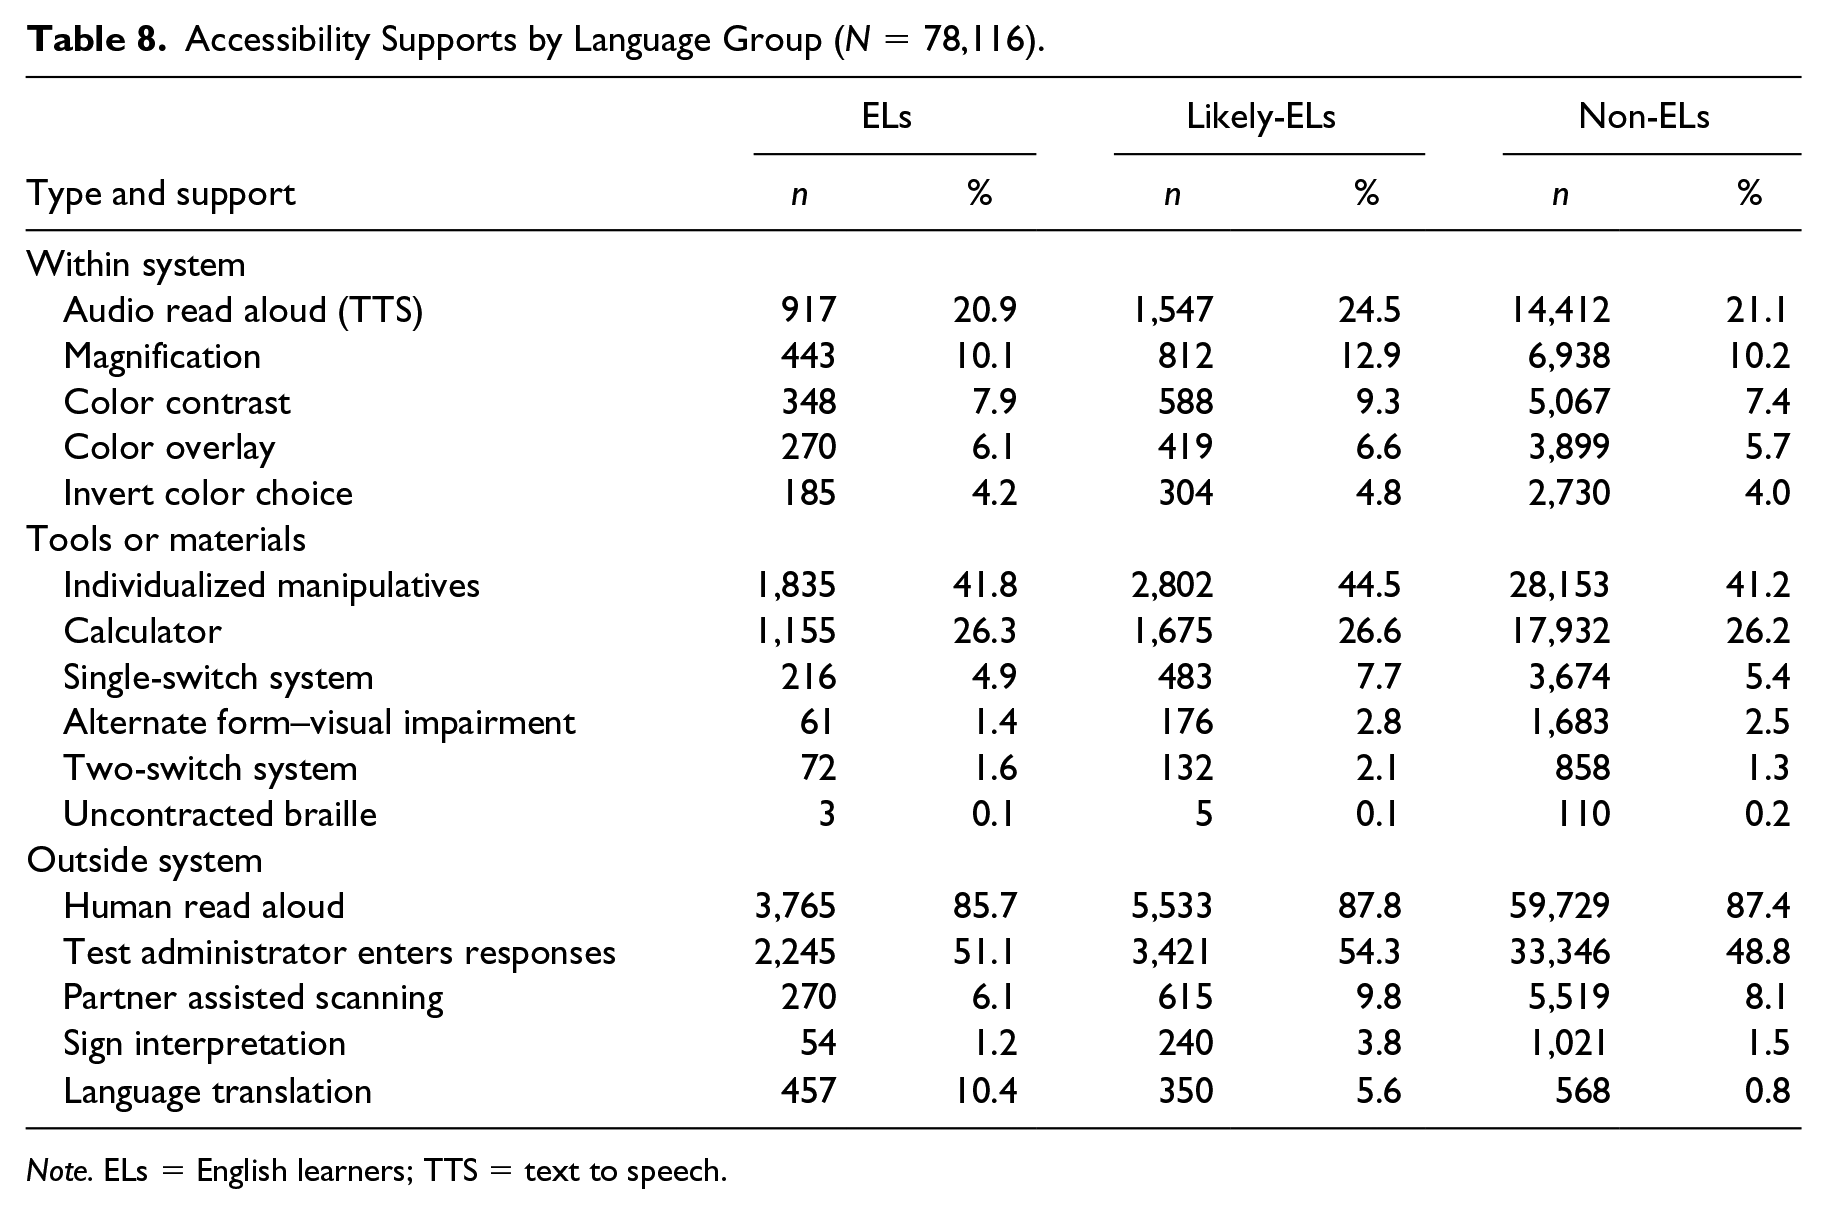
Note. ELs = English learners; TTS = text to speech.
Subject-Specific Performance Levels by Language Group.
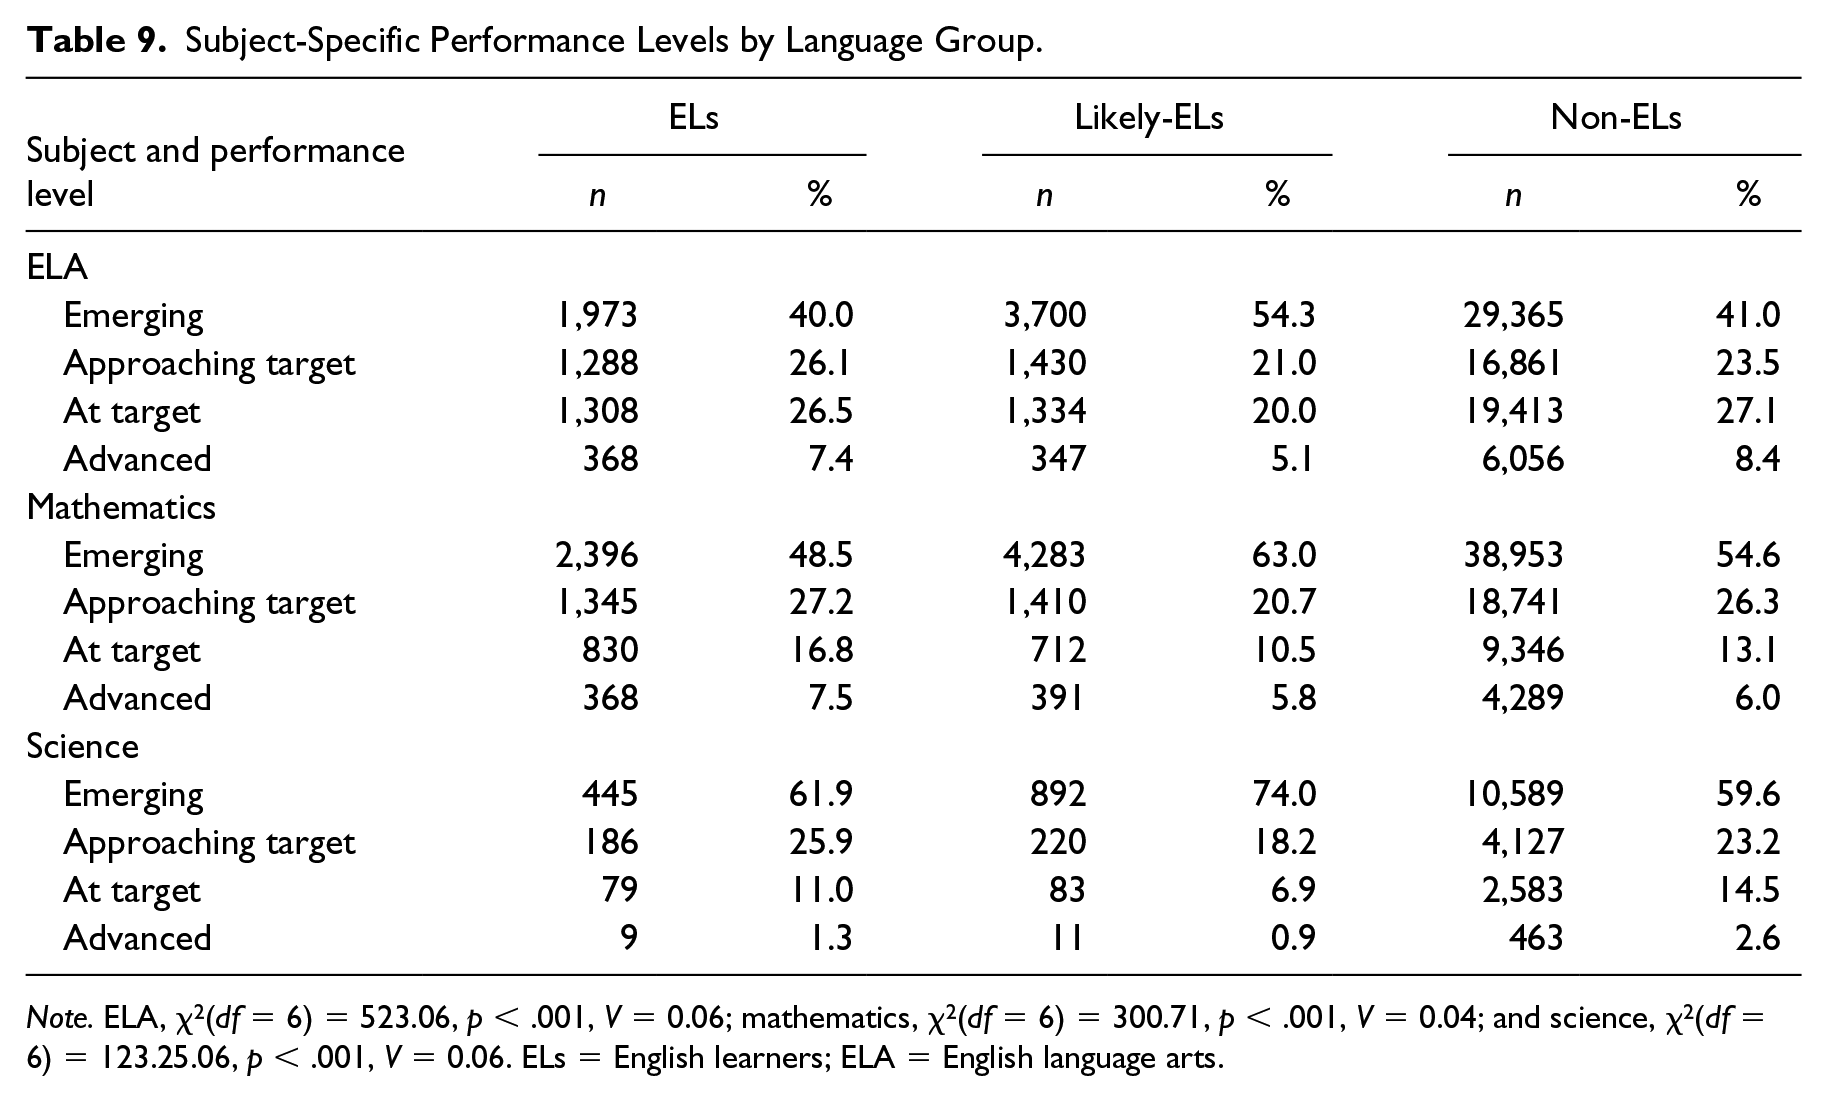
Note. ELA, χ2(df = 6) = 523.06, p < .001, V = 0.06; mathematics, χ2(df = 6) = 300.71, p < .001, V = 0.04; and science, χ2(df = 6) = 123.25.06, p < .001, V = 0.06. ELs = English learners; ELA = English language arts.
Ordinal Logistic Regression Analysis of Performance Level as a Function of Language Group After Controlling for Expressive-Communication Complexity.
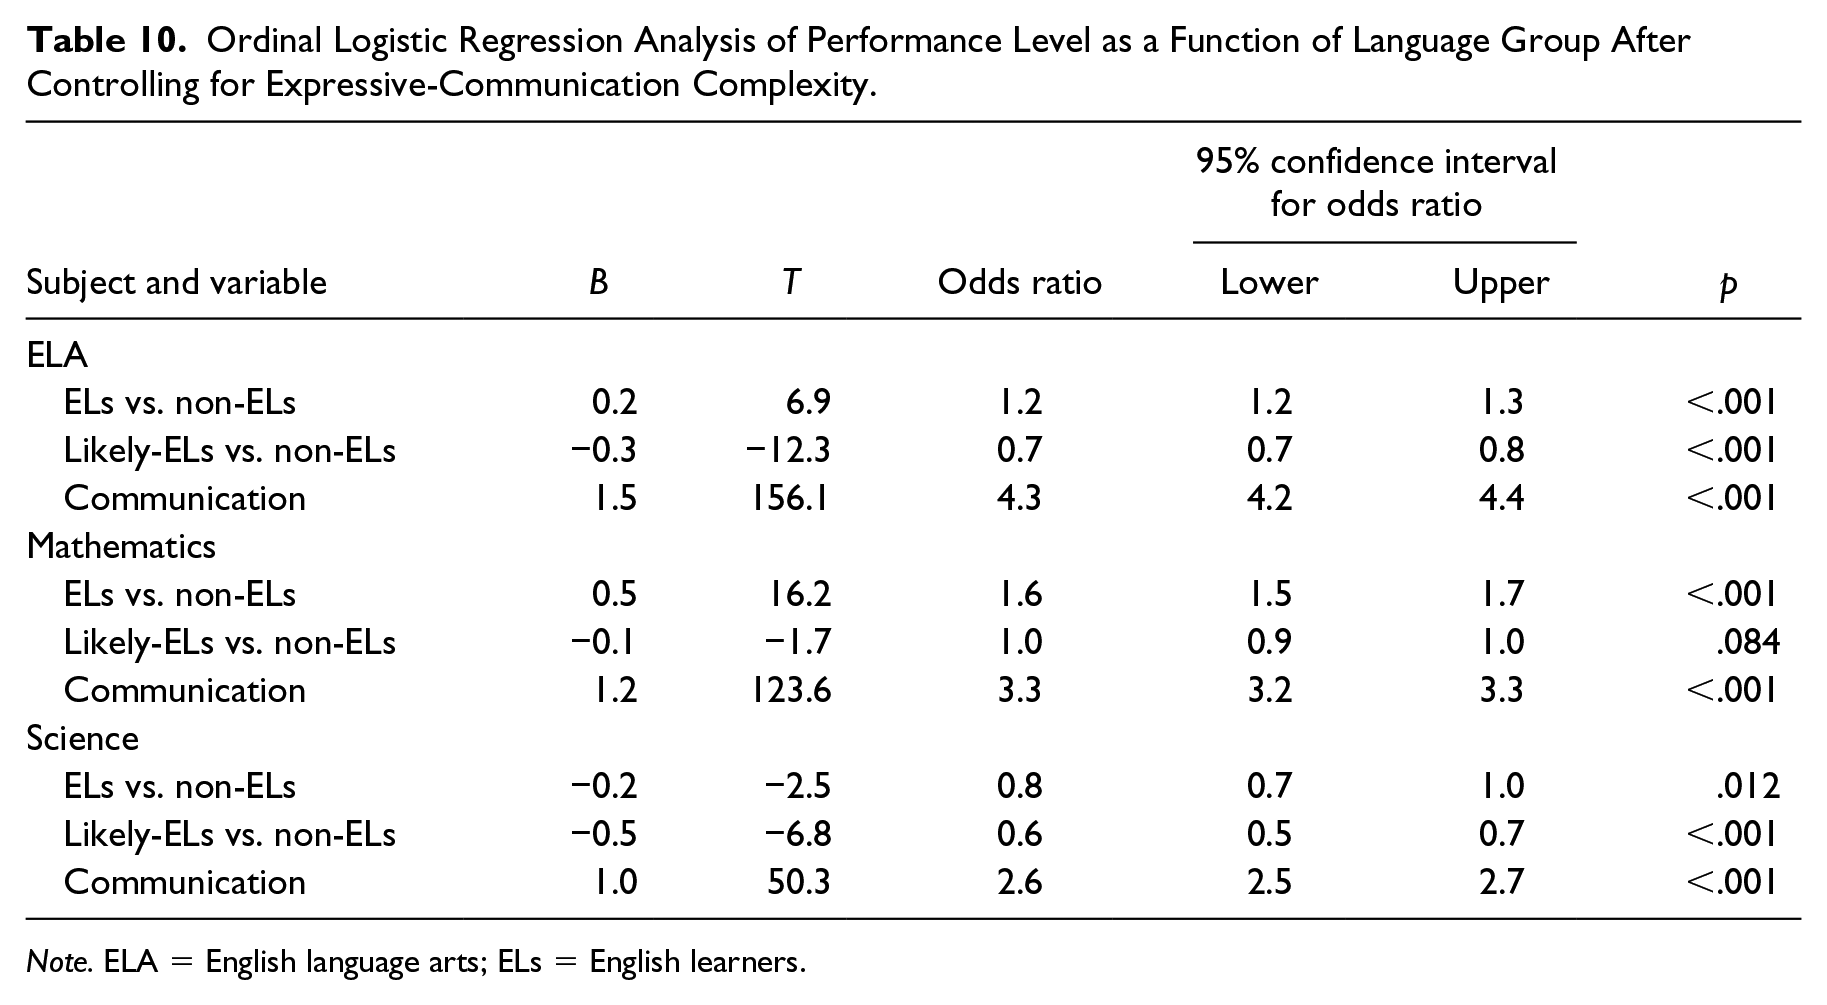
Note. ELA = English language arts; ELs = English learners.
Table 9 summarizes students’ performance-level achievement. In all three subjects, the distribution of assessment performance for likely-ELs was lower than for ELs or non-ELs. Similar to the findings for complexity level, group differences were statistically significant with minimal effect size. Performance distributions for ELs and non-ELs were similar, and likely-ELs’ performance was slightly lower. Table 10 shows the ordinal logistic regression coefficients and significance tests, as well as odds ratios and the 95% confidence intervals around odds ratios. Non-ELs were the focal group for the regression analysis. All predictors were statistically significant in ELA, χ2(6) = 34,425.4, p < .001, Nagelkerke pseudo R2 = .37, and science, χ2(6) = 3,419.5, p < .001, Nagelkerke pseudo R2 = .25. All predictors but likely-EL versus non-EL were statistically significant in mathematics, χ2(6) = 21,036.6, p < .001, Nagelkerke pseudo R2 = .18. For example, after adjusting for expressive-communication complexity band, ELs were 1.2 times more likely than non-ELs to achieve at a higher performance level in ELA. Expressive communication was the strongest predictor of students’ DLM AA-AAS performance level.
Discussion
The ultimate purpose of this study was to identify characteristics of the small subpopulation of students with significant cognitive disabilities who are ELs. The discrepancies between prevalence estimates based on EL service data and teacher-reported primary language highlight one of the first barriers to serving this group. The EL services variable, which is often information housed in statewide data warehouses, classifies about 6% of the DLM population of students with significant cognitive disabilities as ELs. This estimate is lower than the 8% of public school students who are ELs with disabilities (National Center on Educational Outcomes, 2011) and the 10.5% of students with IEPs who are indicated to be limited English proficient (U.S. Department of Education, 2016). This comparison suggests students with significant cognitive disabilities who are ELs may be underidentified. To address this challenge, the First Contact survey items, completed by teachers, may signify a need for further EL screening. On the surface, the 6% of students eligible for or receiving services appears reasonable, given the 5% of students whose primary language was not English and the 10% of students for whom English was not the primary language spoken at home. However, less than half of students identified on the primary-language survey item were actually eligible for or receiving services. It is not known whether this gap is due to limited EL screening practices or potential false negative findings at the classification stage (Linquanti, Cook, Bailey, & MacDonald, 2016). We created the likely-EL group to learn more about students who are potentially ELs but have not been identified for services. In some states, the likely-EL group was smaller than the EL group, but in other states, it was substantially larger, suggesting state and local policies and practices regarding EL identification vary considerably for this population (Park et al., 2017). The slight group differences in instructional settings, with likely-ELs served in more restrictive settings but a sizable portion of ELs served in separate schools, may also signal different decision-making processes in different settings. If separate schools do not have staff with expertise in English language acquisition, it could be harder to ensure identification and service planning include collaboration across different perspectives (Park et al., 2017).
This study identified language-group differences that may be relevant for instruction and assessment, specifically in areas of expressive and receptive communication. Collectively, these findings suggest that limited communication may mask language acquisition support needs for some students, while students with more complex expressive communication are more likely to receive EL services or to be correctly identified as non-ELs. These findings may be related to common misconceptions about students with significant cognitive disabilities who are ELs, such as the relationships between expressive and receptive communication, and the added complexity of learning to communicate when exposed to multiple languages (Huff & Christensen, 2018).
Despite the slight group differences identified in communication and prior academic skills, the rates of use for accessibility supports were similar across language groups, especially for supports often related to disabilities, and differed in expected ways based on teacher report of AAC device use for expressive communication. Language translation was a support for 10.4% of ELs, 5.6% of likely-ELs, and 0.8% of non-ELs (the latter presumably reflecting a misunderstanding of that support). Low rates of use of language translation may be due to state policies or local practices. For example, language translation is not selected in participating states that have policies prohibiting language translation during high-stakes assessment. Even if allowed by state policy, a teacher may not choose the support due to recommended best practice such as only using supports during assessment that are also used during instruction. Or, the teacher may lack sufficient knowledge of the student’s primary language to provide the language translation support, which is not delivered as fully translated forms but rather depends upon the test administrator translating words according to the student’s language needs.
When comparing results on the DLM AA-AAS, ELs performed similarly or even slightly better than their non-EL peers, and likely-ELs tended to achieve at lower levels. Adjusting for expressive-communication complexity band, ELs were more likely to achieve at higher levels than non-ELs in ELA and mathematics but not science, and likely-ELs were more likely to achieve at lower levels than non-ELs. This study does not explain the reasons for these differences. It is possible that EL services have prepared students for instruction in English and to be ready to participate in academic assessments administered in English—in other words, to help them be ready to exit EL services (Goldschmidt, 2018). It is also possible that likely-ELs who have instructional goals related to communication spend more instructional time on communication as social interaction across a wide range of contexts and for various purposes (e.g., Snell et al., 2010) and have fewer opportunities to learn the rigorous, grade-level academic content to be tested, unless communication is intentionally addressed within academic instruction (Erickson, Koppenhaver, Yoder, & Nance, 1997).
Limitations
This study intentionally used multiple criteria to cast a wide net to identify students with significant cognitive disabilities who are ELs. We acknowledge the likely-EL category probably includes students who truly belong in both the EL and non-EL categories. This study also relied on data with varying rates of missingness, especially when some states did not require responses to certain survey items. More students had complete survey items (n = 98,937) than completed assessments (n = 89,233); there are a number of reasons students may not have completed assessments (e.g., exit, extended absence), and these students may have differed from the population of students who had complete assessments. Because results from this study are susceptible to subgroup definitions and the accuracy of locally reported data, we encourage states to similarly consider their own available data as one source of information that can guide their criteria for defining students with significant cognitive disabilities who are ELs. State-specific studies using their preferred data sources would likely have fewer missing data. Finally, caution is warranted in overinterpreting inferential data. Findings of statistical significance are likely due to large sample sizes and effect sizes were generally small.
Implications for Research and Practice
The results of this study introduce new directions for research and associated implications for practice. For example, more extensive language surveys are needed to better screen students with significant cognitive disabilities who may be ELs so they can be referred for evaluation. These surveys should include questions that probe language in light of common characteristics of students with significant cognitive disabilities. For example, when students use sign language or AAC devices to communicate, what languages do they use? For students who are still working toward consistent, intentional expressive communication, what language(s) does the family use with the student for receptive communication? When it is not possible to evaluate a student’s English language status because of limited communication, intensive interventions should be prioritized, and their effectiveness evaluated, to remove communication-related barriers to understanding students’ language status. Even if appropriate screening tools are developed, research is needed to understand the processes by which students with significant cognitive disabilities are identified as ELs, including the professionals involved, the evidence used, and the attribution of student characteristics and needs to the student’s disability or language acquisition. This type of research could inform future guidance on effective identification procedures.
Further research is also needed to explore potential reasons for the patterns observed in the use of accessibility supports and academic outcomes. Low rates of use of the language-translation accessibility support, as well as the small number of students in this study identified as non-ELs but reportedly receiving language translation, point to a need for additional research on teachers’ decision-making processes regarding selection of accessibility supports. That research could then inform revisions to the assessment system such as updated guidance on criteria to consider when selecting supports, or training with exemplars on how to implement language translation when the test administrator is not fluent in the student’s primary language. Findings from these studies could also potentially inform the design of new ELP alternate assessments based on alternate ELP standards that are required under ESSA.
Footnotes
Declaration of Conflicting Interests
The author(s) declared no potential conflicts of interest with respect to the research, authorship, and/or publication of this article.
Funding
The author(s) received no financial support for the research, authorship, and/or publication of this article.
Editor-in-Charge: Stacy K. Dymond